manual of blue nile crop assessment
TRANSCRIPT

2008
World vision Northern Sudan –Blue Nile Program Hamid Ali Abdalla Hamid
[ Manual of Evaluation Tools for Crop Harvest Assessment in Blue Nile State]
For Extension officer use

2 | P
B

3 | P
Overview :
THIS MANUAL IT SHOWS YOU HOW TO USE PICTURES TO
ESTIMATES THE AMOUNT OF CROP IN FIELDS AT HARVEST TIME.
When you estimate the amount of crop in the field at harvest time it is called Crop
Assessments. This manual will help you to complete a Rapid crop assessment
for a farm, for a village, for a locality and for a Region.
Whatever the situation, you will need to know:
1. the size or area of the crop and,
2. Crop yield from a known area of land.
Area: farm size may be measured or told to you by the farmer; at the village
Or locality level, crop areas can be estimated by collecting numbers from the
all Farmers and adding them together, or, by taking samples and multiplying
the sample averages by the number of families farming in the village or
locality.
This exercise is usually done by the local authorities. In North Sudan, the
Farmers and aggregating them to locality level, then adding up the counties
for each crop to give an estimate of areas farmed at state level. Finally the
state Data are combined at the national level, for each crop. Where such
information’s not available, methods used to calculate crop area are
different. In deferent area in Sudan areas farmed are currently calculated by
multiplying estimates of numbers of people farming by the areas they have
farmed in the past, adjusted by observed effects during the year.
Crop yield from a known area of land:
To estimate crop yield from a known area, you could harvest the whole field
and weigh the crop or, much easier, you could mark a small area of the field,
harvest and weigh the crop within it. The yield of this smaller sample of the
crop can be estimated.
Usually an area of one square meter (1 m2) is used for the smaller sample
and the crop yield is then recorded as the weight of crop harvested per one
square meter or crop yield (m2).

4 | P
Manual shows you how to harvest a crop from a small Area and estimate
the crop yield.
The crop yield at harvest will change every year and for different parts of
the country or even for different fields. This means that in order to get a
good idea of the crop yield at the field-, farm-, village- and locality- level
you will need to cover large distances and visit many farms in different
places at harvest time.
Manual will give you the confidence to decide for yourself how much
crop will be harvested and you can then compare your estimates with
information given to you by farmers and other agencies and authorities.

5 | P
Steps of crop Assessment
Step one
Is it intercrop or sole crops?
To begin the crop assessment you must first identify which cropping system the farmer is using in the field. If the field has mixture system of plants, are they crops and weeds? Or are they a mixture of crops? Dose
the field has just one crop or are there two or more crops grown together. Crops are sometimes grown together in a mixed stand, known as intercrop, or are
sometimes grown by themselves as sole crops or mono-crops. In the first step, you
will need to decide whether your crop is an intercrop or a sole crop.
Deciding whether the farmer’s crop is a sole crop or an intercrop

6 | P
Step two
Estimating the density of each crop
in an intercrop
To estimate the amount of yield produced from an area of land in an
intercrop you will need to consider each crop separately and estimate
its density. This is because Farmers plant their crops at different
densities in Intercrops compared to sole crops and this needs to be
taken into consideration when estimating crop yield.
Remember, an intercrop is any field that has two or more crops grown
together as a mixture on the same piece of land. Your crop is an intercrop.
Now consider each crop separately and decide which one you will estimate.
Locating the crops ready for harvest in an intercrop:
Look at your intercrop; identify those plants that are crops and those that
are weeds. Disregard the weeds.
Remember, farmers may have planted the crops in an intercrop at different
times and so some of the crops may be immature and not ready for harvest.
For these immature crops there are two options; (I) You can make a note in your field book of the location of the field and which crops are immature so that the field can be revisited later or, (ii) If the crops are close to maturity then you can continue with a crop
assessment and estimate the yield the crop may give when it reaches
maturity.
Estimating the density :
To do this, count the number of plants of each chosen crop in a know area
of the field. Use an area of four square meters (4 m2) which means an area
that is a square in shape with each side measuring two meters in length. As
general guide, one stride of a person of medium height is equal to one meter
(measuring from the back of the foot to the back of the next foot). By using a
7 | P
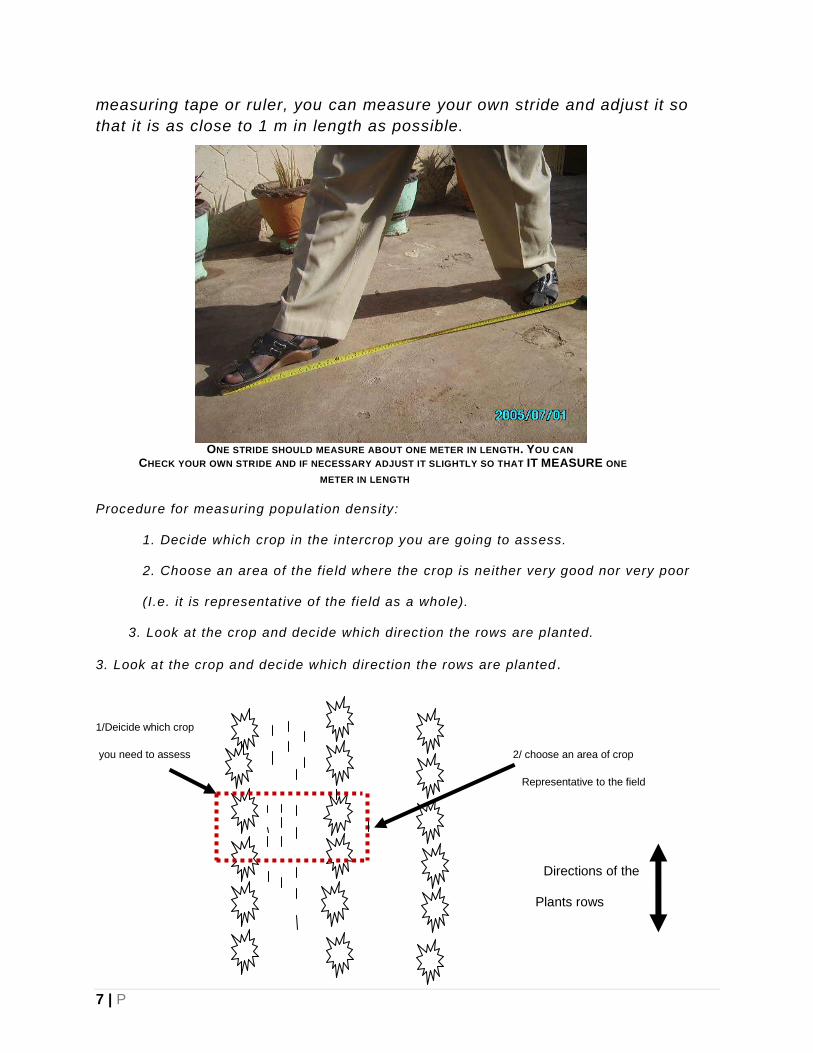
measuring tape or ruler, you can measure your own stride and adjust it so
that it is as close to 1 m in length as possible.
ONE STRIDE SHOULD MEASURE ABOUT ONE METER IN LENGTH. YOU CAN
CHECK YOUR OWN STRIDE AND IF NECESSARY ADJUST IT SLIGHTLY SO THAT IT MEASURE ONE
METER IN LENGTH
Procedure for measuring population density:
1. Decide which crop in the intercrop you are going to assess.
2. Choose an area of the field where the crop is neither very good nor very poor
(I.e. it is representative of the field as a whole).
3. Look at the crop and decide which direction the rows are planted.
3. Look at the crop and decide which direction the rows are planted .
1/Deicide which crop
you need to assess 2/ choose an area of crop
Representative to the field
Directions of the
Plants rows

8 | P
4. Use an object to mark the start of your 2 m length and then take two good Strides
along the row and use another object to mark the end of the 2 m Length.
5. Count the number of plants along this 2 m length (Count 1). Object used to
Mark the 2meter (4) use an object to mark
Length of row 2 meter length of row (use one stride
As measure of 1 meter length)
(5) Count 1: count the numbers of plant
1meter in 2meter length of rows (in this example
Count 1= 8
6. Repeat the process described in 4 but at a 90°angle to the row.
7. Count the number of plants along this 2 m length (Count 2).

9 | P
(6)Repeated the process
But at 90°angle to the
First count
1 meter
(7) Count 1: count the number of plant
Of one crop of 2meter (cross section of
Intercrop (in this example count =3)
8. Calculate the total plant population for a 4 m
2 area by multiplying Count 1 by
Count 2. In the example above:
Total population density of ONE crop in the intercrop
= (Count 1) x (Count 2)
= 8 x 3 = 24
= 24 plants in 4 m2
9. Calculate the total plant population for 1 m2 by dividing the answer above by
4.
Density in 1 m2 = 24/4
= 6 plants m2
10. Record the density of each crop in your notebook (field book) and then continue to
STEP 3

10 | P
Step three
Is it “Good” “medium “or poor”
Crop?
In this step you will decide on the general condition of the crop in the field - is it a
‘good’, ‘medium’ or ‘poor’ crop? To do this you should look only at the first two
photographs in the photographic section with the titles ‘From-a-distance’ and
‘Close-up’. Looking from a-distance you will get an impression of the overall
health of the crop and if parts of the field are different from others. Looking close-
up will help you decide if the crops are really healthy and how many are actually
ready for harvest
Turn to the section in this manual that has the photographs of the particular
crop that you wish to work on. Look at the first page of photographs.
‘From-a-distance’: The first page has three photographs showing a ‘good’
(red background), ‘medium’ (yellow background) and ‘poor’ (blue background)
crop from a distance. If you stand at a distance from the field you can
compare your crop with the crop shown in the photographs. By looking at the
health of the plants you can decide which photograph is most similar toy our
crop.
‘Close-up’: These photographs show a closer view of an area of one square
meter of the crop (1 m2). The photographs show three different fields with a’
good’ (red background), ‘medium’ (yellow background) and ‘poor’ (blue
background) crop. When you look at the photographs in this manual you will
see that words have been placed on the photographs. Read these words
carefully because they will tell you what are the most important parts of the
crop to look at when deciding if the crop is ‘good’, ‘medium’ or ‘poor’. Read
the words which explain what to look for when deciding how healthy and big
the grains are. The photographs and words also explain how to use this
information, to help you decide on a value for crop yield.

11 | P
In the following Examples you will know how to use the photographs on the
‘From-a-distance’ And ‘Close-up’.
First, look at the farmer’s field from a distance and compare it with th e
photographs under ‘From-a-distance’ in the pictorial section of the manual.
(From a distance)
No
Yes
No
Farmer‟s farm
In the above sample, the crop of maize is best describes as a ‘medium crop
the photograph with a yellow background.
12 | P
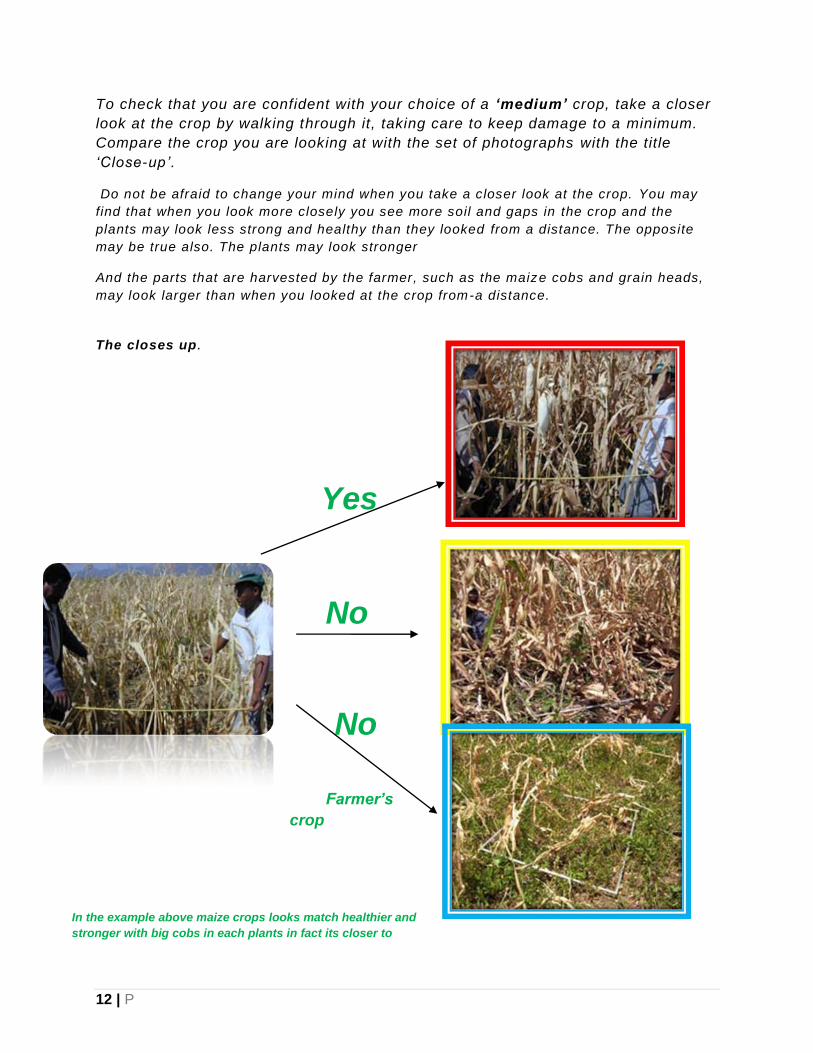
To check that you are confident with your choice of a „medium‟ crop, take a closer
look at the crop by walking through it, taking care to keep damage to a minimum.
Compare the crop you are looking at with the set of photographs with the title
‘Close-up’.
Do not be afraid to change your mind when you take a closer look at the crop. You may
find that when you look more closely you see more soil and gaps in the crop and the
plants may look less strong and healthy than they looked from a distance. The opposite
may be true also. The plants may look stronger
And the parts that are harvested by the farmer, such as the maize cobs and grain heads,
may look larger than when you looked at the crop from-a distance.
The closes up.
Yes
No
No
Farmer‟s
crop
In the example above maize crops looks match healthier and
stronger with big cobs in each plants in fact its closer to
13 | P
RED than the Yellow photograph when looked at closely than when looked at from –a-distance. In this example, a closer look at the maize crop shows that there are fewer gaps in
the crop compared to the ‘close-up’ photograph of the „medium‟ crop. The maize
cobs are also larger and there are more of them than in the photograph of a
„medium‟ crop. The strong plants and large maize cobs suggest that this maize
crop is actually a „good‟ crop (red background) and not a „medium‟ crop (yellow
background), as was first thought when looking at the crop from a distance.

14 | P
Step four
Estimating the value of crop yield
You will estimate crop yield by deciding which photographs of the harvested crop look
most similar to the crop in the field. In some cases, the yield of your crop may not look
exactly the same as the Photographs show for the harvested product. The density may
be higher or the harvested parts may be larger, smaller, greater or fewer in number. If
this is the case, you will have to estimate crop yield by deciding how close the yield of
your crop is to the value given for the most similar photographs in this manual.
In STEP 1 you decided whether your crop is an intercrop or a single crop .In STEP 2 you
observed the plant density of your crop and decided to use 1m x 1m or a 2m x 2m sample
size...In STEP 3 you decided whether your crop is “good”, „medium‟, or „poor‟
Using the first page of photographs, which show the crop in the field? In STEP 4 you will know
place a value on your crop using the second page of photographs, which show the harvested
crop (‘product’ and ‘crop yield’).If, for example, you decided that your field was „medium‟ you
would then look at the photographs of the harvested crop with the yellow background for that
Crop.
Remember, the photographs of the harvested crop (‘product’ and ‘crop
yield’) are different for different crops:
Maize and sorghum:
The photographs show the number and size of maize cobs/sorghum grain heads
harvested from 1 m2 of the crop. A notebook, measuring 21 cm long and 12 cm
wide, and a digging hand hoe are placed in the middle of the photograph so that
you can compare the size of the notebook and hoe with the size of the cobs and
grain heads. Next to each photograph, the value of crop yield is shown in units of
tones per Fadden (t/fd).
Groundnut and Cassava (bur):
The photographs show a close-up of 1 m2 (groundnut) and 4 m2 cassava only). The
harvested parts of each crop -unshelled groundnuts and cassava tubers – are
placed in a pile or heaps so that the quantity produced per unit area of crop can be
compared with the amounts sold in local markets. A digging hoe is placed
alongside the pile for comparison. Next to each photograph, the value of crop yield
is shown in units of t/fd.

15 | P
Range of production: It is unlikely that your crop will look exactly like one in
the photograph. If you crop does not look exactly like the one in the photograph,
pick the one that is closest. The example blow shows you how to estimate the yield
of a maize crop when the crop in the field does not look exactly the same as the
photographs shown in manual photographs .In this example the farmer’s crop has
produced the same number of cobs from one square meter as the 3 t/fd of grain
produced by the crop in the first photograph, but the cobs in the field are bigger.
Therefore the grains yield is higher. The value of crop yield is therefore estimated
higher, at 3.5 t/fd. When the cobs were actually weighed the real value of yield was
found to be 3.4t/fd. You can see that the estimate of 3.5 t/fd using manual
photographs was very close to the true value.
(Number of maize cobs harvested f rom
One square meter of the farmer’s f ield )
(The value of yield is between 3and 4t/ha of grain)
3.00t/fd 4.00t/fd 5.00t/fd 6.00t/fd
Estimating the yield of maize crop where the value of yield between the value
show in manual photograph
.

16 | P
Important Remember:
The same amount of yield may be produced indifferent ways. For example, a farmer may
harvest 2 medium-sized cobs from one square meter of the field with each cob producing
200 g of grain. This would give a yield of 400 g from 1 m2 which is the same as 1.68t/fd
or 4 tons of grain from 1 hectare (2 t/ha). In another field the same farmer may harvest
one large maize cob from one square meter. This large cob produces 200 g of grain. This
would also give a yield of 400 g from 1 m2 or (1.68t/fd)

17 | P
Step five
Accounting for field variability
When you have become confident in using this manual to estimate
crop yield, you can improve your estimates by including in your estimate
how much the field changes or varies from one part to another. Often you
will see parts of the field where the crop has been damaged by too much or
too little water, poor soil, pests or diseases or too many weeds. When this
happens, the crop will be different for different parts of the field and the field
will be Variable.
When the field is variable you will need to decide which parts of the field are’ good‟, ‘medium‟
or ‘poor‟. To keep the calculation simple, divide your field into two, or at most three, different
parts. You can do this with or without a piece of paper. The set of photographs below, taken
from a high area, show sorghum crops growing, typically, look closely at the photos and decide
how many samples you should take to place a value on the average level per feddan.
Photo shown sorghum in Baw locality

18 | P
Whereas aerial views of individual fields are usually not available, you may obtain
the same impression by climbing a tree for a better view or by standing on higher
ground near the crop.
The example given on the next page is a photograph of a field of sorghum (local
verity), taken by Extension officer standing on a hillock at ground level. In the
example, the variable field is divided into two parts. One part is about one -half of
the size of the total field. The second part is also about one-half of the size of the
total field. The sorghum crop in each part of the field is compared to the
photographs on the pages called ‘From-a-distance’ and ‘Close-up’. Following the
instructions for STEP 3, one half of the field is estimated to be a „good‟ crop
(photographs with a red background) the other half of the field is estimated to be
a „medium‟ crop (photographs with a yellow Background).
The value of crop yield for the two parts of the f ield is estimated by following
the instructions described for STEP 4. This gives an estimate of crop yield of
3t/fd for the best part of the field (the „good‟ crop) and 1.0t/fd for the other
part of the field (the „medium‟ crop).
Calculate the Total Crop yield of a variable field. These calculations are for the example described above. The sorghum field was
divided into two parts, one „good‟ and one „medium‟. In this example, each part
was about half of the field. The „good‟ half was estimated to have a yield of3 t/fd.
The „medium‟ half was estimated to have a yield of 1.0 t/fd.
For each part of the variable field:
Crop yield = Estimated crop yield (t/fd) x the size of the part of the field compared to
the total field.
For the example shown above:
Crop yield from the „good‟ part = 3 t/fd x 0.5 = 1.5 t/fd
Crop yield from the „medium‟ part = 1.0 t/fd x 0.5 = 0.5 t/fd.
To calculate the total crop yield for the field you simply add together the crop yield
of each part of the field .
For the example shown above:
Crop yield for the whole field = 1.5 t/fd + 0.5 t/fd
Crop yield for the whole field = 2.0 t/fd
19 | P
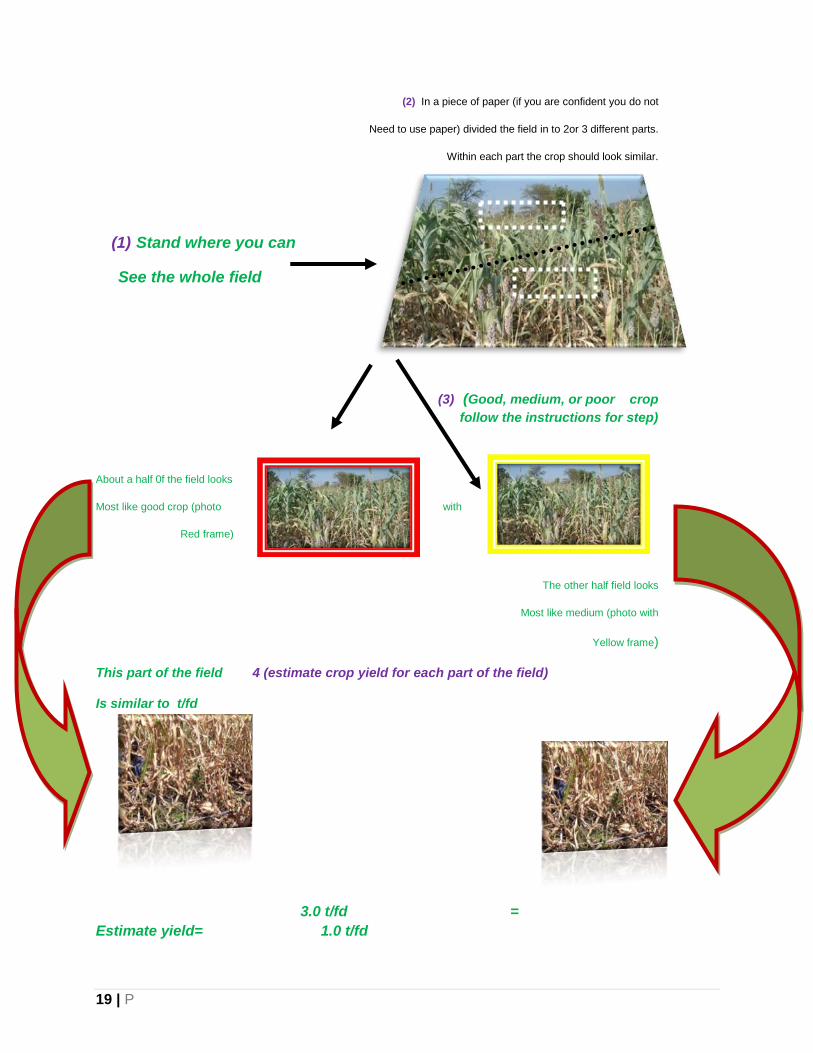
(2) In a piece of paper (if you are confident you do not
Need to use paper) divided the field in to 2or 3 different parts.
Within each part the crop should look similar.
(1) Stand where you can
See the whole field
(3) (Good, medium, or poor crop
follow the instructions for step)
About a half 0f the field looks
Most like good crop (photo with
Red frame)
The other half field looks
Most like medium (photo with
Yellow frame)
This part of the field 4 (estimate crop yield for each part of the field)
Is similar to t/fd
3.0 t/fd =
Estimate yield= 1.0 t/fd

20 | P
Calculate the total crop yield of the variable field
Step six
Deciding when to cross- check you result
To make sure that your estimates of crop yield are Accurate and that
mistakes are not being made, it is Important that you regularly cross-check
your results by following the crop cutting procedure described in STEP 7.
Crop cutting is the methods use it to cross-check or compare your estimates
of Crop yield with the true value. You can get the true value of crop yield by
harvesting small areas of the farmer’s crop and measuring the weight of the
harvested parts when they are dry, or in the case of cassava and groundnut
weighing fresh from the field and then using a conversion factor to convert
the value of the fresh weight to a dry weight. By doing this, you can find out
if your estimates of crop yield using this manual are too large or too small. If
you find that your estimates are often too large, you can make changes to
improve the accuracy of your results. The same is true if you find that your
estimates are often too small. It is very important that you regularly cross-
check your results and it is recommended that you do this in the following
situations.
• When using this manual for the first time.
• When estimating yield for a new crop.
• When estimating crop yield in a new region.
• When estimating crop yield for a different variety of the same crop.
• Finally, at regular intervals even if you are always working on the same
Crop in the same region for a long time because mistakes can be made

21 | P
Step seven
How to cross –check your Result
To cross-check your results you will need to take a crop cutting from a known
area of a field and then measure the weight of the harvested parts. This will
give you the value of crop yield per unit area. In each situation where cross -
checking your data is Recommended, crop cuttings must be taken from a
minimum of three separate fields. The number of samples you take in each
field will depend on how variable the crop is.
1. Choosing the field:
Choose the field where you will carry out your crop assessment. Try to
choose an area where the crop does not change too much. If this is not
possible and the fields are very variable then divide a field into different
parts – as explained in STEP 5.
2. Estimating crop yield:
Estimate crop yield following the instructions given in STEPS 1 to 4 of the
manual.
3. Select the areas of the field for crop cuttings:
For the shorter crops, take along stick, mark one end clearly and ask the
farmer to turn their back to the field and throw the stick over their head into
the crop. Where the stick lands in the crop is where you will position your
square frame or quadrate for the crop cutting. Push the marked end of the
stick upright into the ground. The quadrate should be placed around the stick
with the stick marking the centre of the square frame.
4. Placing the quadrate in the crop: The quadrate is used to mark an area of crop from which plant and headcounts and crop cuttings can be taken. To do this accurately, it is important that only those plants whose stems emerge from the soil within the quadrate are included in the measurements .

22 | P
For shorter crops such as groundnut, it is easiest to place the quadrate on
the ground. Plant should be separated in to those that emerge inside and
outside boundary of the quadrate.
For tall crops such as maize, sorghum and bulrush
millet, hold the quadrate at waist height and Walk through the crop, stopping
frequently to count the plant density throughout the crop .Later, when
weighing the crop sampled, use the average density to adjust the weight of
your sample if the number of plants per square meter in your quadrate
sample is different from the average obtained. In the case of cassava-(sweet
potato)-, because plants are grown at a much wider spacing than the other
crops, a larger area of 4m2 will be required to estimate plant population. It
will be easiest to mark the area in the field by measuring using stride length
as described in STEP 2.

23 | P
5. Counting the number of heads/plants inside the quadrate Counting the number of heads and plants will give you experience in deciding how healthy and strong a crop is. For wheat you need to count the number of heads inside the quadrate. For maize and sorghum you need to count both the number of plants and heads inside the quadrate. For crops such as groundnut and cassava-(sweet potato)- where the harvested parts are belowground, you should count only the number of plants inside the quadrat e (groundnut) or area marked (cassava- sweet potato).When you have finished counting you should record the total count for the quadrate or area marked (cassava) in your field book.
6. Harvesting The amount of plant material that is removed from inside the quadrate or are a marked (cassava) will depend on how a crop is usually harvested. For example, most of the plant is removed for groundnut and cassava. For cassava and groundnut, the tubers and pods are removed by loosening the soil around each plant. In the case of cassava, only one representative plant in the area marked should be dug up for yield assessment. For maize and sorghum it is only necessary to remove the harvested parts – the maize cob and sorghum heads. Take extra care to remove only those plants or parts of plants whose stem emerges from the soil inside the quadrate.
24 | P
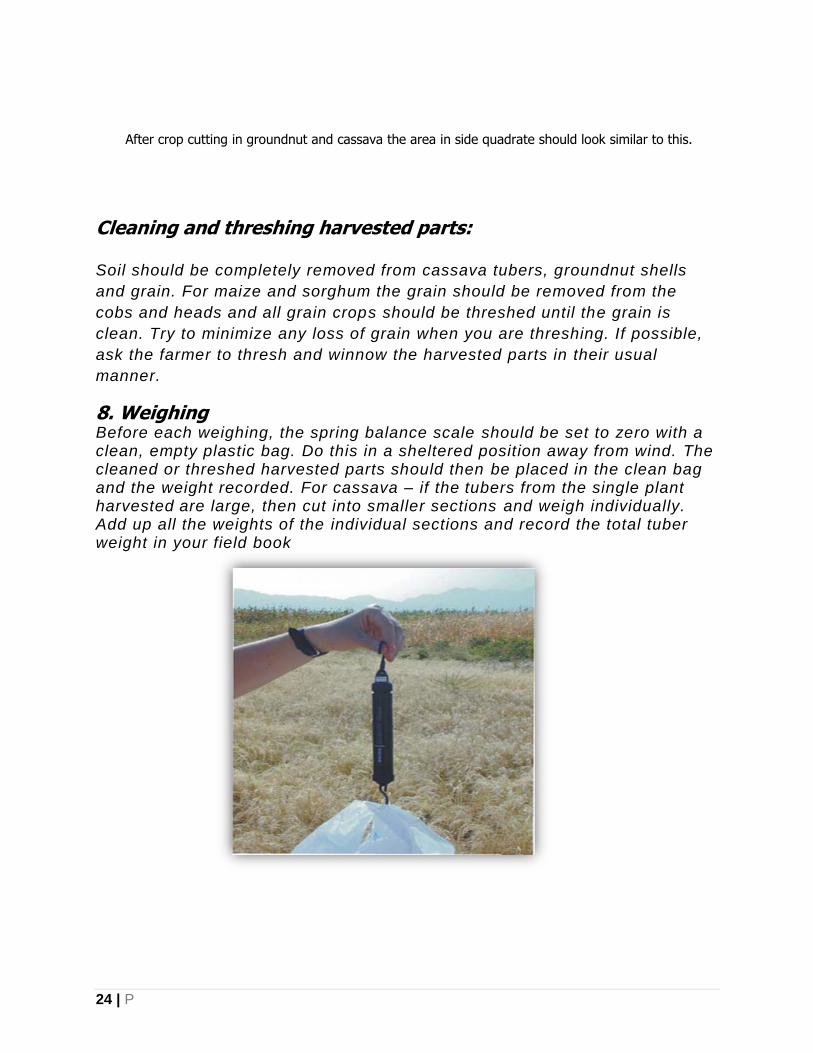
After crop cutting in groundnut and cassava the area in side quadrate should look similar to this.
Cleaning and threshing harvested parts: Soil should be completely removed from cassava tubers, groundnut shells
and grain. For maize and sorghum the grain should be removed from the
cobs and heads and all grain crops should be threshed until the grain is
clean. Try to minimize any loss of grain when you are threshing. If possible,
ask the farmer to thresh and winnow the harvested parts in their usual
manner.
8. Weighing Before each weighing, the spring balance scale should be set to zero with a clean, empty plastic bag. Do this in a sheltered position away from wind. The cleaned or threshed harvested parts should then be placed in the clean bag and the weight recorded. For cassava – if the tubers from the single plant harvested are large, then cut into smaller sections and weigh individually. Add up all the weights of the individual sections and record the total tuber weight in your field book

25 | P
For groundnut, weigh the cleaned unshelled nuts. This will give the fre sh
weight of plants harvested. If the unshelled nuts are very dry and the
groundnuts are the bush type, a conversion factor of 0.75 can be used to
calculate the weight of unshelled nuts as follows: Weight of dry unshelled
nuts x conversion factor = weight of dry shelled nuts
9. Repeating the measurements It is recommended that a minimum of three quadrates are taken for each
field. If the field is very variable, imagine that you divide the field into
separate parts as described before. Take one quadrate from each part of the
field and calculate the total crop yield for the field by following the
instructions given in STEP 4. You should keep the results for each of the
quadrates separate.
Remember: when ever using this manual in a new situation, crop
cuttings should be performed for a minimum of three fields.
10. Drying of grain If the grain of maize, sorghum, is not dry when harvested and threshed, it should be stored in a clearly marked cotton bag within formation on the crop, field, quadrate number, date and the region where the crop was harvested. The grain should be stored in a safe place in the sun or on the roof rack of the vehicle if you are travelling. This allows the contents of the bag to be dried to a constant weight (you will know if the weight is constant because when you weigh it twice – with a break of several hours between measurements - the measured weight will be the same). 11. Recording the results
All weights for each quadrate should be clearly written on a results sheet. An
example of the results sheet and the calculations you need to do, to change
your values of crop yield measured for the quadrate to crop yield for a
feddan of crop.

26 | P
Photo Guide

27 | P
Most importance
It importance to get some minute to read the following words which explains how to check your
results to make sure you are using manual correctly.
In this section of manual you will find photograph of each crop showing what a field look like
with (a good, Medium and poor) which have background (red, yellow and Blue) as they mention
previously.
You will find the photos of the most common crops that planting in Blue Nile state (sorghum,
maize, groundnuts and cassava).
Each crop has 3-4 pages of photos showing in the first pages afield from a distance and close
up and other photo show the products and crop yield at harvest time .
From –a-distance: photos show you the field from a distance giving you an idea of the health of
the crop (stand health) how many plants are in the field and how uniformly they have grown.
Close- up: a close view of the crop showing the number of the plants in an area of one square
meter call it the plant density or crop density, also show how strong the plant are and for crop
with above ground edible parts ,the size, number ,and quality of harvestable parts of the crop
such as maize crop and sorghum grain heads.
The product: those parts of crop that are harvested from sample plant from good ,medium ,
poor fields.
Crop yield: the photos show amount of crop yield from good, medium and poor fields . the crop
yield is harvested from an area of one square meter (1m2)and the weight of the yield is
measured in grammas and shown in tones per feddan (t/fd) –(some times in kg/fd).
In the product and the crop yield, an item such as a digging hoe or notebook measuring 21cm is
placed on the ground next the crop or harvest parts to give you an idea of the size and the
amount of yield.

28 | P
Early sorghum
From a-distance
Close-up
(10
plants/m2) What to look for:
Well-Grown Crop density
Most heads well – formed. few if any, weeds
No diseases. No bird damage.
What look for?
Variable growth Uneven crop. Variable heads. One weeding only. No bird
damage.
5plants/m2

29 | P
Early sorghum
What to look for:
Poor growth. Gaps in crop. Loosely packed heads. Areas not weeded. Some plants may be diseased.
Some plants may have bird damage.
5plants/m2

30 | P
Early sorghum
Grain Product from 1m2
from 1m2
Yield 2.1 T/fd
500g/m2
10 well –filled heads
31 | P
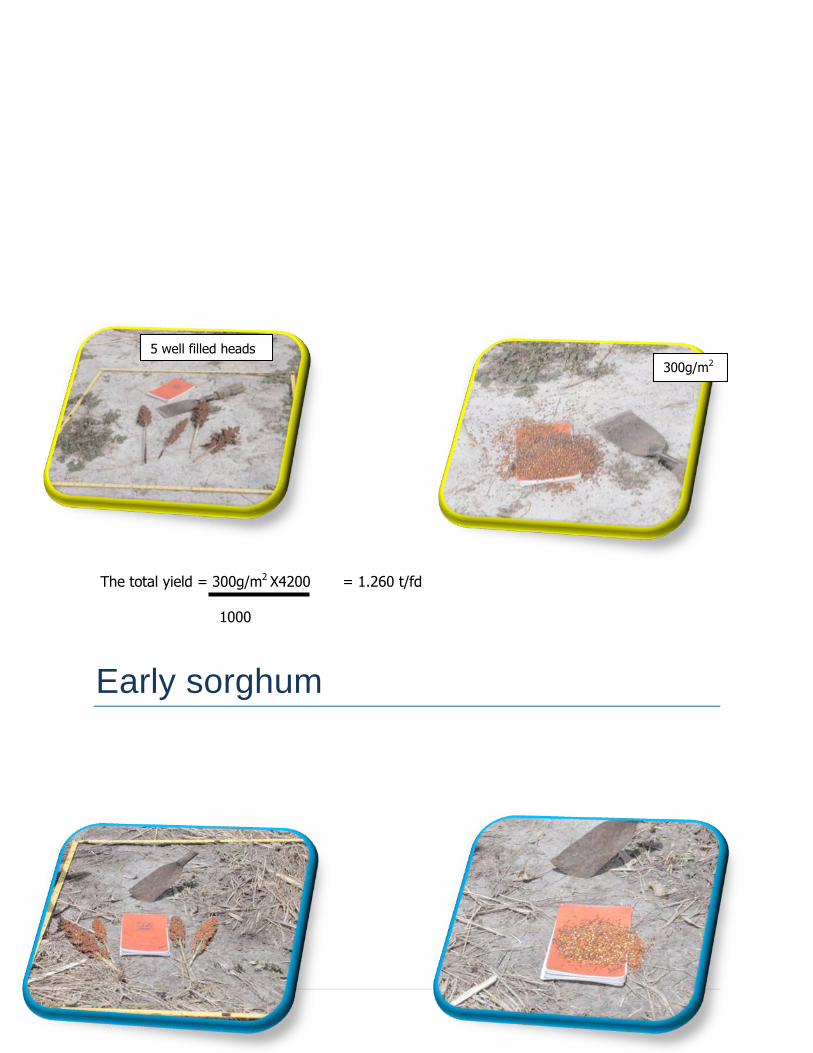
The total yield = 300g/m2 X4200 = 1.260 t/fd 1000
Early sorghum
300g/m2
5 well filled heads

32 | P
The total yield = 160g/m2 X4200 = 0.672 t/fd 1000
Main Sorghum
From -a-distance close –up
160g/m2
5 poorly filed heads
6 plants /m2

33 | P
What to look for:
A/ Well-grown. B/ No disease.
C / Dense, even crop. D/ All heads well- formed.
E/No bird damage.
What to look for:
Variable growth/ uneven crop / some small heads /well weeded / no disease / no bird
damage
Main Sorghum
(Densely packed)/ (thick stems)
Variable size heads
5 plants /m2
Thin stem 3plant /m2

34 | P
(3plants/m2)/ Thin stems/poor seed set
What to look for:
P
oor growth.
L
ow plant density.
S
mall heads
Ar
eas not weeded.
S
ome plant may be diseased.
S
ome plants may have bird damage.
Main Sorghum
Poor seeds set

35 | P
Yield = 2.520T/fd
600g/m2
6 heads
6different –heads size
36 | P
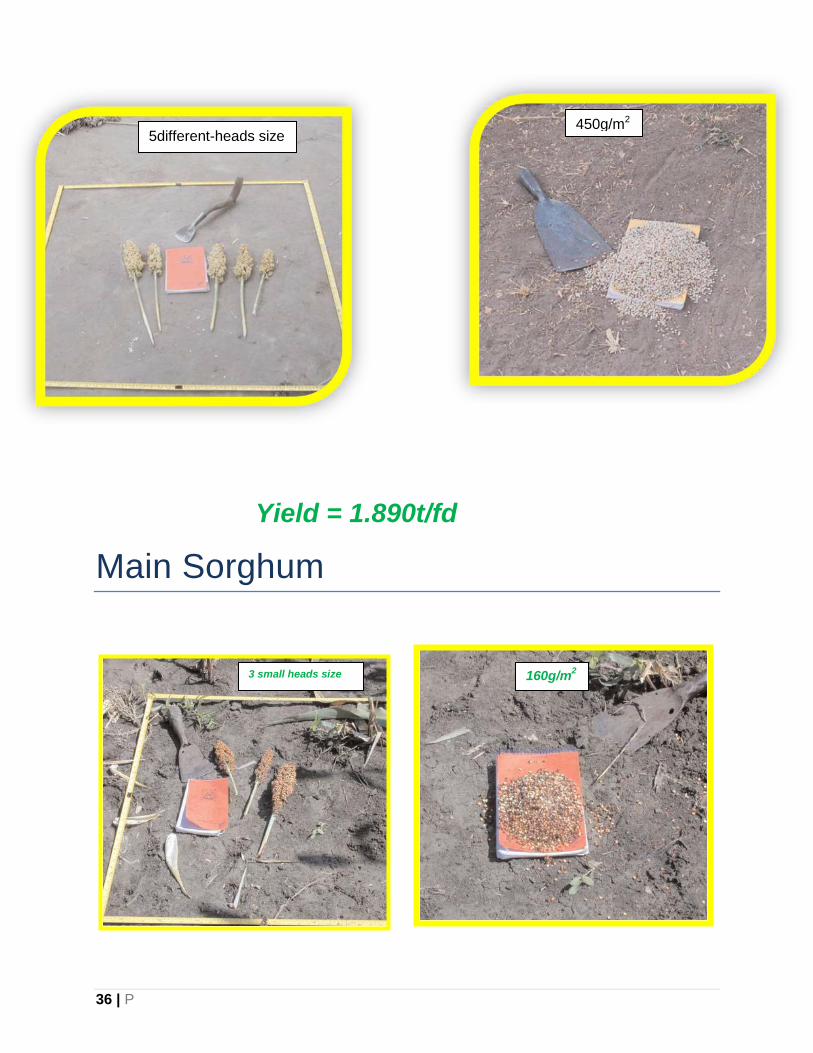
Yield = 1.890t/fd
Main Sorghum
5different-heads size 450g/m2
160g/m2 3 small heads size

37 | P
Yield =0.772 t/fd
Late sorghum
From –a-distance close –up
7 plants/m2

38 | P
What to look for:
A/ Very dry. B/Well grown. C/Dense crop. D/Thin, well formed heads.
E/ Well weeded. F/ No disease. G/ No bird damage.
What to look for:
A/ very dry. B/variable establishment and growth. C/uneven crop. D/ thin heads.
E/ well weeded. F/No diseases. G/ No bird damage.
Late sorghum
4 plant/m2
Less than one plant/m2
39 | P
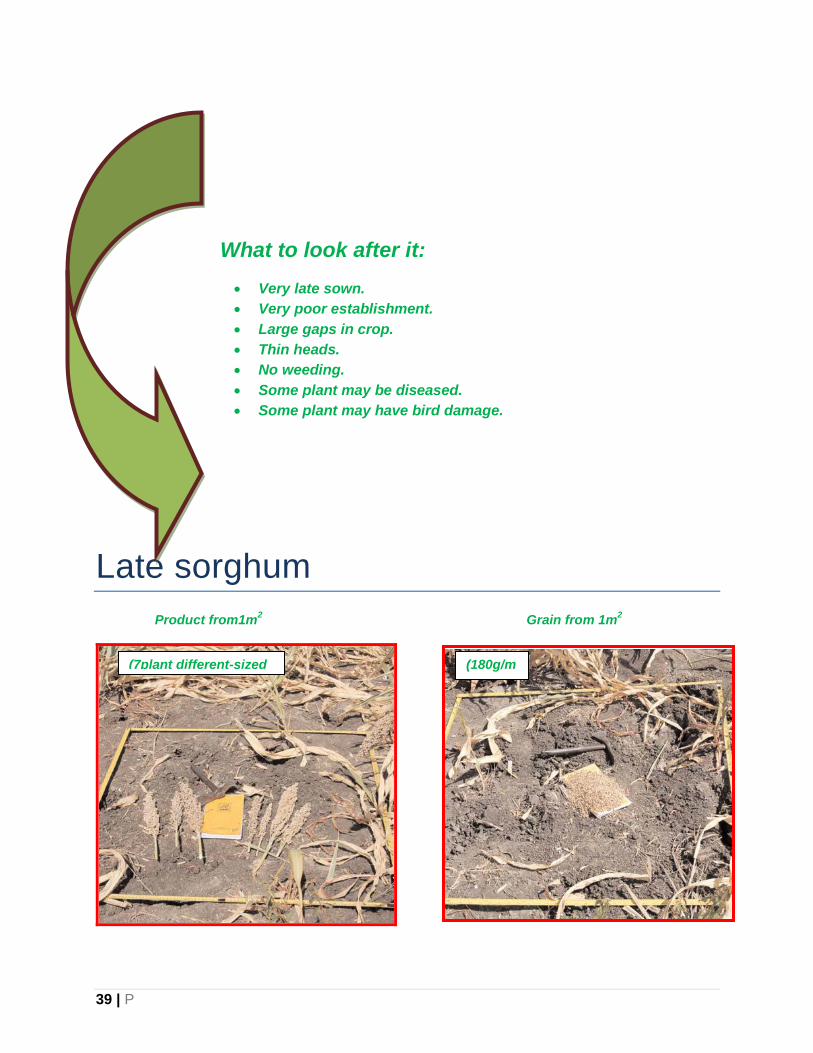
What to look after it:
Very late sown.
Very poor establishment.
Large gaps in crop.
Thin heads.
No weeding.
Some plant may be diseased.
Some plant may have bird damage.
Late sorghum
Product from1m2
Grain from 1m2
(180g/m2)
(7plant different-sized
heads)

40 | P
Yield = 0.756T/fd
Yield= 0.462T/fd
Late sorghum
(4different-sized
heads)
(110g/m2)
((One medium sized head in 4squaremetres)
80g/4m2

41 | P
Yield = 0.84T/fd
Maize
From –a-distance Close –up
(6plant/m2)

42 | P
What to look after it: well grown, dense crop, good color, one weeding only, no
diseases, no bird damage.
What to look after it:
Variable growth, variable establishment, one weeding only, No diseases, No bird damage
Maize
3-4 plants/m2)
(3-4plants/m2)

43 | P
What to look after it:
P
oor growth.
G
aps in crop.
M
any plants with no cops.
Ar
eas not weeded.
S
ome plants may be diseased.
S
ome plants may have bird damage.
44 | P
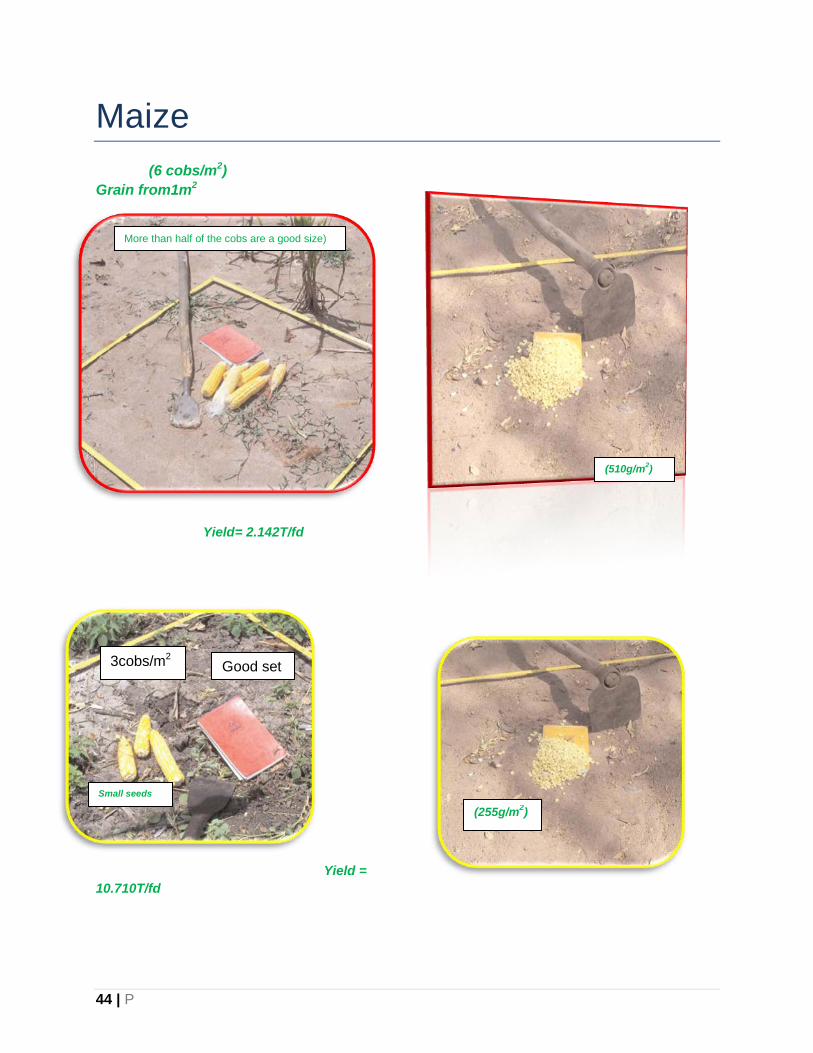
Maize
(6 cobs/m2)
Grain from1m2
Yield= 2.142T/fd
Yield =
10.710T/fd
More than half of the cobs are a good size)
(510g/m2)
Good set 3cobs/m2
(255g/m2)
Small seeds
45 | P
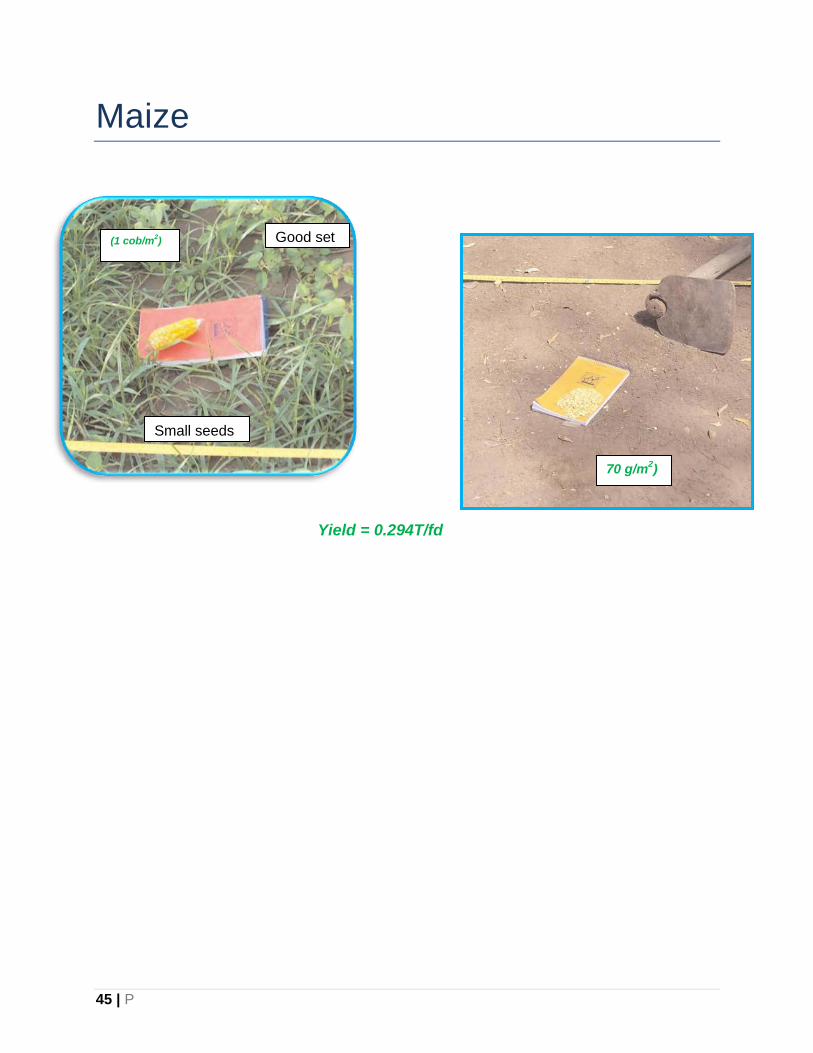
Maize
Yield = 0.294T/fd
70 g/m2)
(1 cob/m2)
Small seeds
Good set

46 | P
Cassava
From –a-distance close -up
What to look after it:
T
hird year harvesting.
2
m centers.
W
ell –grown, even crop.
M
any branches.
Strong stems &leaves
Many weeds Disease free
1 plants/m2
2 m
Strong even stemes
47 | P
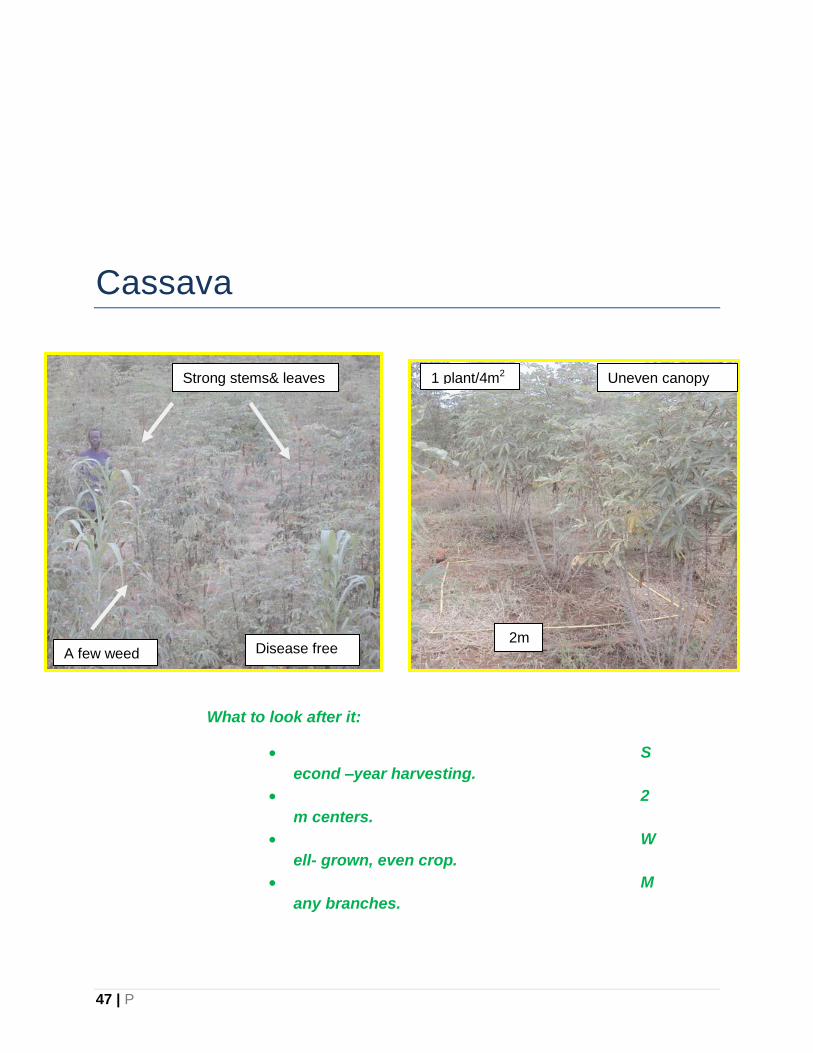
Cassava
What to look after it:
S
econd –year harvesting.
2
m centers.
W
ell- grown, even crop.
M
any branches.
Strong stems& leaves
Disease free A few weed 2m
1 plant/4m2 Uneven canopy

48 | P
Cassava
What to look after it:
S
econd year harvesting.
1
m centers
P
oor growth.
Many weeds Weak stems&
Very few leaves
Many weeds 1 plant/m2
1m

49 | P
P
oor establishment.
V
ery few branches.
Cassava
Product of single plant yield of single plant
12kg/4m2 Well formed & large tubers
50 | P
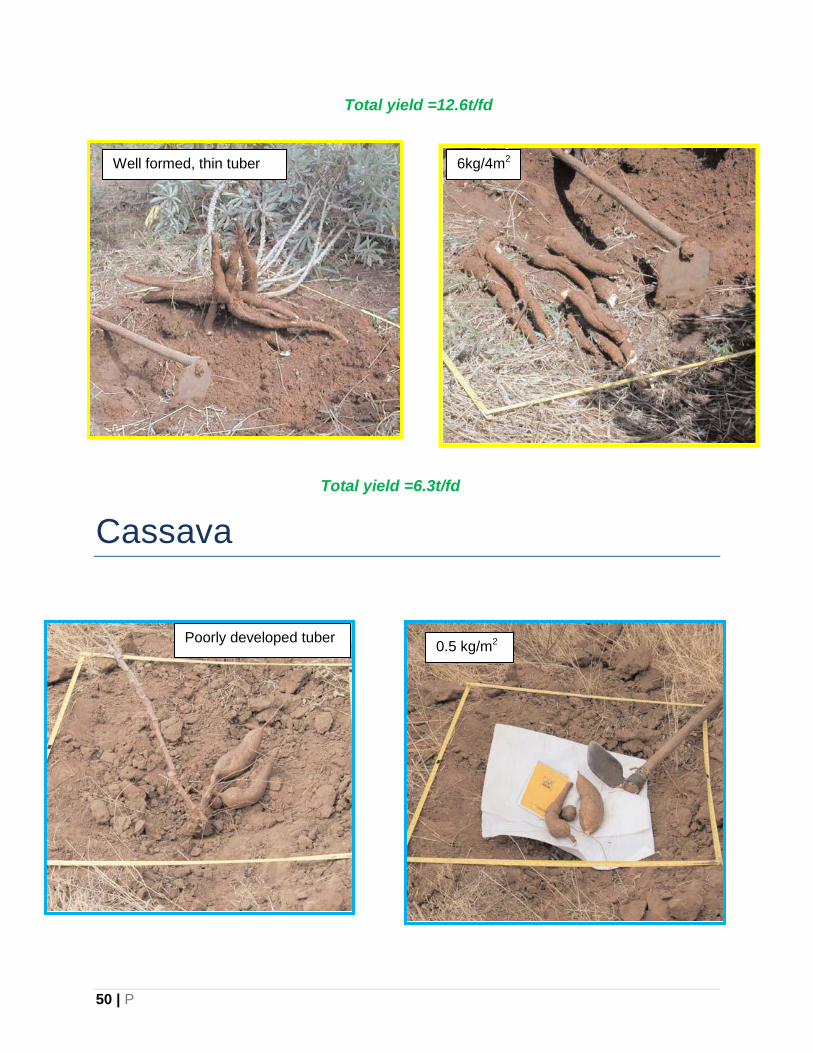
Total yield =12.6t/fd
Total yield =6.3t/fd
Cassava
6kg/4m2 Well formed, thin tuber
0.5 kg/m2 Poorly developed tuber

51 | P
Total yield =2t/fd
Groundnut
From –a-distance Close-up
10-15 plants/m2
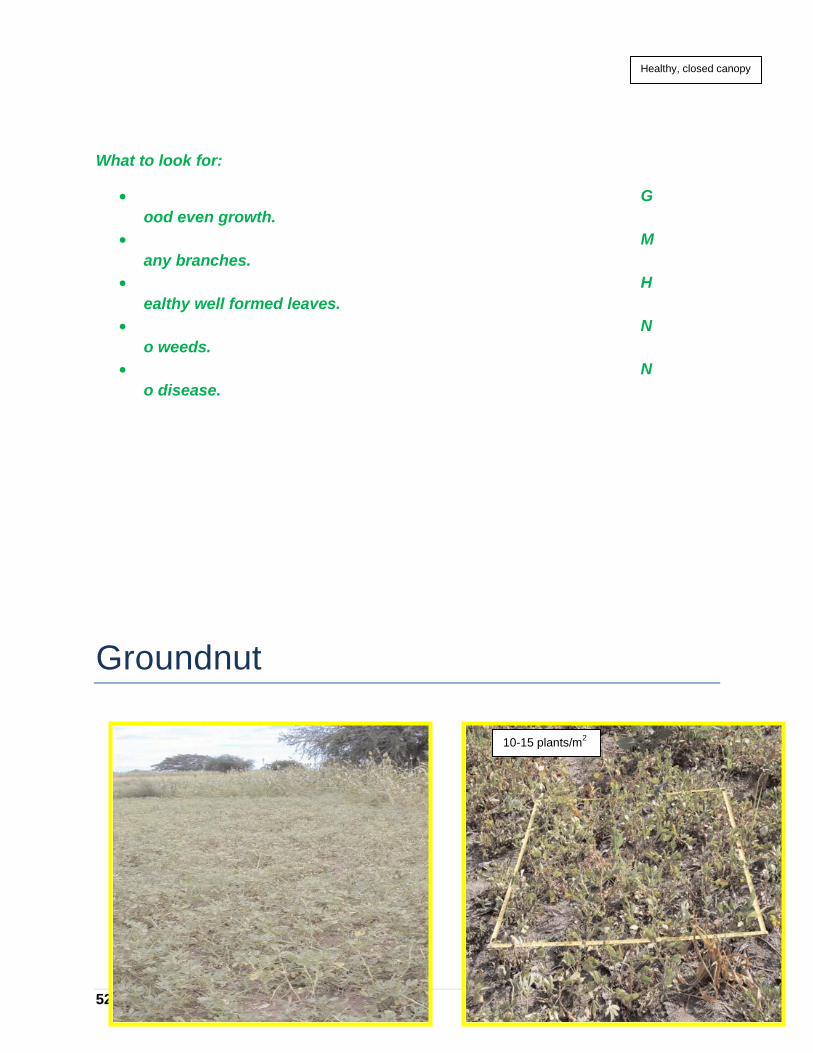
52 | P
What to look for:
G
ood even growth.
M
any branches.
H
ealthy well formed leaves.
N
o weeds.
N
o disease.
Groundnut
Healthy, closed canopy
10-15 plants/m2

53 | P
What to look for: variable establishment, few branches, some yellow leaves,
some weeds, diseases leaves.
What to look for :poor establishment, very small branches, few or no branches,
almost no pegs, diseases leaves.
Groundnut
Product from 1m2 unshelled pods
Uneven canopy
5-15 plants/m2
No canopy
200g/m2
Many pegs with well developed pods
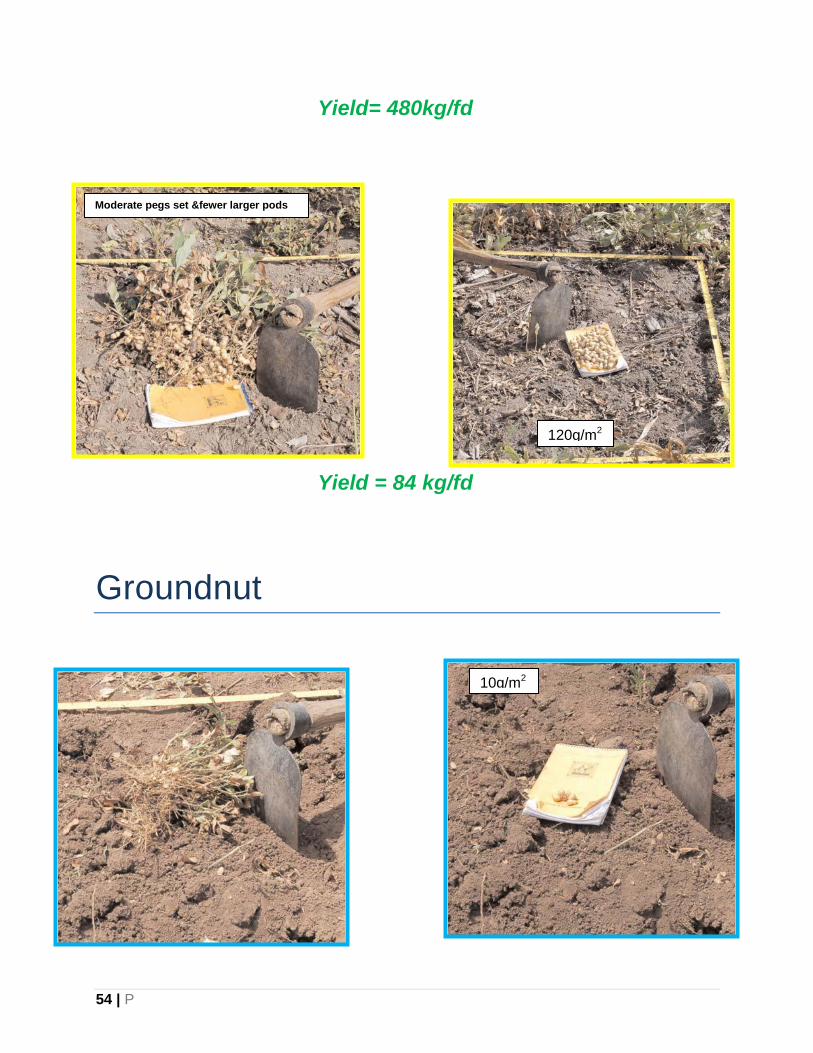
54 | P
Yield= 480kg/fd
Yield = 84 kg/fd
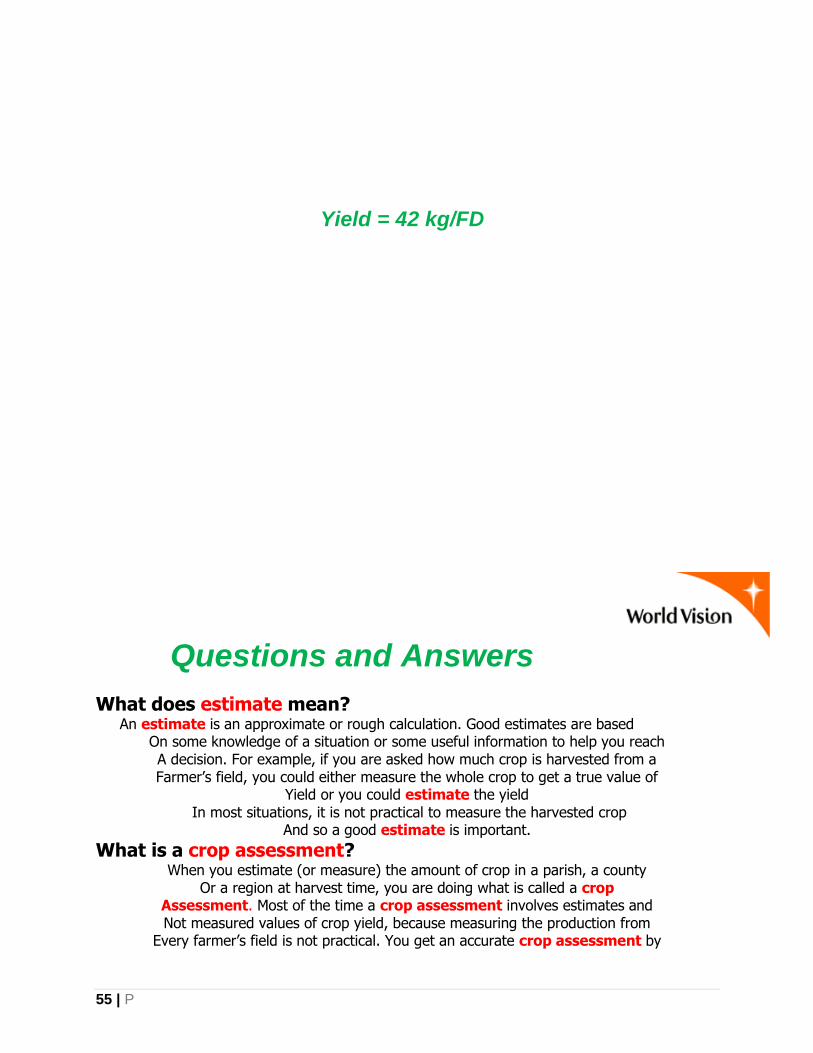
Groundnut
10g/m2
120g/m2
Moderate pegs set &fewer larger pods
55 | P
Yield = 42 kg/FD
Questions and Answers
What does estimate mean? An estimate is an approximate or rough calculation. Good estimates are based
On some knowledge of a situation or some useful information to help you reach A decision. For example, if you are asked how much crop is harvested from a Farmer’s field, you could either measure the whole crop to get a true value of
Yield or you could estimate the yield In most situations, it is not practical to measure the harvested crop
And so a good estimate is important.
What is a crop assessment? When you estimate (or measure) the amount of crop in a parish, a county
Or a region at harvest time, you are doing what is called a crop Assessment. Most of the time a crop assessment involves estimates and Not measured values of crop yield, because measuring the production from
Every farmer’s field is not practical. You get an accurate crop assessment by
Few pegs& few small pods
56 | P
Multiplying estimates of crop yield per unit area (feddan or hectare) by the
Number of units in your area of interest.
What is crop yield (or yield per area)? The yield of a crop is the weight of that part of the crop that can be eaten and Is harvested by the farmer (for example, maize grain and groundnut pods). The Yield per unit area is the weight of the harvested parts produced from a known
Area of land (feddan or hectare). For example, you can say that the farmer’s
Field produced 1000 kilograms per fadden (1000 kg/fd) or one tone per fadden (1 t/fd).
These are commons units of yield: kilograms per fadden (kg/fd, kg fd-2);
Tons per fadden (t/fd, t fd-2); Quintals per fadden (qt/fd,qt fd-2);
Grams per squ, meter (g/sq.m or gm-2). If you are measuring the weight of your crop from one square meter (1 m2) You would weigh your crop in grams (g). So if you weigh your crop from one Square meter, and its weighs 400 grams (400 g), you can say your yield is
400 grams per square meter (400 g/sq. m or g m-2). If you are talking about The yield from a whole field you would use kilos, quintals or tons per fadden
(Kg /fd or kg fd-2; qt/fd or qt fd-2; t/fd or t fd-2).
Remember: One tone (t) is the same as 1000 kilos (kg). One quintal (qt) is the same as 100 kilos (kg).
One kilogram (kg) is the same as 1000 grams (g).
What is stand health? By stand health we mean the health of the whole crop in the field. If you
Are looking at a stand of maize and the plants look weak and are not Straight and strong, the stand would be in poor health. If the plants are
Strong and tall then you have healthy plants.
What is plant density (or crop density)? By plant (or crop) density we mean the number of plants in a known area
Of land. In plant density often refers to the Number of plants inside the square frame (or quadrate) whose sides’ measure
One meter in length (that is, the number of plants per 1m2). If you have A Crop with many plants inside the square meter then the plant density is high.
You can also say it is a very dense crop. If you have few plants inside your Square meter then the plant density is low. You can also say it is not a
Dense crop or it is a thin crop. Some fields have mixed stands, some areas May have a high density and others may have a low density. You will have
To estimate the proportions of each high area and each low area to arrive at The average plant density of the field.
What is one square meter? A square meter is a measurement of area and is often used as a unit of area in Which to count the number of plants or weigh the harvest. You will be working with a square frame (a quadrate) and each of the four sides will be one meter. The area inside your square frame when you put it on the ground is one square
Meter (1m x 1m = 1 m2). If you have a small plot of land, and you can cover it four times with the square Frame, your land will measure four square meters (4 m2) this will be equivalent

57 | P
To a square with sides 2m long (2m x 2m= 4m2) If you have a bigger field and you can cover the field with your frame 100
Times, then your field is 100 square meters (100 m2 =10m x 10m)
What is one fadden? One fadden (fd) is another measurement of area 4200 times larger
Than 1m2. It is equivalent to an area 70m x60m (4,200m2). It is the most Used international measure of land area; and used most often for the value
Of crop yields (for example, tons per fadden , t/fd or t fd-2). In Sudan,
Historically, the most commonly used measure of land is the feddan. Also there is Another measure of land use in Sudan (hectore) and one hectore are approximately
2.4 feddans
What is a tone per feddan? A tone per feddan is a measure of the weight of crop harvested (one
Tone) from an area of one feddan).
If you have one tons per feddan (1 t/fd) it means that a field which Measures one feddan produced 1 tons or 1000 kilos of crop.
If a field which measures one feddan produced 2000 kilos, you would say that The crop quantity was two tones per feddan (2 t/fd).
When you weigh your crop from one square meter, you will obtain the yield in Grams per square meter (g/m2). Normally you do not give the yield from a Field in g/m-2, because the area is so small, instead you would convert your
Measures to tones per feddan (t/fd). What does cross-check mean?
When you cross-check your data it means that you compare your estimate Of crop yield with a measured value of crop yield to make sure that your
Estimates are good and accurate.
What is a quadrate? A quadrate is a square frame which can be made of most materials such as
Wood, plastic or wire. A quadrate is used to mark an area of land from Where you will take your crop cuttings or counts. The quadrate you will use
Will usually measure one meter (1 m) each side, and therefore the size of The land inside the quadrate will measure one square meter (1 m2).
What is a spring balance scale?
The spring balance is a simple weighing instrument It is used to measure the weight of small
Quantities of crop. You need to have something to hold the crop, in this case A clean plastic bag. The plastic bag has a weight, so in order to measure the Weight of the crop you first need to set the spring balance to zero with the Empty plastic bag attached. This is known as calibrating the spring balance
Or setting to zero.
What does drying to a constant weight mean?
When the sampled crop is not fully dry, you must dry it in the sun to obtain

58 | P
An estimate of the weight of the mature crop. It may take a long time to Bring down the water content to the usual level at harvest time which is Usually lower than 15%, dry matter (DM) being greater than 85%. After Drying for several hours, weigh the crop on the spring balance and dry Again. You will know when the harvested parts are fully dry when the
Measurement you take is the same as the one before. When two Consecutive measurements are the same, the sample is said to be dried to a Constant weight and is, for purposes of crop assessment, completely dry.
Example To convert the weight of your grain sample harvested from one Square meter (m2) to yield in tones per fadden (t/fd) divide the
Weight in grams by 100. Calculation explained:
•To scale up from one square meter to one feddan multiple your Sample weight by 4200.
•To convert your sample weight from grams (g) to tones (t) divide By 1 000 000: 1000 g = 1 kg 1000 kg = 1 t
• Example: if the grain harvested from one square meter weighs
250 g, then to convert to tones per feddan:
250g/m 2 × 4200(to convert to feddan) =1,050t/fd 1000 × 1000(to convert to tones per feddan)
For quintals per feddan simply divide the sample weight (g) from one Square meter by 10.

59 | P

60 | P

61 | P