manual for the use of the cognitive emotion regulation ... · manual for the use of the cognitive...
TRANSCRIPT

Manual for the use of the
Cognitive Emotion Regulation Questionnaire
A questionnaire measuring cognitive copingstrategies
Nadia Garnefski
Vivian Kraaij
Philip Spinhoven

© Copyright 2002 N.Garnefski, V.Kraaij, P.Spinhoven and DATEC (Leiderdorp, The Netherlands)
All rights reserved. No part of this publication may be reproduced, stored in a retrieval system, ortransmitted, in any form or by any means, electronic, mechanical, photocopying, recording orotherwise, without the prior written permission of the publisher.

Manual for the use of the
Cognitive Emotion Regulation Questionnaire
A questionnaire measuring cognitive copingstrategies
Nadia Garnefski
Vivian Kraaij
Philip Spinhoven

1
Preface
This manual has been brought about as a result of a generally prevailing need for a questionnairethat would be able to measure people's cognitive coping strategies separately from the behaviouralaspects of coping. The CERQ and its corresponding manual are the result of a project which havingstarted some three years ago will also require our attention in the years to come. Without theeffort of many others we would certainly not have succeeded in developing this questionnaire,producing the manual and obtaining norm tables. Therefore, we wish to thank everyone whodirectly or indirectly took part in bringing about this manual, especially all students who assistedand thought along with us while collecting our data, the Koning Willem I College in Den Bosch andall other schools that participated in our study, the Rijngeest Group in Leiden (formerly: JelgersmaPoliclinic), the Delft general practitioners' practice, as well as all secondary school students andothers who on a voluntary basis participated in our study and completed our questionnaire.
In the years to come we will continue our validity research. We therefore ask those who will usethis instrument in the future, to inform us of the results obtained and their (positive and negative)experiences with this questionnaire. We will be grateful for any comments and suggestions.∗
Nadia GarnefskiVivian Kraaij
Philip Spinhoven
∗ Leiden UniversityDivision of Clinical and Health PsychologyP.O. Box 9555, 2300 RB LeidenE-mail: [email protected]

2

3
Contents
Preface..................................................................................................... 1
Chapter 1: Introduction................................................................................. 5Background....................................................................................... 5
Chapter 2: Description of the CERQ.................................................................. 7Meaning of the CERQ scales.................................................................... 7Description of the CERQ items................................................................. 8Administering the CERQ........................................................................ 9Instructions for completing the CERQ....................................................... 9Scoring the CERQ................................................................................ 10Using the CERQ in different populations..................................................... 10Using the CERQ for diagnostic purposes...................................................... 10Using the CERQ for scientific purposes....................................................... 11
Chapter 3: Description of the norm groups......................................................... 13
Chapter 4: Psychometric Properties of the CERQ................................................. 15Dimensional structure of the CERQ........................................................... 15Internal consistency: Cronbach's alpha....................................................... 17Item-rest correlations........................................................................... 17Stability (test-retest reliabilities)............................................................ 19Correlations between the CERQ scales....................................................... 20Factorial validity................................................................................ 20Discriminative properties...................................................................... 22Construct validity............................................................................... 22
Chapter 5: Standardization of the CERQ............................................................ 29Interpreting the CERQ scale scores........................................................... 29Group differences: means and standard deviations of the norm groups............... 29Standardization.................................................................................. 30Norm tables....................................................................................... 30Instruction for use of the norm tables....................................................... 31Interpretation of scores on the CERQ scales................................................ 32
References................................................................................................. 35
APPENDIX: CERQ Norm Tables......................................................................... 37

4

5
Chapter1Introduction
The CERQ (Cognitive Emotion Regulation Questionnaire) is a multidimensional questionnaireconstructed in order to identify the cognitive coping strategies someone uses after havingexperienced negative events or situations. Contrary to other coping questionnaires that do notexplicitly differentiate between an individual's thoughts and his or her actual actions, the presentquestionnaire refers exclusively to an individual's thoughts after having experienced a negativeevent. The CERQ is a very easy to administer, self-report questionnaire consisting of 36 items. Thequestionnaire has been constructed both on a theoretical and empirical basis and measures ninedifferent cognitive coping strategies. The CERQ makes it possible to identify individual cognitivecoping strategies and compare them to norm scores from various population groups. In addition, thequestionnaire offers the opportunity to investigate relationships between the use of specificcognitive coping strategies, other personality variables, psychopathology and other problems.The CERQ can be administered in normal populations and clinical populations, both with adults andadolescents aged 12 years and over. The CERQ can be used to measure someone's general cognitivestyle as well as someone's cognitive strategy after having experienced a specific event. Thequestionnaire has a Dutch and an English version.
Background
The regulation of emotions through cognitions is inextricably associated with human life. Cognitionsor cognitive processes help people regulate their emotions or feelings and not get overwhelmed bythe intensity of these emotions, for example during or after experiencing a negative or stressful lifeevent. Cognitive processes can be divided into unconscious (e.g. projection or denial) and consciouscognitive processes, such as self-blame, other-blame, rumination and catastrophizing. The CERQfocuses on the latter category, i.e. the self-regulating, conscious cognitive components of emotionregulation. Although not many studies have explicitly addressed the cognitive side of emotionregulation, within general coping research some attention has been given to these strategies.
A generally accepted definition of coping is given by Monat & Lazarus (1991, p.5) as “an individual'sefforts to master demands (conditions of harm, threat or challenge) that are appraised (orperceived) as exceeding or taxing his or her resources”. It is common use to distinguish two majorfunctions of coping: 1) problem-focused coping, which comprises all coping strategies directlyaddressing the stressor; and 2) emotion-focused coping, which includes the coping strategies aimedat regulating the emotions associated with the stressor (Compas, Orosan & Grant, 1993). In general,problem-focused coping strategies are considered to be more functional than emotion-focusedcoping strategies (Thoits, 1995).Although the above division of coping strategies refers to a generally accepted and much useddivision and many coping instruments are based on it, it gives rise to a major conceptual problem,i.e. that the division into problem-focused and emotion-focused coping is not the only dimension bywhich coping strategies can be classified.

6
In fact, there is another major dimension that goes right across the boundaries of this division,namely the cognitive (what you think) versus the behavioural (what you do) dimension (see alsoHolahan, Moss & Schaeffer, 1996). An example of cognitive problem-oriented coping is 'makingplans'; an example of behavioural problem-oriented coping is 'taking immediate action'. Although'making plans' (thinking about what you will do) and 'taking action' (actually acting) clearly refer todifferent processes that are used at different moments in time, and 'making plans' does not alwaysmean that they will actually be carried out, generally speaking they are categorized under one andthe same dimension. As for the existing coping instruments it therefore applies that most copingscales are composed of a mixture of cognitive and behavioural coping strategies, until now it hasnot been possible to measure cognitive coping strategies separately from the behavioural copingstrategies. Although in the past few decades the relationship between the various coping strategiesand psychopathology has clearly been established (for reviews, see: Compas, Connor-Smith,Saltzman, Harding Thomsen & Wadsworth, 2001; Endler & Parker, 1990; Thoits, 1995), it has hardlyresulted in insight into the extent to which certain influences could be specifically attributed to thecognitive aspects of coping. Although considerable attention has been given to cognitive processesas regulating mechanisms for certain developmental processes, as yet we do not know much of thedegree to which cognitive coping strategies regulate emotions and how it influences the course ofemotional processing after having experienced negative life events.The CERQ has been developed in order to fill in this gap. The CERQ therefore measures 'cognitive'coping strategies exclusively, separate from the 'behavioural' coping strategies.

7
Chapter 2Description of the CERQ
The CERQ is a self-report questionnaire measuring cognitive coping strategies of adults andadolescents aged 12 years and more. In other words, with the help of this questionnaire it can beassessed what people think after having experienced a negative or traumatic event.Cognitive coping strategies are defined here as strategies for cognitive emotion regulation, that is,regulating in a cognitive way the emotional responses to events causing the individual emotionalaggravation (Thompson, 1991).Cognitive coping strategies are assumed to refer essentially to rather stable styles of dealing withnegative life events, however not to such an extent that they can be compared to personalitytraits. It is assumed that in certain situations people may use specific cognitive strategies, whichmay divert from the strategies they would use in other situations. It may also be assumed thatpotentially cognitive coping strategies can be influenced, changed, learned or unlearned, forexample through psychotherapy, intervention programmes or one’s own experiences.
Meaning of the CERQ scales
The CERQ distinguishes nine different cognitive coping strategies, of which, independently fromone another, clinical psychological literature has established their association withpsychopathology. These are:1. Self-blame, referring to thoughts of blaming yourself for what you have experienced (Anderson,
Miller, Riger & Sedikides, 1994);2. Acceptance, referring to thoughts of resigning to what has happened (Carver, Scheier &
Weintraub, 1989);3. Rumination, referring to thinking all the time about the feelings and thoughts associated with
the negative event (Nolen-Hoeksema, Parker & Larson,1994);4. Positive Refocusing, which refers to thinking of other, pleasant matters instead of the actual
event (Endler & Parker, 1990);5. Refocus on Planning, or thinking about what steps to take in order to deal with the event
(Carver, et al., 1989; Folkman & Lazarus, 1989);6. Positive Reappraisal, or thinking of attaching a positive meaning to the event in terms of
personal growth (Carver, et al, 1989; Spirito, Stark & Williams, 1988);7. Putting into Perspective or thoughts of playing down the seriousness of the event when
compared to other events (Allan & Gilbert, 1995);8. Catastrophizing, referring to explicitly emphasizing the terror of the experience (Sullivan,
Bishop and Pivik, 1995); and9. Other-blame, referring to thoughts of putting the blame for what you have experienced on
others (Tennen & Affleck, 1990).
8
Description of the CERQ items
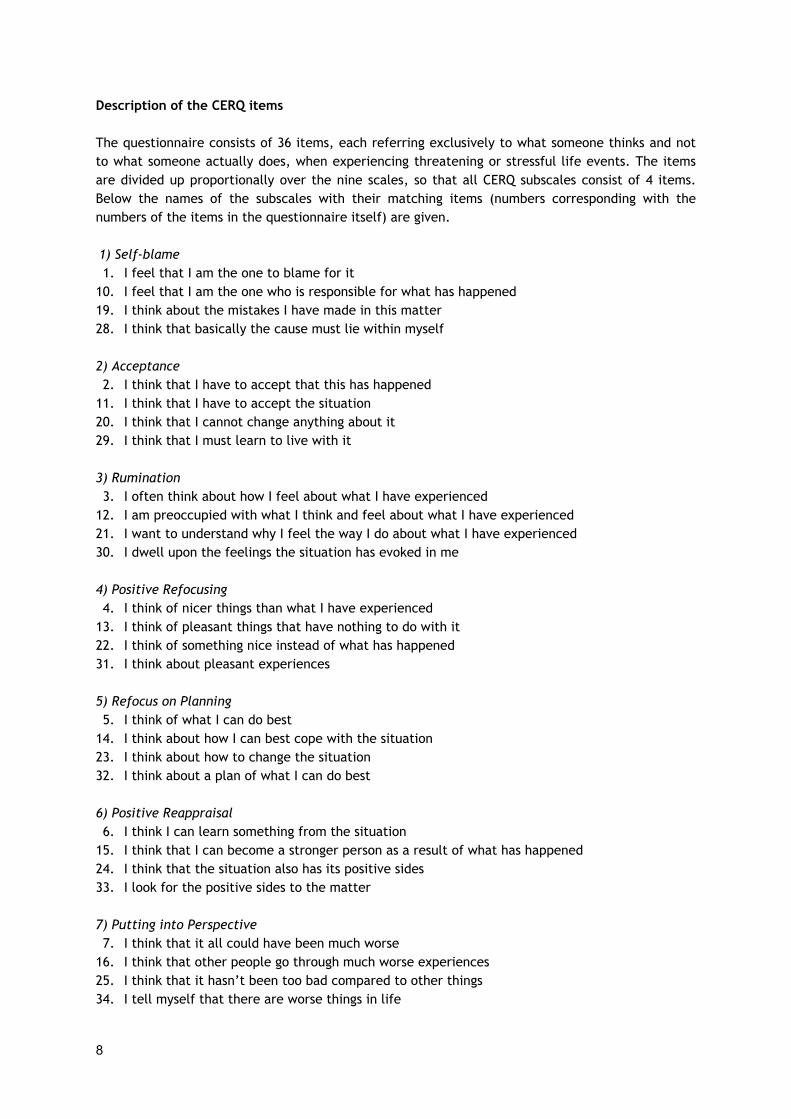
The questionnaire consists of 36 items, each referring exclusively to what someone thinks and notto what someone actually does, when experiencing threatening or stressful life events. The itemsare divided up proportionally over the nine scales, so that all CERQ subscales consist of 4 items.Below the names of the subscales with their matching items (numbers corresponding with thenumbers of the items in the questionnaire itself) are given.
1) Self-blame1. I feel that I am the one to blame for it
10. I feel that I am the one who is responsible for what has happened19. I think about the mistakes I have made in this matter28. I think that basically the cause must lie within myself
2) Acceptance2. I think that I have to accept that this has happened
11. I think that I have to accept the situation20. I think that I cannot change anything about it29. I think that I must learn to live with it
3) Rumination3. I often think about how I feel about what I have experienced
12. I am preoccupied with what I think and feel about what I have experienced21. I want to understand why I feel the way I do about what I have experienced30. I dwell upon the feelings the situation has evoked in me
4) Positive Refocusing4. I think of nicer things than what I have experienced
13. I think of pleasant things that have nothing to do with it22. I think of something nice instead of what has happened31. I think about pleasant experiences
5) Refocus on Planning5. I think of what I can do best
14. I think about how I can best cope with the situation23. I think about how to change the situation32. I think about a plan of what I can do best
6) Positive Reappraisal6. I think I can learn something from the situation
15. I think that I can become a stronger person as a result of what has happened24. I think that the situation also has its positive sides33. I look for the positive sides to the matter
7) Putting into Perspective7. I think that it all could have been much worse
16. I think that other people go through much worse experiences25. I think that it hasn’t been too bad compared to other things34. I tell myself that there are worse things in life
9
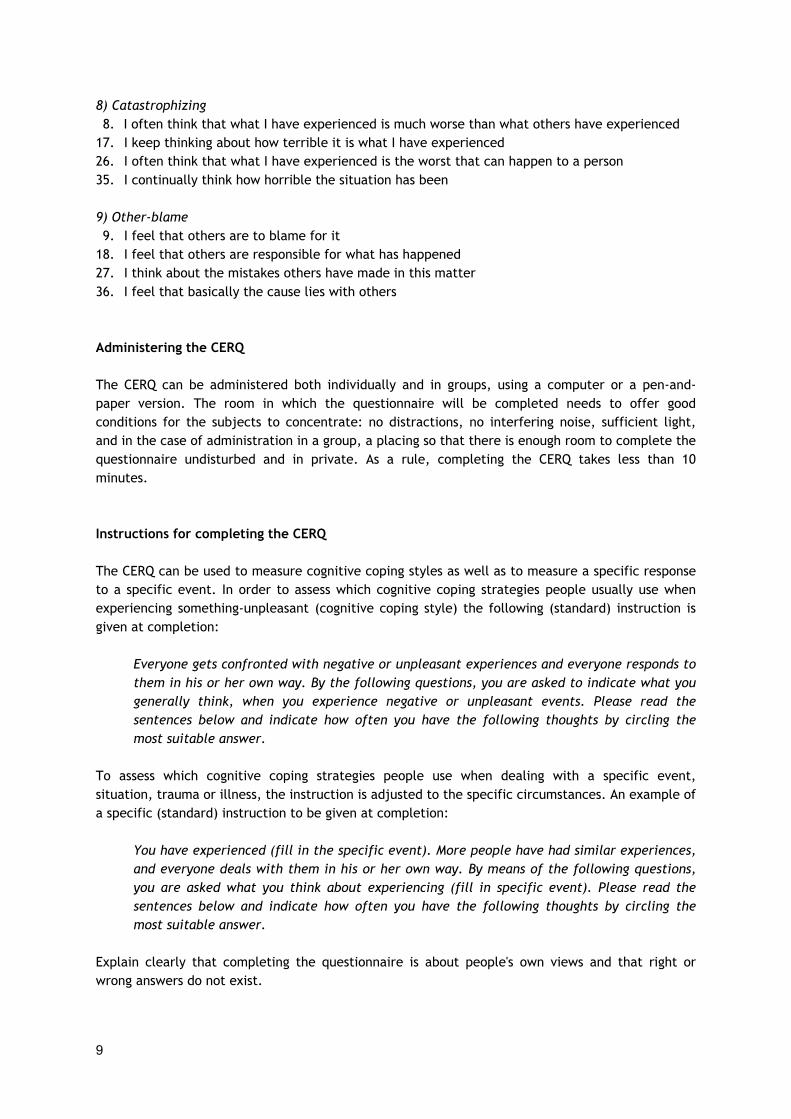
8) Catastrophizing8. I often think that what I have experienced is much worse than what others have experienced
17. I keep thinking about how terrible it is what I have experienced26. I often think that what I have experienced is the worst that can happen to a person35. I continually think how horrible the situation has been
9) Other-blame9. I feel that others are to blame for it
18. I feel that others are responsible for what has happened27. I think about the mistakes others have made in this matter36. I feel that basically the cause lies with others
Administering the CERQ
The CERQ can be administered both individually and in groups, using a computer or a pen-and-paper version. The room in which the questionnaire will be completed needs to offer goodconditions for the subjects to concentrate: no distractions, no interfering noise, sufficient light,and in the case of administration in a group, a placing so that there is enough room to complete thequestionnaire undisturbed and in private. As a rule, completing the CERQ takes less than 10minutes.
Instructions for completing the CERQ
The CERQ can be used to measure cognitive coping styles as well as to measure a specific responseto a specific event. In order to assess which cognitive coping strategies people usually use whenexperiencing something-unpleasant (cognitive coping style) the following (standard) instruction isgiven at completion:
Everyone gets confronted with negative or unpleasant experiences and everyone responds tothem in his or her own way. By the following questions, you are asked to indicate what yougenerally think, when you experience negative or unpleasant events. Please read thesentences below and indicate how often you have the following thoughts by circling themost suitable answer.
To assess which cognitive coping strategies people use when dealing with a specific event,situation, trauma or illness, the instruction is adjusted to the specific circumstances. An example ofa specific (standard) instruction to be given at completion:
You have experienced (fill in the specific event). More people have had similar experiences,and everyone deals with them in his or her own way. By means of the following questions,you are asked what you think about experiencing (fill in specific event). Please read thesentences below and indicate how often you have the following thoughts by circling themost suitable answer.
Explain clearly that completing the questionnaire is about people's own views and that right orwrong answers do not exist.
10
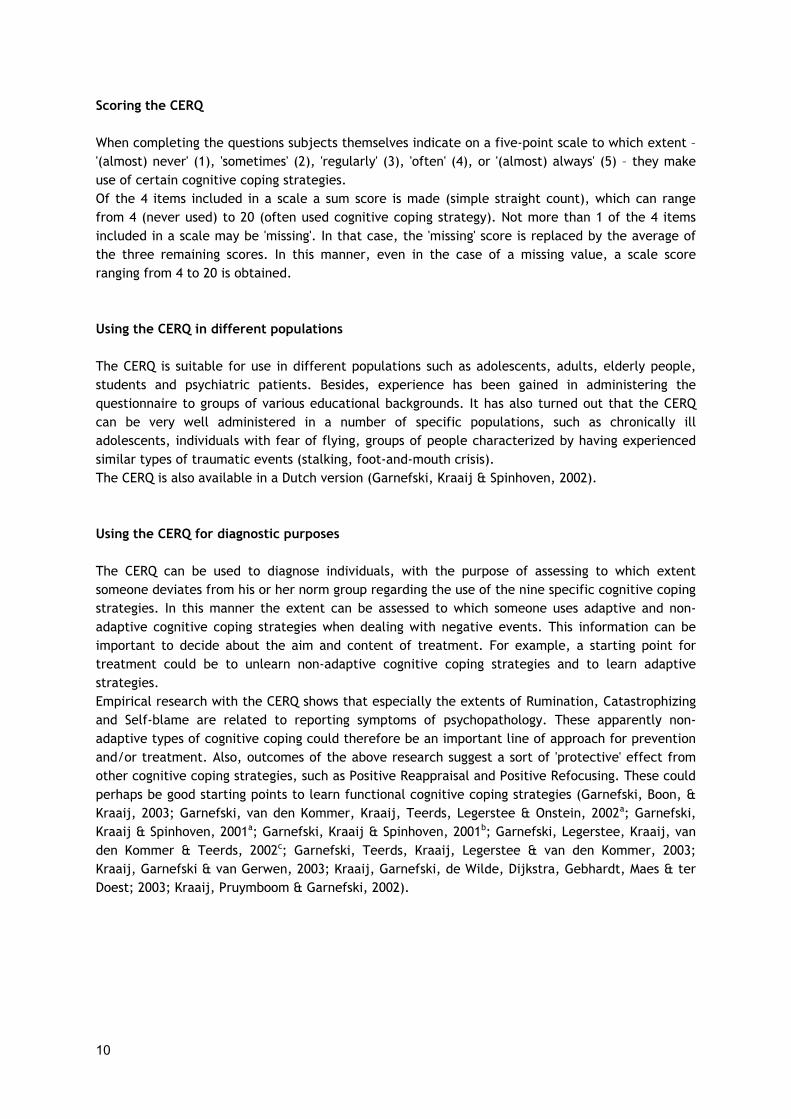
Scoring the CERQ
When completing the questions subjects themselves indicate on a five-point scale to which extent –'(almost) never' (1), 'sometimes' (2), 'regularly' (3), 'often' (4), or '(almost) always' (5) – they makeuse of certain cognitive coping strategies.Of the 4 items included in a scale a sum score is made (simple straight count), which can rangefrom 4 (never used) to 20 (often used cognitive coping strategy). Not more than 1 of the 4 itemsincluded in a scale may be 'missing'. In that case, the 'missing' score is replaced by the average ofthe three remaining scores. In this manner, even in the case of a missing value, a scale scoreranging from 4 to 20 is obtained.
Using the CERQ in different populations
The CERQ is suitable for use in different populations such as adolescents, adults, elderly people,students and psychiatric patients. Besides, experience has been gained in administering thequestionnaire to groups of various educational backgrounds. It has also turned out that the CERQcan be very well administered in a number of specific populations, such as chronically illadolescents, individuals with fear of flying, groups of people characterized by having experiencedsimilar types of traumatic events (stalking, foot-and-mouth crisis).The CERQ is also available in a Dutch version (Garnefski, Kraaij & Spinhoven, 2002).
Using the CERQ for diagnostic purposes
The CERQ can be used to diagnose individuals, with the purpose of assessing to which extentsomeone deviates from his or her norm group regarding the use of the nine specific cognitive copingstrategies. In this manner the extent can be assessed to which someone uses adaptive and non-adaptive cognitive coping strategies when dealing with negative events. This information can beimportant to decide about the aim and content of treatment. For example, a starting point fortreatment could be to unlearn non-adaptive cognitive coping strategies and to learn adaptivestrategies.Empirical research with the CERQ shows that especially the extents of Rumination, Catastrophizingand Self-blame are related to reporting symptoms of psychopathology. These apparently non-adaptive types of cognitive coping could therefore be an important line of approach for preventionand/or treatment. Also, outcomes of the above research suggest a sort of 'protective' effect fromother cognitive coping strategies, such as Positive Reappraisal and Positive Refocusing. These couldperhaps be good starting points to learn functional cognitive coping strategies (Garnefski, Boon, &Kraaij, 2003; Garnefski, van den Kommer, Kraaij, Teerds, Legerstee & Onstein, 2002a; Garnefski,Kraaij & Spinhoven, 2001a; Garnefski, Kraaij & Spinhoven, 2001b; Garnefski, Legerstee, Kraaij, vanden Kommer & Teerds, 2002c; Garnefski, Teerds, Kraaij, Legerstee & van den Kommer, 2003;Kraaij, Garnefski & van Gerwen, 2003; Kraaij, Garnefski, de Wilde, Dijkstra, Gebhardt, Maes & terDoest; 2003; Kraaij, Pruymboom & Garnefski, 2002).
11
Using the CERQ for scientific purposes
A major motive underlying scientific research is the identification of risk factors and protectivefactors associated with the development and continuation of emotional and behavioural problems.So far, empirical research involving the CERQ has demonstrated that cognitive coping strategiesthemselves, i.e. without the behavioural component, are very well capable of predicting aconsiderable part of the variance in scores of depression, anxiety and suicidality (e.g., Garnefski etal, 2001a; Garnefski et al, 2001b; Garnefski et al, 2002 a). This suggests, therefore, that thecognitive side of coping is an important component deserving further research in a conceptuallyunadulterated manner, i.e. without being mixed with behavioural components. It also suggests thatcognitive coping strategies should play an important and central role in theoretical models intendedto explain mental health problems.The outcomes of the research carried out so far show that for various problems it is true thatsymptom 'promoting' and 'protective' cognitive coping strategies can be identified. This is animportant finding, suggesting that in order to obtain a proper picture of the relationship betweencognitive coping and emotional dysfunctioning the combined action of the different strategiesrequires further investigation. In this regard it could be of importance to investigate to what extentcognitive coping profiles can be distinguished as well as the relationship between certain profilesand psychopathology. For instance, the outcomes of the above research suggest that the presenceof symptoms of depression, anxiety or suicidality could point at the use of – perhaps long-established – non-adaptive cognitive coping strategies like Rumination, Catastrophizing and Self-blame.

12

13
Chapter 3Description of the norm groups
Table 1 gives an overview of the norm groups used in this manual. Below, four samples from thegeneral population are listed: 1) 586 adolescents 13-to-15 years of age; 2) 986 adolescents 16-to-18years of age; 3) 611 adults from the general population, 18-to-65 years of age; and 4) 99 individualsaged 66 years and over. In addition, data were collected from 218 adult psychiatric patients aged18-to-65 years (5). From the Adults General Population follow-up data have also been collected.
Table 1: CERQ norm groups
Sample Males Females Follow-up?
1. Early Adolescents (13-15) 253 333 -
2. Late Adolescents (16-18) 417 562 -
3. Adults General Population (18-65) 242 369 yes
4. Elderly People (66-97) 51 47 -
5. Psychiatric Patients(18-65) 92 121 -
Below, more specific information is given with regard to the data collection and characteristics ofthe above samples.
1) Early AdolescentsThe data for this sample have been collected at three different secondary schools in the west ofthe Netherlands. This group completed the questionnaires during school hours in their ownclassroom, under the supervision of a teacher and two psychology students. The study took place inMarch 1998. The sample consisted of 586 adolescents aged between 13 and 15 years. The mean agewas 13 years and 11 months, the standard deviation being 0.69. There were 253 (43%) boys and 333(57%) girls. The division over the various educational levels was as follows: 21 (4%) pupils attendinglower vocational education (VBO), 104 (18%) pupils attending lower secondary general education(MAVO), 229 (39%) pupils attending higher general secondary education (HAVO) and 232 (40%) pupilsattending pre-university education (VWO). The sample consisted of second and third grade pupils.
2) Late AdolescentsThis sample comes from a large school for intermediate vocational education in the south-east ofthe Netherlands. Here, too, the questionnaires were completed at school, under the supervision oftwo psychology students. This survey was carried out in October 1999. The sample consisted of 986adolescents in the age group 16-to-18 years. The mean age was 16 years, 11 months, the standarddeviation being 0.75. There were 417 (43%) boys and 562 (57%) girls, all of whom were first-yearstudents.
14
3) Adults General PopulationThis sample comes from the directory of a family practice in a medium-sized town in the west ofthe Netherlands. Following a written mailing in January 2000, 611 people aged between 18 and 65years participated in the study on an individual basis. 242 (40%) of them were male and 369 (60%)female. The mean age was 41 years, 11 months, the standard deviation being 11.51. Of therespondents 383 (63%) individuals indicated to be married, engaged or living together. 216 (35%)were either single or divorced. The educational level ranged from primary school (4%), lowervocational (LBO) or lower general secondary education (MAVO/MULO) (20%), intermediatevocational education (MBO) (16%), higher general secondary and pre-university education(HBS/MMS/HAVO/VWO) (11%), to higher vocational and university education (48%).From this sample follow-up data were collected after 14 months, again by means of a writtenmailing. 290 individuals participated, of which 109 (38%) were male and 181 (62%) female.
4) Elderly PeopleThis group comes from an earlier sample of people aged 65 years and over from the municipaldirectory of a medium-sized town in the west of the Netherlands. Following a written mailing and atelephone call in March 2000, 99 people aged 66-to-97 years participated individually in the survey.52% of them were female, 48% male. The mean age was 77 years, 2 months, the standard deviationbeing 6.12. Of the respondents 50 (52%) indicated to be married or living together, 41 (42%) hadbeen widowed, and 6 (6%) were divorced or had never married. The majority (92%) lived on theirown, the others lived in an old people's home (3%), sheltered accommodation (3%) or in differentconditions (2%).
5) Psychiatric PatientsThe data of this group were collected among outpatients of a psychiatric institution in the west ofthe Netherlands. With this group, completing the CERQ was part of a larger set of questionnairesthat they had to fill out before the interview on admission to this clinic. For that reason thequestionnaire was completed on an individual basis. The survey took place between November 1999and June 2001. 218 people aged 18-to-65 years participated, of whom 92 (43%) were male and 121(57%) female. The mean age was 35 years, 8 months, the standard deviation being 11.32. Of therespondents 113 (53%) indicated to be married, engaged or living together, 101 (47%) people wereeither widowed, single or divorced. The educational level ranged from primary school (16%), lowervocational (LBO) or lower general secondary education (MAVO/MULO) (32%), intermediatevocational education (MBO) (10%), higher general secondary and pre-university education(HBS/MMS/HAVO/VWO) (22%), to higher vocational and university education (18%).
15
Chapter 4Psychometric properties of the CERQ
This chapter deals with various aspects concerning the internal structure, reliability and validity ofthe CERQ.
Dimensional structure of the CERQ
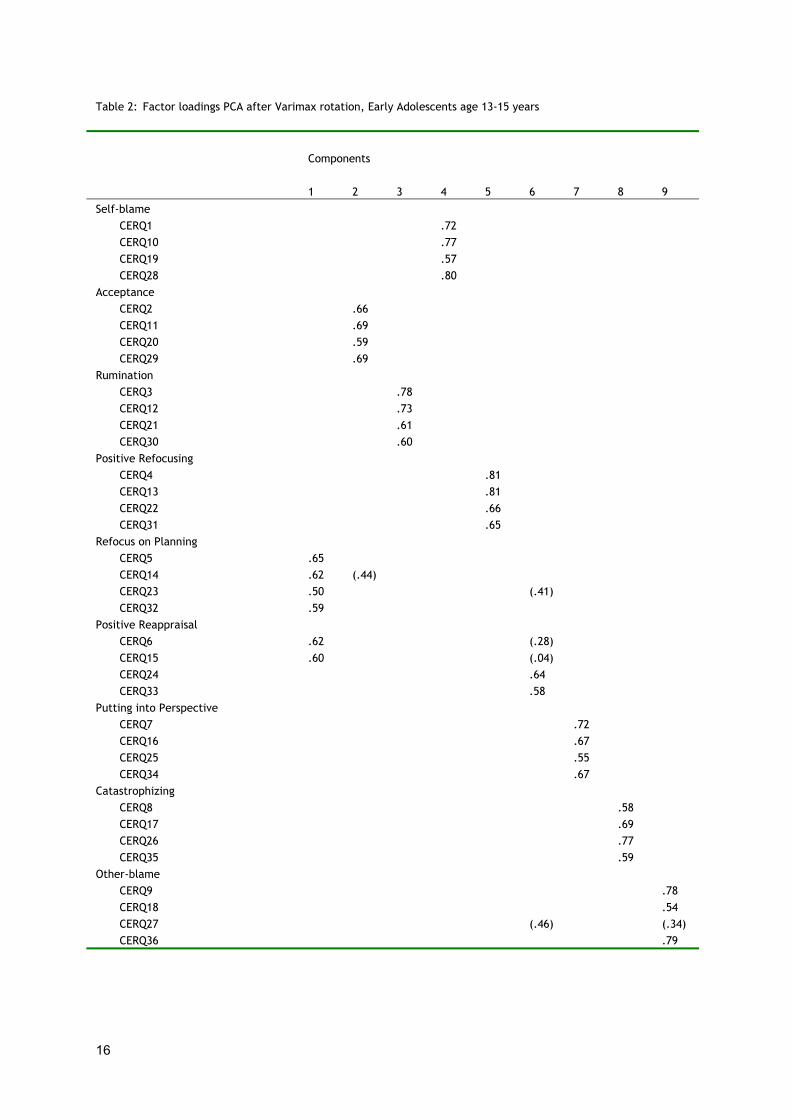
First of all, in order to define the dimensional structure a Principal Component Analysis withVarimax-rotation on item level was performed for the group of Early Adolescents aged 13-to-15years, as this was the first group involved in a publication about the CERQ (Garnefski et al., 2001a;Garnefski et al., 2001b; Garnefski et al., 2002a). The factor loadings matrix for this group isrepresented in Table 2. This table shows all factor loadings >.40. From the curves of the plottedeigenvalues it appeared that the nine-factor solution was quite justifiable. Eight factors had aneigenvalue > 1, while the ninth factor had an eigenvalue of .97. The values of the communalitiesranged from .47 to .74. In the population of Early Adolescents the nine factors together explainedin all 64.4% of the variance. Table 2 shows also that the factors found were consistent with theintended nine-factor structure. Almost all items included in one and the same dimension on atheoretical basis, turned out to actually load on one and the same dimension on an empirical basis,in most cases with a factor loading exceeding .40. Some deviations from the proposed structurewere found, though. For instance, one of the items of the scale 'Other-blame' loaded .34, i.e.below .40. Also, the scales Refocus on Planning and Positive Reappraisal turned out to show someoverlap. Two of the items that theoretically should load on the dimension belonging to the otheritems of Positive Reappraisal, appeared to load much stronger on the dimension made up by theitems belonging to Refocus on Planning. The two remaining items of the Positive Reappraisal scaledid indeed have a high factor loading on 'their own' dimension. This overlap could be explained bystrong correlations between items of the Refocus on Planning and Positive Reappraisal scales. Forfurther interpretation it is important to examine carefully whether the two scales separately stillshow enough internal consistency.In a further phase of the study the generalisability of these factors was examined. For this purposePrincipal Component Analyses were also performed for the remaining populations we studied,namely the Late Adolescents (age 16-18), the Adults General Population (age 18-65), the ElderlyPeople (age 66-97) and the Psychiatric Patients (age 18-65). The Principal Component Analysis ofthe Late Adolescents showed that in this group nine factors explained 62.2% of the variance. Thefactor structure in this group proved to be roughly similar to the group of Early Adolescents. In thisgroup, too, the first two items of Positive Reappraisal ended up on one dimension with Refocus onPlanning, while the two remaining items of Positive Reappraisal made up their own dimension.Apart from this, no deviations from the intended structure were found in this group, while almostall factor loadings belonging to the dimension in question had values exceeding .40.With the Adults the nine factors also explained a considerable part of the variance (68.1%). Here,too, almost all factors were in accordance with the proposed structure, with factor loadings whichall turned out to exceed .59. The only deviation from the structure (also compared with the EarlyAdolescents group) was that in the Adults group all items belonging to the Refocus on Planning andPositive Reappraisal scales ended up on one dimension.Here again, it is true that a careful inspection of the internal consistency of the two scales isimportant.
16
Table 2: Factor loadings PCA after Varimax rotation, Early Adolescents age 13-15 years
Components
1 2 3 4 5 6 7 8 9
Self-blameCERQ1 .72CERQ10 .77CERQ19 .57CERQ28 .80
AcceptanceCERQ2 .66CERQ11 .69CERQ20 .59CERQ29 .69
RuminationCERQ3 .78CERQ12 .73CERQ21 .61CERQ30 .60
Positive RefocusingCERQ4 .81CERQ13 .81CERQ22 .66CERQ31 .65
Refocus on PlanningCERQ5 .65CERQ14 .62 (.44)CERQ23 .50 (.41)CERQ32 .59
Positive ReappraisalCERQ6 .62 (.28)CERQ15 .60 (.04)CERQ24 .64CERQ33 .58
Putting into PerspectiveCERQ7 .72CERQ16 .67CERQ25 .55CERQ34 .67
CatastrophizingCERQ8 .58CERQ17 .69CERQ26 .77CERQ35 .59
Other-blameCERQ9 .78CERQ18 .54CERQ27 (.46) (.34)CERQ36 .79
17
With the Elderly People the nine factors explained 69.8% of the variance. As with the Adults group,with this group the items belonging to the Refocus on Planning and Positive Reappraisal scalesturned out to have ended up on one dimension. Furthermore, with this group the items belongingto Rumination and Catastrophizing also appeared to load on one and the same dimension. Theremaining dimensions were fully in accordance with the intended structure, with factor loadings of.40 and more.With the Psychiatric Patients group yet again the general tendency was confirmed that itemsbelonging to the Refocus on Planning and Positive Reappraisal scales loaded on one dimension. Allof the remaining items turned out to load on the intended dimension, in all cases with a factorloading exceeding .40. In this group the percentage of explained variance was 68.1%From the various Principal Component Analyses there clearly emerge comparable pictures. In allcases the dimensions explain over 60% of the variance. In most cases the dimensions are in fullaccord with the scales established on a theoretical basis. The only consistent exception is theoverlap between the items belonging to the Refocus on Planning and Positive Reappraisal scales. Inmost cases these items ended up on one and the same dimension. This is probably due to the ratherstrong correlation between these two scales (varying from .62 with the Early Adolescents to .75with the Elderly People). However, the internal consistency coefficients in the next sectiondemonstrate that the two scales in question can in fact be distinguished as two separate, reliablescales. Also on a theoretical basis it is important to keep distinguishing these two subscales clearlyas two different concepts. While the concept of Refocus on Planning clearly focuses on thinkingabout what steps to take in order to cope with the event (action-oriented), the concept of PositiveReappraisal focuses on attributing a positive meaning to the event in terms of personal growth(emotion-oriented). Also in the existing literature in the field of coping the two concepts areclearly distinguished from each other. Still, the Principal Components Analyses and the correlationanalyses make it clear that the two concepts are closely linked. Therefore, this is certainlyimportant to take into account when interpreting the scores.
Internal consistency: Cronbach's alpha
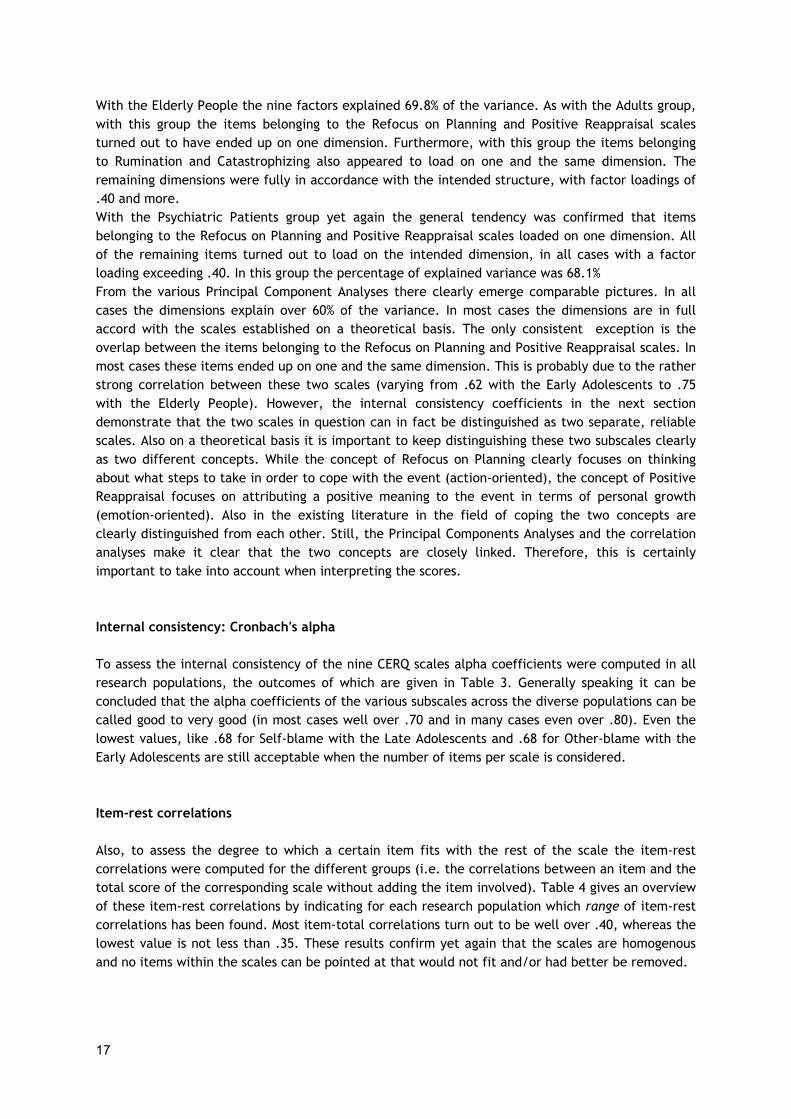
To assess the internal consistency of the nine CERQ scales alpha coefficients were computed in allresearch populations, the outcomes of which are given in Table 3. Generally speaking it can beconcluded that the alpha coefficients of the various subscales across the diverse populations can becalled good to very good (in most cases well over .70 and in many cases even over .80). Even thelowest values, like .68 for Self-blame with the Late Adolescents and .68 for Other-blame with theEarly Adolescents are still acceptable when the number of items per scale is considered.
Item-rest correlations
Also, to assess the degree to which a certain item fits with the rest of the scale the item-restcorrelations were computed for the different groups (i.e. the correlations between an item and thetotal score of the corresponding scale without adding the item involved). Table 4 gives an overviewof these item-rest correlations by indicating for each research population which range of item-restcorrelations has been found. Most item-total correlations turn out to be well over .40, whereas thelowest value is not less than .35. These results confirm yet again that the scales are homogenousand no items within the scales can be pointed at that would not fit and/or had better be removed.
18
Table 3: Cronbach’s alpha coefficients of the CERQ scales in five subgroups
Subscales (4 items per scale)
Early
Adolescents
Alpha
Late
Adolescents
Alpha
Adults
Alpha
Elderly
People
Alpha
Psychiatric
Patients
Alpha
Self-blame .81 .68 .75 .77 .85
Acceptance .80 .73 .76 .82 .72
Rumination .83 .79 .83 .78 .81
Positive Refocusing .81 .78 .85 .82 .81
Refocus on Planning .81 .76 .86 .77 .84
Positive Reappraisal .72 .76 .85 .80 .81
Putting into Perspective .79 .76 .82 .76 .81
Catastrophizing .71 .74 .79 .80 .80
Other-blame .68 .73 .82 .80 .83
Table 4: Item-rest correlations of the nine CERQ scales in five subgroups (range of values)
Subscales
Early
Adolescents
Item-rest
correlation
Late
Adolescents
Item-rest
correlation
Adults
Item-rest
correlation
Elderly People
Item-rest
correlation
Psychiatric
Patients
Item-rest
correlation
Self-blame .59-.61 .35-.53 .48-.61 .50-.70 .67-.72
Acceptance .49-.65 .44-.62 .38-.65 .56-.66 .38-.61
Rumination .62-.70 .57-.62 .62-.69 .57-.62 .50-.71
Positive Refocusing .61-.65 .48-.64 .62-.72 .51-.75 .59-.65
Refocus on Planning .61-.66 .53-.60 .67-.72 .45-.63 .63-.75
Positive Reappraisal .47-.55 .52-.59 .65-.72 .56-.68 .60-.66
Putting into Perspective .58-.64 .49-.59 .56-.74 .48-.66 .55-.66
Catastrophizing .41-.58 .44-.63 .41-.71 .45-.68 .45-.65
Other-blame .43-.52 .46-.58 .59-.71 .54-.75 .57-.74
19
Stability (test-retest reliabilities)
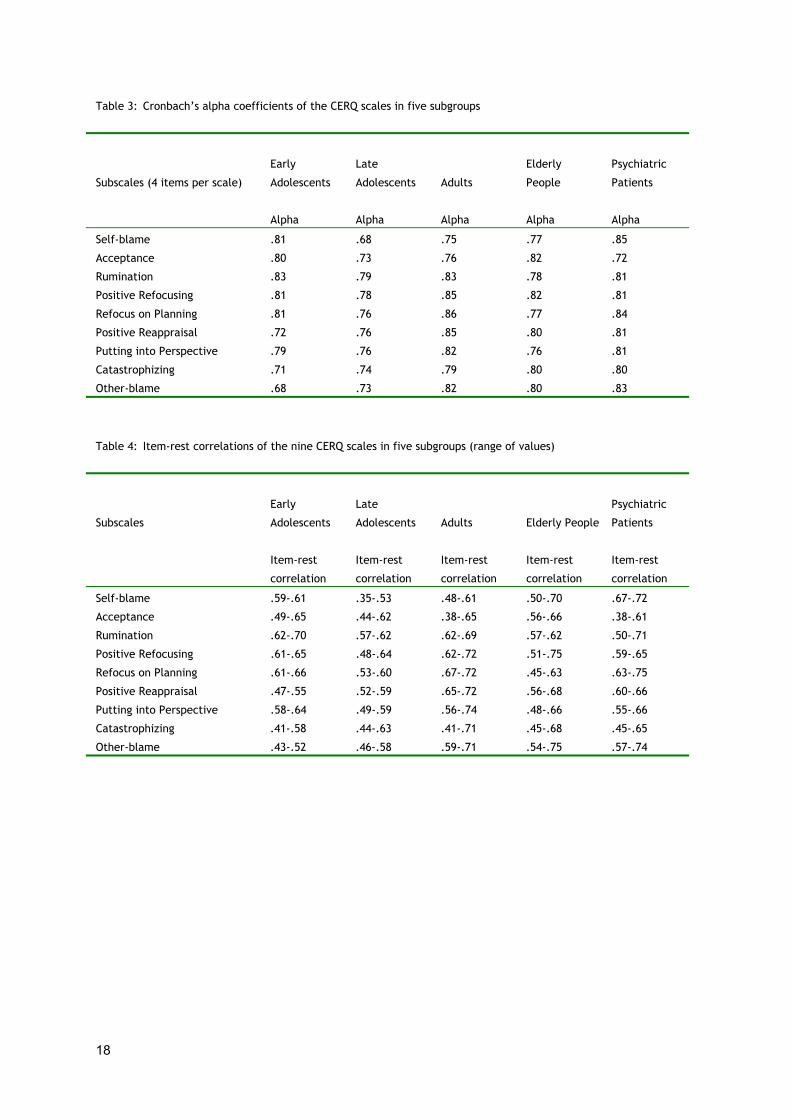
The CERQ was administered twice to the Adults General Population. Therefore, the data of thisgroup have been used to compute the test-retest correlations. There was a 14-month intervalbetween the two measurements. For the interpretation of the test-retest data it is, therefore,important to take into account this relatively long intervening period of time, because it isreasonable to assume that in such an interval a change of circumstance will occur more easily ormore often than had there been a shorter intervening period of time. Table 5 shows the results oftest-retest correlations and paired t-tests.The test-retest correlations range between .48 (Refocus on Planning) and .65 (Other-blame). Thesevalues suggest that we are talking about reasonably stable styles, although certainly notcomparable to personality traits. This is confirmed by the outcomes of the paired t-tests, whichtest whether the mean individual difference scores of the first and second measurements deviatesignificantly from zero. Without a Bonferroni correction, in a number of cases a small, thoughsignificant, difference turned out to exist between someone's pre- and post-measurement. Afterthe Bonferroni correction, the correction which needs to be applied to correct for the chance offinding accidental differences when performing multiple bivariate t-tests, the existence of asignificant difference between pre-and post-measurement appeared to hold for only one of the ninecognitive coping strategies. When using the Bonferroni correction, the normally applicable criterionfor significance, i.e. p<.05, is divided by the number of tests carried out, namely nine. The result,the value of .006, is then used as the criterion to define whether a p-value found is significant ornot (p<.006). This significant difference concerns the cognitive coping strategy Acceptance. Theother mean difference scores do not significantly deviate from zero after the Bonferroni correction.These findings correspond with the expectations that hold for the concept of cognitive copingstrategies and support the assumption that although cognitive coping strategies refer to personalcoping styles, it should potentially be possible to influence, change, learn and unlearn them. This isan important point for mental health intervention. To obtain a definite answer about the degree ofstability of cognitive coping strategies, though, more data would have to be collected in differentresearch groups, with shorter intervening periods between test and retest.
Table 5: Test-retest reliabilities of the CERQ scales after14 months (Adults General Population age 18-65 years)
Subscales r1-2 N
Measurement
1
M (sd)
Measurement
2
M (sd)
t-test
(paired)
Self-blame .54*** 287 8.22 (2.95) 8.61 (3.03) -2.30*
Acceptance .49*** 287 11.03 (3.51) 10.41 (3.25) 3.06**
Rumination .60*** 287 10.50 (3.73) 10.10 (3.57) 2.06*
Positive Refocusing .51*** 285 9.91 (3.45) 9.75 (3.46) 0.77
Refocus on Planning .48*** 287 13.08 (3.87) 12.59 (3.58) 2.23*
Positive Reappraisal .57*** 287 12.45 (4.06) 12.34 (3.70) 0.52
Putting into Perspective .55*** 288 11.63 (3.90) 11.23 (3.76) 1.82
Catastrophizing .62*** 287 6.07 (2.45) 6.01 (2.49) 0.45
Other-blame .65*** 287 6.37 (2.70) 6.02 (2.39) 2.79**
*: p<.05; **: p<.01; ***: p<.001
20
Correlations between the CERQ scales
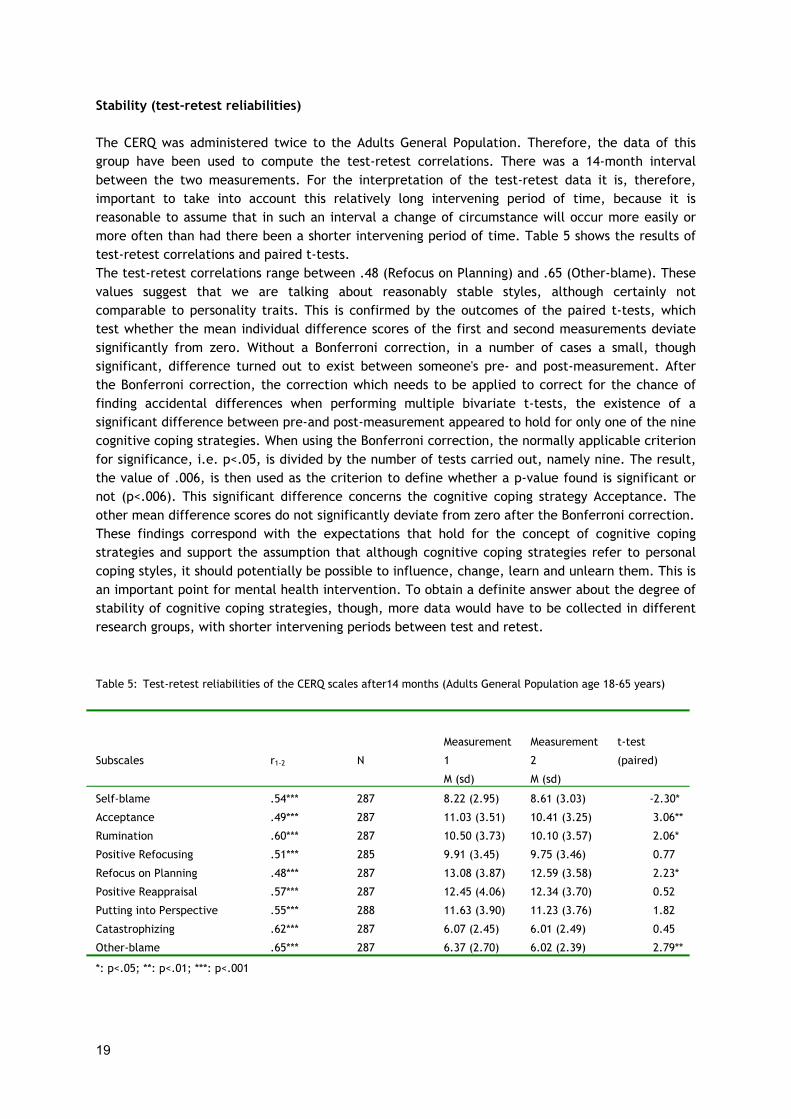
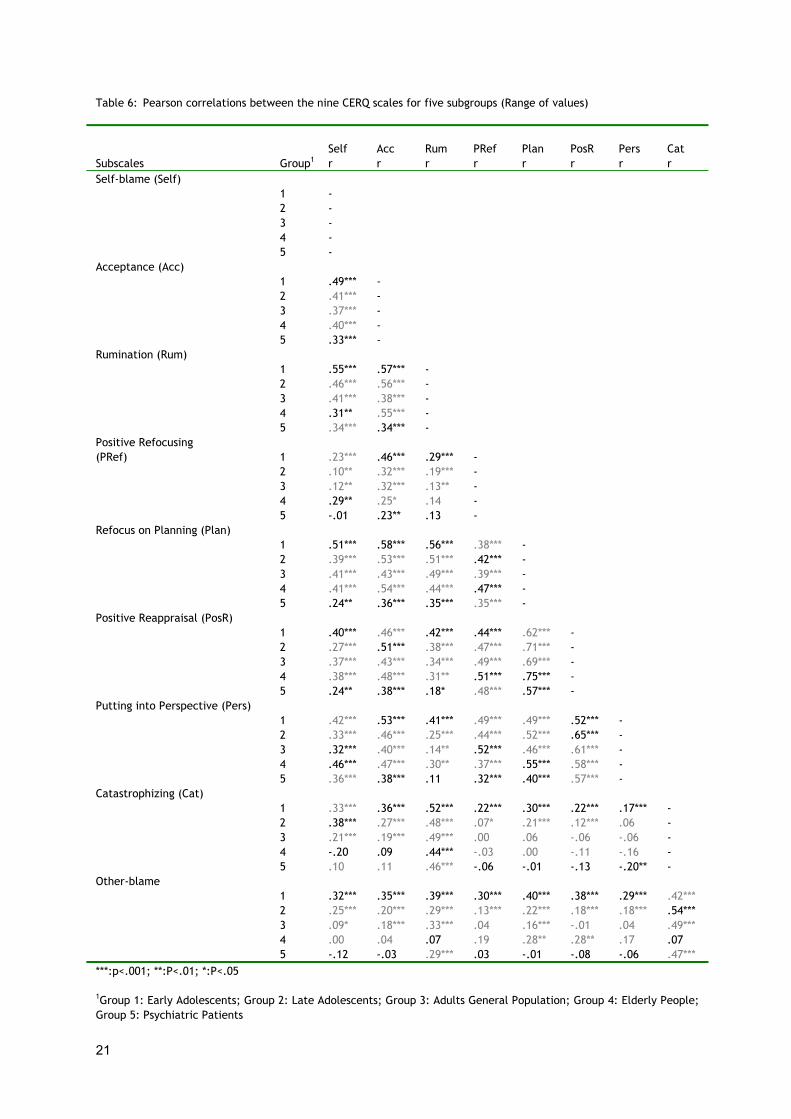
In order to examine the extent to which the nine CERQ subscales are interrelated, Pearsoncorrelation coefficients have been computed for all populations. Table 6 presents an overview ofthe correlations between the CERQ scales for all populations studied, indicating in bold print thehighest and lowest values found respectively. Generally speaking the correlations patterncorresponds fairly well between the five groups. Yet, on the whole the adolescent groups showslightly higher correlations between the scales, whereas with the Elderly People and PsychiatricPatients the scales correlate somewhat less. For the research involving the CERQ it is especiallyimportant that on the whole correlations be not too high, i.e. not structurally exceeding .70 to .80.Table 6 shows that generally correlations range between .30 and .70 (moderately high tosubstantial). Only for the correlation between Refocus on Planning and Positive Reappraisal twovalues exceeding .70 are found, but for the correlation between these two subscales, too, it holdsthat the majority of coefficients does not exceed .70 (the mean correlation being .67). The tableclearly demonstrates that some scales are less strongly interrelated than others. This can beexplained by the fact that some concepts are simply more closely related than others. Asmentioned before, the strongest relation has been found between Refocus on Planning and PositiveReappraisal. Also, relatively high correlations were discovered for the relationship between PositiveReappraisal and Putting into Perspective (a mean correlation of .58). For the remainingcombinations of scales the mean correlation coefficient values were less than .50. In general,therefore, it can be concluded that the intercorrelations of the CERQ scales support the CERQ'smultidimensionality.
Factorial validity
The factor analyses in the various populations have already shown that apart from a fewexceptions the factor structure was almost invariant across the various subgroups. This findingpoints to factorial validity of the CERQ scales. As the different populations at the same timerepresent diverse age groups, it may also be concluded that the factor structure is also almostinvariant with respect to age. In order to examine the factorial validity with respect to gender, thewhole Early Adolescents group, the whole Late Adolescents group and the whole Adults GeneralPopulation group were divided into a male and a female group. Next, the factor structures obtainedin these groups were compared. This was not done for the Elderly People group nor the PsychiatricPatients group, because division resulted in sample groups of less than 100 which would render thefactor analysis less reliable.The results demonstrated that the CERQ's 9-factor structure is also invariant with regard to gender.Also, the overlap between Refocus on Planning and Positive Reappraisal was found in all groups.The only exception was that in the Late Adolescents group some overlap between the factors ofOther-blame and Catastrophizing was found for the girls, while the boys showed some overlapbetween Putting into Perspective, Planning and Positive Reappraisal. With the Early Adolescentsboth for the boys and the girls 65% of the variance was explained, while for the men as well as thewomen from the Adults population 69% of the variance was explained. With the Late Adolescents,in the case of the girls 64% and the boys 62% respectively of the variance was explained.
21
Table 6: Pearson correlations between the nine CERQ scales for five subgroups (Range of values)
Subscales Group1Selfr
Accr
Rumr
PRefr
Planr
PosRr
Persr
Catr
Self-blame (Self)1 -2 -3 -4 -5 -
Acceptance (Acc)1 .49*** -2 .41*** -3 .37*** -4 .40*** -5 .33*** -
Rumination (Rum)1 .55*** .57*** -2 .46*** .56*** -3 .41*** .38*** -4 .31** .55*** -5 .34*** .34*** -
Positive Refocusing(PRef) 1 .23*** .46*** .29*** -
2 .10** .32*** .19*** -3 .12** .32*** .13** -4 .29** .25* .14 -5 -.01 .23** .13 -
Refocus on Planning (Plan)1 .51*** .58*** .56*** .38*** -2 .39*** .53*** .51*** .42*** -3 .41*** .43*** .49*** .39*** -4 .41*** .54*** .44*** .47*** -5 .24** .36*** .35*** .35*** -
Positive Reappraisal (PosR)1 .40*** .46*** .42*** .44*** .62*** -2 .27*** .51*** .38*** .47*** .71*** -3 .37*** .43*** .34*** .49*** .69*** -4 .38*** .48*** .31** .51*** .75*** -5 .24** .38*** .18* .48*** .57*** -
Putting into Perspective (Pers)1 .42*** .53*** .41*** .49*** .49*** .52*** -2 .33*** .46*** .25*** .44*** .52*** .65*** -3 .32*** .40*** .14** .52*** .46*** .61*** -4 .46*** .47*** .30** .37*** .55*** .58*** -5 .36*** .38*** .11 .32*** .40*** .57*** -
Catastrophizing (Cat)1 .33*** .36*** .52*** .22*** .30*** .22*** .17*** -2 .38*** .27*** .48*** .07* .21*** .12*** .06 -3 .21*** .19*** .49*** .00 .06 -.06 -.06 -4 -.20 .09 .44*** -.03 .00 -.11 -.16 -5 .10 .11 .46*** -.06 -.01 -.13 -.20** -
Other-blame1 .32*** .35*** .39*** .30*** .40*** .38*** .29*** .42***2 .25*** .20*** .29*** .13*** .22*** .18*** .18*** .54***3 .09* .18*** .33*** .04 .16*** -.01 .04 .49***4 .00 .04 .07 .19 .28** .28** .17 .075 -.12 -.03 .29*** .03 -.01 -.08 -.06 .47***
***:p<.001; **:P<.01; *:P<.05
1Group 1: Early Adolescents; Group 2: Late Adolescents; Group 3: Adults General Population; Group 4: Elderly People;Group 5: Psychiatric Patients
22
Discriminative properties
In determining its validity the discriminative properties of a test are also of importance. That is,when specific scales in specific populations are expected to show higher means, this should bereflected in the differences between the mean scores. On the basis of the literature it is expectedfor the CERQ that the Psychiatric Patients' mean scores should be higher especially on scales likeRumination, Self-blame and Catastrophizing. Another expectation in keeping with general findingsin the literature would be that on most of the CERQ scales women should show higher mean scoresthan men. Furthermore, we expect that with age the use of most cognitive strategies will alsoincrease. The next chapter on the standardization of the CERQ includes a table (Table 16)representing the differences between means.In the first place, Table 16 clearly shows that, as expected, the Psychiatric Patients score higher onSelf-blame, Rumination and Catastrophizing than the Adults of the General Population do.Secondly, women do in fact show a higher mean score than men on most scales. Thirdly, the use ofmost cognitive strategies seems to increase with age. On the other hand, with the Elderly Peoplethe use of certain cognitive coping strategies seems to decrease somewhat. With these results,therefore, the CERQ scales demonstrate that the discriminative properties are in agreement withthe expectations.
Construct validity
Below, the correlations between the CERQ scales and various measures considered relevant aredescribed, with the purpose of gaining insight into the CERQ's construct validity. The followingsections clearly show that the strongest correlations are found between a number of CERQ scalesand the scales of the Coping Inventory for Stressful Situations (CISS) that are related as regardscontent. With respect to the correlations between the CERQ scales and other concepts it is shownthat on the whole they are in line with expectations. Moderate to fairly strong relations have beenfound for a number of CERQ scales and Personality, Self Esteem and Self-Efficacy, which shows thatalthough related concepts are involved, the extent of their relation is not such that they can becalled the same concepts. Also, some clear relations have been found between a number of CERQscales and various Psychopathology indicators, which is an important finding from the point ofintervention and/or treatment.
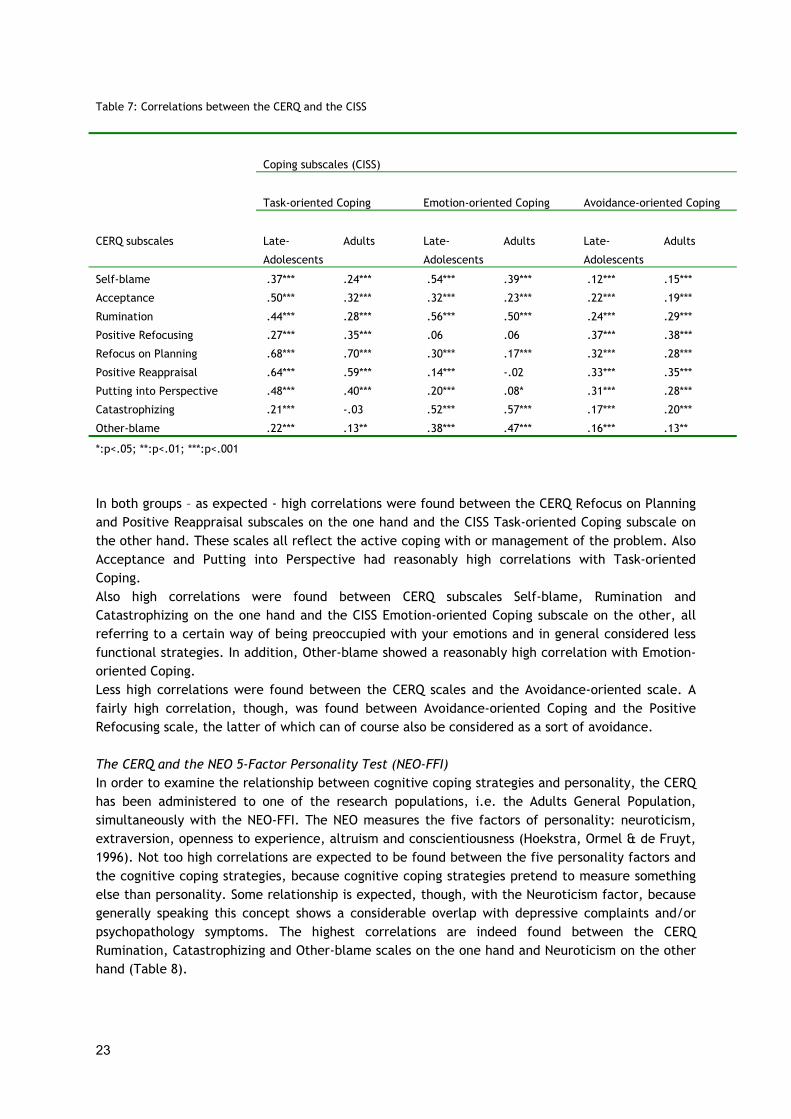
The CERQ and the Coping Inventory for Stressful Situations (CISS)For validation purposes both in the survey among Late Adolescents and the survey among AdultsGeneral Population the CERQ has been administered simultaneously with the Coping Inventory forStressful Situation (CISS: Endler & Parker, 1990). Table 7 shows the correlations between the nineCERQ subscales and the three CISS subscales, Task-oriented Coping, Emotion-oriented Coping andAvoidance-oriented Coping. On the whole it can be stated that the picture of the correlations foundin the Late Adolescents group matches the correlations found in the Adults General Populationgroup and that the correlations between the CERQ and CISS subscales can be interpreted in atheoretically meaningful manner.
23
Table 7: Correlations between the CERQ and the CISS
Coping subscales (CISS)
Task-oriented Coping Emotion-oriented Coping Avoidance-oriented Coping
CERQ subscales Late-
Adolescents
Adults Late-
Adolescents
Adults Late-
Adolescents
Adults
Self-blame .37*** .24*** .54*** .39*** .12*** .15***
Acceptance .50*** .32*** .32*** .23*** .22*** .19***
Rumination .44*** .28*** .56*** .50*** .24*** .29***
Positive Refocusing .27*** .35*** .06 .06 .37*** .38***
Refocus on Planning .68*** .70*** .30*** .17*** .32*** .28***
Positive Reappraisal .64*** .59*** .14*** -.02 .33*** .35***
Putting into Perspective .48*** .40*** .20*** .08* .31*** .28***
Catastrophizing .21*** -.03 .52*** .57*** .17*** .20***
Other-blame .22*** .13** .38*** .47*** .16*** .13**
*:p<.05; **:p<.01; ***:p<.001
In both groups – as expected - high correlations were found between the CERQ Refocus on Planningand Positive Reappraisal subscales on the one hand and the CISS Task-oriented Coping subscale onthe other hand. These scales all reflect the active coping with or management of the problem. AlsoAcceptance and Putting into Perspective had reasonably high correlations with Task-orientedCoping.Also high correlations were found between CERQ subscales Self-blame, Rumination andCatastrophizing on the one hand and the CISS Emotion-oriented Coping subscale on the other, allreferring to a certain way of being preoccupied with your emotions and in general considered lessfunctional strategies. In addition, Other-blame showed a reasonably high correlation with Emotion-oriented Coping.Less high correlations were found between the CERQ scales and the Avoidance-oriented scale. Afairly high correlation, though, was found between Avoidance-oriented Coping and the PositiveRefocusing scale, the latter of which can of course also be considered as a sort of avoidance.
The CERQ and the NEO 5-Factor Personality Test (NEO-FFI)In order to examine the relationship between cognitive coping strategies and personality, the CERQhas been administered to one of the research populations, i.e. the Adults General Population,simultaneously with the NEO-FFI. The NEO measures the five factors of personality: neuroticism,extraversion, openness to experience, altruism and conscientiousness (Hoekstra, Ormel & de Fruyt,1996). Not too high correlations are expected to be found between the five personality factors andthe cognitive coping strategies, because cognitive coping strategies pretend to measure somethingelse than personality. Some relationship is expected, though, with the Neuroticism factor, becausegenerally speaking this concept shows a considerable overlap with depressive complaints and/orpsychopathology symptoms. The highest correlations are indeed found between the CERQRumination, Catastrophizing and Other-blame scales on the one hand and Neuroticism on the otherhand (Table 8).

24
Table 8: Correlations between the CERQ and the NEO-FFI
Personality Subscales (NEO-FFI) – Adults
CERQ subscales Neuroticism Extraversion Openness Altruism Conscientiousness
Self-blame .12* -.11 .14* -.02 -.14*
Acceptance .12* -.11 .07 .09 .02
Rumination .30*** -.08 .23*** .08 -.07
Positive Refocusing -.08 .17** .06 .13* .03
Refocus on Planning -.06 .11 .29*** .17** .12*
Positive Reappraisal -.20** .28*** .24*** .20** .14*
Putting into Perspective -.07 .13* -.03 .15* .09
Catastrophizing .41*** -.18** -.07 -.07 -.15*
Other-blame .35*** -.19** -.03 -.18** -.05
*:p<.05; **:p<.01; ***:p<.001
The CERQ and the Rosenberg Self-Esteem ScaleFurthermore, the relationship between cognitive coping strategies and Self-Esteem has beenexamined by administering the CERQ to the Late Adolescents group simultaneously with theRosenberg Self-Esteem Scale (Rosenberg, 1965). The Rosenberg Self-Esteem Scale has one outcomemeasure, in which a high score refers to a high self-esteem. Cognitive coping strategies that areassumed to be less functional are expected to correlate negatively to the self-esteem measure,whereas cognitive coping strategies considered to be more functional will not correlate or do sopositively. In Table 9 the correlations are represented. The results show that Self-blame,Rumination and Catastrophizing do in fact correlate significantly and negatively with Self-Esteem,whereas Positive Refocusing and Positive Reappraisal correlate with Self-Esteem positively andsignificantly, although not very strongly.
Table 9: Correlations between the CERQ en de Rosenberg Self-Esteem Scale
CERQ subscales Self-Esteem (SES) -
Late-Adolescents
Self-blame -.31***
Acceptance -.06
Rumination -.24***
Positive Refocusing .14***
Refocus on Planning .04
Positive Reappraisal .17***
Putting into Perspective .07*
Catastrophizing -.29***
Other-blame -.14***
*:p<.05; **:p<.01; ***:p<.001
25
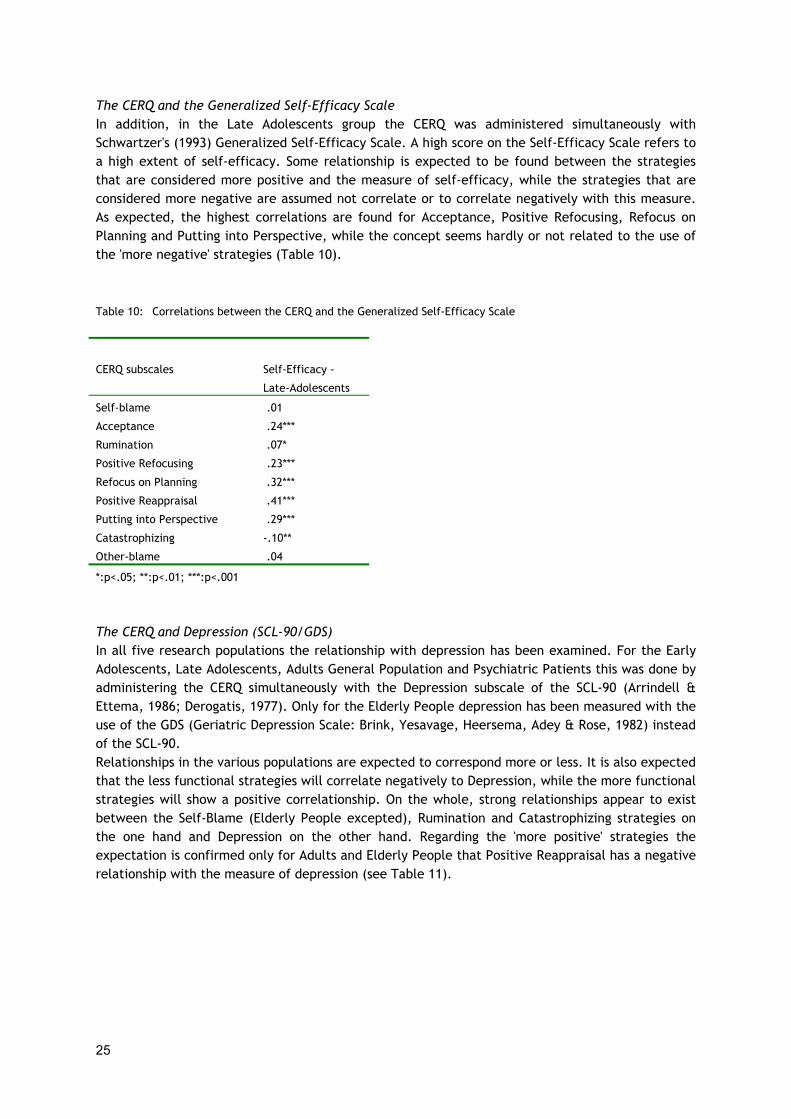
The CERQ and the Generalized Self-Efficacy ScaleIn addition, in the Late Adolescents group the CERQ was administered simultaneously withSchwartzer's (1993) Generalized Self-Efficacy Scale. A high score on the Self-Efficacy Scale refers toa high extent of self-efficacy. Some relationship is expected to be found between the strategiesthat are considered more positive and the measure of self-efficacy, while the strategies that areconsidered more negative are assumed not correlate or to correlate negatively with this measure.As expected, the highest correlations are found for Acceptance, Positive Refocusing, Refocus onPlanning and Putting into Perspective, while the concept seems hardly or not related to the use ofthe 'more negative' strategies (Table 10).
Table 10: Correlations between the CERQ and the Generalized Self-Efficacy Scale
CERQ subscales Self-Efficacy -
Late-Adolescents
Self-blame .01
Acceptance .24***
Rumination .07*
Positive Refocusing .23***
Refocus on Planning .32***
Positive Reappraisal .41***
Putting into Perspective .29***
Catastrophizing -.10**
Other-blame .04
*:p<.05; **:p<.01; ***:p<.001
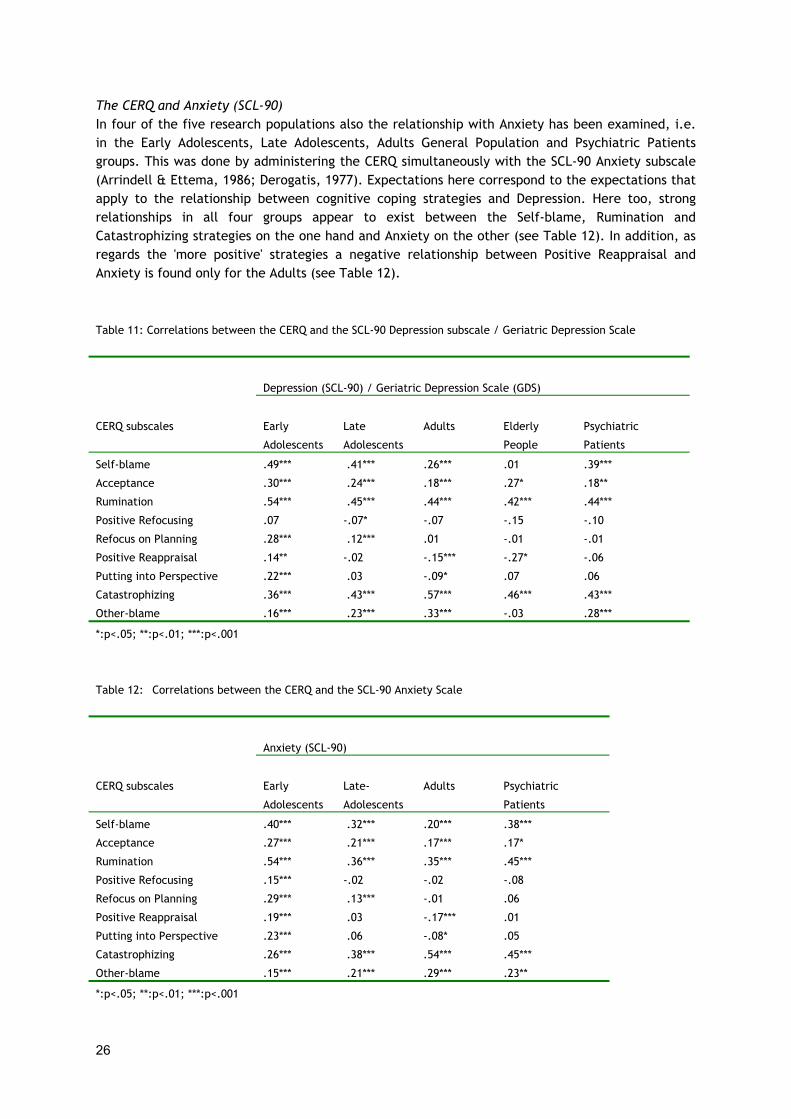
The CERQ and Depression (SCL-90/GDS)In all five research populations the relationship with depression has been examined. For the EarlyAdolescents, Late Adolescents, Adults General Population and Psychiatric Patients this was done byadministering the CERQ simultaneously with the Depression subscale of the SCL-90 (Arrindell &Ettema, 1986; Derogatis, 1977). Only for the Elderly People depression has been measured with theuse of the GDS (Geriatric Depression Scale: Brink, Yesavage, Heersema, Adey & Rose, 1982) insteadof the SCL-90.Relationships in the various populations are expected to correspond more or less. It is also expectedthat the less functional strategies will correlate negatively to Depression, while the more functionalstrategies will show a positive correlationship. On the whole, strong relationships appear to existbetween the Self-Blame (Elderly People excepted), Rumination and Catastrophizing strategies onthe one hand and Depression on the other hand. Regarding the 'more positive' strategies theexpectation is confirmed only for Adults and Elderly People that Positive Reappraisal has a negativerelationship with the measure of depression (see Table 11).
26
The CERQ and Anxiety (SCL-90)In four of the five research populations also the relationship with Anxiety has been examined, i.e.in the Early Adolescents, Late Adolescents, Adults General Population and Psychiatric Patientsgroups. This was done by administering the CERQ simultaneously with the SCL-90 Anxiety subscale(Arrindell & Ettema, 1986; Derogatis, 1977). Expectations here correspond to the expectations thatapply to the relationship between cognitive coping strategies and Depression. Here too, strongrelationships in all four groups appear to exist between the Self-blame, Rumination andCatastrophizing strategies on the one hand and Anxiety on the other (see Table 12). In addition, asregards the 'more positive' strategies a negative relationship between Positive Reappraisal andAnxiety is found only for the Adults (see Table 12).
Table 11: Correlations between the CERQ and the SCL-90 Depression subscale / Geriatric Depression Scale
Depression (SCL-90) / Geriatric Depression Scale (GDS)
CERQ subscales Early
Adolescents
Late
Adolescents
Adults Elderly
People
Psychiatric
Patients
Self-blame .49*** .41*** .26*** .01 .39***
Acceptance .30*** .24*** .18*** .27* .18**
Rumination .54*** .45*** .44*** .42*** .44***
Positive Refocusing .07 -.07* -.07 -.15 -.10
Refocus on Planning .28*** .12*** .01 -.01 -.01
Positive Reappraisal .14** -.02 -.15*** -.27* -.06
Putting into Perspective .22*** .03 -.09* .07 .06
Catastrophizing .36*** .43*** .57*** .46*** .43***
Other-blame .16*** .23*** .33*** -.03 .28***
*:p<.05; **:p<.01; ***:p<.001
Table 12: Correlations between the CERQ and the SCL-90 Anxiety Scale
Anxiety (SCL-90)
CERQ subscales Early
Adolescents
Late-
Adolescents
Adults Psychiatric
Patients
Self-blame .40*** .32*** .20*** .38***
Acceptance .27*** .21*** .17*** .17*
Rumination .54*** .36*** .35*** .45***
Positive Refocusing .15*** -.02 -.02 -.08
Refocus on Planning .29*** .13*** -.01 .06
Positive Reappraisal .19*** .03 -.17*** .01
Putting into Perspective .23*** .06 -.08* .05
Catastrophizing .26*** .38*** .54*** .45***
Other-blame .15*** .21*** .29*** .23**
*:p<.05; **:p<.01; ***:p<.001
27
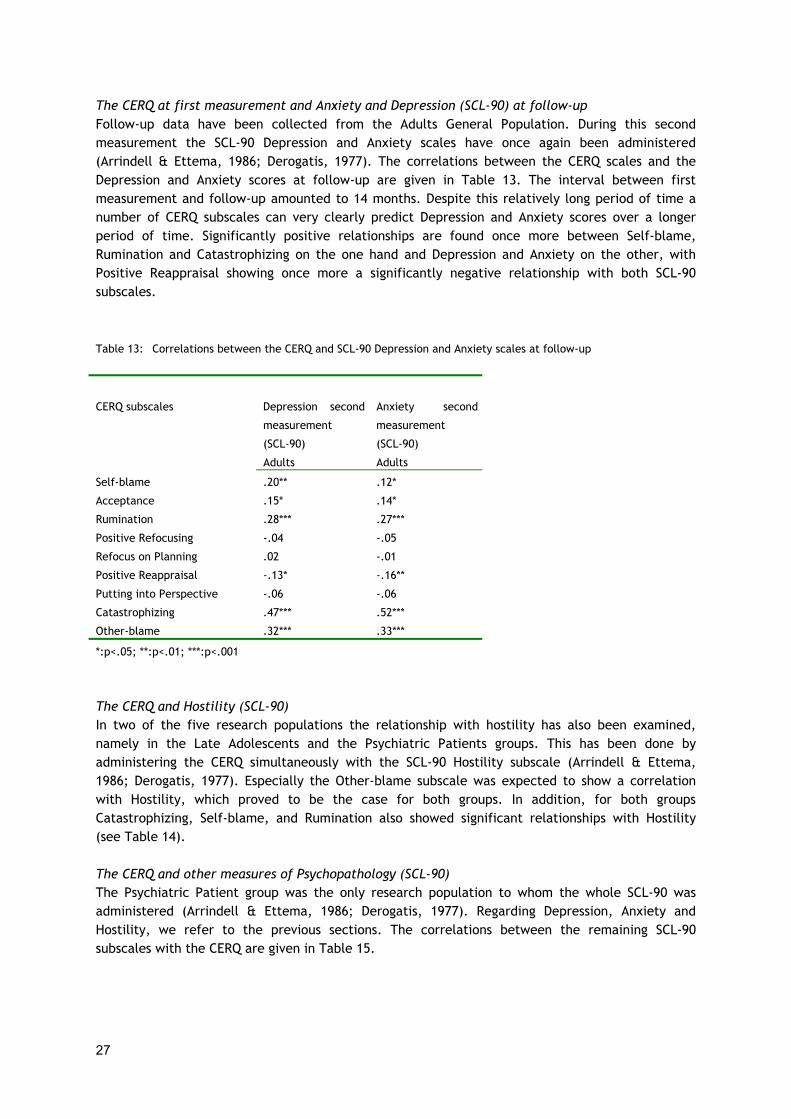
The CERQ at first measurement and Anxiety and Depression (SCL-90) at follow-upFollow-up data have been collected from the Adults General Population. During this secondmeasurement the SCL-90 Depression and Anxiety scales have once again been administered(Arrindell & Ettema, 1986; Derogatis, 1977). The correlations between the CERQ scales and theDepression and Anxiety scores at follow-up are given in Table 13. The interval between firstmeasurement and follow-up amounted to 14 months. Despite this relatively long period of time anumber of CERQ subscales can very clearly predict Depression and Anxiety scores over a longerperiod of time. Significantly positive relationships are found once more between Self-blame,Rumination and Catastrophizing on the one hand and Depression and Anxiety on the other, withPositive Reappraisal showing once more a significantly negative relationship with both SCL-90subscales.
Table 13: Correlations between the CERQ and SCL-90 Depression and Anxiety scales at follow-up
CERQ subscales Depression second
measurement
(SCL-90)
Adults
Anxiety second
measurement
(SCL-90)
Adults
Self-blame .20** .12*
Acceptance .15* .14*
Rumination .28*** .27***
Positive Refocusing -.04 -.05
Refocus on Planning .02 -.01
Positive Reappraisal -.13* -.16**
Putting into Perspective -.06 -.06
Catastrophizing .47*** .52***
Other-blame .32*** .33***
*:p<.05; **:p<.01; ***:p<.001
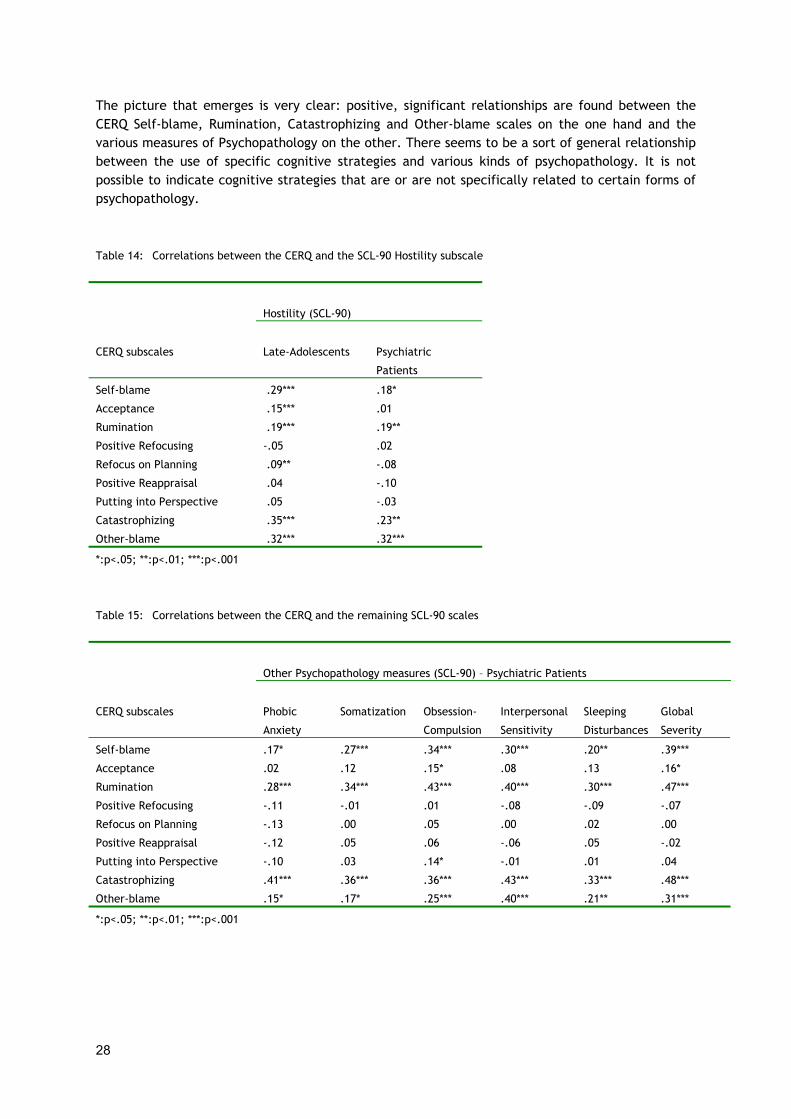
The CERQ and Hostility (SCL-90)In two of the five research populations the relationship with hostility has also been examined,namely in the Late Adolescents and the Psychiatric Patients groups. This has been done byadministering the CERQ simultaneously with the SCL-90 Hostility subscale (Arrindell & Ettema,1986; Derogatis, 1977). Especially the Other-blame subscale was expected to show a correlationwith Hostility, which proved to be the case for both groups. In addition, for both groupsCatastrophizing, Self-blame, and Rumination also showed significant relationships with Hostility(see Table 14).
The CERQ and other measures of Psychopathology (SCL-90)The Psychiatric Patient group was the only research population to whom the whole SCL-90 wasadministered (Arrindell & Ettema, 1986; Derogatis, 1977). Regarding Depression, Anxiety andHostility, we refer to the previous sections. The correlations between the remaining SCL-90subscales with the CERQ are given in Table 15.
28
The picture that emerges is very clear: positive, significant relationships are found between theCERQ Self-blame, Rumination, Catastrophizing and Other-blame scales on the one hand and thevarious measures of Psychopathology on the other. There seems to be a sort of general relationshipbetween the use of specific cognitive strategies and various kinds of psychopathology. It is notpossible to indicate cognitive strategies that are or are not specifically related to certain forms ofpsychopathology.
Table 14: Correlations between the CERQ and the SCL-90 Hostility subscale
Hostility (SCL-90)
CERQ subscales Late-Adolescents Psychiatric
Patients
Self-blame .29*** .18*
Acceptance .15*** .01
Rumination .19*** .19**
Positive Refocusing -.05 .02
Refocus on Planning .09** -.08
Positive Reappraisal .04 -.10
Putting into Perspective .05 -.03
Catastrophizing .35*** .23**
Other-blame .32*** .32***
*:p<.05; **:p<.01; ***:p<.001
Table 15: Correlations between the CERQ and the remaining SCL-90 scales
Other Psychopathology measures (SCL-90) – Psychiatric Patients
CERQ subscales Phobic
Anxiety
Somatization Obsession-
Compulsion
Interpersonal
Sensitivity
Sleeping
Disturbances
Global
Severity
Self-blame .17* .27*** .34*** .30*** .20** .39***
Acceptance .02 .12 .15* .08 .13 .16*
Rumination .28*** .34*** .43*** .40*** .30*** .47***
Positive Refocusing -.11 -.01 .01 -.08 -.09 -.07
Refocus on Planning -.13 .00 .05 .00 .02 .00
Positive Reappraisal -.12 .05 .06 -.06 .05 -.02
Putting into Perspective -.10 .03 .14* -.01 .01 .04
Catastrophizing .41*** .36*** .36*** .43*** .33*** .48***
Other-blame .15* .17* .25*** .40*** .21** .31***
*:p<.05; **:p<.01; ***:p<.001
29
Chapter 5Standardization of the CERQ
Interpreting the CERQ scale scores
To all CERQ scales it applies that the higher the score on a specific subscale, the more the personin question uses this cognitive coping strategy. Of course, in different research populationsdifferent means and standard deviations are found. In the following section on group differencesthese data of the different norm groups are represented.
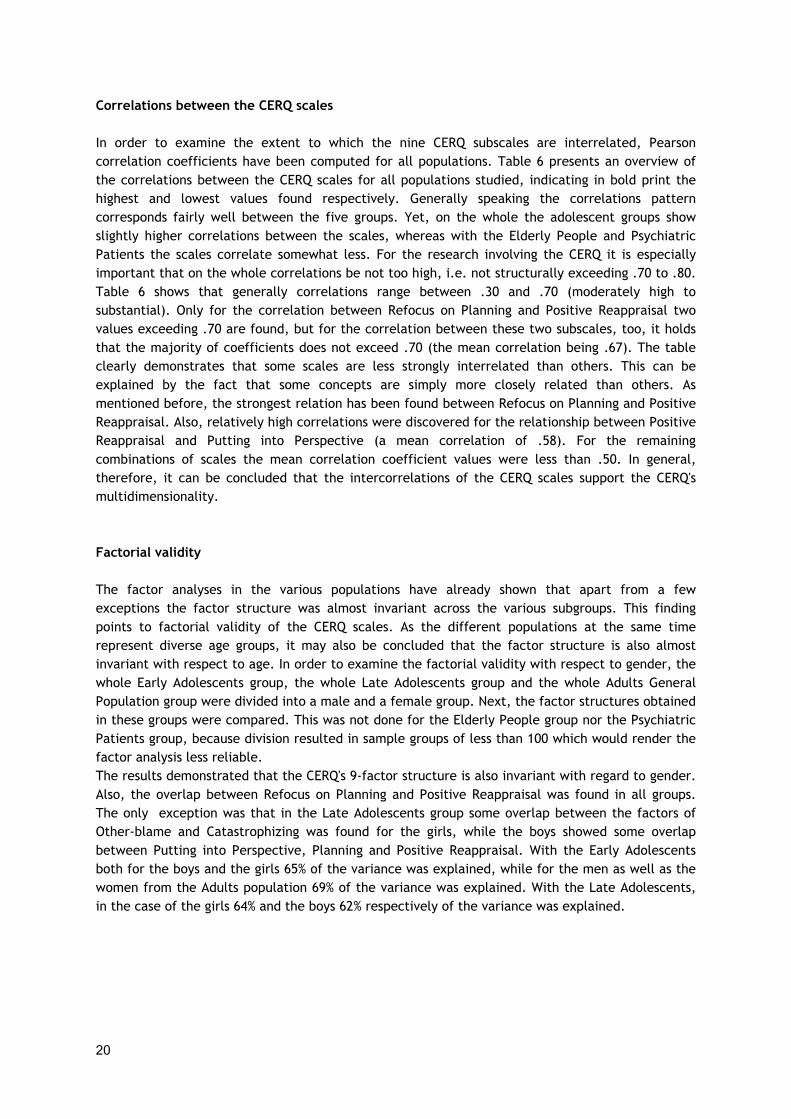
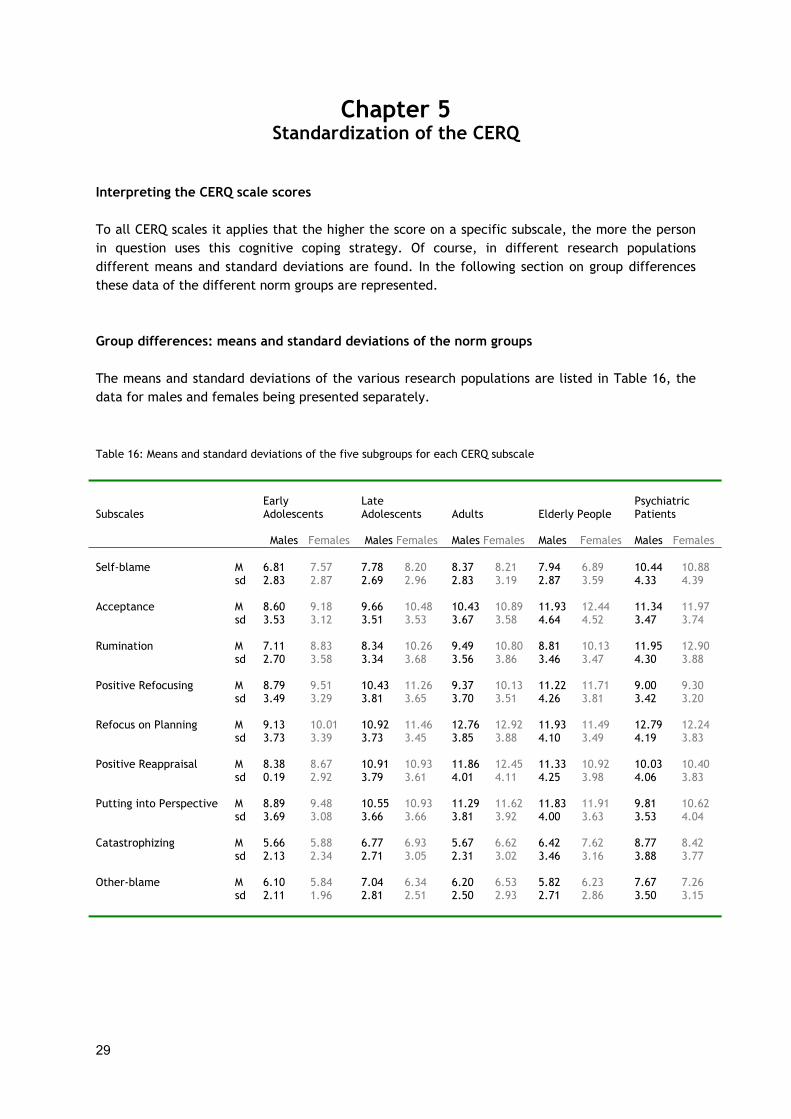
Group differences: means and standard deviations of the norm groups
The means and standard deviations of the various research populations are listed in Table 16, thedata for males and females being presented separately.
Table 16: Means and standard deviations of the five subgroups for each CERQ subscale
SubscalesEarlyAdolescents
LateAdolescents Adults Elderly People
PsychiatricPatients
Males Females Males Females Males Females Males Females Males Females
Self-blame M 6.81 7.57 7.78 8.20 8.37 8.21 7.94 6.89 10.44 10.88sd 2.83 2.87 2.69 2.96 2.83 3.19 2.87 3.59 4.33 4.39
Acceptance M 8.60 9.18 9.66 10.48 10.43 10.89 11.93 12.44 11.34 11.97sd 3.53 3.12 3.51 3.53 3.67 3.58 4.64 4.52 3.47 3.74
Rumination M 7.11 8.83 8.34 10.26 9.49 10.80 8.81 10.13 11.95 12.90sd 2.70 3.58 3.34 3.68 3.56 3.86 3.46 3.47 4.30 3.88
Positive Refocusing M 8.79 9.51 10.43 11.26 9.37 10.13 11.22 11.71 9.00 9.30sd 3.49 3.29 3.81 3.65 3.70 3.51 4.26 3.81 3.42 3.20
Refocus on Planning M 9.13 10.01 10.92 11.46 12.76 12.92 11.93 11.49 12.79 12.24sd 3.73 3.39 3.73 3.45 3.85 3.88 4.10 3.49 4.19 3.83
Positive Reappraisal M 8.38 8.67 10.91 10.93 11.86 12.45 11.33 10.92 10.03 10.40sd 0.19 2.92 3.79 3.61 4.01 4.11 4.25 3.98 4.06 3.83
Putting into Perspective M 8.89 9.48 10.55 10.93 11.29 11.62 11.83 11.91 9.81 10.62sd 3.69 3.08 3.66 3.66 3.81 3.92 4.00 3.63 3.53 4.04
Catastrophizing M 5.66 5.88 6.77 6.93 5.67 6.62 6.42 7.62 8.77 8.42sd 2.13 2.34 2.71 3.05 2.31 3.02 3.46 3.16 3.88 3.77
Other-blame M 6.10 5.84 7.04 6.34 6.20 6.53 5.82 6.23 7.67 7.26sd 2.11 1.96 2.81 2.51 2.50 2.93 2.71 2.86 3.50 3.15

30
Comparison between the various groups clearly shows that the mean CERQ scale values can clearlydistinguish between the diverse research populations. The general picture emerging from the tableis that on the whole Late Adolescents make more use of the diverse cognitive coping strategiesthan Early Adolescents and that in turn Adults make more use of the majority of cognitive copingstrategies than Late Adolescents. Exceptions are the Positive Refocusing, Catastrophizing andOther-blame strategies, the use of which seems to have decreased somewhat in adulthood. To bothEarly and Late Adolescents it applies that females make more use of all strategies, except forOther-blame. Although the distinction between males and females seems to decrease as they growolder, females keep making use of the majority of strategies more often than males. This does nothold for Self-Blame. For Adults, aged 18-to-65 years, males report this strategy more often thanfemales. With the Elderly People, the use of some cognitive strategies seems to decrease, whereasothers are reported more often. For instance, there is less Self-Blame and Rumination, as opposedto more Acceptance and Positive Refocusing. Still, a difference between males and females remainsvisible. With the Psychiatric Patients the gender differences seem to be smaller. Compared to theAdults General Population norm group the Psychiatric Patients group score considerably higher on –among other things – the Self-Blame, Rumination and Catastrophizing strategies, whereas theymake less use of the Positive Refocusing, Positive Reappraisal and Putting into Perspectivestrategies.
Standardization
In order to assess whether an individual uses a specific strategy more or less often in comparison toother people, his or her raw score will have to be compared to the mean scores of the people in thepopulation comparable to him or her, the so-called norm group. The five research populations, i.e.the Early Adolescents, the Late Adolescents, the Adults General Population, the Elderly People andthe Psychiatric Patients, are used as norm groups. For further descriptions of these norm groups werefer to Chapter 3. For the females and males in these populations separate tables have beenmade. Therefore, there are ten different tables in all. These norm tables are listed at the end ofthis chapter, in the Appendix. How the norm tables have been developed and how they are to beread, will be discussed in the following sections.As for the interpretation regarding content as well as the practical meaning of the CERQ scales werefer to the section 'Interpretation of scores on the CERQ scales' further on in this chapter.
Norm tables
Norm tables are made up by converting the distribution of raw scores in a specific researchpopulation into normalised standard scores. In this case the t-distribution has been used. For theconversion into t-scores, the raw scores are sorted out marking exactly those percentages belongingto the standard score units in a normal distribution. In a t-distribution a mean of 50 and a standarddeviation of 10 are assumed. Each t-score represents a specific raw score, with the correspondingpercentage showing the chance of someone scoring less than or the same as the score in question.A t-score of 50 corresponds to a (cumulative) chance of 50%. I.e., there is a 50% chance thatsomeone will obtain this score or less. A t-score of 30 matches 2 per cent. This indicates thatsomeone belongs to the bottom 2% who score such a low value. A cumulative chance percentage of98 corresponds to a t-score of 70. I.e., when a person obtains this score, he or she belongs to theuppermost 2% (100% minus 98%) who obtain such a high score, in other words 98% of the individualshave scored less.
31
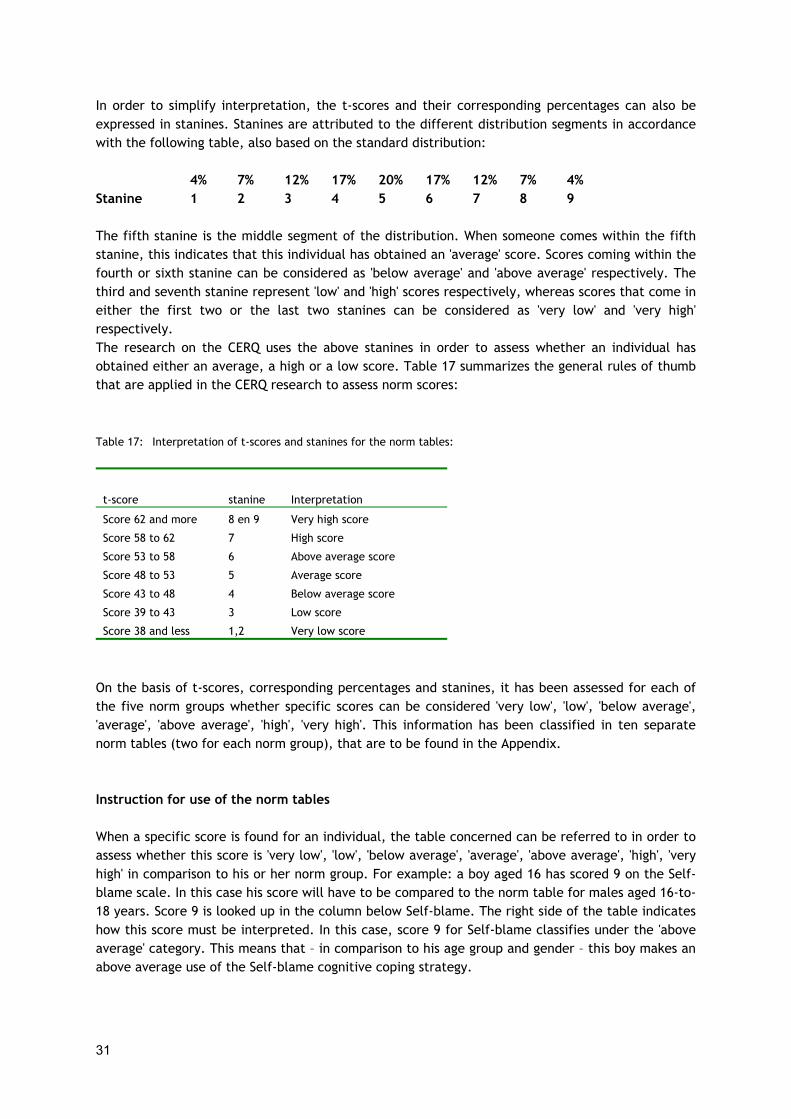
In order to simplify interpretation, the t-scores and their corresponding percentages can also beexpressed in stanines. Stanines are attributed to the different distribution segments in accordancewith the following table, also based on the standard distribution:
4% 7% 12% 17% 20% 17% 12% 7% 4%Stanine 1 2 3 4 5 6 7 8 9
The fifth stanine is the middle segment of the distribution. When someone comes within the fifthstanine, this indicates that this individual has obtained an 'average' score. Scores coming within thefourth or sixth stanine can be considered as 'below average' and 'above average' respectively. Thethird and seventh stanine represent 'low' and 'high' scores respectively, whereas scores that come ineither the first two or the last two stanines can be considered as 'very low' and 'very high'respectively.The research on the CERQ uses the above stanines in order to assess whether an individual hasobtained either an average, a high or a low score. Table 17 summarizes the general rules of thumbthat are applied in the CERQ research to assess norm scores:
Table 17: Interpretation of t-scores and stanines for the norm tables:
t-score stanine Interpretation
Score 62 and more 8 en 9 Very high score
Score 58 to 62 7 High score
Score 53 to 58 6 Above average score
Score 48 to 53 5 Average score
Score 43 to 48 4 Below average score
Score 39 to 43 3 Low score
Score 38 and less 1,2 Very low score
On the basis of t-scores, corresponding percentages and stanines, it has been assessed for each ofthe five norm groups whether specific scores can be considered 'very low', 'low', 'below average','average', 'above average', 'high', 'very high'. This information has been classified in ten separatenorm tables (two for each norm group), that are to be found in the Appendix.
Instruction for use of the norm tables
When a specific score is found for an individual, the table concerned can be referred to in order toassess whether this score is 'very low', 'low', 'below average', 'average', 'above average', 'high', 'veryhigh' in comparison to his or her norm group. For example: a boy aged 16 has scored 9 on the Self-blame scale. In this case his score will have to be compared to the norm table for males aged 16-to-18 years. Score 9 is looked up in the column below Self-blame. The right side of the table indicateshow this score must be interpreted. In this case, score 9 for Self-blame classifies under the 'aboveaverage' category. This means that – in comparison to his age group and gender – this boy makes anabove average use of the Self-blame cognitive coping strategy.

32
Interpretation of scores on the CERQ scales
For all cognitive coping strategies high scores refer to frequent use of a specific strategy, whereaslow scores refer to less frequent use of this strategy. Whether a specific score found is high or lowin comparison to the norm group concerned, can be looked up in the norm tables. However, it isalways important, too, to set the score levels alongside the nature and seriousness of the eventsexperienced. Therefore, the norm tables should be considered especially as a means to assess thedegree to which an individual deviates from others with regard to his or her cognitive copingstrategies. The final decision about the extent to which it holds that for a certain individual it isimportant to learn or unlearn specific cognitive coping strategies, will always have to be takenfrom individual circumstances, taking into account the current context and problems. Below, theinterpretation as regards content of the nine different CERQ subscales is given.
Self-blameSelf-blame is a cognitive coping strategy in which thoughts are central of holding yourselfresponsible for what you have experienced, putting the blame and/or the cause for what happenedon yourself and being preoccupied with thoughts about the mistakes you yourself have made. Whensomeone has obtained a high score on Self-blame, it means that this person is highly preoccupiedwith his or her sense of guilt. A low score on Self-blame means that one is preoccupied to a lowextent with his or her sense of guilt.A high extent of preoccupation with guilt can possibly be connected with symptoms ofpsychopathology.
AcceptanceAcceptance refers to thoughts where you resign yourself to what has happened and accept it,thinking that it cannot be changed and life goes on. A high score refers to the frequent use ofAcceptance as a strategy. A low score refers to a less frequent use of this strategy. Although initself Acceptance is a good process for most events, a very high level of Acceptance may alsoindicate a sort of resignation in the sense of not feeling able anymore to influence events, anegative feeling of 'not being able to change things anyhow'. A high level of Acceptance maytherefore refer to a negative form of resigning to the situation. In that case, a high score onAcceptance could be connected to symptoms of psychopathology.A low score on Acceptance, too, could be related to symptoms of psychopathology, certainly whenthe latter can be connected to undigested events.
RuminationRumination refers to thinking all the time of and/or being preoccupied with the feelings andthoughts associated with the negative event. A high score refers to the frequent use of Ruminationas a strategy. A low score refers to a less frequent use of this strategy. In processing negative lifeevents, a certain extent of Rumination is not uncommon. A high score on Rumination, however, isalmost certainly connected with having emotional problems or symptoms of psychopathology.

33
Positive RefocusingThis concept refers to thinking about other, pleasant matters instead of the event in question. Ahigh score refers to a frequent use of this strategy. A low score refers to a less frequent use of thisstrategy. In general, research has shown that this strategy in itself may have a positive effect onpeople's well being. In other words: a low score on Positive Refocusing could be related to a lowsense of emotional well being.
Refocus on PlanningRefocus on Planning refers to thinking about which steps to take in order to deal with the event orthinking up a plan to change the situation. A high score refers to the frequent use of this strategy.A low score refers to a less frequent use of this strategy. Essentially this is considered to be apositive cognitive coping strategy, provided that the problem is actually dealt with. If an individualscores high on this strategy, without acting, a high score could possibly be connected withemotional problems (thoughts without action). On the other hand, a very low score on Refocus onPlanning is almost certainly related to the presence of problems.
Positive ReappraisalThis strategy refers to mentally attributing a positive meaning to an event in terms of personalgrowth, thinking that the event makes you stronger, looking for the positive sides of an event. Ahigh score refers to the frequent use of Positive Reappraisal as a strategy. A low score refers to theless frequent use of this strategy. Basically, this is seen as a positive coping strategy, but here, too,it is only true provided that at the same time something is actually done about the problem athand. When an individual scores high on this strategy, without taking action, a high score couldpossibly be connected with emotional problems.A low degree of Positive Reappraisal could also be connected with problems.
Putting into PerspectivePutting into Perspective refers to thoughts that play down the seriousness of the event whencompared to other events and to emphasising in your mind that there are worse things in the world.A high score refers to the frequent use of Putting into Perspective as a strategy. A low score refersto a less frequent use of this strategy.
CatastrophizingCatastrophizing refers to recurring thoughts about how terrible the event has been and about whatyou have gone through being the worst thing to happen to a person, much worse than what othersexperience. A high score refers to a frequent use of Catastrophizing as a strategy. A low scorerefers to a less frequent use of this strategy. Generally speaking it applies that a high score onCatastrophizing is almost certainly related with having emotional problems or symptoms ofpsychopathology.
Other-blameOther-blame refers to thoughts of putting the blame for what you have experienced on others,holding others responsible for what has happened and/or thinking about the mistakes others havemade in this respect. A high score refers to the frequent use of this strategy. A low score refers tothe less frequent use of this strategy.

34

35
References
Allan, S., & Gilbert, P. (1995). A social comparison scale: psychometric properties and relationshipto psychopathology. Personality and Individual Differences, 19, 293-299.
Anderson, C. A., Miller, R. S., Riger, A. L., Dill, J. C., & Sedikides, C. (1994). Behavioral andcharacterological styles as predictors of depression and loneliness: review, refinement, andtest. Journal of Personality and Social Psychology, 66, 549-558.
Arrindell, W. A., & Ettema, J. H. M. (1986). SCL-90. Manual for a multidimensional indicator ofPsychopathology (Handleiding bij een multidimensionele psychopathologie-indicator). Lisse,The Netherlands: Swets & Zeitlinger.
Brink, T.L., Yesavage, J.A., Heersema, P.H., Adey, M. & Rose, T.L. (1982). Screening tests forgeriatric depression. Clinical Gerontologist, 1, 37-43.
Carver, C. S., Scheier, M. F., & Weintraub, J. K. (1989). Assessing coping strategies: a theoreticallybased approach. Journal of Personality and Social Psychology, 56, 267-283.
Compas, B.E., Connor-Smith, J.K., Saltzman, H., Harding Thomsen, A. & Wadsworth, M.E. (2001).Coping with stress during Childhood and Adolescence: problems, progress and potential intheory and research. Psychological Bulletin, 127, 87-127.
Compas, B. E., Orosan, P. G., & Grant, K. E. (1993). Adolescent stress and coping: Implications forpsychopathology during adolescence. Journal of Adolescence, 16, 331-349.
Derogatis, L. R. (1977). SCL-90: Administration, Scoring and Procedures Manual-I for the R(evised)Version. Baltimore: John Hopkins University School of Medicine, Clinical PsychometricsResearch Unit.
Endler, N. S. & Parker, J. D. A. (1990). Multidimensional assessment of coping: a critical evaluation.Journal of Personality and Social Psychology, 58, 844-854.
Folkman, S., & Lazarus, R. S. (1988). Manual of the Ways of Coping Questionnaire. Palo Alto:Consulting Psychologists Press.
------, N., Boon, S. & Kraaij, V. (2003). Relationships between cognitive strategies of adolescents anddepressive symptomatology across different types of life events. Journal of Jouth andAdolescence, 32,401-408.
Garnefski, N., van den Kommer, T., Kraaij, V., Teerds, J., Legerstee, J., & Onstein, E. (2002a). Therelationship between cognitive emotion regulation strategies and emotional problems.European Journal of Personality, 16, 403-420.
Garnefski, N., Kraaij, V. & Spinhoven, Ph. (2001a). Negative life events, cognitive emotion regulationand depression. Personality and Individual Differences, 30, 1311-1327.
Garnefski, N., Kraaij, V. & Spinhoven, Ph. (2001b). The relationship between cognitive copingstrategies and symptoms of depression, anxiety and suicidality (De relatie tussen cognitievecopingstrategieën en symptomen van depressie, angst en suïcidaliteit). Gedrag enGezondheid, 29, 166-176.
Garnefski, N., Kraaij, V. & Spinhoven, Ph. (2002b). Manual for the use of the Cognitive EmotionRegulation Questionnaire: Dutch Version (Handleiding voor het gebruik van de CognitiveEmotion Regulation Questionnaire). Leiderdorp, The Netherlands: DATEC
Garnefski, N., Legerstee, J., Kraaij, V., Van den Kommer, T., & Teerds, J. (2002c). Cognitive copingstrategies and symptoms of depression and anxiety: a comparison between adolescents andadults. Journal of Adolescence, 25, 603-611.
Garnefski, N., Teerds, J. , Kraaij, V., Legerstee, J. & Van den Kommer, T. (2003). Cognitiveemotion regulation strategies and depressive symptoms: differences between males andfemales. Personality and Individual Differences, 25, 603-611.
Hoekstra, H.A., Ormel, J. & de Fruyt, F. (1996). NEO Personality Questionaires: Manual (NEOPersoonlijkheids vragenlijsten: Handleiding). Lisse: Swets & Zeitlinger.

36
Holahan, C. J., Moos, R. H., & Schaeffer, J. A. (1996). Coping, stress resistance and growth:Conceptualizing adaptive functioning. In: M. Zeidner & N.S. Endler (Eds). Handbook ofcoping. New York: John Wiley & Sons, Inc.
Kraaij, V., Garnefski, N. & van Gerwen, L. (2003). Cognitive coping and anxiety symptoms amongPeople who seek help for fear of flying. Aviation, Space, and Environmental Medicine, 74,273-277.
Kraaij, V., Garnefski, N., Wilde, E.J. de, Dijkstra, A., Gebhardt, W., Maes, S., & Doest, L. ter(2003). Negative life events and depressive symptoms in late adolescence: Bonding andcognitive coping as vulnerability factors? Journal of Youth and Adolescence, 32, 185-193.
Kraaij, V., Pruymboom, E., & Garnefski, N. (2002). Cognitive coping and depressive symptoms inthe elderly: A longitudinal study. Aging & Mental Health, 6, 275-281.
Lazarus, R. & Folkman, S. (1984). Stress, appraisal and coping. New York: Springer.Monat, A., & Lazarus, R. S. (1991). Stress and coping: an anthology. New York: Columbia University
Press.Nolen-Hoeksema, S. , Parker, L. E., & Larson, J. (1994). Ruminative coping with depressed mood
following loss. Journal of Personality and Social Psychology, 67, 92-104.Rosenberg (1965). Society and the Adolescent Self-Image. Princeton, New Jersey: Princeton
University Press.Schwarzer, R. (1993). Measurement of perceived self-efficacy. Psychometric scales for cross-
cultural research. Berlin, Germany: Freie Universität Berlin.Spirito, A., Stark, L. J., & Williams, C. (1988). Development of a brief coping checklist for use with
pediatric populations. Journal of Pediatric Psychology, 13, 555-574.Sullivan, M. J. L., Bishop, S. R.,& Pivik, J. (1995). The Pain Catastrophizing Scale: development and
validation. Psychological Assessment, 7, 524-532.Tennen, H., & Affleck, G. (1990). Blaming others for threatening events. Psychological Bulletin,
108, 209-232.Thoits, P. A. (1995). Stress, coping, and social support processes: Where are we? What next?
Journal of Health and Social Behavior, (Extra Issue), 53-79.Thompson, R. A. (1991). Emotional regulation and emotional development. Educational Psychology
Review, 3, 269-307.
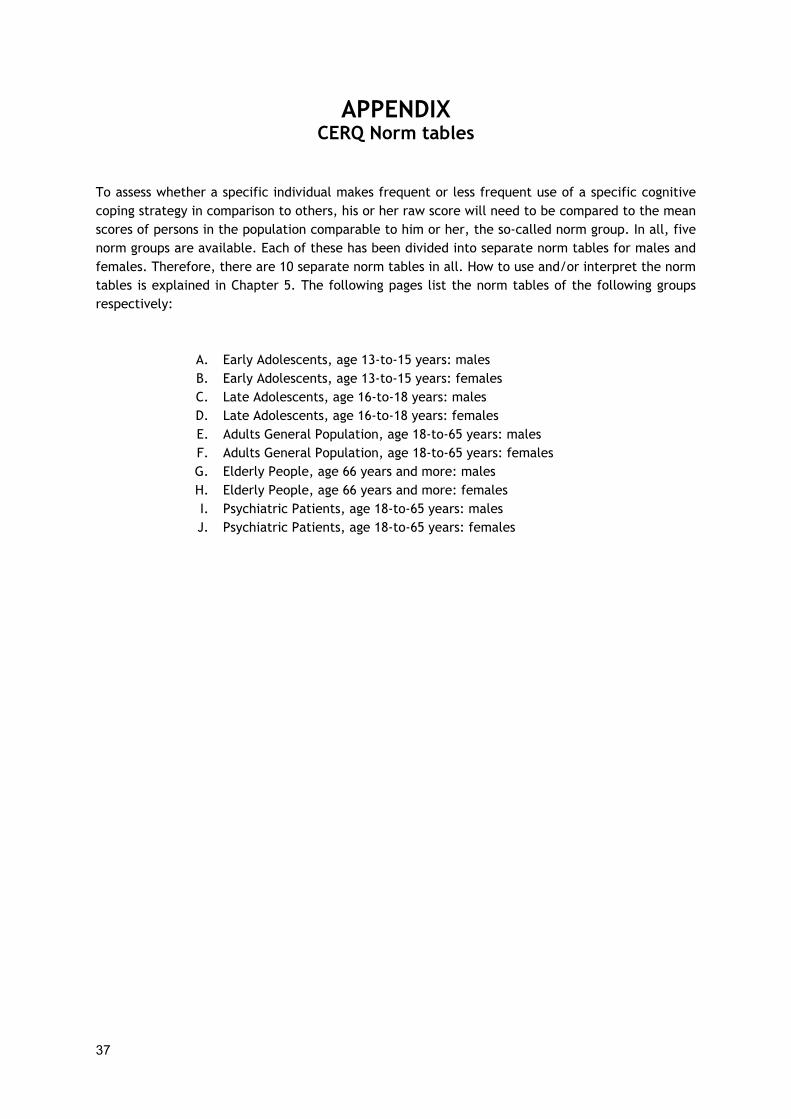
37
APPENDIXCERQ Norm tables
To assess whether a specific individual makes frequent or less frequent use of a specific cognitivecoping strategy in comparison to others, his or her raw score will need to be compared to the meanscores of persons in the population comparable to him or her, the so-called norm group. In all, fivenorm groups are available. Each of these has been divided into separate norm tables for males andfemales. Therefore, there are 10 separate norm tables in all. How to use and/or interpret the normtables is explained in Chapter 5. The following pages list the norm tables of the following groupsrespectively:
A. Early Adolescents, age 13-to-15 years: malesB. Early Adolescents, age 13-to-15 years: femalesC. Late Adolescents, age 16-to-18 years: malesD. Late Adolescents, age 16-to-18 years: femalesE. Adults General Population, age 18-to-65 years: malesF. Adults General Population, age 18-to-65 years: femalesG. Elderly People, age 66 years and more: malesH. Elderly People, age 66 years and more: females I. Psychiatric Patients, age 18-to-65 years: malesJ. Psychiatric Patients, age 18-to-65 years: females

38
A. Norm group Early Adolescents age 13-to-15 years: males
P(z
< z)
t-sco
re
stan
ine
dist
ance
to M
(sd)
Self-
blam
e
Acce
ptan
ce
Rum
inat
ion
Posi
tive
Ref
ocus
ing
Ref
ocus
on
Plan
ning
Posi
tive
Rea
ppra
isal
Putti
ng in
toPe
rspe
ctiv
e
Cat
astro
phiz
ing
Oth
er-b
lam
e
%ile t s M+sd99 80 9 +3s99 79 999 78 9 20 >15 >1699 77 999 76 9 20 20 >19 >1899 75 9 18-19 20 14 13-1599 74 9 >1599 73 9 17 19 1999 72 9 18 18 19 13 1298 71 9 16 17 16-17 1898 70 9 +2s 17-18 14 17 1297 69 9 15 1196 68 9 13 16 15 17 1196 67 9 14 16 16 1695 66 8 13 12 14 10 1093 65 8 12 15 15 1592 64 8 15 13 990 63 8 11 14 11 14 14 988 62 8 10 14
Very high
86 61 7 13 13 13 1284 60 7 +1s 9 10 13 882 59 7 12 12 12 11 12 879 58 7
High
76 57 6 11 9 11 11 773 56 6 8 11 1069 55 6 10 10 766 54 6 8 10 662 53 6 7 9 10 9
AboveAverage
58 52 5 9 954 51 5 7 5 650 50 5 0 9 846 49 5 6 8 8 842 48 5
Average
38 47 4 6 8 534 46 4 7 7 7 731 45 4 527 44 4 5 724 43 4 6 6 6
BelowAverage
21 42 3 6 6 418 41 3 516 40 3 -1s 5 414 39 3 5 5
Low
12 38 2 4 510 37 2 48 36 27 35 2 4 46 34 24 33 2 4 44 32 13 31 1 42 30 1 -2s2 29 11 28 11 25 1
Very Low

39
B. Norm group Early Adolescents age 13-to15 years: females
P(z
< z)
t-sco
re
stan
ine
dist
ance
to M
(sd)
Self-
blam
e
Acce
ptan
ce
Rum
inat
ion
Posi
tive
Ref
ocus
ing
Ref
ocus
on
Plan
ning
Posi
tive
Rea
ppra
isal
Putti
ng in
toPe
rspe
ctiv
e
Cat
astro
phiz
ing
Oth
er-b
lam
e
%ile t s M+sd99 80 9 +3s99 79 9 20 20 20 >17 >1599 78 999 77 9 >19 2099 76 9 19 20 18-19 1699 75 9 13-1499 74 9 18 19 14-1599 73 9 17-18 19 19 1799 72 9 1298 71 9 17 >1798 70 9 +2s 16 18 18 18 16 13 1197 69 9 15 16 1796 68 9 17 15 12 1096 67 9 14 1695 66 8 15 16 17 14 16 1193 65 8 13 15 10 992 64 8 12 14 15 16 13 1590 63 8 14 15 14 988 62 8 11 13 14
Very High
86 61 7 13 14 1284 60 7 +1s 10 13 13 8 882 59 7 1279 58 7 12 12 13 11 12
High
76 57 6 9 11 773 56 6 11 11 12 11 769 55 6 10 1066 54 6 10 11 1062 53 6 8 10 6 6
AboveAverage
58 52 5 9 954 51 5 9 9 10 950 50 5 046 49 5 7 8 9 542 48 5 8 5
Average
38 47 4 8 834 46 4 6 7 831 45 4 8 727 44 424 43 4 7
BelowAverage
21 42 3 6 718 41 3 5 7 6 7 416 40 3 -1s 6 414 39 3 5
Low
12 38 2 6 610 37 2 6 58 36 2 57 35 26 34 2 4 5 54 33 2 4 54 32 13 31 1 4 42 30 1 -2s2 29 1 41 28 1 41 25 1 4
Very Low
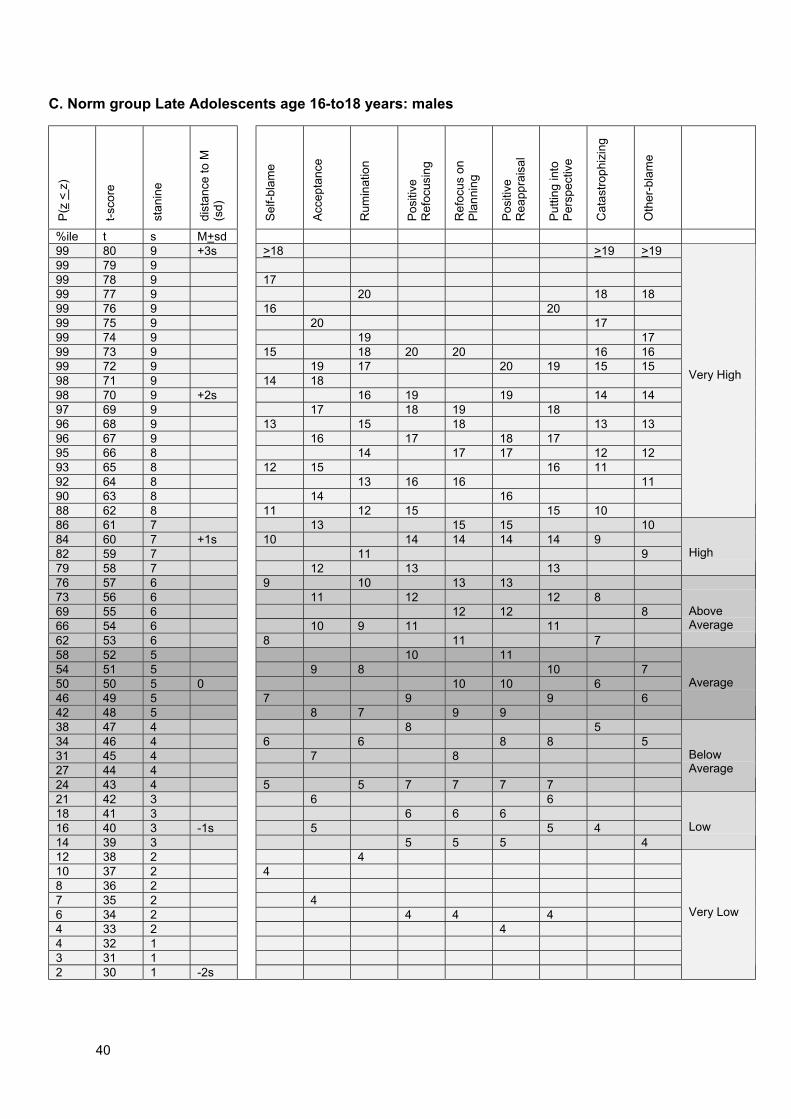
40
C. Norm group Late Adolescents age 16-to18 years: males
P(z
< z)
t-sco
re
stan
ine
dist
ance
to M
(sd)
Self-
blam
e
Acce
ptan
ce
Rum
inat
ion
Posi
tive
Ref
ocus
ing
Ref
ocus
on
Plan
ning
Posi
tive
Rea
ppra
isal
Putti
ng in
toPe
rspe
ctiv
e
Cat
astro
phiz
ing
Oth
er-b
lam
e
%ile t s M+sd99 80 9 +3s >18 >19 >1999 79 999 78 9 1799 77 9 20 18 1899 76 9 16 2099 75 9 20 1799 74 9 19 1799 73 9 15 18 20 20 16 1699 72 9 19 17 20 19 15 1598 71 9 14 1898 70 9 +2s 16 19 19 14 1497 69 9 17 18 19 1896 68 9 13 15 18 13 1396 67 9 16 17 18 1795 66 8 14 17 17 12 1293 65 8 12 15 16 1192 64 8 13 16 16 1190 63 8 14 1688 62 8 11 12 15 15 10
Very High
86 61 7 13 15 15 1084 60 7 +1s 10 14 14 14 14 982 59 7 11 979 58 7 12 13 13
High
76 57 6 9 10 13 1373 56 6 11 12 12 869 55 6 12 12 866 54 6 10 9 11 1162 53 6 8 11 7
AboveAverage
58 52 5 10 1154 51 5 9 8 10 750 50 5 0 10 10 646 49 5 7 9 9 642 48 5 8 7 9 9
Average
38 47 4 8 534 46 4 6 6 8 8 531 45 4 7 827 44 424 43 4 5 5 7 7 7 7
BelowAverage
21 42 3 6 618 41 3 6 6 616 40 3 -1s 5 5 414 39 3 5 5 5 4
Low
12 38 2 410 37 2 48 36 27 35 2 46 34 2 4 4 44 33 2 44 32 13 31 12 30 1 -2s
Very Low

41
D. Norm group Late Adolescents age 16-to-18 years: females
P(z
< z)
t-sco
re
stan
ine
dist
ance
to M
(sd)
Self-
blam
e
Acce
ptan
ce
Rum
inat
ion
Posi
tive
Ref
ocus
ing
Ref
ocus
on
Plan
ning
Posi
tive
Rea
ppra
isal
Putti
ng in
toPe
rspe
ctiv
e
Cat
astro
phiz
ing
Oth
er-b
lam
e
%ile t s M+sd99 80 9 +3s 2099 79 999 78 999 77 999 76 9 20 20 16-1999 75 9 20 20 2099 74 9 20 20 19 1599 73 9 2099 72 9 19 1898 71 9 17-18 19 17 1498 70 9 +2s 16 19 19 19 19 1697 69 9 15 18 19 1396 68 9 14 18 18 18 1596 67 9 18 14 1295 66 8 17 17 18 17 13 1193 65 8 13 17 17 12 1092 64 8 16 16 1790 63 8 12 16 16 1188 62 8 15 16 16 9
Very High
86 61 7 15 1084 60 7 +1s 11 14 15 15 1582 59 7 14 15 979 58 7 10 13 14 14 14 8
High
76 57 6 13 1473 56 6 12 13 13 869 55 6 9 12 13 13 1266 54 6 12 762 53 6 11 11 12 7
AboveAverage
58 52 5 12 1154 51 5 8 10 11 11 650 50 5 0 10 1146 49 5 10 10 10 642 48 5 9 9
Average
38 47 4 7 10 534 46 4 9 9 931 45 4 827 44 4 8 9 524 43 4 6 8 8
BelowAverage
21 42 3 7 818 41 3 816 40 3 -1s 7 7 7 414 39 3 5 6
Low
12 38 2 7 710 37 2 6 6 48 36 2 5 67 35 2 5 66 34 2 4 6 5 54 33 2 44 32 1 5 53 31 12 30 1 -2s 42 29 1 41 27 1 4 4 4
Very Low
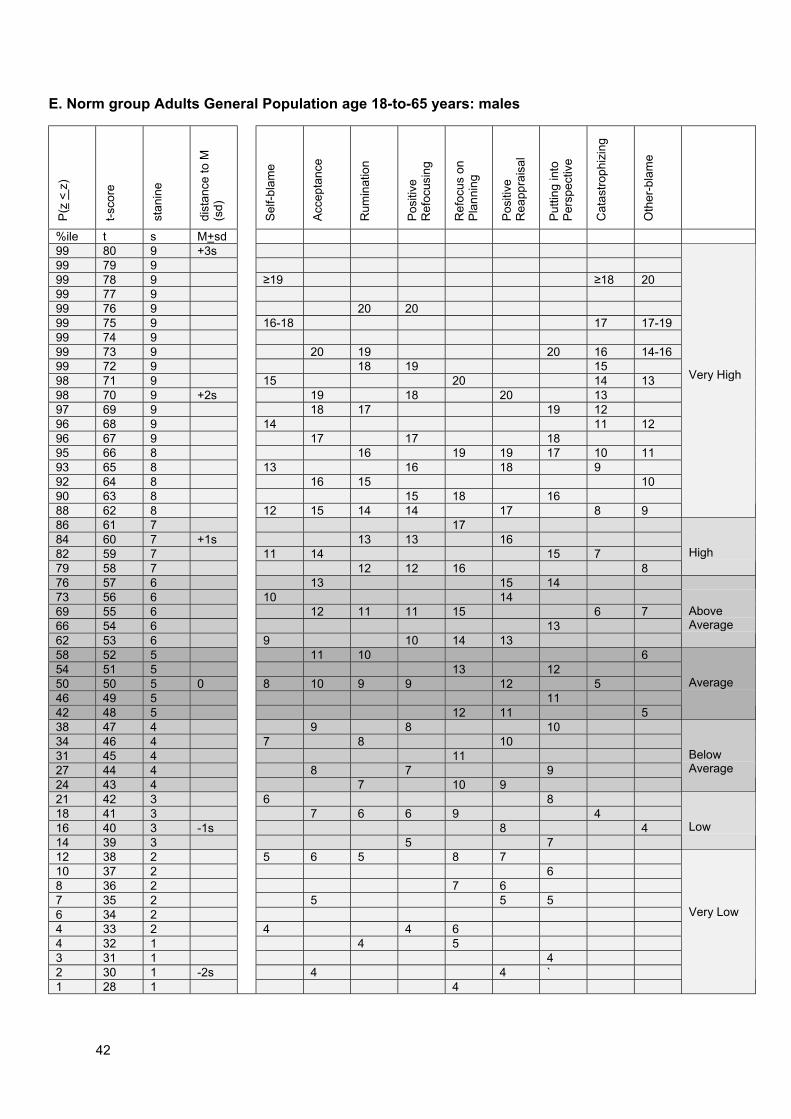
42
E. Norm group Adults General Population age 18-to-65 years: males
P(z
< z)
t-sco
re
stan
ine
dist
ance
to M
(sd)
Self-
blam
e
Acce
ptan
ce
Rum
inat
ion
Posi
tive
Ref
ocus
ing
Ref
ocus
on
Plan
ning
Posi
tive
Rea
ppra
isal
Putti
ng in
toPe
rspe
ctiv
e
Cat
astro
phiz
ing
Oth
er-b
lam
e
%ile t s M+sd99 80 9 +3s99 79 999 78 9 ≥19 ≥18 2099 77 999 76 9 20 2099 75 9 16-18 17 17-1999 74 999 73 9 20 19 20 16 14-1699 72 9 18 19 1598 71 9 15 20 14 1398 70 9 +2s 19 18 20 1397 69 9 18 17 19 1296 68 9 14 11 1296 67 9 17 17 1895 66 8 16 19 19 17 10 1193 65 8 13 16 18 992 64 8 16 15 1090 63 8 15 18 1688 62 8 12 15 14 14 17 8 9
Very High
86 61 7 1784 60 7 +1s 13 13 1682 59 7 11 14 15 779 58 7 12 12 16 8
High
76 57 6 13 15 1473 56 6 10 1469 55 6 12 11 11 15 6 766 54 6 1362 53 6 9 10 14 13
AboveAverage
58 52 5 11 10 654 51 5 13 1250 50 5 0 8 10 9 9 12 546 49 5 1142 48 5 12 11 5
Average
38 47 4 9 8 1034 46 4 7 8 1031 45 4 1127 44 4 8 7 924 43 4 7 10 9
BelowAverage
21 42 3 6 818 41 3 7 6 6 9 416 40 3 -1s 8 414 39 3 5 7
Low
12 38 2 5 6 5 8 710 37 2 68 36 2 7 67 35 2 5 5 56 34 24 33 2 4 4 64 32 1 4 53 31 1 42 30 1 -2s 4 4 `1 28 1 4
Very Low
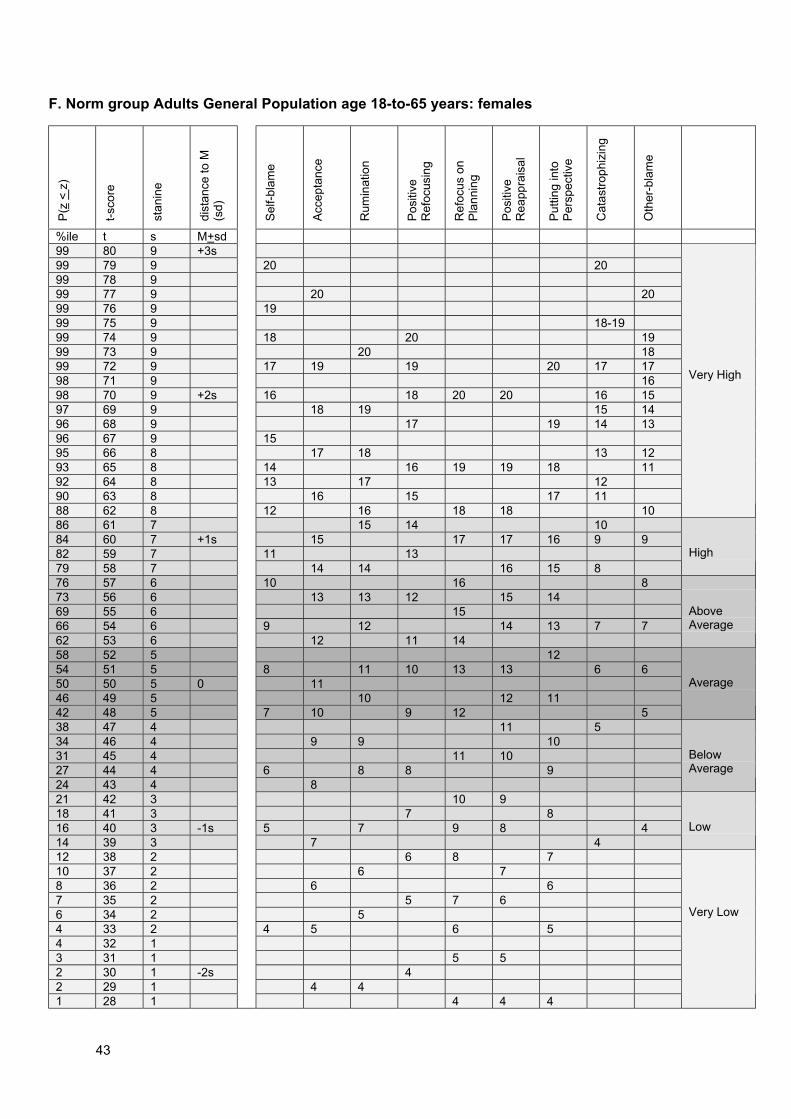
43
F. Norm group Adults General Population age 18-to-65 years: females
P(z
< z)
t-sco
re
stan
ine
dist
ance
to M
(sd)
Self-
blam
e
Acce
ptan
ce
Rum
inat
ion
Posi
tive
Ref
ocus
ing
Ref
ocus
on
Plan
ning
Posi
tive
Rea
ppra
isal
Putti
ng in
toPe
rspe
ctiv
e
Cat
astro
phiz
ing
Oth
er-b
lam
e
%ile t s M+sd99 80 9 +3s99 79 9 20 2099 78 999 77 9 20 2099 76 9 1999 75 9 18-1999 74 9 18 20 1999 73 9 20 1899 72 9 17 19 19 20 17 1798 71 9 1698 70 9 +2s 16 18 20 20 16 1597 69 9 18 19 15 1496 68 9 17 19 14 1396 67 9 1595 66 8 17 18 13 1293 65 8 14 16 19 19 18 1192 64 8 13 17 1290 63 8 16 15 17 1188 62 8 12 16 18 18 10
Very High
86 61 7 15 14 1084 60 7 +1s 15 17 17 16 9 982 59 7 11 1379 58 7 14 14 16 15 8
High
76 57 6 10 16 873 56 6 13 13 12 15 1469 55 6 1566 54 6 9 12 14 13 7 762 53 6 12 11 14
AboveAverage
58 52 5 1254 51 5 8 11 10 13 13 6 650 50 5 0 1146 49 5 10 12 1142 48 5 7 10 9 12 5
Average
38 47 4 11 534 46 4 9 9 1031 45 4 11 1027 44 4 6 8 8 924 43 4 8
BelowAverage
21 42 3 10 918 41 3 7 816 40 3 -1s 5 7 9 8 414 39 3 7 4
Low
12 38 2 6 8 710 37 2 6 78 36 2 6 67 35 2 5 7 66 34 2 54 33 2 4 5 6 54 32 13 31 1 5 52 30 1 -2s 42 29 1 4 41 28 1 4 4 4
Very Low

44
G. Norm group Elderly People age 66 years and more: males
P(z
< z)
t-sco
re
stan
ine
dist
ance
to M
(sd)
Self-
blam
e
Acce
ptan
ce
Rum
inat
ion
Posi
tive
Ref
ocus
ing
Ref
ocus
on
Plan
ning
Posi
tive
Rea
ppra
isal
Putti
ng in
toPe
rspe
ctiv
e
Cat
astro
phiz
ing
Oth
er-b
lam
e
%ile t s M+sd99 80 9 +3s99 79 999 78 999 77 999 76 999 75 999 74 999 73 999 72 9 ≥ 17 2098 71 998 70 9 +2s ≥ 15 20 20 20 20 20 ≥ 1897 69 996 68 9 10-1996 67 9 1695 66 8 14 19 18-19 19 16-1793 65 8 19 15 19 18 13-15 992 64 8 13 1890 63 8 14 17 11-1288 62 8 12 18 13 18 10
Very High
86 61 7 17 17 984 60 7 +1s 11 16-17 16 882 59 7 17 12 15 879 58 7 10 16 15 16
High
76 57 6 16 11 1473 56 6 9 15 7 769 55 6 15 13 14 1566 54 6 10 14 662 53 6 14 12 13 6
AboveAverage
58 52 5 8 13 9 13 1454 51 5 11 12 12 13 550 50 5 0 11-12 10 1146 49 5 11 12 542 48 5 10 8 10
Average
38 47 4 7 9 1034 46 4 9 1131 45 4 9 7 927 44 4 624 43 4 6 8 10
BelowAverage
21 42 3 8 8 418 41 3 5 9 416 40 3 -1s 5 814 39 3 7 7 8
Low
12 38 2 6 7 610 37 2 5 7 5 78 36 27 35 2 4 5-6 66 34 2 44 33 2 4 4 64 32 13 31 12 30 1 -2s ≤52 29 1 41 28 1 ≤5
Very Low

45
H. Norm group Elderly People age 66 years and more: females
P(z
< z)
t-sco
re
stan
ine
dist
ance
to M
(sd)
Self-
blam
e
Acce
ptan
ce
Rum
inat
ion
Posi
tive
Ref
ocus
ing
Ref
ocus
on
Plan
ning
Posi
tive
Rea
ppra
isal
Putti
ng in
toPe
rspe
ctiv
e
Cat
astro
phiz
ing
Oth
er-b
lam
e
%ile t s M+sd99 80 9 +3s99 79 999 78 999 77 999 76 999 75 999 74 999 73 999 72 9 20 ≥19 20 ≥1598 71 9 ≥19 20 ≥1598 70 9 +2s97 69 996 68 9 19 2096 67 9 19 17-18 18-19 ≥19 14 12-1495 66 8 16-1893 65 8 13-1892 64 8 11-12 17-18 17 1390 63 8 19 15 16 1188 62 8 16
Very High
86 61 7 16 16-1884 60 7 +1s 9-10 14 12 1082 59 7 18 13 15 15 979 58 7 8 15 15 11
High
76 57 6 17 12 14 10 873 56 6 15-16 14 14 969 55 6 14 1366 54 6 14 13 13 8 6-762 53 6 7 11 13 12
AboveAverage
58 52 5 1354 51 5 12 12 11 12 750 50 5 0 6 12 546 49 5 10 11 1042 48 5 11 11
Average
38 47 4 9 10 11 634 46 4 5 10 931 45 4 10 1027 44 4 8 924 43 4 9 5
BelowAverage
21 42 3 9 7-8 918 41 3 7 8 416 40 3 -1s 8 8 814 39 3 4
Low
12 38 2 6-7 6 7 6 710 37 2 5 7 48 36 27 35 2 5 66 34 2 64 33 2 4 ≤6 ≤54 32 13 31 1 ≤52 30 1 -2s2 29 1 ≤51 28 1 4
Very Low
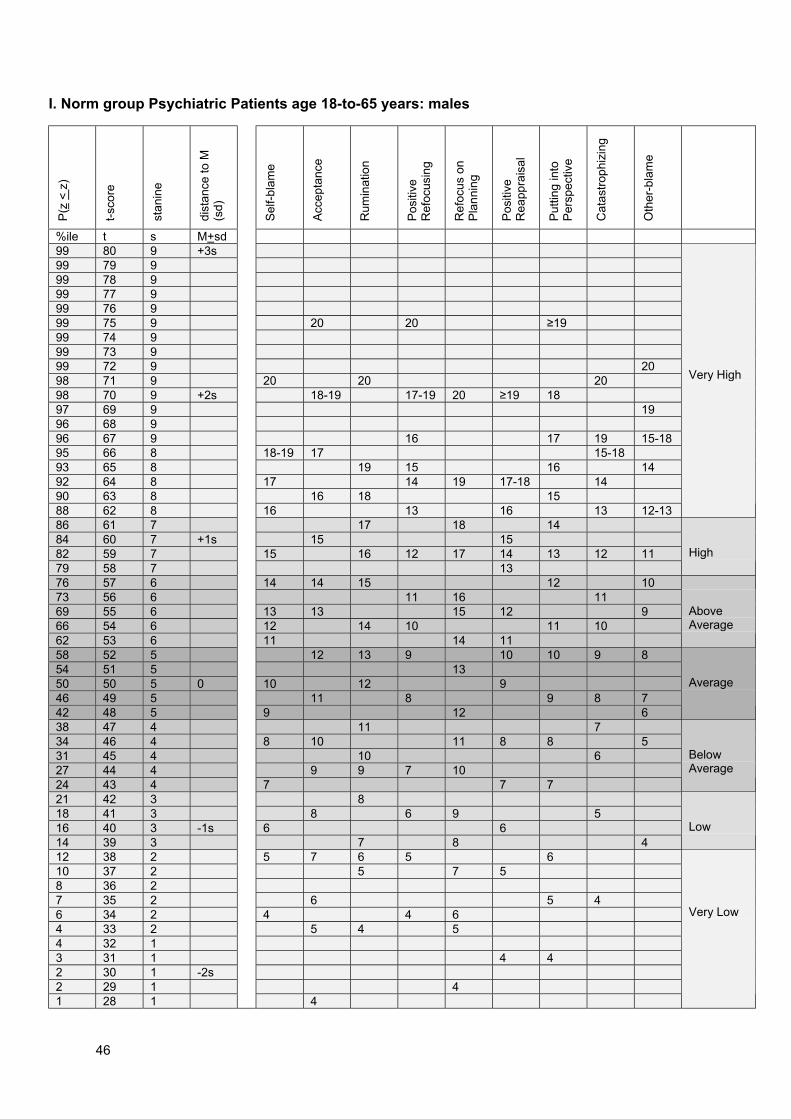
46
I. Norm group Psychiatric Patients age 18-to-65 years: males
P(z
< z)
t-sco
re
stan
ine
dist
ance
to M
(sd)
Self-
blam
e
Acce
ptan
ce
Rum
inat
ion
Posi
tive
Ref
ocus
ing
Ref
ocus
on
Plan
ning
Posi
tive
Rea
ppra
isal
Putti
ng in
toPe
rspe
ctiv
e
Cat
astro
phiz
ing
Oth
er-b
lam
e
%ile t s M+sd99 80 9 +3s99 79 999 78 999 77 999 76 999 75 9 20 20 ≥1999 74 999 73 999 72 9 2098 71 9 20 20 2098 70 9 +2s 18-19 17-19 20 ≥19 1897 69 9 1996 68 996 67 9 16 17 19 15-1895 66 8 18-19 17 15-1893 65 8 19 15 16 1492 64 8 17 14 19 17-18 1490 63 8 16 18 1588 62 8 16 13 16 13 12-13
Very High
86 61 7 17 18 1484 60 7 +1s 15 1582 59 7 15 16 12 17 14 13 12 1179 58 7 13
High
76 57 6 14 14 15 12 1073 56 6 11 16 1169 55 6 13 13 15 12 966 54 6 12 14 10 11 1062 53 6 11 14 11
AboveAverage
58 52 5 12 13 9 10 10 9 854 51 5 1350 50 5 0 10 12 946 49 5 11 8 9 8 742 48 5 9 12 6
Average
38 47 4 11 734 46 4 8 10 11 8 8 531 45 4 10 627 44 4 9 9 7 1024 43 4 7 7 7
BelowAverage
21 42 3 818 41 3 8 6 9 516 40 3 -1s 6 614 39 3 7 8 4
Low
12 38 2 5 7 6 5 610 37 2 5 7 58 36 27 35 2 6 5 46 34 2 4 4 64 33 2 5 4 54 32 13 31 1 4 42 30 1 -2s2 29 1 41 28 1 4
Very Low

47
J. Norm group Psychiatric Patients age 18-to-65 years: females
P(z
< z)
t-sco
re
stan
ine
dist
ance
to M
(sd)
Self-
blam
e
Acce
ptan
ce
Rum
inat
ion
Posi
tive
Ref
ocus
ing
Ref
ocus
on
Plan
ning
Posi
tive
Rea
ppra
isal
Putti
ng in
toPe
rspe
ctiv
e
Cat
astro
phiz
ing
Oth
er-b
lam
e
%ile t s M+sd99 80 9 +3s99 79 999 78 999 77 999 76 9 20 20 ≥1999 75 999 74 999 73 9 20 ≥1899 72 9 20 17-1998 71 9 20 20 19 17-1898 70 9 +2s 20 16 16-1797 69 9 18-1996 68 9 1596 67 9 19 15 18-19 1895 66 8 19 17 16 1493 65 8 19 1392 64 8 18 18 14 1590 63 8 17 18 17 16 17 1288 62 8 17 14
Very High
86 61 7 17 13 15 16 1184 60 7 +1s 16 16 14 1382 59 7 16 15 12 9-1079 58 7 15 16 12 14
High
76 57 6 15 15 13 1173 56 6 14 14 1369 55 6 15 11 10 866 54 6 13 13 14 12 1262 53 6 12 10 9
AboveAverage
58 52 5 11 14 11 1154 51 5 12 13 8 750 50 5 0 10 9 1046 49 5 13 12 1042 48 5 9 11 9 7 6
Average
38 47 4 12 934 46 4 10 8 11 631 45 4 8 11 8 827 44 4 10 524 43 4 9 10 7
BelowAverage
21 42 3 7 9 7 518 41 3 9 716 40 3 -1s 8 6 814 39 3 6 8 6
Low
12 38 2 7 610 37 2 7 5 48 36 2 5 7 6 5 57 35 2 46 34 24 33 2 44 32 1 6 53 31 1 6 4 42 30 1 -2s 4 51 27 1 5 4 41 25 1 4
Very Low