manual for the aquatic ecosystem health programme - orasecom
TRANSCRIPT

Southern African Development Community
Water Sector Support Unit - Gaborone
European Development Fund
African Transboundary River Basin Support Programme
Case of the Orange – Senqu River in Botswana
Lesotho, Namibia and South Africa
Global Financial Commitment No. 9 ACP RPR 53
The OSAEH Programme
- Orange-Senqu Aquatic Ecosystem Health Monitoring Programme
Report No. ORASECOM 009/2009
November 2009
ORASECOM
BOTS
WANA LESO
THO
NAMIB
IA SOUTH A
FRICA
ORANGE - S
ENQU RIVER CO
MMISSI ON
Established 2000
Page i
INR Report No. 415/09
Prepared by: CWS Dickens
Institute of Natural Resources
P O Box 100396
Scottsville
3209
Fax: +27 (33) 3460895
Tel: +27 (33) 3460796
Email: [email protected]
Web page: www.inr.org.za
Prepared under contract to: WS. Atkins International Limited (England) as part of an EU funded programme to SADC, this part being implemented by the Secretariat of ORASECOM.
Atkins representative – Mr. Gavin Quibell
ORASECOM representative - Mr. Lenka Thamae
Title The OSAEH Programme – the Orange-Senqu Aquatic Ecosystem Health Monitoring Programme
Report No. ORASECOM 009/2009
Author Chris Dickens
Date September 2009
Status Final Report

OSAEH - An Aquatic Ecosystem Health Programme for ORASECOM
Page ii
TABLE OF CONTENTS
EXECUTIVE SUMMARY......................................................................................................... III
GLOSSARY...................................................................................................................................V
1. INTRODUCTION .................................................................................................................1 1.1 Background to this project.................................................................................................1 1.2 Mandate of ORASECOM ..................................................................................................1 1.3 Objectives of this Report ...................................................................................................1 1.4 Development of the Programme .......................................................................................1
2 THE ORANGE-SENQU AQUATIC ECOSYSTEM HEALTH PROGRAMME...........3 2.1 Objectives of the OSAEH programme ..............................................................................3 2.2 Types of monitoring surveys .............................................................................................3 2.3 Sites to be Monitored ........................................................................................................4 2.4 Gathering of Data..............................................................................................................8 2.5 River Health Indices for Routine Monitoring......................................................................9 2.6 Frequency of Monitoring..................................................................................................12 2.7 Data Management...........................................................................................................12 2.8 Quality Assurance ...........................................................................................................13 2.9 interpretation and reporting .............................................................................................13
3. MANAGEMENT REQUIREMENTS ...............................................................................16 3.1 Roles and responsibilities................................................................................................16 3.2 Implementation................................................................................................................16 3.3 Activities Necessary to Implement the OSAEH Programme...........................................16 3.4 Cost of Implementation ...................................................................................................17
4. REFERENCES ...................................................................................................................19
APPENDIX A – OSAEH MONITORING SITES ....................................................................21

OSAEH - An Aquatic Ecosystem Health Programme for ORASECOM
Page iii
EXECUTIVE SUMMARY
The General Principles of the Revised SADC Protocol on Shared Watercourses specify that “State Parties shall maintain a proper balance between resource development for a higher standard of living for their people and conservation and enhancement of the environment to promote sustainable development” (Art. 3.4).
Clearly, therefore, there is an obligation on all the ORASECOM Member States to maintain an appropriate balance between protection and use of the Orange-Senqu River System. While Member States will have to negotiate and agree the appropriate balance, ORASECOM should monitor and report to Parties on any threats to this balance. This obligation is also reflected in Article 7.12 of the ORASECOM Agreement which provides for the development of common monitoring systems. This assignment responds to these needs, through the development of an ORASECOM Aquatic Ecosystem Health Monitoring Programme (OSAEH Programme).
There are a number of approaches to monitoring the condition of the aquatic ecosystem and the benefits that a healthy ecosystem supplies to society. These generally fall into two types;
• Monitoring of the response of the ecosystem to stresses imposed on it using response indicators. These may include indices representing the invertebrates, the fish, riparian vegetation and in some cases physical aspects such as habitat integrity.
• Monitoring of the drivers that cause changes to the above response indicators. This may include water quality, flow volumes, geomorphology etc.
Monitoring programmes that include drivers are more extensive both in the number of sample sites and variables, whereas those focussed on the response indicators are cheaper – but do not necessarily provide the detailed information required to make management recommendations. As a compromise, in some countries, determination of the cause of loss of ecosystem health (i.e. the drivers) is only initiated when there is a need, thus greatly reducing the overall cost of monitoring.
The approaches used for ecosystem monitoring often make use of indices designed to aggregate the information into a format that can be readily understood. The index which has been recommended for bi-annual monitoring in the OSAEH programme is the SASS index, based on aquatic invertebrates. This document provides information on the use of SASS, the selection of sites where monitoring should take place, the interpretation of the data produced and the format for reporting.
This report also details the need for a more comprehensive survey which would take place every five years, as the bi-annual survey is limited in its scope and may miss some changes that take place in the river ecosystem. These expanded surveys would consider all aspects of the aquatic ecosystem including fish, riparian vegetation, diatoms, sediment and geomorphological changes, habitat integrity and an assessment of the hydrological and water quality situation, in support of the standard SASS index. In this way long-term changes in the ecosystem health of the Orange-Senqu River could be documented, which would be of interest to all Parties.
Direction is given for the management requirements to get this programme operational and also to maintain it. It is suggested that the ORASECOM Secretariat be responsible for the initial management of the programme. This will include initiating the programme and procurement of a service provider to conduct the surveys and write the reports for the first

OSAEH - An Aquatic Ecosystem Health Programme for ORASECOM
Page iv
few years. However, this process should also be used to train staff in the Member States for the gradual hand over of the monitoring function to Member States.
An approximate budget for the initial Secretariat driven monitoring has been proposed as follows:
• Annual Costs – R330,000 per annum
• Five Yearly Survey – R720,000 per survey
• Start up costs – R160,000
• Training of Member State staff – R 150,000
These costs will be carried by the EU support to the Secretariat for the 2010 monitoring programme, which will include the first 5 yearly survey.
Longer term operation costs, at 2009 prices, for the Member States are as follows;
OPERATIONAL COST PER MEMBER STATE
Cost per Member State
Total per annum
Comment
Botswana 0 As there are no surface waters – no sites have been proposed for Botswana. However, this Member State will still participate in training and accreditation.
Lesotho R 24, 000 This includes sampling at sites already undertaken by LHDA, so actual costs would be lower
Namibia R 6,000 This includes only one site in Namibia, as the joint sites on the Orange are already part of SA’s RHP.
South Africa R 300,000 The SA sites are already part of the RHP, and so actual costs are potentially negligible. (If the RHP sites are monitored).
TOTAL cost per annum
R330,000

OSAEH - An Aquatic Ecosystem Health Programme for ORASECOM
Page v
GLOSSARY
(adapted from the DWAF 2008 River Health Programme manual)
Biomonitoring. Use of biological attributes of a water body to assess its environmental health condition.
Biota. Animal and plant life characterising a given area.
Biotic index. A numerical index which uses one or more components of the biota to provide a measure of the biological condition of a site.
Biotope. An area of uniform environmental conditions and biota.
Diatoms. Unique algae that possess a cell wall constructed almost entirely of silica.
Ecoregion. Regions of relative homogeneity in ecological characteristics or in relationships between organisms and their environments. Boundaries are not distinct and one region merges into the next.
Hot spot. Where a site is indicated by the monitoring techniques used, to be suffering high levels of stress indicating a transgression of the objectives of ORASECOM.
Index. A number or ratio (a value on a scale of measurement) derived from a series of observed facts; can reveal relative changes as a function of time (http://wordnet.princeton.edu/ perl/webwn).
Invertebrate. An animal lacking a backbone and internal skeleton.
Macroinvertebrates. Invertebrates visible to the naked eye.
Mainstem River. In this project this refers to the Orange, Senqu and Vaal Rivers.
Monitoring. The measurement, assessment and reporting of selected properties of water resources in a manner that is focussed on well-defined objectives.
Monitoring, baseline. The assessment and characterisation of existing conditions to provide a standard, or "baseline," against which future change is measured.
Monitoring site. A physical location at which monitoring occurs.
Present Ecological State (PES). The current health or integrity of rivers compared to the natural or close-to-natural reference condition. It is expressed in terms of drivers (physico-chemical, geomorphology, hydrology) and biological responses (fish, riparian vegetation and aquatic invertebrates), as well as an integrated state, the EcoStatus. Quality Assurance (QA). The implementation of all activities that minimise the possibility of quality problems occurring. These include, among others, training, instrument calibration and servicing, quality control, producing clear and comprehensive documentation, and so on.
Quality Control (QC). The process of ensuring that recommended procedures are followed correctly by detecting and correcting quality problems when they arise, so that the accuracy of primary observations or measurements is (a) defined, (b) within acceptable limits and (c) recorded.

OSAEH - An Aquatic Ecosystem Health Programme for ORASECOM
Page vi
Reference condition. The expected condition that reflects natural or least-impacted physical, chemical and biological characteristics of a site, river reach or river type, in the absence of anthropogenic stress. Reference site. A location exhibiting a reference condition. Routine Monitoring. This is monitoring that takes place according to a fixed schedule and design. Investigational Monitoring. This is specialised monitoring that responds to the identification of “hot spots” by the Routine Monitoring and introduces whatever monitoring techniques are necessary to understand the situation. Water quality. The physical, chemical, radiological, toxicological, biological and aesthetic properties of water that (1) determine its fitness for use or (2) that are necessary for protecting the health of aquatic ecosystems. Water quality is therefore reflected in (a) concentrations of substances (either dissolved or suspended), (b) physico-chemical attributes (e.g. temperature), (c) levels of radioactivity and (d) biological responses to those concentrations, physico-chemical attributes or radioactivity.
Page 1
1. INTRODUCTION
1.1 BACKGROUND TO THIS PROJECT
The European Union (EU) funded support to the Orange-Senqu River Commission (ORASECOM) forms part of the EU’s wider African Transboundary Rivers support programme. The project resources were secured by a Financing Agreement between the EU and SADC, and managed by the Delegation of the European Commission (DEC) in Gaborone, Botswana. SADC is consequently the de jure client for the project. The project is, however, delivered through the ORASECOM Secretariat, who is therefore the de facto client for the work.
This Assignment forms part of a larger project specifically contributing to Result Area 5, and more specifically Activity 5.2 – “Develop and agree an assessment tool and sites for assessing Aquatic Ecosystem Health”.
This report contains the design of the Aquatic Ecosystem Health monitoring programme for ORASECOM.
1.2 MANDATE OF ORASECOM
ORASECOM was established under an agreement signed on 3 November 2000 by the Governments of The Republic of Botswana, The Kingdom of Lesotho, The Republic of Namibia, and the Republic of South Africa (the Parties). This ‘ORASECOM Agreement’ establishes the organisation as a technical advisor to the Parties (Art 4). Technical advice is provided through recommendations to the Parties.
Article 5.2.5 of the ORASECOM Agreement provides the mandate to develop standardised forms of collecting, processing and disseminating data or information with regard to all aspects of the River System. Article 7.12 requires the Parties to individually and jointly take all measures that are necessary to protect and preserve the River System from its sources and headwaters to its common terminus. To do this the Parties would need to be advised on the state of aquatic ecosystems throughout the basin. This gives ORASECOM the mandate and responsibility to develop an aquatic ecosystem health monitoring programme.
Such a monitoring programme will also serve to satisfy some of the requirements of the Revised SADC Protocol on Shared Watercourses, to which all Parties are signatory.
1.3 OBJECTIVES OF THIS REPORT
ORASECOM intends to monitor the Aquatic Ecosystem Health of the Orange-Senqu River through this programme. The programme provides the basis for an ongoing assessment and reporting of the state of aquatic ecosystems, which in turn is to be used to prompt more detailed studies of the causes of degradation in aquatic ecosystem health. These more detailed studies may serve as a basis for further recommendations to the Parties with regard to measures to protect aquatic ecosystems.
This report provides the details that are required to implement the monitoring of aquatic ecosystem health in the basin, and to report on this on a regular basis.
1.4 DEVELOPMENT OF THE PROGRAMME
A previous report outlining international best practice for national and transboundary AEH formed the basis for the development of this programme (Dickens 2009). What impressed most when considering all of the USA, Australian and UK/EU approaches, was their simplicity. All of them were modest in their objectives, accepting that they did

OSAEH - An Aquatic Ecosystem Health Programme for ORASECOM
Page 2
not cover every aspect of ecosystem health and aiming simply to produce an indication of the state of the aquatic ecosystems as a guide to water resource management. It was clear that these programmes did not work towards measuring compliance issues but rather to report on the state of the environment against a wider vision.
This initial report was presented to the ORASECOM Technical Task Team in April 2009, and subsequently to the ORASECOM Council. Following this endorsement of the broad principles for the system, a more detailed presentation of the key features of the proposed programme was discussed at a workshop with key experts from each of the basin states.
This report is based on the discussions at that workshop.
OSAEH - An Aquatic Ecosystem Health Programme for ORASECOM
Page 3
2 THE ORANGE-SENQU AQUATIC ECOSYSTEM HEALTH PROGRAMME
2.1 OBJECTIVES OF THE OSAEH PROGRAMME
The objectives of the OSAEH programme are to provide a common basis;
1. To measure, assess and report on the ecological state of the aquatic ecosystems of the Orange-Senqu River System;
2. To detect and report on spatial and temporal trends in the ecological state of aquatic ecosystems placing emphasis on the response of the ecosystem and less on the drivers of change;
3. To identify and report on emerging problems regarding the ecological state of aquatic ecosystems; and
4. To provide information to support recommendations for more detailed investigational monitoring where problems are emerging.
It is NOT the purpose of this OSAEH programme to:
1. provide information to determine environmental flow requirements;
2. monitor the impacts of individual sources of stress (e.g. industries, towns etc);
3. replace the need for more detailed monitoring of water resources as may be carried out by Parties;
4. provide data to be used for compliance monitoring;
5. set management objectives for the river, although the means for testing of these objectives are provided.
2.2 TYPES OF MONITORING SURVEYS
There are two categories of Monitoring Surveys:
1. Routine Monitoring – this is monitoring conducted at the prescribed frequency and necessary to build up a reliable database of the condition at each site as well as to pick up any trends or changes in condition. Routine monitoring is also divided into Annual and Five Yearly.
a. Bi-Annual surveys – these are undertaken twice per year, incorporating only the SASS index to give a snap-shot of the state of the aquatic ecosystem health.
b. Five Yearly Surveys – these are comprehensive surveys of the river (at the same sites as the Annual surveys) where a wider suite of tools is utilised. These surveys are designed to give an infrequent but detailed understanding of the sites that are being monitored.
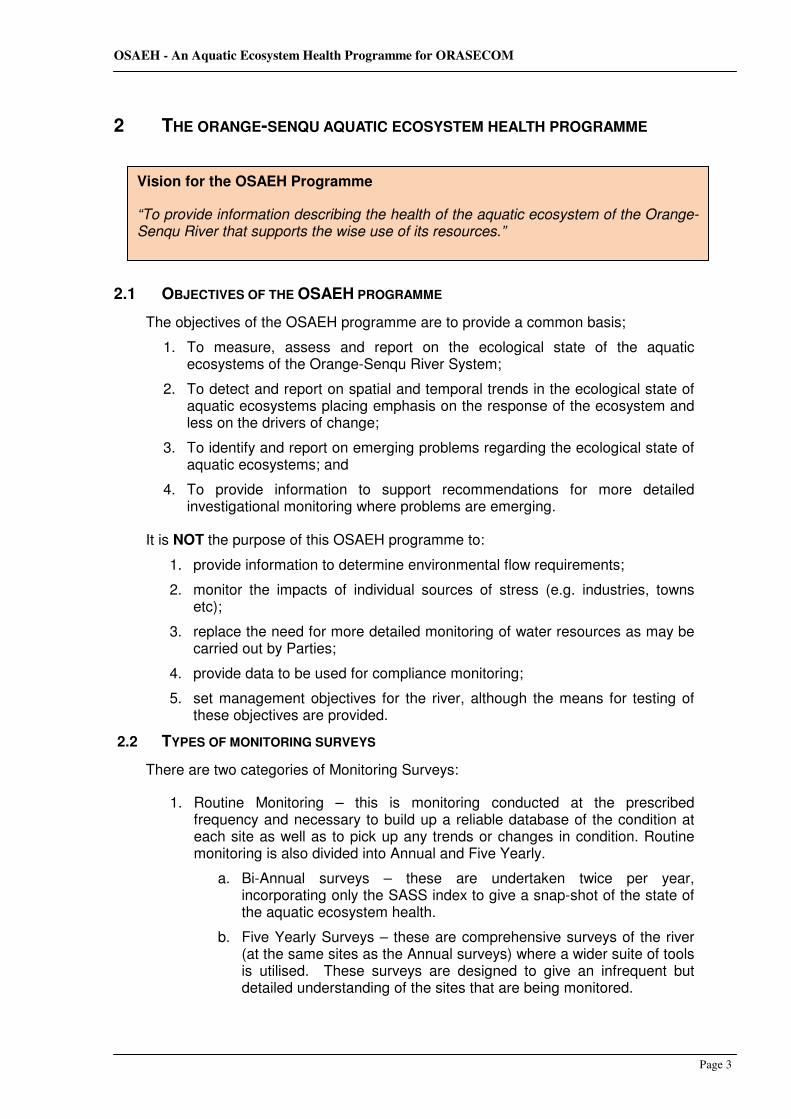
Vision for the OSAEH Programme
“To provide information describing the health of the aquatic ecosystem of the Orange-Senqu River that supports the wise use of its resources.”
OSAEH - An Aquatic Ecosystem Health Programme for ORASECOM
Page 4
2. Investigational Monitoring – this is monitoring that responds to the identification of “hot spots” at any of the Routine Monitoring sites. This monitoring cannot be planned but needs to respond to the specifics of the situation in hand in order to establish the cause problems at any “hot spot”. This monitoring will therefore take place on the recommendation of Council to the Party concerned and is not included in the routine monitoring programme proposed below.
2.3 SITES TO BE MONITORED
Sites are selected to cover all parts of the Orange-Senqu River basin without going into the intensive surveys that would be expected of the local river management agency. The sites were therefore NOT selected in order to manage localised water issues in the basin. As such the sites provide an indication of the state of the ecosystem at strategic points in the basin, focussing on assessing the status of the main tributaries.
Sites which could be expected to be of a similar nature have been grouped into Ecoregions (see below), to help interpret the data.
Confirmation of exact site locations will only take place following the initiation of the programme. In preparation for this, those sites already used by Member States are prioritised as they provide an existing database. These sites are adopted as OSAEH sites as it gives them continuity even if monitoring is discontinued by the Member State.
It is important that monitoring should be regular, the same sites should be visited on each occasion and that their location should not be changed without sufficient motivation. This allows for a record of ecosystem health to be built up over time, thus making the monitoring programme increasingly robust.
Selection of sites according to Ecoregions
Ecoregions are geographical regions where all the river ecosystems are of a similar nature. The use of Ecoregions in river monitoring enables an appropriate choice of sampling sites as sites within an Ecoregion should manifest similar ecological characteristics. The use of Ecoregions also enables the use of Reference Sites or Reference Conditions. These provide a bench-mark against which to compare any other site which may be in an altered state.
Sites are selected for each Ecoregion based on the following criteria:
o This programme seeks to monitor the Orange-Senqu river basin at a high level and does not monitor minor streams and parts of the ecosystem that are relatively isolated (e.g. the upper Molopo).
o There are two types of Routine Monitoring sites:
� Reference Sites (and Reference Condition) – these are sites representing the ecosystem of each Ecoregion in its best possible state, thus providing an indication of an un-impacted condition. It is also possible to add historical information to supplement present data to compile this Reference Condition. This is important as most of the system is already negatively impacted by developments (this will be a particular issue in the Lower Orange River Gorge where Reference Sites may not be possible as there are no neighbouring rivers or large tributaries in pristine condition). Reference Sites will be recorded as such on the database.
OSAEH - An Aquatic Ecosystem Health Programme for ORASECOM
Page 5
� Monitoring Sites – these are sites that measure the present state of the aquatic ecosystem. These are compared to the Reference Sites to determine the extent of the impact.
o Reference Sites for each Ecoregion were located on tributaries of a similar character to the mainstem river i.e. first order streams may be inappropriate Reference Sites as they do not assist with interpretation of the condition of the mainstem river. Where possible a minimum of 3 per Ecoregion were selected (Table 2.1).
o Some rivers in the Orange-Senqu river basin are dry for much of the year and even for multi-year periods. The OSAEH will not cover these rivers as they do not contribute a sustained influence on the rest of the river system. However, there are some exceptions e.g. the Modder River, which have a high importance for the region.
o Monitoring sites were; � located at the outlet of all major tributaries, representing the
contribution of that tributary to the system. In certain situations, especially in non-perennial rivers, this was not done e.g. in the Molopo River where the headwaters are of greater interest from a management point of view, and the river does not have a surface water link to the Orange River.
� located on the mainstem river at regular intervals so that there are at least three mainstem sites within each Ecoregion including the upper, middle and lower sections of the Ecoregion.
� not immediately adjacent to or downstream of point source impacts.
o Where possible, sites synchronised with sites currently being monitored by Member States. This included sites identified and used by the River Health Programme and for Ecological Reserve monitoring (or Ecological Water Requirements) in South Africa and also sites used by the Lesotho Highlands Development Authority in Lesotho. Such sites provide added information which would support better interpretation of data. These sites will not be additionally sampled, but data would be shared from these sites.
o Sites should be suitable for the ecosystem health indicators that are being used. As such sites should preferably have diverse habitats suited to monitoring benthic invertebrates, to minimise the impact of poor habitat on the results. Reference sites will also have to be selected to prevent spurious interpretations.
o Sites should also be amenable to sampling e.g. it should be possible to wade through important parts of the river to collect samples. Sites should be accessible and safe.
o While measuring the state of a site against a reference provides an objective measure of a site, it is just as important to measure the change in state over time. Information that is developed over a protracted period of time provides a more objective measure of change. Thus, sites should be selected to be monitored in the long term.
OSAEH - An Aquatic Ecosystem Health Programme for ORASECOM
Page 6
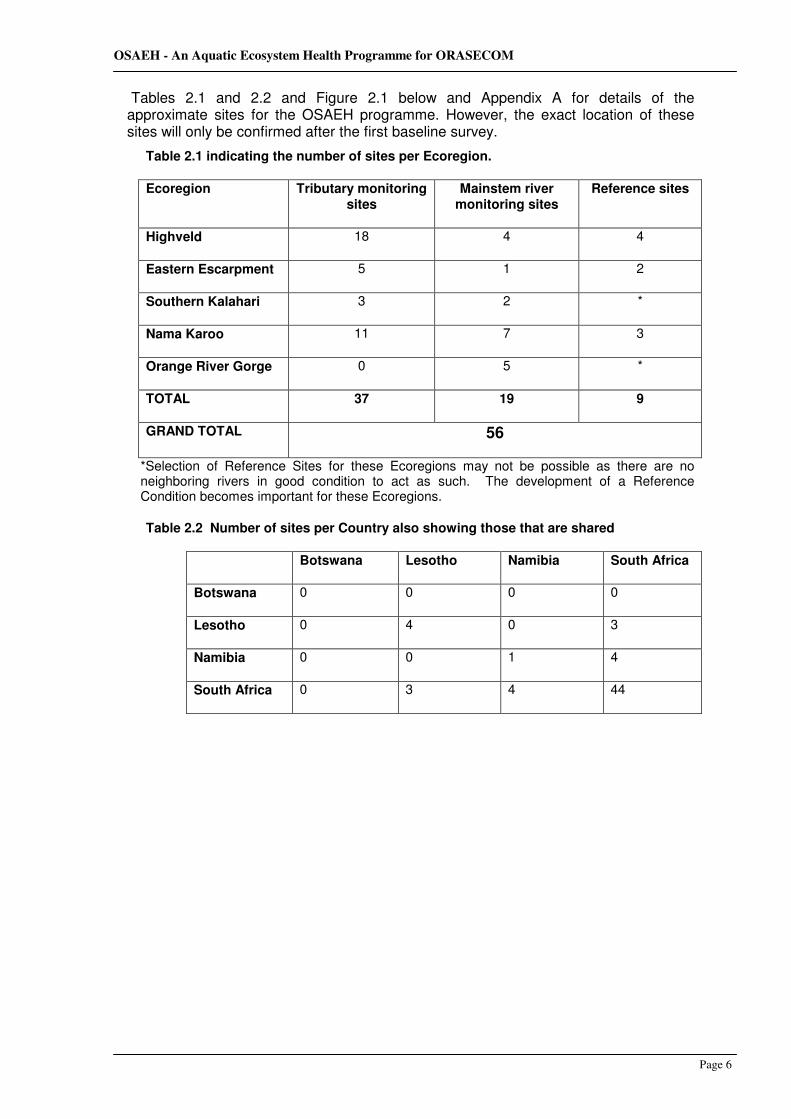
Tables 2.1 and 2.2 and Figure 2.1 below and Appendix A for details of the approximate sites for the OSAEH programme. However, the exact location of these sites will only be confirmed after the first baseline survey.
Table 2.1 indicating the number of sites per Ecoregion.
Ecoregion Tributary monitoring sites
Mainstem river monitoring sites
Reference sites
Highveld 18 4 4
Eastern Escarpment 5 1 2
Southern Kalahari 3 2 *
Nama Karoo 11 7 3
Orange River Gorge 0 5 *
TOTAL 37 19 9
GRAND TOTAL 56
*Selection of Reference Sites for these Ecoregions may not be possible as there are no neighboring rivers in good condition to act as such. The development of a Reference Condition becomes important for these Ecoregions.
Table 2.2 Number of sites per Country also showing those that are shared
Botswana Lesotho Namibia South Africa
Botswana 0 0 0 0
Lesotho 0 4 0 3
Namibia 0 0 1 4
South Africa 0 3 4 44

Page 7
Figure 2.1. The map above indicates the distribution of sites. The background to the map represents the Ecoregions for the basin, adapted and developed from Kleynhans et al (2005)

Page 8
2.4 GATHERING OF DATA
Linking with Member State initiatives
The AEH monitoring programme outlined above will initially be managed by the ORASECOM Secretariat through the appointment of service providers. This process will be used to train staff in the Member States who will gradually take over the operation of the system. Member States would provide the data to the Secretariat for collation and reporting. Monitoring would not be duplicated where there are existing sites already included in the Member State programmes. Beyond this data from sites outside of this programme should also be shared. Exchange of data on the AEH programme should therefore be included data sharing platforms. Points of contact in this regard are as follows:
Lesotho
• LHDA has a long standing programme examining the state of sites in relation to the Lesotho Highlands Water Project. These sites include Reference Sites as well as monitoring sites which potentially suffer the impact of the infrastructure. This programme monitors a wide range of variables ranging from water quality to fish and geomorphology, and including invertebrates as has been proposed for OSAEH. The habitat index is not monitored. This programme may be accessed via the LHDA Monitoring and Evaluation section at http://www.lhda.org.ls .
South Africa
• The River Health Programme (RHP) which is operated by the Department of Water Affairs, Resource Quality Studies (RQS), based in Pretoria, is a long standing programme (since 1995) that has collected data representing the state of the rivers of South Africa. The programme uses standardised procedures which includes the SASS method proposed for OSAEH, but with others in addition. The data is stored in a Rivers Database which may be interrogated to determine trends etc. Importantly the RHP shares many of the same sites as the OSAEH. The programme may be accessed via Resource Quality Studies on the DWA web site at : http://www.dwea.gov.za/iwqs/rhp/index.html
• Ecological Reserve (ecological water requirements) information has been gathered in considerable detail over a five year period. The available information is far in excess of what is required for an aquatic ecosystem health programme such as the OSAEH. Information and data can be obtained from the Resource Directed Measures (RDM) Directorate, DWA, in Pretoria at http://www.dwea.gov.za/rdm/default.asp
Namibia
• While the Ministry of Agriculture, Water & Forestry (Windhoek) carries out some monitoring, there is none dedicated to the aquatic ecosystem health of the Orange or Fish River systems.
Botswana
• Botswana does not monitor any of the rivers associated with the Orange system as they are generally dry (on the surface).

Page 9
2.5 RIVER HEALTH INDICES FOR ROUTINE MONITORING
Biotic indices are numerical indices, which use one or more components of the biota to provide a measure of the biological condition of a site. They are thus response indices in that they respond to the changing environment of water quality, quantity and habitat.
There are a number of criteria that define what indices would be appropriate for the OSAEH Programme. These include:
• The methods must be well tested and scientifically validated, producing results that are repeatable and accurate.
• They must be practical i.e. cost effective, should not require excessive expertise, should be relatively rapid and not require expensive equipment.
• They should respond to changes in the aquatic environment caused by human activities.
• They should illustrate the state of the aquatic ecosystem, both at a moment in time and over extended periods.
• They should produce data which can be converted into standardised units so that results can be compared across the length and breadth of the basin.
Indices for Annual Reporting
The OSAEH programme has adopted only a single index to indicate the state of the aquatic ecosystem health on a routine basis. This is the South African Scoring System SASS (Chutter, 1994; Dickens & Graham, 2002). This index monitors benthic macroinvertebrates (insect larvae, snails, crabs etc) to indicate the overall state of the instream river ecosystem. The method has a particular sensitivity to water quality issues but also indicates the overall condition.
South African Scoring System (SASS version 5)
Aquatic invertebrates (e.g. insects, snails, crabs, worms etc) require specific habitats and river conditions for at least part of their life cycle. Changes to the invertebrate community composition and structure thus reflect changes in river condition that may be brought about by deterioration of water quality, changes in quantity (flow) and habitat. Invertebrates are thus good indicators of recent localised conditions in a river and may indicate perturbations in a river up to a few months after an event. For example, a toxic spill in the river may be detectable up to two months later, long after the toxin as washed clear from the system. SASS is a relatively simple index based on the invertebrate families found at a site. The method is well tested and cost effective and is fully documented by Chutter (1994) and Version 5 in Dickens and Graham (2002).
The main advantages of a method such as this include:
• Macroinvertebrates are ubiquitous and diverse and are thus easy to collect and have a diversity sufficient to indicate small changes in river condition.
• Different species or even families are variably sensitive to stress, thus allowing the assemblage to indicate the conditions found in the river.
• In their aquatic phase, macroinvertebrates do not travel large distances and are thus representative of the site being sampled. This allows effective spatial analyses of disturbances to the river.
• They have relatively long life cycles compared to microscopic organisms but short life cycles compared to organisms such as fish, fitting in well with the temporal scale suited for management of the river.
• SASS is a qualitative, multi-habitat, rapid, field-based method that requires identification of macroinvertebrates mostly to family level. Sensitivity weightings are
Page 10
used to calculate the biotic index. These weightings have been pre-assigned to individual taxa according to the water quality conditions each taxon is known to tolerate.
• Data interpretation is based on two calculated values (metrics), namely SASS Score, which is the sum of the sensitivity weightings for taxa present at a site, and Average Score Per Taxon (ASPT), which is the SASS Score divided by the number of SASS taxa recorded at the site. Each of these two scores tells a different story of the river and both need to be considered in the interpretation of results.
There are some limitations to the use of SASS in the context of the OSAEH. These include the following: o SASS was designed primarily as a biotic indicator of water quality, but it has been
found to also indicate general aquatic conditions. Yet in some situations expert judgement may be necessary to override a SASS result, provided that there is valid justification. Samplers should therefore be accredited.
o The habitats of the Orange-Senqu River, particularly in the middle and lower reaches where alluvial sand and bedrock form the major habitats, are poor habitats for benthic invertebrates which may result in low SASS scores. In such situations, the reference or natural condition with a similar habitat is crucial to interpret scores.
o Many of the rivers in this basin are either seasonal or non-perennial. SASS was designed to monitor flowing rivers and does not work well where there is only standing water in isolated pools. SASS should not be applied at any site when there is zero flow in the river. Scores obtained under such circumstances will be meaningless.
o A SASS score obtained shortly after a river has re-commenced flowing after a long dry period, will be misleading. There should be at least a month of flow in a river prior to collection of a sample.
Indices for Five Yearly Reporting
The intention of this type of monitoring is to provide a broader understanding of the aquatic ecosystem at each river site and it does this by introducing a much wider range of monitoring protocols. While it would be ideal to implement this monitoring on a regular basis, costs would render this unworkable, so instead this should be carried out at the commencement of the OSAEH programme and then once every five years.
The following indices should be used:
a. Response indicators - In order to obtain a wider view of the response of the ecosystem to the stresses being imposed on the river, the following should be monitored: I. Fish – a biotic index should be used that assesses the state of the fish population
in comparison to the natural condition. This should include an assessment of the fish biodiversity. It is recommended that the method currently used in South Africa i.e. the FRAI (Kleynhans 2008) is adopted for the OSAEH Programme.
II. Periphyton or diatoms – this type of biotic index reliably indicates the presence of nutrients and other pollutants in the water. It is recommended that the method described in Taylor et al (2005, 2007) is adopted for the OSAEH Programme.
III. Riparian vegetation – a biotic index that assesses the state of the riparian vegetation in comparison to the natural condition. This should include the invasion of aliens and the functional attributes of the vegetation e.g. whether it is serving to protect the river substrate etc. It should also collect a list of species dominating each site. It is recommended that the method currently used in South Africa i.e. the VEGRAI (Kleynhans et al 2008) is adopted for the OSAEH Programme.

Page 11
b. Stressor indicators – In order to understand the nature of the stresses being imposed on the river, methods that describe the main stresses need to be followed. It is important to appreciate that the variables that are valuable in assessing the state of the aquatic ecosystem may be somewhat different to those that may be required for other management purposes. The following should be included in the 5 yearly sampling:
i. Water quality; 1. Nutrients (TP, PO4-P, KN, NH3, NO2 & NO3) 2. TDS (total dissolved salts) 3. system variables (pH, turbidity, temperature, DO) 4. toxins (to be decided depending on potential issues at each site)
A separate water quality monitoring programme is being proposed for ORASECOM, and the Member States already have extensive water quality monitoring programmes, this will provide the basis a longer term evaluation of the water quality stressors to supplement the 5 yearly samples.
ii. Water quantity – flow quantities and variability are two of the most important drivers of aquatic ecosystem health. Again, almost continuous monitoring is necessary to obtain data that is of value to determine aquatic ecosystem health. Such monitoring is generally available as part of other monitoring programmes in place in the Member States, and this information should be used to assist with the interpretation of aquatic ecosystem health. It is important to appreciate though that the relationship between flow and the response indicators is poorly understood, which means that only relatively coarse indicators of flow are necessary to assist with interpretation of aquatic ecosystem health. NOTE that this OSAEH programme does not aim to determine the Environmental Flow Requirements of the river.
iii. Sediments and habitat – sediment movement in a river has a great impact on response indicators (fish etc) and is thus considered a driver of ecosystem health, although it is also a response indicator at a different level. What is important here is the provision of suitable habitat for the biota. This includes indications of the smothering of rock habitat by sand, the loss of fine sediments needed by some biota, the alteration of pool depth and the erosion or aggradation of the stream banks. Detailed methods are available from Kleynhans et al (2005).
iv. Habitat Integrity - This is a broad index that considers the overall state of the river ecosystem, both the instream and the riparian zones, and the stresses that are being placed on the river. It reflects the interface between the drivers of change on the one hand and the response of the river ecosystem on the other. In this way, it helps to gain a broad understanding of the stresses and issues at a site or indeed over a long reach of river. It can thus be a start to understanding the causes of change that may be reflected by the other response indicators. The IHI (Index of Habitat Integrity) outlined in Kleynhans et al, (2009) is recommended. There are two levels of assessment for the IHI based on two independent applications of the method, either of which may be used although only the site based assessment has been included in the OSAEH:
• An aerial assessment of a river reach or entire river; or
• Site or ground-based assessment

Page 12
2.6 FREQUENCY OF MONITORING
An aquatic biomonitoring programme reduces the need for regular sampling as the biota “aggregate” the stresses over an extended time. Sampling frequencies of twice per annum are, therefore, generally sufficient for some indices, while others may be sampled less frequently (Table 2.3). Nevertheless, when a “hot spot” is identified “investigational” monitoring should be implemented at a higher frequency. For example, the macroinvertebrates in a river may continue to show the impact of a chemical spill at a site, for up to two months after an event. Return surveys that form part of an investigation should be within this period.
Many of the rivers in the Orange-Senqu basin are either seasonal or non-perennial. The approach to sites on these rivers is that it should be noted in the database when there is insufficient water in the river to collect a sample. Some of the indices in the 5 yearly sampling will still be possible when the river is dry e.g. riparian vegetation, geomorphogy.
2.7 DATA MANAGEMENT
The OSAEH Programme will only be as good as the data that it produces. It is important that this data be properly managed so that it can be used for its intended purpose.
The OSAEH Database
It is recommended that this Programme be initially operated by the ORASECOM Secretariat. A suitable database must be developed in this initial period. The water quality database being investigated under the gtz support should be expanded to accommodate AEH. This should include facilities to store the raw data.
After the initial operation by the Secretariat, sampling will be undertaken by the Member States, and the data provided to the Secretariat, who will report on the overall state of the system, as well as data gaps.
Table 2.3 Recommended sample frequency for the recommended indices
Index Frequency Timing
• Macroinvertebrates (SASS5)
• 2 times a year • At the end of the dry season and at the end of the wet season. The high flow period, when floods are likely, should be avoided.
• Fish (FRAI)
• Diatoms
• Habitat Integrity (IHI);
• Geomorphology (GAI)
• Riparian vegetation (VEGRAI)
• Five yearly • At the end of the wet season. The high flow period, when floods are likely, should be avoided.
• Hydrology
• Water quality
This is not part of the OSAEH monitoring programme but these programmes are being addressed under related programmes. These data will support the assessment of AEH.

Page 13
ECOLOGICAL
CATEGORIES NAME DESCRIPTION COLOUR
A Natural Unmodified natural Blue
B Good Largely natural with few modifications Green
C Fair Moderately modified Yellow
D Poor Largely modified Red
E Seriously modified Seriously modified Purple
F Critically modified Critically or extremely modified Black
2.8 QUALITY ASSURANCE
The quality of the data produced by the OSAEH Programme will be assured through accreditation of the samplers. The South African River Health Programme has a comprehensive suite of Accreditation procedures that include those for SASS and other methods (documented in DWAF 2007). The procurement process for service providers for the initial operation of the system must ensure that selected service providers are accredited. (Practitioners from Namibia, Lesotho and South Africa are all existing participants in this programme.) The initial operation of the programme will be used to train staff from the Member States, and additional training and accreditation will be provided.
2.9 INTERPRETATION AND REPORTING
Interpretation of results
The approach to interpretation (as per international best practice) will be to compare the ecological state of each index against its own reference condition, measuring the amount of deviation from the reference condition. This approach has been developed by the South African River Health Programme, which uses six Categories to represent the ecosystem, with an “A” representing the ecosystem in a natural condition and an “F” in a critically modified condition (see Table 2.4).
Table 2.4. Ecological categories, category names and associated meanings with colour codes used to interpret Ecological Category.
As described earlier in this report, a system of Ecoregions has been used as the basis for interpretation of this information. This allows the information from a site to be directly compared with any other site within the same Ecoregion. The system also allows comparison of the information from different Ecoregions as the outputs are normalised according to the Categories indicated in Table 2.4.
The distribution of Ecoregions in the Orange-Senqu river basin is illustrated in Figure 2.1. This map is based on information produced by the South African DWA for South Africa and Lesotho (Kleynhans et al, 2005). The extrapolation of the Ecoregions into Botswana and Namibia was done following a similar process as was used by Kleynhans.
Interpretation of SASS results: While some guidance is provided in the method of Chutter (1994) and Dickens and Graham (2002), it is only recently that interpretation of SASS results has been studied in detail. Dallas (2007) has provided a method whereby the SASS Score and ASPT are used to determine the Ecological Category for a river (Figure 2.2). Due to a shortage of quality historical data this method has some limitations

Page 14
in relation to use in the Highveld and Orange River Gorge Ecoregions. As data is added, the reliability of this method will improve but in the meantime expert judgement may be necessary to assist with interpretation.
Figure 2.2. Ecological Categories (A-F) for the Nama Karoo, Lower zones calculated using percentiles. Similar charts are available for each Ecoregion (Dallas, 2007).
Reporting
A variety of reporting mechanisms have been employed across the globe, from colouring lengths of river (UK), reporting the percentage of river length in various states (USA), to aggregation of information on a catchment or sub-catchment level (Australia). In South Africa individual sites are illustrated on a map with a variety of icons representing the different indices. However, some of these approaches are more data intensive and require more sampling sites than may be feasible for the OSAEH programme.
The reporting of data for the OSAEH programme should follow the following guidelines:
o OSAEH Annual Report - reporting should be done once per annum, immediately following the Spring survey and should incorporate the two surveys done over the past year; � The report should be concise and limited to a short presentation of the state
and trends of the aquatic ecosystem over the previous year, with a brief discussion.
� Gaps in the data from the Member States should be reported. � The report should follow a standard template allowing comparisons between
years. � A focus of the report will be to identify “hot spots” within the catchment where
there is existing stress, or deteriorating conditions. � The report should not repeat the methods, selection of sites etc, nor have a
long introduction or discussion. These will be covered in less frequent reports (see below).
Page 15
o OSAEH Five Yearly Report – this report should be completed once each five years including a Baseline report at the initiation of the programme. � This report should review trends in the state of the ecosystem over the
previous five years as indicated by the Annual Reporting as well as by the Five Yearly survey.
� The report should consider the sites and methods that are being used and if necessary should recommend alterations.
� Governance of the programme and the effectiveness of its implementation should be considered.

Page 16
3. MANAGEMENT REQUIREMENTS
3.1 ROLES AND RESPONSIBILITIES
The OSAEH programme will be initially be operated and maintained by the ORASECOM Secretariat. This initial period will be used to train Member State staff to take over the sampling, and provide the data to the Secretariat. Once the task has been handed over the management and operation of the programme will be taken over by the Member States, but the Secretariat would still collate the annual reports. The responsibilities are detailed below;
ORASECOM Secretariat
• Initial management of the OSAEH programme through the annual appointment of Service Provider to collect data and compile the Annual Report.
• Training and ensuring accreditation of the Member State staff by the RHP.
• Appointment of Service Provider(s) to compile the Five Yearly Reports.
• Periodic review of the OSAEH, including location of sites, methods being used, frequency of sampling, provision of data, reporting format etc.
• Coordination with Member States through the delegations (obtaining authority, providing requests and recommendations for monitoring and action, sharing of data and information etc) for the initial monitoring.
• Maintenance of the OSAEH Database and publication of data and reports on the ORASECOM web site.
• Reporting to Task Teams and Council.
ORASECOM Technical Task Team (TTT) and Council
• Oversight of the OSAEH programme
• Decisions about action to be taken in the event of “hot spots” being identified.
Member States
• Monitoring once the function has been handed over.
• Ensuring that staff undertaking the monitoring remain accredited.
3.2 IMPLEMENTATION
The programme that has been described above has been deliberately kept uncomplicated and affordable so that it can be easily implemented. The strength of the programme will increase over time, as more data are added to provide a longer term and reliable dataset, but from the outset the data that is produced will be of value in assessing the ecological state of the river.
3.3 ACTIVITIES NECESSARY TO IMPLEMENT THE OSAEH PROGRAMME
1. The first Five Yearly survey needs to be a Baseline survey thus initiating the programme. Special tasks of this first survey include:
a. define the Reference Conditions for all of the Ecoregions in the basin. Particular attention will need to be given to the refinement of the SASS interpretation guideline (Dallas, 2007) to better represent the Lower Orange and the Highveld Ecoregions.
b. Verify selection of sites and their exact location. c. Coordinate with National monitoring programmes of Member States to obtain
baseline data such as hydrology and water quality and also to share other forms of data.

Page 17
2. The project will need to link to the parallel initiatives around water quality monitoring programmes, the assessment of ecological flow requirements, as other baseline surveys.
3. Following the Five Yearly survey, the first bi-annual survey limited to using the SASS method needs to be commissioned as the first of the routine surveys, six months after the Baseline survey.
4. The first and subsequent Annual Reports need to be produced.
3.4 COST OF IMPLEMENTATION
The cost of a biomonitoring programme is generally much less than other forms of monitoring, yet the information generated is substantial. This programme has been designed to provide reliable overview information on the status of the system at low cost, (Table 2.5). Note that this costing does not include the cost of Investigational Monitoring which would emanate from routine surveys where a “hot spot” has been found. This cost would have to be determined based on the needs of a particular case, and be included in the recommendation to Parties.
Table 2.5. Approximate operational costs (2009) for a complete survey programme. Costs based on 57 sites. Costs in SA Rands.
ANNUAL MONITORING
Cost item Rate Total per annum
Cost per SASS sample, surveyed 2x per annum
R720 R90,000
Reporting – Annual Report
1 per annum R30,000
Travel costs 14000 km @ R3.50/km R100,000 S&T R700 per day R90,000 Contingencies R20,000
TOTAL cost per annum R330,000
OPERATIONAL COST PER MEMBER STATE
Cost per Member State
Total per annum
Comment
Botswana 0 As there are no surface waters – no sites have been proposed for Botswana. However, this Member State will still participate in training and accreditation.
Lesotho R 24, 000 This includes sampling at sites already undertaken by LHDA, so actual costs would be lower
Namibia R 6,000 This includes only one site in Namibia, as the joint sites on the Orange are already part of SA’s RHP.
South Africa R 300,000 The SA sites are already part of the RHP, and so actual costs are potentially negligible. (If the RHP sites are monitored).
TOTAL cost per annum
R330,000

Page 18
The cost for the Five Yearly surveys is presented below (Table 2.6).
Table 2.6 Approximate costs (2009) for a complete Five Yearly survey. Costs based on 57 sites in SA Rands. Note that costs assume that water quality and flow data from weirs is otherwise available from other programmes.
FIVE YEARLY MONITORING (APPROXIMATE COSTS)
Cost item Rate Total per survey
SASS R720 R42,000 IHI R400 R57,000 Fish R1,500 R86,000 Riparian Vegetation R720 R41,000 Diatoms R720 R41,000 Geomorphology R720 R41,000 Assessment of hydrological data (weirs)
R2,000 R57,000
Assessment of existing water quality data
R1,000 R60,000
Reporting – Annual Report
1 per annum R75,000
Travel costs 14000 km @ R3.50/km R50,000 S&T R700 per day R170,000
TOTAL costs for Five Yearly Monitoring
R720,000
Start up costs i.e. once-off only
Establish reference conditions for SASS in all Ecoregions
R60,000
Refine guideline for interpretation of SASS
R100,000
Total Start up costs R160,000
Page 19
4. REFERENCES
Chutter, FM (1994). The rapid biological assessment of streams and river water quality by means of macroinvertebrate communities in South Africa. In Uys MC (ed) Classification of Rivers and Environmental Health Indicators. Water Research Commission Report No. TT 63/94, South Africa, pp 217–234.
Dallas, H.F. (2007). River Health Programme: South African Scoring System (SASS) data interpretation guidelines. Prepared for the Institute of Natural Resources and the Resource Quality Services Department, Department of Water Affairs and Forestry, Pretoria, by the Freshwater Consulting Group, Cape Town, South Africa.
Department of Water Affairs and Forestry (2007). Quality Assurance for the National
Aquatic Ecosystems Health Monitoring Programme: River Health Component. Prepared
by the Institute of Natural Resources for DWAF, Pretoria, South Africa.
Department of Water Affairs and Forestry (2008). National Aquatic Ecosystem Health Monitoring Programme (NAEHMP): River Health Programme (RHP) Implementation Manual. Version 2. Department of Water Affairs and Forestry, Pretoria, South Africa.
Dickens, CWS and Graham PM (2002). The South African Scoring System (SASS) Version 5 Rapid Bioassessment Method for Rivers. African Journal of Aquatic Science 27:1-10
Dickens, CWS (2009) A Scoping Study for an Aquatic Ecosystem Health Monitoring Programme for ORASECOM. Report to ORASECOM
Kleynhans CJ. (1996). A qualitative procedure for the assessment of the habitat integrity status of the Luvuvhu river (Limpopo system, South Africa). Journal of Aquatic Ecosystem Health 5: 41-54
Kleynhans CJ. (2008) River Classification Manual for Ecostatus. Module D. Fish Response Assessment Index (FRAI) Report No. TTT330/08, Water Research Commission, Pretoria.
Kleynhans, C.J., Louw, M.D., Thirion, C., Rossouw, N.J., and Rowntree, K. (2005a). River EcoClassification: Manual for EcoStatus determination (Version 1). Joint Water Research Commission and Department of Water Affairs and Forestry report. WRC Report No. KV 168/05. Chapter 3: Geomorphology Driver Assessment Index.
Kleynhans, CJ, Thirion, C and Moolman, J (2005b). A Level I River Ecoregion classification System for South Africa, Lesotho and Swaziland. Report No. N/0000/00/REQ0104. Resource Quality Services, Department of Water Affairs and Forestry, Pretoria, South Africa.
Kleynhans CJ. Mackenzie JA. and Louw MD. (2008) River Classification Manual for Ecostatus. Module F. Riparian Vegetation Response Assessment Index (VEGRAI) Report No. TTT333/08, Water Research Commission, Pretoria.
Kleynhans CJ. Louw MD. Graham M. (2009). Module G: EcoClassification and EcoStatus determination in River EcoClassification: Index of Habitat Integrity (Section 1, Technical manual) Joint Water Research Commission and Department of Water Affairs and Forestry report. WRC Report No. TT 377/09

Page 20
Taylor JC, De La Rey PA and Van Rensburg L (2005). Recommendations for the collection, preparation and enumeration of diatoms from riverine habitats for water quality monitoring in South Africa. S. Afr. J. Aquat. Sci. 30 (1) 65-75.
Taylor, JC, Harding WR, Archibald CGM. (2007) WRC Report No TT 282/07. Water Research Commission, Pretoria

Page 21
APPENDIX A – OSAEH MONITORING SITES
Legend: OSAEH Site Number – represents Ecoregion number and site number per Ecoregion Sites Monitoring Site P – possible sites; Monitoring Site C – current sites (2009) mostly with data; Ecological Reserve Sites – as surveyed by the DWA in undertaking Ecological Reserve or Environmental Water Requirements studies, thus with data. Member State Site Code – the code utilised by the Member State, in this case mostly by DWA in South Africa and LHDA in Lesotho. Ecoregions 11_Highveld; 15_Eastern Escarpment Mountains; 26_Nama Karoo; 28_Orange River Gorge; 29_Southern/Central Kalahari
OSAEH SITE NUMBER
SITE CATEGORY
ECO REGION MAJ_RIVRS LAT LONG
Member State SITE
CODE
OSAEH_11_1 Monitoring Site
P 11 Vaal -27.51729 26.21604 C2VAAL-BLOEM
OSAEH_11_2 Monitoring Site
P 11 Vaal -27.03820 28.57393 C1VAAL-
VILLI
OSAEH_11_3 Monitoring Site
C 11 Vaal/Mooi -26.68283 27.09856 C2MOOI-MEULS
OSAEH_11_4 Monitoring Site
C 11 Vaal/Skoonspruit -26.93333 26.66527 C2SKOO-
URANI
OSAEH_11_5 Monitoring Site
C 11 Vaal/Vals -27.48683 26.81305 C6VALS-PROKL
OSAEH_11_6 Monitoring Site
P 11 Vaal/Renoster -27.05286 27.00991 C7RENO-
R501B
OSAEH_11_7 Monitoring Site
P 11 Vaal -27.03040 29.08733 C1VAAL-BRAKS
OSAEH_11_8 Ecological
Reserve Site 11 Vaal/Blesbokspruit -26.47500 28.43194 C2BLES-MARAI
OSAEH_11_9 Reference Site 11 Vaal/Klip -27.47008 29.60048 C1KLIP-UNSPE
OSAEH_11_10 Ecological
Reserve Site 11 Vaal/Waterval -26.63518 29.02262 C1WATE-EWR01
OSAEH_11_11 Ecological
Reserve Site 11 Vaal/Waterval -26.83428 28.92836 C1WATE-EWR02
OSAEH_11_12 Monitoring Site
C 11 Vaal/Klip -26.54934 28.06435 C2KLIP-SLANG
OSAEH_11_13 Reference Site 11 Vaal/Kromellenboogspruit -26.80030 27.58428 C2KROM-
AVAAL
OSAEH_11_14 Monitoring Site
C 11 Vaal/Suikerbosrand -26.68122 28.05011 C2SUIK-BADFO
OSAEH_11_15 Reference Site 11 Vaal/Suikerbosrand -26.64672 28.38197 C2SUIK-DEHOE
OSAEH_11_16 Monitoring Site
P 11 Vaal/Wilge -27.30700 28.54195 C8WILG-UNSPE
OSAEH_11_17 Monitoring Site
P 11 Wilge/Liebenber -27.53083 28.47556 C8LIEB-TWEEL
OSAEH_11_18 Monitoring Site
P 11 Riet/Modder -29.16111 26.57194 C5MODD-
SANNA
OSAEH_11_19 Monitoring Site
P 11 Riet/Modder -28.80722 26.10694 C5MODD-
SOETD
OSAEH_11_20 Ecological
Reserve Site 11 Caledon/Leeuspruit -29.52197 27.13561 D2LEEU-EWR06
OSAEH_11_21 Reference Site 11 Modder/Karonnaspruit -29.08107 26.62615 C5KORA-MOCKE
OSAEH_11_22 Monitoring Site
P 11 Orange -30.50472 27.21889 D1ORAN-HERSC

Page 22
OSAEH_15_1 Ecological
Reserve Site 15 Caledon -28.72231 28.15083 D2CALE-EWR03
OSAEH_15_2 Reference Site 15 Malibamatso/Matsuko -29.25583 28.56417 LHDA IFR
SITE 1
OSAEH_15_3 Monitoring Site
P 15 Senqu -30.06556 28.40770 LHDA IFR
SITE 5
OSAEH_15_4 Reference Site 15 Malibamatso To be
decided To be
decided PROP IFR
SITE
OSAEH_15_5 Monitoring Site
P 15 Malibamatso -30.03630 28.22250 LHDA IFR
SITE 8
OSAEH_15_6 Monitoring Site
P 15 Caledon -29.35434 27.44597 D2CALE-LADYB
OSAEH_26_1 Ecological
Reserve Site 26 Vaal -29.00083 23.80646 C9VAAL-DOUGL
OSAEH_26_2 Reference Site 26 Orange -29.60070 24.09160 D3ORAN-HOPET
OSAEH_26_3 Monitoring Site
P 26 Orange -29.16207 23.69651 D3ORAN-MARKS
OSAEH_26_4 Monitoring Site
P 26 Orange/Hartbees -28.84095 20.61190 D5HART-CORAN
OSAEH_26_5 Reference Site 26 Modder/Kaalspruit -28.97005 25.80632 C5KAAL-KRUGE
OSAEH_26_6 Ecological
Reserve Site 26 Riet -29.48389 25.19861 C5RIET-
IFR04
OSAEH_26_7 Monitoring Site
P 26 Orange/Brak -29.91500 23.17031 D6BRAK-CONFL
OSAEH_26_8 Monitoring Site
P 26 Caledon -30.45233 26.27088 D2CALE-TUSSE
OSAEH_26_9 Reference Site 26 Riet/Kromelenboogspruit -29.64470 25.46472 C5KROM-
CRIET
OSAEH_26_10 Ecological
Reserve Site 26 Riet -29.57528 25.70805 C5RIET-
IFR03
OSAEH_26_11 Monitoring Site
P 26 Orange/Kraai -30.70364 26.77132 D1KRAA-CORAN
OSAEH_26_12 Monitoring Site
P 26 Orange/Seekoei -30.38766 25.00357 D3SEEK-VANDE
OSAEH_26_13 Monitoring Site
P 26 Orange/Stormbergspruit -30.70364 26.44681 D1STOR-CORAN
OSAEH_26_14 Monitoring Site
P 26 Orange -30.57305 26.45305 D1ORAN-GOEDE
OSAEH_26_15 Monitoring Site
P 26 Orange -30.50305 25.22555 D3ORAN-
BULTF
OSAEH_26_16 Monitoring Site
P 26 Orange -29.66075 22.75574 D7ORAN-
PRIES
OSAEH_26_17 Monitoring Site
P 26 Orange -28.43861 21.40583 D7ORAN-
GIFKL
OSAEH_26_18 Monitoring Site
P 26 Fish -26.80313 17.78942
OSAEH_28_1 Monitoring Site
P 28 Orange -28.96411 19.14531 D8ORAN-
PELLA
OSAEH_28_2 Monitoring Site
P 28 Orange -28.51115 20.17482 D8ORAN-
BLOUP
OSAEH_28_3 Ecological
Reserve Site 28 Orange -28.90205 18.42036 D8ORAN-
ABBAS
OSAEH_28_4 Ecological
Reserve Site 28 Orange -28.73645 17.61856 D8ORAN-
VIOOL
OSAEH_28_5 Ecological
Reserve Site 28 Orange -28.04051 17.06967 D8ORAN-BOOMR
OSAEH_29_1 Monitoring Site
P 29 Vaal/Harts -28.35124 24.31354 C3HART-DELPO
Page 23
OSAEH_29_2 Monitoring Site
P 29 Vaal -28.11097 24.80193 C9VAAL-WARRE
OSAEH_29_3 Monitoring Site
C 29 Vaal/Vet -27.93412 26.12094 C4VET-HOOPS
OSAEH_29_4 Monitoring Site
C 29 Vaal -28.72533 24.07293 C9VAAL-SCHMI
OSAEH_29_5 Ecological
Reserve Site 29 Riet -29.02805 24.51250 C5RIET-
IFR01