manual for report writing in engineering design
TRANSCRIPT

L
L l L l l
Manual for
Report Writing in Engineering Design
Guldellnes for Advanced Engineering Students
Sponsored by: Michigan Technological University
• College of Sciences and Arts • College of Engineering
National Science Foundation Whirlpool Foundation

Acknowledgments
This manual was made by possible by grants £rom the National Science Foundation end the Whirlpool Foundation, wbieb funded a collaborative proposal by the College of Engineering ancti the Department of Humanities at Michigan Technological University. The manual is also based on a prototype written by Dr. Bruce Barna end used in senior engineering design courses for 10 years. We thank all the senior engineering students who participated in developing the prototype of this manual, especially Joseph Bigalke, Jeff Ferrio, Richatd Miller, Scott Wendt, and Chris Worthington. Special than.ks to consultants Lillian Bridwell-Bowles, the University of Minnesota, and Andrea Lunsford, the Ohio State University.
Editor, Co.author, Graphic Designer
Associate Editors and Co-authors
Associate Editors end Co-authors
Assistant Edi tors
Editorial Assist.ant
August, 1992
Sarah A. Watke, Humanities
Betsy M. Aller, Chemical Engineering Carol Brown, Humanities Marsha Penti, Humanities Kathryn A. Remlinger, Humanities Diana Ri.sdon, Humanities Gerald Savage, Humanities
Bruce A. Barna. Chemical Engineering
Elizabeth A. Flynn, Humanities Davis W. Hubbard,
Chemical Engineering Dale Sullivan, Humanities
William Bulleit., Civil Engineering Jack Jobst, Humanitieli Anand Kulkarni,
Electrical Engineering Francis Otuonye, Mining Engineering Ruthann Ruehr, Humanities N. V. Suryanarayana,
Mechanical Engineering
Linda M. Reinhardt, Humanities
Printed by Midligan Tec:hnok;9eal Uniwni'ly (MTIJ) Ol'I ~cycled paper. MTU Is .,.. equal qipol1unity educational lnstlll.llionlequal opp0t1JJnlty employer. Co~hl Cl 1992 by Davis W. Hullberd, Ebzebelfl A. Flynn. Bruce A. Barna, •nd others.
~
I l
I I 1 l l l l l 1

-L L L l
Contents
AcknowledgDlents ........................................................................ ii Preface .......................................................................................... v Introduction .............................................................................. ... vi
Part I: Planning Introduction: The Proceea of Writing ........................ ............. 2 Audiences: Considering Their Needs ..................................... 3 Planning Your Engineering Deeip Report ............................ 4
Part 11: Arnmpment Components of a Formal Engineerine Report ...................... 10
Front Matter: Helping Readers Use Your Report .......... 11 Letter of Transmittal: Addressing the Recipient ........ 12 Title Page: Entitling Your Document .. ... ..................... 14 Table of Contents: Guidin&' Your Readers ...... .... ......... 16 Executive Summary: Condensing Your Report ........... 18
Body of the Report: Including Standard Sections ........... 21 Introduction: Orienting Your Reader .......................... 22 Procedures: Explaining Your Methods ........................ 24 Results: Describing Your Desip ................................. 26 Discussion: Analyzing Your Results ............................ 28 Conclusions: Interpreting Your Reeul ts ...................... 30 Recommendations: Calling for Action ......................... 32
References: Establishing Your Soun::el\I · .......................... 34 Appendixes: Supplementing Your Report ....................... 36
Letter Reports: Adapting the Formal Report ...................... 38
Part ID: Visual Aspects Figures: Using Them in Your Text ..................................... .44 Tables: Using Them in Your Text ........................................ 46 Report Format: Framing Your Work .................................. .48 Headings: Setting Several Levels ........................................ 49
Part IV: Calculations Calculations: Documenting the Basis of Your Report ......... 52
Part V: Style Using Consistent Style in Your Deeicn Report .................... 58 Style Considerations in Engineering Design Reports .......... 59
Recognize Active and Passive Voice ................................. 59 Make Sure Subject and Verb Arree Numerically ............ 61 Rescue Dangling Modifiers ............................................... 61 Use Inclusive Language .................................................... 62 Apply Hyphens Correctly .................................................. 63 Select Numerals or Words for Numbers .......................... 64

Part VI: Other Concerns Ethics and Writing: Acting Reeponsibly .............................. 66 Politics and Writing: Reading Power Balances ................... 68 Logic and Writing: Making Sense in Ar-lumen ts ................ 70
Part VII: Oral Reporte Differences Between Written and Oral Reporting ............... 76 Planning Your Oral Report .................................................... 77 l Organizing Your Material ...................................................... 77
Setting the St.age for Your Material ...... ............................ 77 Arranging the Body of Your Presentation ........................ 78 1 Concluding Your Presentation .......................................... 79
Practicing Your Presentation ................................................. 79 Delivering Your Oral Report .................................................. 79 Group Report Present.ations .................................................. 80
Planning the Group Presentation ..................................... 80 Adapting to Time Constraint.a ........................................... 81 Making Consistent Group Visuals ............................ ........ 81 Presenting the Group Report ...................................... ...... 81
Creating Effective VIS ual Aids ................. .......... ···· · ·· · ·· · · · · .. · · .. 82 1 Conquering Nervousness ....................................................... 83
Appendix k Sample Calculations .......... : ................................. 85 l Appendix B: Sample Engineering Reports ............................... 91
Bl - Civil Engineering ........................................................... 92 B2 - Electrical Engineering ................................................. 104 B3 - Mechanical Engineering .................................... : ......... 122 l B4 - Mining Engineering ..................................................... 136
1
l l l I l 1

To Engineering DesJgn Students
Preface
This manual was written for you as a student facing a double challenge: 1) to learn engineering design and, at the same time, 2) to leam how t.o present your designs in formal technical reports. Development of this manual was prompted by the lack of instruction books available to help you meet this challenge. While the manual was written as a guide for students in engineering design courses, it may also be useful for practicing engineers and other technical communication people.
If a design is not well-communicated, it may not even be considered, may not be selected, or may be misused. For this reason, the Accreditation Board for Engineering and Technology (ABET) has required since 1987 that your design education include the communication of your design. The purpose of this manual is to help you fully communicate your designs.
The manual was written and edited collaboratively by engineering faculty and writing faculty and graduate students over a two-year period. During those two years, the manual writers attended design classes with engineering students and their instructore. The writers also met with design students outside of cla88 as the students were developing their reports. Engineering desiin students usertested the manual. granted interviews about their learning processes, and suggested specific improvements. The recommendations on content and format made here result from an extensive negotiation process with engineering and h11maniti.es faculty and students.
The graphic design of the manual is intentionally modular. In Part II: Arrangement and Part III: Visual Aspect&, two-page spreads give general instructions and list guidelines on the left page, while the right page features a typical example. Therefore, each chapter starts on the left and is visually complete for your study and use in drafting Your writing.

Introduction: Report Writing in Engineering Design
AB engineers, you will be asked to write a variety of reports, memos, letters, proposals, and progress reports which document your engineering work. This manual's focus is on presenting the results of your engineering design work. In your design class, your instructors provide experiences similar to those found in industrial situations so you can practice communicating your design work both in written and in oral formate. For you and other students of engineering design reports, as well as for experienced engineers who are still students of writing, communicating effectively in written reports remains a challenging task. Successful engineers not only do the technical part of engineering well but also communicate that work effectively. This manual will help you team and practice many aspects of effective communication through written formal reports and letter reports, as well a.s oral reports.
No text can substitute for the experience that actual practice provides. However, the Manual for Report Writing in Engineering Design presents realistic design report writing information and examples to help you communicate your ideas. The manual begins by discussing elements of Planning, such as considering audience and drafting techniques. Part II: Arrangement discusses the front matter and body of an engineering report and illustrates these with examples. In addition, this section presents ideas on using and citing references, as well as supplementing your report with appendixes. The third section, Visual Aspects, gives ideas on using figures and tables in the text, as well as format and heading recommendations. Part IV: Calculations presents infonnation on documenting the calculations, which may be the basis of your report. · Part V: Style provides editing suggestions, such as paying close attention to word choice, grammatical agreement. and punctuation.
Although planning, visual aspects, document.a tion, and editing are central to report writing, you know through experience with writing and speaking t hat other concerns are vital to good communication. For that reason, Part VI: Other Cancerns addresses ethical and political issues that you should consider as you write. In addition, this section presents a discussion on composing a logical argument.

Report Writing Mllnual - Page vii
Because you will often be called on to communicate your work in oral as well as written form, Part VII: Oral Reports provides suggestions for organizing your information and presenting it. Helpful hints on preparing visual aids and overcoming nervousness are also included. The manual concludes with appendixes of sample calculations and some examples of engineering reports.
The objective of a design report is to clearly communicate your ideas and results to your audience. Reading and using this manual will guide you in this process. However, remember that this manual is not your only resource; you also have team members, instructors, and other texts to assist you in meeting your objectives.
We hope this manual helps you to communicate effectively in your design courses and also in your future professional life.
Part I: Planning
Introduction: The Process of Wrlti ng
Audiences: Considering Their Needs
Recognize Multiple Audiences Avoid Faulty Assumptions Determine Needs and Uses
Plannl ng Your Engineering Deslg n Report
Invention: Creating Through Wrlti n g Composing Processes: Drafting Your Report Models: Looking at Other Reports Exploratlon: Using Journals Literature. Searches: Finding Materlals Field Research: Gathering Information Collaboration: Working in Peer Groups Enculturatlon: Assuming Professional Roles

Introduction: The 1Process of Wr,i'ling
You know that developing a project takes time and planning~ Often you might feel as if your project is trapped in some kind of infinite loop.. For instance, suppose you have already drafted what you feel is a fine description of a design for reducing hexane in a vent stream. Then you discover another article that gives you insight into new options for reducing hexane concentration in the vent stream. Wanting to incorporate this new information into your report, you revise the draft to include what you've learned.
Writing the project report develops through a recursive process similar to the process of learning. The writing process is typically composed of five stages: planning, drafting, revising, editing, and publishing. You know from experience that these stages generally do not develop in sequence; rather they overlap and fall back on each other until you have composed a "final" piece. You might even revise or otherwise transform this "final" copy after your instructor has reviewed your report. Part of planning your report relies on your use of writing as a process. Allow your writing to develop; break down and build up aspects of your report as necessary to produce the best final version you can.
This section of the manual focuses on the first stage of the writing process, planning.. Another term for planning is prewri ting; a lot of what goes on in this stage occurs before you actually write the report. However, you might find yourself planning as you write or even after you have written a draft. Remember that writing is a recursive process. As you plan, consider these aspects ofprewriting and how they interact to develop your ideas in to a draft: considering the audience to whom you are writing, reading articles and other reports to generate ideas for your own project, writing not.es and logging procedures in a journal, exchanging ideas with group members and your instructor. Planning is the backbone of a strong report. Just as your design class helps you to understand what is involved in an engineering project, planning your writing allows you to develop your ideas into a finely-tuned report.

t
L I t L L
l I
Audiences: Considering Their Needs
Recognize Multlple . Audiences
Avoid Faulty Assumptions
Determine Needs and Uses
When preparing your report, you must keep in mind the various audiences that will use the report and their particular needs. For example. your audience may include other engineerst management personnel, and marketing and accounting experts as well as people outside the company involved in government and related businesses. Audience analysis means identifying the people who will use your report and determining what their needs are.
Try to avoid making faulty assumptions about the interests and expertise of your audiences. Avoid the following pitfalls: 1
•Don't assume that the addressee in your letter of transmittal is your primary audience.
• Don-t assume that all who read the report have the same expertise~
• Don't assume that the report has a finite period of use.
• Don•t assume that the audience has been aware of the daily decisions leading to the writing of the report, or that the audience is a ware of the original assignment.
•Don't assume that the audience eagerly awaits the report.
To write an effective report, determine who these audiences are_ what they need from the report, and how they will use it. To get this information, you can answer the following questions:
•Who are all the possible audiences and what are their primary functions?
•What are the budget, production, or contract obligations of the audiences?
•What decisions are to be made as a result of this report?
• What business concerns might override technical concerns?
1Besed on J. C. Mathes and Dwight W. Steveneon. ~signing Technical &ports: Writing for Audknces in Organizations. 2nd ed. New York: Macmillan, 1991.

Report Writing Manual - Page 4
Planning Your Engineering Design Report
Invention: Creating Through Writing
Composing Processes: Drafting Your Report
You may think of invention as the creation of an object or tool, but invention is also a term for the process of creating something new through writing. As you write design reports, you may participate in some of the following invention activities:
• Reading reports written by students in previous years' classes
• Keeping personal notebooks and journals
• Doing literature or resource searches
• Conducting field research
• Collaborating with fellow group members
•Assuming professional roles
These activities are essential to complete your project and your report.
Writing is a complex process which involves reading and synthesizing material from different sources. Design report writing is especially complex because it integrates the equations, formulas, and diagrams of the design process with the recursive process of writing. "Recursive" means that the prewriting, drafting, rewriting, and editing stages of writing repeat themselves indefinitely, looping on each other, As a student, you are often learning design methods and report writing simultaneously, which adds to the challenge.
As a writer, you must decide how to present material in the context in which the report is being written. Material that has been discovered through the research process cannot simply be transmitted; it must be interpreted and carefully shaped.
l I l I l
I l
Sometimes students believe their job is to transfer l information rather than to interpret it. They see themselves as passive conveyors rather than active creators. This attitude leads to stilted writing; material is strung together l
I

L L L
l
Rirn Wntill;( M1111"'6l -P.:r'
Planni:ng Your Report (cont.)
Models: Looking at Other Reports
Exploration: Using Journals
rather than integrated and is rarely revised to any extent. Strive, instead, to become an active interpreter of your research. Industry needs your combined designing and interpreting skills; your readers need you to help them see the significance and the usefulness of your research.
You may want to review reports of previous students and use them as models for your report, provided you do your own work and develop your own report. Engineering instructors may provide you with past reports to read or may analyze successful reports in class, pointing out their good features and common mist.a kes. Some instructors may display examples of reports they have written while working in industry to show what is expected in a professional setting.
Writers find that look.i ng at a model report is a good way to figure out how to start their composition process. Appendix B of this manual features engineering students• reports considered good by engineering instructors.
Your instructor may ask you to keep a notebook or journal where you can explore ideas. Writing can be used to develop your own thinking, as well as to communicate with other readers. Think, for example, of the times you have made lists to avoid forgetting to do or to buy something.
Writing for yourself can be more than a memory jogger; it can be a powerful way to promote learning. Think of the times you have sat down to write about an idea and, ip the process of writing, have surpri eed yourself by coming up with an unexpected insight or a new way of thinking about something.
Journals or design notebooks are very useful because they encourage you to explore ideas informally with.out the constraints imposed by formal writing assignments. You can use a journal in a number of ways. Your instructor may ask you to make journal entries during a class period. Your response might be focused or open-ended. You might be asked to summarize the homework assigned in the previous class to clarify difficult ma terlal and stimulate discussion of

Report Writing Manual - Page 6
Planning Your Report (cont.)
Literature Searches: Finding Material
Field Research: Gathering Information
Collaboration: Working in Peer Groups
it. You might also describe the processes you are employing to prepare a report.
In a journal, you may try out parts of your report using both calculations and prose. Journals provide you the freedom to explore, to make mistakes, to take risks.
Your instructor may encourage you to search for literature in the library or in department offices. Reading this material often helps you write parts of your report. This search period can be an appropriate time to work on writing your report by formulating some paragraphs in a notebook or on a computer disk.
Field research can include gathering information by visiting plants, making phone calls, using FAX machines, and speaking with knowledgeable individuals on- and offcampus. Engineering faculty may encourage you to use these methods, noting that they simulate professional engineering practices.
As you call companies to inquire about specifications of their products or walk across campus to speak with an engineer in another department, you gain experience to help integrate you into the profession as well as resources to write a specific report. Notes generated or thoughts inspired by these activities are essential parts of the writing process.
Ideas for creating writing are generated not only by using a word processor or ink and paper, but also by talking. Within your own group, as well as with other classmates, you can discuss ways to accomplish your project. Peer groups can serve as editing teams for your reports and can also prepare you to perform teamwork in industry.
l l l l l I l
1
1

l l l I l l l l l
Report Writing Manual - Page 7
Planning Your Report {cont.)
Enculturation: Assuming Professional
Roles
For instance, your instructor may assign a problem to a design team. This working method can have two benefits:
1. To get the job done as team members, you learn to parcel out the work, coordinate your efforts, and produce a design and report satisfactory to the whole group. You learn to critique early drafts, and you cooperate to generate content, strategies, and wording. You also begin to shift your reliance away from the instructor's authority and rely more heavily on the opinions of your peers.
2. Your group begins to build an identity. Group work can transform a perfunctory class into an exciting experience, anticipating the working environment you will soon enter.
Your design class allows you to understand what is involved in an actual engineering project. Your professor will probably encourage you to consider the real world of the professional engineer so you can fulfill that role and can be more easily enculturated into the engineering community.
The type and extent of your work will vary according to your engineering discipline. You may, for example, fabricate a product or create drawings and calculations ready to give to a contractor. You and your professor may assume particular roles to enhance this simulation. Your professor may act as a departmental supervisor in industry. Thinking about what is expected of you in specific roles and in actual situations will give you reasons to write and encourage you to improve your writing process.

t L
Part II: Arrangement
Components of a Formal Engineering Report
Front Matter: Helping Readers Use Your Report letter of Transmittal: Address Ing the Recipient Title Page: Entltflng Your Document Table of Contents.: Gu1ding Your Readers Executive Summary: Conden~ing Your Report
Body of the Report: including Standard Sect,ions lntrod uction: Orientl ng Your Reader Procedures: Explaining Your Methods Res·ults: Describing Your Design Discussion: Analyzing Your Results Conctuslons: Interpreting Your Results Recommendations: Catung for Action
References: Establlshlng Your Sources Appendbtes: Supplementing Your Report
letter Reports: Adapting the F.:ormal Report
JUrrt Wririnf M.,....J - P~t JO
Components of a Formal Engineering Report
Standards Vary in Companies
Report Chapters Provide Examples
Over the years, engineering technical writers have developed recognized ways of arranging content in reports. This manual teaches you to use a particular arrangement for your reports. Arrangement is important in technical reports because it gives order to complex materials. Learning an accepted arrangement frees your mind to spend more time on content. Your readers rely on arrangement to help them read and act on a report more quickly.
The first step in arrangement is learning the components of a design report. A complete engineering design report usually consists of the following elements:
• The front matter
• The body of the report
•The references
•The appendixes
Report standards vary from company to company. The standards presented in this manual will give you a solid foundation in writing, arranging, and editing design reports. With this foundation, you can adapt to any employert s report standards.
In Part II: Arrangement and Part III: Visual Aspects each element (i.e., Letter of Transmittal) or report section (i.e., Procedures) appears on the left page, accompanied by a typical example on the right page. The same exampl~ (from a report about a chemical processing system to extract vernonia oil) runs throughout these chapters. For examples from other engineering disciplines, see Appendix B: Sample Engineering Reports.
l I 1 I 1 I 1 1 l
l
L
l I l l
Front Matter: Helping Readers Use Your Report
Front Matter Is Important
The front matter of a design report includes the following element.a:
•The letter of transmittal
•The title page
•The table of content.a
• The executive summary
These elements are not considered to be part of the actual report. or what is called the body of the report, but are usually included when the report is mailed to a client.
Front matter provides basic infonnat.ion your reader needs when reading your report.
•The letter of transmittal introduces the report to the reader and is never listed in the table of contents.
• The title page provides a frame of reference for the reader.
•The table of contents outlines the report.
• The executive summary gives an overview of the report, stressing findings and recommends tions.
Inexperienced writers make the common mistake of labeling the components of front matter with the term "Front Matter." Do not use this term as a heading in your report The term is simply a useful way of categorizing certain elements of a report so we can discuss them. The same is true for "the body" of the report and "the back matter." Instead, use headings that specifically denote the topic of that section. See the Table of Contents for our sample report on vernonia oil, page 17, for heading examples.

lUptn1 Writinz M...W - P.,~ 12
Letter of Transmittal: Addressing the Recipient
First Paragraph
Second Paragraph
Thi rd Paragraph
The letter of transmittal is the written equivalent of what you would say if you were handing the report to your supervisor personally. Address the letter to the person who is ini ti.ally resp:msible for acting on the report. In your design class, this person probably would be your instructor.
The needs of your audiences and the purpose of your report determine what you say in your letter of transmittal. Consider the five following basic components:
• Review why the report was written, including the date it was assigned. Refer also to the assignment number or other assigned identification.
• State the title of the report.
•Discuss the sc·ope of your report. Include the main purpose of the report, plus any limitations of the report or omissions of material the reader might expect to be included.
• State your single, key conclusion or recommendation.
• Acknowledge any special assistance you had in completing the report. Express closing cordialities.
Important: Because the letter of transmittal is not part of the report itself, use the following guidelines:
• Do not bind the letter with the report. Place the letter on top of the report~
• Do not list the letter of transmittal in the table of contents.
• Do not refer to the letter of trans.mi ttal within the report.
• Use the letter of transmi tt..al to convey controversial or confidential information that concerns the report but should not be circulated with the report.
I I I I l l

l t
l l L
Example of Letter of Transmittal: Vernonia Oil
At Least Four Lines Aller Date-
(&uup 1 Douglasa Houghton Hall Michigan Teehno1ogi.cal University Houghton, MI 49931
December 20, 1991
Dr. Devis Hubbard Assistant Division Superintendent Fictitious Chemical Company Hough~, Ml 49931
Dear Dr. Hubbard:
Date Aargned-- On Sept. 61 1991. Group 1 began a study on the reaeibility or producing Purpa1e vernonia oil for use as a nonvolatile reactive paint di1uent. This study
is being conducted in four phases. Phase I reported the results of the market sur1ey and technical feasibility study. We round that vemonia oil is attractive because it can replace some of the volatile organic compounds CVOCs) currently med in the paint industry. Impending legislation targets the reduction Qf'VOCs. We. recommended ose of a solvent extraction plant using a Bollman exttactor operating at a eapac.i.ty of 2. 7 million gallons of vernonia .oil per year. In Ph·ase II, we cottstructed mass and energy balances for a plant of the recommended capacity. Op'portunities for increasing energy efficiency were also identified.
In tins _Phase lll report, Preliminary Cost Evaluation, we cover the SCOIJI sizing and costing of equipment_ and we outline revised energy cost
estimates. Total equipment .coet is $US mi11fon1 resulting in a flxed capital investment of"·$5.2 million. Operating expenses were estimated using a Vernonia golameuis seed price of 0.25 per kilogram. Total operating expenses are $10.90 MM/CY, based on average ub1ity~cost.s of $710.000/CY. Product revenue has been estimated at $16.8 MM/CY. A
CloslflD Remarks- complete econonric anely:sis will be presented in the fourth report.
Sincerely,
Four Lines ... -) ~ f\ \. f\ r After Closure- ~~~\-A~.-,
Richard Mi11er, GToup leader
Group members: Joseph Bigalke, Jeff' Fenior Scott Wendt, and Chris Worthington
Encl. Commercialization oCVemonia Oil~ Plant Design II

Report Writing Manual-Page 14
Title Page: Entitling Your Document
Title Page Information
The title page of your report is the first part that most readers will look at. Remember that a basic function of most technical reports is to help other people do their jobs. Your title should help those people decide whether they need to read your report.
The title page tells your readers some important things about you and your company and should look professional. The title page for a design report should include the following information:
•The title of the report. The title should clearly state the purpose of the report.
•The course number, title, and term.
•The name of the person and/or company for whom the report is written.
• The name(s) of the person(s) who wrote the report.
•The date the report is submitted.·
1
l 1
l l l l 1
l 1
l l

l
L
l t l l
Report Writing Manual- Page 15
Example of a Title Page: Vernonia Oil
Tltle-
Course Number
Recipient's Name-
Date Submitted-
Authors--
COMMERCIALIZATION OF VERNONIA OIL
Preliminary Cost Evaluation
CM 422: PLANT DESIGN II Submitted to Dr. D. Hubbard and Dr. B. Barna
May 10, 1992
Richard Miller, Project leader
Project team members: Joseph Bigalke Jeff Ferrio Scott Wendt Chris Worthington

Report Writing Manual-Page 16
Table of Contents: Guiding Your Readers
List Headings as in Report
List Figures and Tables Separately
The table of contents is a detailed guide to your report. Readers use the table of contents to understand the organization and the major elements of the report. Because a technical report is a tool to help people do their jobs, they will use the table of contents to find the specific sections of the report they need for their work.
The table of contents should correspond to the outline of your report. Every section and subsection heading listed in your table of contents should appear the same way in the report. However, lower level headings need not appear in the table of contents.
Structure your table of contents as follows:
• Head the page with the identification, Contents.
• Give the main section titles of your report the most prominence by use of capital letters.
• Indicate subsections of the report by giving them less prominence. Use upper and lower case letters and/or indentation.
• Provide the page number on which each section and subsection begins.
• Design your table of contents to allow your reader to locate specific sections and subsections easily, and to see the way the report is organized.
• Provide separate lists of figures and tables appearing in the body of your report immediately after your table of contents. The list should refer only to items in the body of the report, not to items in the appendixes.
• Note: The preferred style is to include the executive summary in the table of contents just before the introduction to the body of the report. Some companies and some instructors omit the executive summary from the table of contents, however, because it is sometimes transmitted alone.
I I I I I
I I l l l

Example of a Table of Contents: Vernonia Oil
Contents
Main Sections EXECUTIVE SUMMARY ... .-.uu~-· ........ -····-· ... .w.u ......... r ...................... 1 In All C..,. INTRODUCTION ·-•H••--.. H•• .. ·-· ............... n•• Hh• ........ - ... H ...................... 2
1 Phase Ill C>l:>jeetives ·---·-----···-••HH+o•••••••-•HHOHY• .. ••••••o+•••• •• 2 2. Oil Extr.ad.ioo Methods ............... H••· ................... _ ....................... 2
2.1 Solvent Enra.ction Metllo<l ···-····· ........................................ 3 2.2 Recommended Process Flow Sheet .................................... 3
3. Estimated Selling Priae mVemonia Oil and Meal .................... 4 Subsections In Capa 3.1 Market An.alytis. H••··· ....... - ... HH• .... ~ ..................................... 4
and Lower case 3.2 Prodll.Ct .Revenue ................................................................. .'5 4. .Recommet1ded Plant Capacity ................... .................................. 6 5. Material and Energy Balances ......................... ........................... 6
EQUIPMENT DESIGN AND COST ······••n••n•o••····-·····----· ·-············· ..... 7 Topical Headings/ 1. Pre-ell:traction (Tempering) •H••·······························•n••············ .. ·· 7
In Repon Body 2. Solvent Extraction .............................................. n ........................ 7 3. Meal ProcessinWJ>eeolventi.zing .................................................. 8 4. Solvent Recovery and Related Equipment .................................. 8
4.1 Overview ...................................................... ............................. 9 4.2 Rising Film Evaporation Unit Mass
and Energy Balance ············n••·-········································ 10 4. 3 Heat Exchanger and LTV Cost Estimates ....................... 11 4.4 Vacuum Stripping Colurnn ................................................ 11
5. Miscellaneous ....... n ............................ -··•n •••••••••••••••..•.••••••••••••••• 12 IXED CAPITAL INVESTMENT ................. ~ ...................................... 14
OPE.RATING EXPENSES .................................................................... 15 1. 0-vervi.ew ..•••••...•...•..•. H ................................................................ 15 2. Raw Material Cost ..................................................................... 16
2.1 Hexane .................... ·····••n••• ............................. -·-·-·--·· •••••••• 16 2.2 Vernonia galamensis seed ......................................... ··•H ••• 17
3. Operating Expense ..................................................................... 17 CONCLUSIONS .................................................................................... 18 RECOMMENDATIONS ................... ................. 0404H .............................. 20 REFERENCES on••H••••• • n~••• •••••••h4n• .. ~~~•••• • ••••,, ••• n •••., ••• +••••• ••••• ••• •• •••++ •• •• 22 APPENDIX A: Price Data end Market Information ...•....................... 23 APPENDIX B; .Physical Properties and Chemical Composition .~ ...... 25
List of Figures
Figure 1. Market Price Comparison, Hexane and Soybean Oils .......... 4 Figure 2. An:hitectural Coatings, Solvent-based ................................ 12
List of Tables
Table 1. Market Prices for Hezene ...................................................... 16 Table 2. Market Prices for Soybean Oil ............................................... 17
Executiv~ Summary: Condensing Your Report
Rewrite to Condense
The executive summary is an independent element, preceding the main body of the report. that gives a complete overview of the report. Al though the executive summary appears before the introduction to the body of the report, you wri.t.e the executive summary last. The executive summary consists of three parts:
•A synopsis of the introductory material. background, methods~ and findings ·
• The conclusions • The recommendations
The executive summary is important because it is often the only part of the report that is read. Therefore, ·write this element with all your audiences in mind. The executive summary is usually less than 250 wordsJ or the size of a one~ page abstract. Some companies set a maximum of two pages, or 5 to 10 percent of the length of the full report.
Writing a good executive summary is challenging because you must clearly state three key elements of your report. First, include a synopsis to place the report in context for the reader. Second, establish the significance and implications of the results. Third, provide a clear picture of the conclusions and action recommended.
Do not expect to submit the first version of the executive summary you write. A clear, concise summary often requires much revision to reduce many pages of inform a ti.on to a single page.
The synopsis should include sununaries of the following:
• A statement of the objectives •Design constraints • Procedures, methods, and sources of data •Alternatives considered • Results and discussion
The executive summary also includes the conclusions and recommendations.which are sometimes placed under separate headings within the executive summary. The conclusions and recommendations are drawn from the body of the report, so no new information is provided.

l
l l
Report Writing Manual- Page 19
Example of an Executive Summary: Vernonia Oil
Note Background,- Increasing regulation of the emission of volatile organic compounds Methods, Findings (VOCs) is forcing producers of architectural paint coatings to reduce
VOC content in alkyd paint. The seed oil of Vernonia galamensis has proven to be fully compatible with alkyd paint resins, acting as a nonvolatile paint diluent that partially replaces the volatile organic solvents in the paint. The objectives of this project were to determine the technical feasibility of producing vernonia oil, to determine suitable selling prices of the oil and by-products, to determine a suitable plant capacity, to design the process and equipment, and to determine the capital investment required and the operating costs. Two methods to extract oil from seeds were considered. Oil expression processes, including both the hydraulic and screw press operations, are outdated due to a lower oil yield of only 85% compared to solvent extraction processes. Today the most common solvent extraction process uses a Bollman extractor providing a 98% yield of oil. This is the recommended process. Information on Bollman extractors is limited, so the size was estimated from pilot plant data for a similar process, and the cost was estimated by estimating the materials needed and the fabrication costs. The process is predicted to operate at an annual cost of $10.9 million, which includes steam, water, electricity, raw materials, and labor. Fixed capital investment was estimated at $5.2 million based on equipment costs of 26% of the initial investment.
State Conclusions- Conclusions and Recommendations 1. A plant capacity of 2.7 million gallons of vemonia oil per year
using the solvent extraction method will provide a 10% penetration into the sol vent-based architectural coatings market, supplying the demand of any one paint manufacturer.
2. The fixed capital investment was estimated at $5.2 million. The Bollman extractor accounts for 20% of the total equipment cost, and the desolventizer accounts for 20%.
3. Project operating expenses were estimated at $10.9 million per year. The utility costs are 7% of the total operating expense, and the dryer fan motor electrical requirements are 78% of the total utility costs. .
4. Income from product sales, with oil at $0.60/lb. and meal at $250/ ton, is expected to be $16.8 million per year. This income is 50% greater than the annual operating expenses.
Recommendations 1. A plant capacity of 2. 7 million gallons of vernonia oil per year is
recommended. 2. The estimated product revenue exceeds the annual operating
expenses by 50%. Cash flow analysis should he done to determine whether or not the process meets the company investment objectives.
3. Further refinement in equipment cost estimates is recommended for the Bollman extractor and the desolventizer.

Body of the Report: Including Standard Sectio.ns
Ask Questions to Sort Material
The report itself is commonly referTed to as the body of the report and includes all the main parts of the report. The body of the report usually includes the following sections:
• Introduction •Procedures (Methods) •Results and Discussion (sometimes separated) •Conclusions • Recommendations
The reader should be able to read only the body of your report end then compose an executive summary similar to the one you generated. The body does not include the front matter t ref eren~s~ and appendixes.
It will help clarify the goals you should have in writing each section of the body or the report if you ask yourself the following questions:
• Introduction: What are the objectives of the work? What benefits can the reader expect?
•Procedures: What was done? What ·methods were followed? Are data accurate and complete?
• Results: What was calculated. found, or observed?
•Discussion: How do you interpret the results? What do the results mean?
• Conclusions: What is significant? What can you · conclude from the results? Does the work satisfy the objectives?
• Recommendations: What specific actions should be taken?
No matter how you ask yourself the questions, the exercise will give you insight into how you want to proceed and help keep you focused.

Rq>o" Writmf M1111wd • P'ft 22
Introduction: Ori,entlng Your Reader
Include Problem statement
Report Needs Govern Choices
The introduction gives your reader a general orientation to the problem and to the process by which the problem is solved. Introductions usually cover the following:
• Problem statement and constrain ts • Objectives of the report • Background and importance • Scope or what is included and excluded • Context and relationships to other operations. Readers
should be made aware of how the project fits into the company business.
•Sources of information, such as peopleJ memos, and published articles
• Preview of the report's organize ti on
Many introductions follow the above organization. However, the particular needs of your report should gov em your decisions about organizing the elements of your introduction. For example. you might want to provide the background of the problem before discussing the problem statement and its constraints.
Example of an Introduction: Vernonia Oil
Introduction Problem or Purpose-- This report describes the result.a of Phase Ill of a pTocess development
Statement study t.o determine ifvemonia oil can be produced commercially by the Fictitious Chemical Company. The objectives or this report are as follows:
1. Summarize the drying oil production methods, costs of re"! materials~ and future market demand, and Tecommend a reasonable plant capacit)'.
2. Determine the flow rates, compo1itions, tempeTatures, and pressures of each process stream.
3. Determine the energy req\l.irements for the process. 4.. Estimat.e the fixed capital investment and yearly operating
expenses. 5. Discuss the direction of further investigation and the continuation
of the pToject.
e.ckground- Volatile organic cc:n11pounds CVOCs) have been identified as contributors on voes to air pollution. Phot.ochemieally reactive voes react with nitric oxides
present in the atmosphere, producing smog. In the past decade, federalt state. and local regulatory agencies have spent considerable effort to

E~smple otsn lntrodut:'tion: Vernonia Oil (cont.)
reduce voe emissions. The trend is evident in a 1988 announcement by Califoroias•South Coa-st Air Quality District (SCAQD), which plans to -reduc& voe emi&sions 80 to 90l'Jf; by 1993. This plan includes an ·809b reduction in voe emi.ssions from architectural coatinp. The federal government and other states typically look to California for leadership in voe regulation.
voes find mueh use in paints and ooatingsJ In SDme paints, voes serve a,s 1'eaetive oo:m.pon:ents:1 aiding in the film-forming J>T(lcess. They also act as diluents for viscous paint constituents. The linseed oil and •oybetm oil alkyds in many anhitedural coatings requi.re thinn.lng with VO.Cs. After applicadon, the majority oft-be \"oletile solvent evaporates.
Technlcal Background on -Vemonia oil ie a naturally OCCl.lrring epoxidized oil The oil's main Vernonia 011 constituent is vernolie acid ( cls.-12, 13-epo·xy·cis-9-a~deeenoic acid).
Thia acid is round mainly in the form of trivemolin, a triglyceride of vemolic acid. Trivemolin ia the dominant glyceride in ven1onta oiJ, which gives it a homqgeneous molecular structure. In cotttrast. soybean and linseed oils are heterogeneous ·mixtures of various g)yeeride.s. Alsb unique tQ vemonie oil is itJJ low vise"osity of200 cps at 50°F. Epoxid.ized soybean and Hn seed oil have viscosities in the .ra_nge of 1000-2000 eps at 50°F.
Vernonia oil is round in seeds of the genus Vernoniae. Two speries have been identified as having commericel potentia I. Vernonia gala.men.sis is native to arid and semi-arid regions of central Africa and is currently begin cultivated in test plots in efforts to improve seed yields. Vernonia galaml!MU seed has demonstrated oil yields or 38-42 wt.%. The oil is approximately 80% trivemolin (Ologunde et al., 1990). Vernonia anthelmintica is native to arid and semi-arid Tegions or North America. Also known as the ironweed_. V. anthelmintica has demonstTated lower oil yields or 18~27% triverno]in con tent (Krewson et al., 1965). Recent reSe&Tch has rocused on ·~ g(Jlamensis:JI duet() its· higher agronomic potential (Carlson et el., 1981)
Importance of Vernonia OH - Experiments have shown that vemonia oil is suitable for use Bl5 a reactive dilu,ent in oil-based alkyd paints. Paint voe content rriay be reduced because lower viscosity vemonia oil does not require, thinning with volatile solvent. Vernonia oil can replace more than 2~ ofthe oil alkyd body and more than 15% of the voe solvent.
Procedures: Explaini,ng Your Methods
Describe Equipment lncludl ng Software
Place Cautions Prior to the Step Involved
The procedures section explains the methods, equipment, and materiaJ s selected. including why you chose them over alternatives. You should provide details sufficient for another person to duplicate your procedure ..
Include the following in your procedures section:
• Present the theoretical background for your procedures.
• Describe the equipment and the arrangement of the equipment. Describe software requirements. Describe materials required.
• Describe the steps in the process. If timing or order of steps is important, describe these requirements.
•Give references, standards, and codes for these proced urea.
• Give relevant formulae.
• Give estimates of uncertainty and confidence.
• Place cautions prior to the step to which they apply. Cautions protect people and equipment against harm.

Example of a Procedures Section.: Vernonia 011
Procedures Markel Analy•la- The selling pr:ice-s of oil and me.al are needed tCI calculate income for
the cash flow ena lysis of the pro·cess. Because vemonia oil is a new product, there ere no price-data available. To estimate the futuTe seIHng price nf '9em.onia oil1 the price <CJf soybean oil from 1975 tCI 1989 was pr,qjected forward using a linear leas.t-squares fit. Soybean oil is cu.mmtly used as a drying oil in solvent-hosed points, so the above extrapolation should roughly predict the pTice that paint manufacturers would pay for vernonia oil The vemonia meal is also o new product fer which no price data are avai1able. The same curve-fitting method, as described abo:ve, w.as employed tCI estimate the selling cost of the extracted vemo nia meal Soybean meal was used as the substitute materiaL According to Markley .end Goss (1944} and Ologunde et el. (1990)_. the nutrient contents of the soybean end vel'ltonia meal are simil-1r a-s shown in Tables 5 and 6. Therefore, the selling price trends ofvemonia seed meal should correspond to those of soybean meal.
Deslgn and Cost_ The mass and energy balances give the flow rates Jllld heat duty for the of a condenser eolvent recovery condenser. Since the h .exane is vaporized from the oil
by direct injection of steam, the overhead stream will contain both hexane vapor and steam. This entire stream is conden eed, cooled tCI 25°C. and sent to the decanter where tbe twc phases are separated.
References We used e;nthalpy data for the pl,lre components.found in Petty and Proceclu res- Green (1984) and heat transfer coefficients and cost data found in
Peters and Timmerhaus ( 19910. No unusuo I methods were needed for determining the size of this condenser. Look in Appendix F for the detailed co lculations.

Rq,on Writmg MBnUI - p,,~ 26
Results: Describing Your Design
Follow a Log lca1 Plan
Explain Resu'lts in the Text
Refer to Diagrams in the Text
The results section describes your design. You will probably want to start with a general-to.particular order. giving a general description of the whole design. Then you can proceed to descriptions of the parts.
The way you describe your design should follow a logical plan. For example, in continuous flow systems, your description might follow the flow of material through the system. In static structures, your design might follow a spatial arrangement. Other descriptive logics might follow a management plan for the system or a construction sequence for the system. The point, of any descriptive logic is to provide a way to describe individual parts of the design as well as the relationships of parts to each other and to the whole design.
When describing your results, consider the following:
• Explain results in the text. Do not rely on diagrams or other figures to convey results without explanation.
• Diagrams included in the report must be specifically ref erred to in the text of the report.
• Use unbiased language.. Save interpretation for the discussion section.
In some cases, when there are many results, the Results and Discussion sections are combined by giving one result and discussing it before proceeding to the ne:xt result.
Example 1 on page 27 illustrates a combined Results and Discussion style.
Example 2 on pages 27 and 29 illustrates two separate Results and Discussion sections.
-

l L
l L
Examples of a Results Section: Vernonia Oil
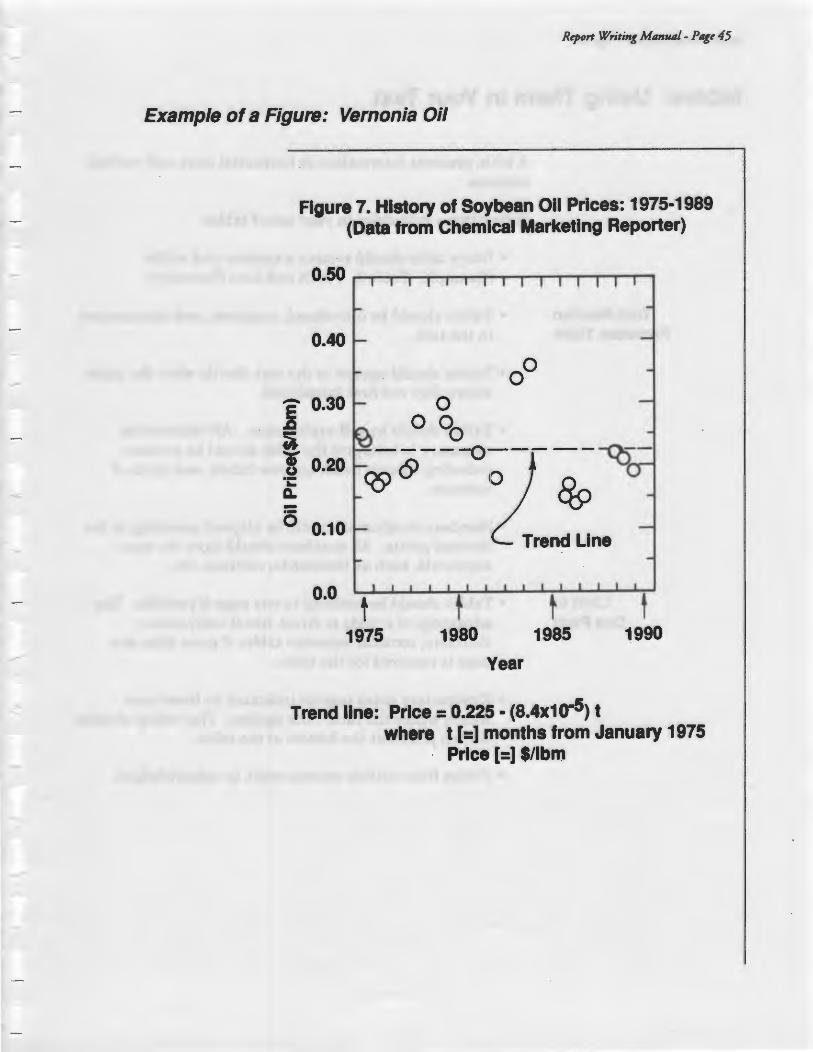
bample 1.- Results (and Dil!ICussion) Mark•t Anatysls Figure 7 t showing the, history of SQYbean oil prices,_ was constructed from
(Jncludes Dlacusstan) data obtained from several issues of the Chemical Marhting Reporter. Soybean oil had an a.-erage price of22 csnts per pound in 1975.1 which decl'eased to 21 cents peT -pOund in 1989" but the price 8uctuated from $0.13/lbm to $0.35/lbm. Figure 7 enables forecasting the price of soybean oil up to 2005. The general trend is flat. and the expected prtce of soybean oil is 22.5 cents per pound in 2005.
Di rlikov et al. (1990) estimate the future price of vemonia oil at 45 cents to 75 cents per pound. This is the. same kind of price range $S shown for aoybea-11 ojf. The soybe$11 oil price is estimated to be const.ant over the life of the project. If vemonia oil prices track soybean oil prices1 one expects ver non.ht oil prices to be about constant during the life of the project. An average selling price of 60 cents per pound was selected as a goo.d estimate. The uppeT and loweT values suggested by Dirlikov can be used if the cash flow analysis turns out to be sensitive to the prices of the products. The future se11ing price ofvemonia oil will probably be above that of soybean oil, because strict voe regulation may increase the demand for paints tbat contain low viscosity drying oils.
l'igure 8 shows the selling price of soybean meal from 197 5 to 1989 a nd th e projected prices to 2005. The predicted selling price of soybepn mea 1 is $291/ton in 2005. Venionia seed m.aal will be marketed as a direct substitute for soybean meal, so selling prices for vernonia meal were estimated from the selling price of soybean meal. The estimated seUing price of vemonia seed meal in ! 005 is $250/ton_ The digestibility of vemonia meal has not yet been de·term-ined, although the amino acid content was shown to be si miler to that of soybean meal
E.1ampfe 2.- Heaul ts Design :and Cost Representative values of heat transfer cJ>efficients used gave an oveTa11
Of Condenser heat transfer coefficient of 150BTU/hrft 1 ~F. Using a l0°F approach , (see Discussion, p. 29) the area calculated was 1960 n.2• Cost graphs gave a cost of.$18,000for
this heat exchangeT in carbon steel with a preuure rating of 150 psie.

Discussion: Analyzing Your Results
Evaluate . Your Design
The discussion is where you analyze the facts or findings in your results. In a design report, the discussion section is where you evaluate your design, using the general-toparti.cular order.
Here is a way to approach the discussion:
• Address the objectives stated in your introduction. giving detailed evidence to support every statement made.
•State decisions that were made and alternatives that were considered.
•Include stipulations; assumptions, and uncertainties, and their effect on the results.
• Discuss unusual aspects of the design.
,. Give detailed reasoning to support all conclusions and recommendations that will follow.
Many technical reports contain a Results section. followed by a separate Discussion section, as shown in Example 2. pages 27 and 29. When the re are many results, however, one result may be presented and discussed before the second result is presented and discussed. This approach produces a combined Results and Discussion section, as shown in Example 1 on page 27.
You need to present the results and discussion consistently throughout your report regardless of which approach you and your instructor prefer.
I 1
1 I ' t

R'J'OH WritPlf Mt111""1-P-x~ 29
Examples of a Discussion Section: Vernonia Oil
Exampla 1 ~ ·- CReault& and) Dt11emaion Market Analyals See page 27 for the combined Results and Discussion in E:s:ample 1.
(Includes Reaulta)
Example 2.-· Discu.ssio.n Destgn and CoS1 of a Condenser
At the ±30% uncertainly level. cost data an u&Ual1y obtained from cost graph4 giving heat exchanger cost 88 a function of area. This means that usingrepresentative values of heat transfer coefficients from the handbook"8 is adequate. This heat e:.:changer cost ia less than .2% of the purchased equipment ~ost., so it does notm1;1ke sense to try to refineth·e design by aelectine; the tube size and making better estimatee of the heali tramfer coefficients. The most useful refinement would be to determine , the nature of fouling that might occur in this heat exchanger. However, we do not expect much fouling, because the vapor on the shell side is mostly organic. This is also the reason we selected carb-on steel tubes. We do riot expect much corrosion with an organic vapor. There are no high pressures in this system, so standard 150 psia construction is specified.

Conclusions: Interpreting Your Results
Conclusions are your convictions reached on the basis of results and discussion. The conclusions should answer the reader· s question, how is the information in this report significant? Therefore, conclusions can be described as the interpret.a ti on of the facts and the implication of these facts as presented in the results section~
You must take a position regarding the meaning and significance of your data. This position involves going beyond the objective description provided in the results section. The conclusions section of your report should be written to stand by itself, clearly marked with a heading.
When writing your conclusions, keep these four key ideas in mind:
•No new material should be presented in the conclusions section. Each conclusion should be based on evidence previously presented in the results and discussion sections.
• The conclusions should answer any questions posed by the statement of purpose.
• Consider all the factors of your conclusions. Look beyond the obvious implications of the data to any broader technical, economic, and social con texts, if any.
• Each conclusion, which may include a list, should be presented in a logical sequence for the convenience of the reader.

Example of a ,Canalusian: ~ rnonla Oil
Conclu11lons 91gnlllcane.- A plant capacity of2.7 million gallona ofvemonia oil per year will prov:id
a 10% penetration into the solvent-based architectuml COlltings market. A market penetration of 10% is based upo:n. the current market shares o the m.Qor U.S. paint mmpanies (Austin. 1184l~ This pl•nt capacity should provide the plant with the capability of aatisfying tb e demand of any one of the largest C1,1$to'mer$. Due to the large nuD'lber of mergers between paint compani.es in recent years (Reisch, 1989), no effort is mad to estimate the expected. future market shares of individual paint companies.
Technical Coma.-s- Data for dete.nnining·the appnprlate plant capacity shares were obtain (rom Department of Commerce reports about the quantities of solventbaaed erchitectur I coatings produ~ed. 'in the United States du:ringthe period from 1981 to 1988 (see Table 7). Solvent-based sn:hitectureJ paints contribute 18% of' total VOC emissions in California end are the primary target for partial solvent repl1acement using vernonia oil. Compatibility studies ofvemonia oil with alkyd resins used in -paints anpossible pai_n t (orrnulation s using vemonia oil have been conducted by Dirlikov. Sale of 1.38 million gallons af solvent-based coatings is reported for 1988 by Current Jnd1t1trial Reports. The t.atal market may be m·uch larger. In Chemical and E1111ineeri'Vl Ntws, Reisch ( 1989) reports that an estimated market or 325 million gallons of alkyd paint alone exists in the United St.ateg_ It is unclear how the number of gallons was egtimated.
We used linear regression to determine the expected total quantity or erohiteatural solvent-based. paint reduced (see Figure 10). This method yields 214 million gallons of solvent-based paint produced by the year 2005. The reliability of this value is estimated at 1L1% based upon the standard deviation o the calculated slope. Th,e Coatings Research Institute o( East.em Michigan UniYersity shows that at least 63 ml of -Yernonia Qil is required per liter of solvent-based paint This value (Jepson, 1988) has been used to detCTmine the total volume ofvemonia
1 l Tequired to capture 10% of the solvent-based architectural coatings market.
Recommendations: Calling for A·ction
Use section Heading
When you write your .recommendations, you are calling for specific action. This action should be the logical outcome of your conclusions. Depe11:ding on the complexity of your recommendations and the length of the report, your recommendations can be a single sentence or many pages. To some audiences, such as a vice president of a client company J the recommendations section is the mo et import.ant section of your report. ,
Be sure to keep the following key ideas in mind when writing your recommendations:
• Write the recommendations section to stand by itself.
• Clearly mark the Recommendations section with the heading: Recommendations.
• Derive your recommendations directly from the conclusions. If each conclusion warrants a separate recommends tionJ each recommendation should be itemized and numbered in the saine _logical order as the corresponding conclusion.
A final but import.ant note. Do not be tempted to omit the recommendations section. As the author of the report. your job is to dmw conclusions from your work and take a definite position based on these conclusions. The readers of the report should not be expected to come to these recommendations on their own.

l L l l
Example of a Recommendations Section: Vernonia Oil
Clear Section Heading-- Recommendatio.ns 1. We recommend beginning detailed design work fo.,. a plant
producing2.7 million gallons per year ofvernonia oil to be used in 1
formulating architectural coatings. The process designed should Actions RllCDITl·mended - be -8.n extraction process using hexane as the solvent. The by
product meal should be sold as animal feed.
2. We recommend doing a ca.sh flow analysis foT tlle vernonia oil extraction process described.. OuT preliminary analysis of tl1 e process shows tllat tlle income from sales will exceed the operating expenses by 50%. We need to know whether or not tlle discounted cash flow rate of retum meets the company invesbnent , objective.
36 We recommend obtaining a quotation for the cost of the Bollman extTactor. Our original cost figure is an estimate developed by estimating the cost of the steel needed to manufacture this device and the cost of machine shop services needed for fabrication. This extTactor compY'ises 20% of fixed capital investment for the pY'ojeetf so we need to reduce the uncertainty associated with the extTactor•s cost.

Referenc·es: Establishing Your Sources
Essy Retrieval Is Important
The ref ere.nee& section of your report includes all the sources you have used to prepare your report. Reference sources include other people1s ideas and written materials. References are most often material that the reader can examine in a library~ An item that cannot be retrieved or verified has little value as a reference. The list of references follows the last page of the document or appears just before the appendix.
When you prepare the list of references, accuracy and completeness are important. Readers of your report must be able to return to the original source to check both the accuracy of the informs ti on and your interpretation of it.
The format of the reference section depends on the conventions used by your particular discipline. Check with your instructor as to the preferred style.
Easy retrieval is the most important thing about references, so pay particular attention to the following when preparing your list of references.
• Are all the authorst names spelled correctly?
• Do you have the correct title of each publication?
•Are the publishers' names accurate?
•Do you have the correct date and page numbers for all your sources?
1
1
I
I 1
I , 1
l L L
L I [
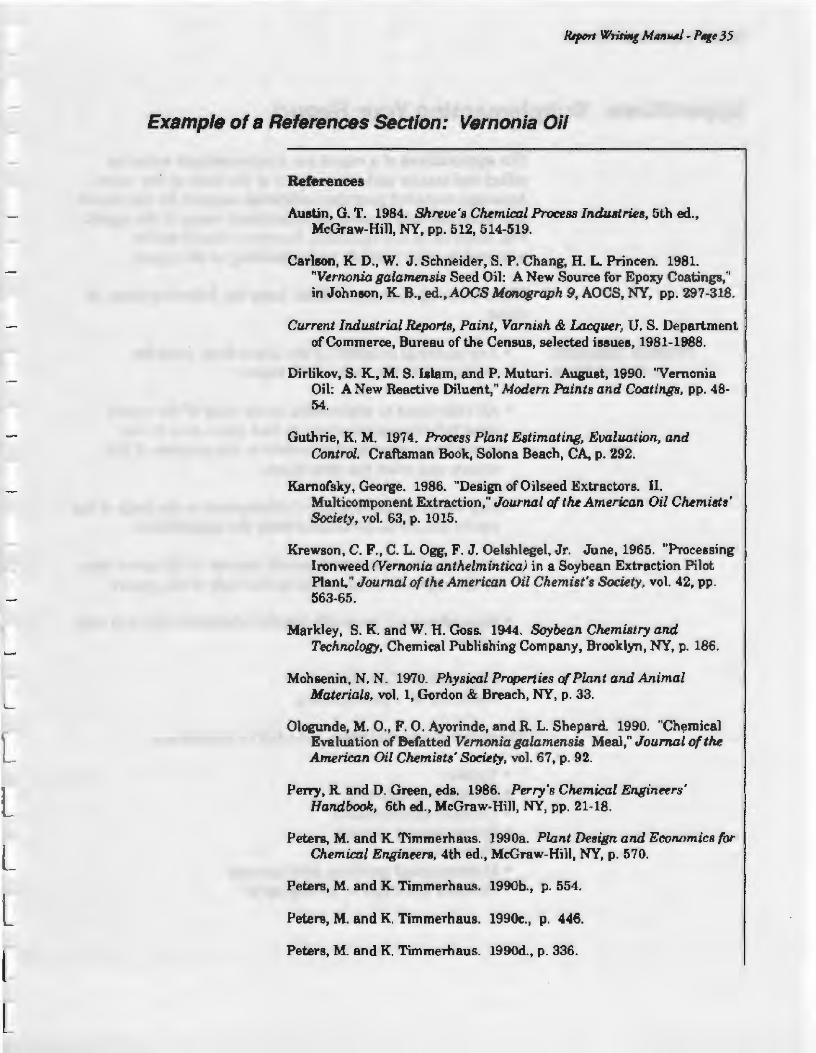
Exampls of a References Section: Vsrnonia Oil
References
Austin, G. T. 1984. Shreue·JJ Chmical ProceBB Induatriea, 5th ed., McGraw-HiU, NY, pp. 512, 514-519.
Carlson, K.. D., W. J. Schneider, S. P. Chang. H. L Princen. 1981. "V~rnonio galamensis Seed Oil: A New Source for Epoxy Coatings/' in Johnson, K.. B., ed., AOCS Monograph 9, AOCS, NY, pp. 297-318.
Current Industrial &pons, Paint, Varnish & ~wr, U ~ K Department of Commerce, BuTeeu of the Census, selected issues, 1981-1988.
Dirlikov, S. K.. 11 M. S. Islam, and P. Muturi. August, 1990. 'Vernonia Oil: A New Reeetive Diluent," Modern Paints and Coatings. pp. 48-54.
Guthrie, K. M. 1974. Process Plant Estimating, Er;aluation, and Control. Craftsman Book. So1ona Beach, CA, p. 292.
Kamo(sky t George. 1986. ..Design of Oilseed ExtrectoTs. 11. Multicomponent Extraction."' Journal of th American Oil Chmitlts· Society 1 vol. 63, p. 1015.
Krewson, C. F., C. L. Ogg, F. J. Oelshlegel, Jr. June, 1965. 0 Proce1sing Iron weed (Vernonia anthelmintica) in a Soybean Extraction Pilot Plant.'' Journal of the American. Oil Chemist~s Society~ vol. 42, pp. 563-65.
MaTkley, S. K. and W. H. Goss. 1944. Soybean Chemistry and Technology, Chemical Publishing Company 1 BTooklyn, NY, p. 186.
Mohaenin, N. N. 1970. Physical Properties o(Plnnt and Animal Materials~ vol 1, Gordon & Breach, NY, p. 33.
Ologunde. M. 0., F. 0. Ayorinde, and R. L. Shepard. 1990 ... Ch~mica] Evaluation of Befatted Vernonia galamensis Mea1," Journal of the American Oil Chemist&; Soddy, vol 671 p. 92.
Perey. R. and D. Green, eds. 1986. Perry~s Chemical Enginttrs· Handbook, 6t.h ed., McGraw-Hill, NY, pp. 21~18.
PeteTB, M. and K.. Timmerhaus. 1990a. Pl.ant Design and Economics for 1
Chemical EnginterJJ~ 4th ed., McGraw-Hill, NY, p. 570. '
Peters. M. and K.. Timmerhaus. 1990b., p. 554.
Petel"9, M. and K. TimmeThaus. 1990e., p. 446.
Peters, M. and K Timmerhaus. 1990d., p. 336.

Appendixes: Supplementing Your Report
Pinpoint Appendix in Report Body
The appendixes of a report are supplementary material called end matter and are not part of the body of the report. Appendix material provides additional support for the report and technical information for specialized users of the report. The material in the appendix, however, should not be essential to your reader's understanding of the report.
When creating your appendixes) keep the following ideas in mind:
• Any material included in the appendixes must be ref ere need in the body of the report.
• All references to appendixes in the body of the report must tell the reader where to find those data in the appendixes, how the data relate to the purpose of the report, and what the data mean.
• Any material not related to information in the body of the report should be eliminated from the appendixes.
• Any referenced material should appear in the same order in the appendixes as it does in the body of the report.
• Appendixes are generally labeled alphabetically and with a tit1e:
Appendix: A: Calculations Appendix B: Specifications
Examples of material often included in appendixes:
•Tables • Sample calculations • Detailed specifications • Supplemental reports •Nomenclature •Mathematical methods development • Detailed drawings or photographs
l l 1
l ·~
1
l I I I l

R~ort Writing M11n""1 - P11ge 37
Example of an Appendix: Vernonia Oil
Appendix B: Hazards and Environmental Concerns
Flammability Hazards Two flammability hazards have become apparent at this early stage of design. The primary hazard is the extreme flammability of hexane. Data about hazards are reported by Mohsenin (1970). The flash point of pure hexane is -26.1°C. Hexane has a lower flammability limit (LFL) of 7.5% and an upper flammability limit (UFL) of 11.5% in air at 25°C and 760 mm Hg. The auto-ignition temperature is 260°C. A second hazard is the flammability of the fine hairs that are removed from the vernonia seed prior to solvent extraction. This flammability has not been · investigated at the time of this report. However, grain silo explosions due to dry husks (dusts) are common to many grains. A plant design must incorporate fire/explosion hazard preventions.
Appendix ClteS-- Health and Environmental Concerns Health Cautions Hexane may be absorbed into the body by inhalation or ingestion.
Hexane is an eye irritant and will cause nausea upon ingestion (Peters and Timmerhaus, 199 ld). Since hexane is a solvent currently used to extract grains such as soybeans and flax seeds, environmental agencies should not object to its use in a vernonia seed extraction plant (Carlson et al, 1981). Vernonia seed oil and extracted vemonia seed meal are nontoxic in the absence of residual hexane.

Report Writing Manual-Page 38
Letter Reports: Adapting the Formal Report
Learn Formal . Reports First
Maximum Is 4 to 5 Pages
Before you write letter reports, you need to learn the formal report standards presented on the previous pages. Good letter reports are based on formal report standards. Once you learn to use the standard conventions, you need to know how to adapt these conventions to letter reports.
As their name implies, letter reports are a hybrid between letters and reports. A letter report begins with a salutation to the reader, as in a letter, and ends with the author's signature, as in a letter, although the body usually benefits from a few headings, as in a report. Letter reports typically lack the front matter and back matter that accompany reports. For example, no transmittal letter is necessary. Because of their informality, letter reports have limited uses. Follow these guidelines:
• Whenever a report requires more than four to five pages, write a formal report. The average letter report runs two to three pages. Beyond five pages, a formal report is more helpful to your readers, because it includes a title page, table of contents, and executive summary to orient your audience.
• A letter report is usually directed toward familiar readers, defined as people you know, who know about the background of your project, and who have some regular contact with you. For example, a letter report might be sent to a regulatory agent or client to update this person between formal reports submitted about a long project.
• A letter report may be called a letter report or a memo report. Letter reports typically go to recipients outside a company, while memo reports are reserved for internal audiences within a company.
1
Report Writing M11nual - Pagt 39
Letter Reports (cont.)
Content Is Abbreviated
Headings Are Assets
The content of a letter report is an abbreviated version of the content in a longer, more formal report, described in more detail in the previous chapters. Remember that the content of a letter report needs to be prepared as carefully and as logically as the content of a formal report. Accuracy of results is just as important to the recipient, for example. To adapt formal report content to a letter report, include the following structural elements:
• A subject or purpose statement, best described in an introductory paragraph providing an overview, followed by
• A discussion of findings, followed by conclusions and recommendations, or
• Conclusions and recommendations, followed by a discussion of findings. The order depends upon company preference.
Experts agree that letter and memo reports can benefit greatly from a few headings that clarify report content. Headings are best based on text content, except for recommendations, which are best highlighted with a Recommendations heading.

Report Writing Manual - Page 40
Example of a Letter Report: Vernonia Oil
Fictitious Chemical Company Engineering Division
Internal_ Date: 10 May 1992 Memo Style To: D. W. Hubbard, Assistant Swervisor
From: J. Ferrio, Project Leader 1'f( Re: Vernonia Oil Project: Plant Capacity Recommendations
Give Background- Volatile organic compounds (VOCs) contribute to air pollution by Information reacting photochemically with nitric oxides to produce photochemical
smog. Regulatory agencies are developing regulations designed to reduce VOC emissions from all sources. For example, in California, the South Coast Air Quality District plans to require reducing VOC emissions by 80 to 90% by 1992, including an 80% reduction from architectural coatings.
The drying oils-linseed and soybean-used in alkyd paints require thinning with voes so that the paint can be applied easily to architectural surfaces. We need lower viscosity oils so we can reduce the voe content of paint to comply with the new environmental regulations in our major markets. We selected vernonia oil as the most promising oil to use. This oil is found in the seeds of the Vernonia galamensis plant, which grows in central Africa. The seeds contain 33-42% by weight of oil, which can be recovered by mechanical pressing with an 85% yield or by solvent extraction with a 98% yield. The solid
State the residue can be sold as animal feed. The objectives of this report are to Objectives - analyze the market and recommend an appropriate plant capacity for a
vernonia oil extraction plant.
The U. S. Department of Commerce publishes Current Industrial Reports, which has a section devoted to paint, varnish, and lacquer. This publication shows that the total sales of solvent-based paint in 1988 were 139 million gallons. Sales data for the last several years show that sales are increasing steadily by approximately 3.35 million gallons each year. If the market keeps increasing at this rate, we expect
1

Report Writing Manual- Page 41
Example of a Letter Repon (cont.)
the demand for these paints to be 214 million gallons in 2005. The uncertainty in this number is ±12%-the standard deviation given by the linear regression technique used to extrapolate the data. The total
ResuHs, Discussion, market may be much larger. Reisch (1989) says that the U.S. market and Conclusions -for alkyd paint is 325 million gallons, although it is not clear how this
Presented Together number was estimated. The Coatings Research Institute at Eastern Michigan University (1989) reports that 0.062 gallons ofvemonia oil are required per gallon of paint. We believe that a reasonable market penetration for Fictitious Chemical Company would be 20% of the 214 million gallon-per-year demand expected, or 2. 7 million gallons of vernonia oil. This means that we could satisfy the whole demand of any of the largest paint manufacturers, according to market share information published by Austin ( 1984).
Recommendations Specific Action- We recommend that a process be designed to produce 2. 7 million gallons Recommended ofvemonia oil per year to supply the expected demand for low viscosity
drying oil to be used in manufacturing architectural coatings.
l
''"'''''''''''''"'''l'llllll.#111111111
Part Ill: Visual Aspects
Figures: Using Them In Your Text Tables: Using Them in Your Text Report Format: Framing Your Report Headings: Setting Several Levels

Report Writing Manual - Page 44
Figures: Using Them in Your Text
Discuss Figure in Text
Limit to One Page
One of the characteristics that sets apart technical writing from other forms of writing is the Ii beral use of figures and tables. Any illustration that is not a table is referred to as a figure.
When using figures, follow these guidelines:
• Each figure should have a number and caption.
•Figures should be introduced, analyzed, and summarized in the text.
• Figures should appear in the text shortly after the point where they are first introduced.
• Figures should be self-explanatory. All information necessary to interpret the table should be present, including units of measure and identification of the axes.
• Photos, photomicrographs, and sketches should contain an indication of scale.
• Graphs frequently require legends or keys to distinguish curves. Use symbols such as A,+, or• to identify the actual data points on the graph. Color-coded keys should not be used because colors will not be distinguished when photocopied.
• Figures should be confined to one page if possible.
• Figures from outside sources must be acknowledged.
• Figures must be labeled with all vital information because figures are often removed from the report for the use of operators and other staff.
l l l 1
l l
l l l I l l l l
RqHJrt Wntint Manual - P•ge 45
Example of a Figure: Vernonia Oil
Figure 7. History of Soybean OH Prices: 1975-1989 (Data from Chemical Marketing Reporter)
0.40
i 0.30
~
0 0 00
-----o------ca-I 0.20 ·-.. D.
g qs> 6> 0 ~
0.10
o.o ' 1975
t 1980
Trend Line
t ' 1985 1990
Year
Trend llne: Price = 0.225 - (8.4x1 o-5) t where t [=] months from January 1975
· Price [=] S/lbm
Report Writing Manual-Page 46
Tables: Using Them in Your Text
Text Mention Precedes Table
Limit to One Page
A table presents information in horizontal rows and vertical columns.
Follow these guidelines in your use of tables:
•Every table should receive a number and a title. (Example: Table 1. Profit and Loss Summary)
• Tables should be introduced, analyzed, and summarized in the text.
• Tables should appear in the text shortly after the point where they are first introduced.
•Tables should be self-explanatory. All information necessary to interpret the table should be present, including column headings, row labels, and units of measure.
•Numbers in columns should be aligned according to the decimal points. All numbers should have the same exponents, such as thousands, millions, etc.
• Tables should be confined to one page if possible. The advantage of a table is direct visual comparison; therefore, consider separate tables if more than one page is required for the table.
• Explanatory notes may be indicated by lower case letters where the table note applies. The listing-of notes is then placed at the bottom of the table.
• Tables from outside sources must be acknowledged.

Report Writint M1111ual • PAg~ 47
Example of a Table: Vernonia Oil
Table 5
Amino Acid Content of Various Seeds•
Amino Acids Vernonia Meal Soybean Meal Linseed Meal (essential) . (weight%) (weight%) (weight%)
Arginine 8.6 7.6 3.2 Histidine 2.3 2.2 0.7 Isoleucine 4.1 4.4 1.8 Leucine 8.0 6.7 2.2 Lysine 5.7 6.0 1.2 Methionine 3.5 1.4 0.6 Phenylalanine 8.9 4.5 1.6 Threonine 4.4 3.7 1.3 Valine 5.1 4.5 1.9
Table Note- Weight% amino acid= Wt. of amino acid/Wt. of protein in meal
Acknowledgment- These data are from Markley, S. K., and W. H. Goss, 1944. Soybean of Source Chemistry and Technology, Chemical Publishing Company, Brooklyn,
NY, p. 186; and Ologunde, M. 0., et al., 1990. Journal of the American Oil Chemists' Society, vol. 67 (No. 2), p. 92
. Report Writing Manual- Pllge 48
Report Format: Framing Your Work
Double-space
Start Page Numbers after
Title Page
Your future employer probably will have specific format standards especially for technical reports, plus similar standards for other documents. In the absence of any specific corporate format requirements, you can use the following guidelines:
•Use one side of 8 1/2 by 11-inch good quality white paper.
• Double-space the text and indent five spaces for paragraphs.
•Allow a 2-inch top margin on the first page and 1 inch on the following pages.
• Allow 1 inch for the left, right, and bottom margins . .
•Allow an additional 1/2 inch on the binding side ifthe report is to be bound.
• Do not color code graphs or other figures. The distinction is lost in photocopying.
•Number pages beginning on the first page after the title page, continuing through the appendixes.
•A title block is a bordered block that identifies a document page. You may want to place a title block in the upper right margin of each page of your report, as you would do on a drawing. The report title block should include an abbreviated title, author's name or initials, date, page number, and total pages in the report.· Title blocks help to reconstruct the report after portions are removed and used independently.

Report Writing ManUlll-Page49
Headings: Setting Several Levels
Select Ranks of Importance
Set a Maximum of 4-5 Levels
Headings divide the report material into manageable segments. Careful selection of headings can awaken reader interest and can help you organize and focus your work. Headings are listed in the Table of Contents exactly as they appear throughout the report.
When you select a hierarchy for the headings, consider the rank or relative importance of the heading within the report. For example, the following system might be used:
•Highest rank heading centered, boldface or underlined (not both), in all capital letters.
•Second rank heading (subheading) beginning at left margin, boldface or underlined, capitalizing the first letter of each word.
•Third rank heading (subheading) indented, boldface or underlined, capitalizing first letters of each word.
If numbering is used, either a traditional outline system with Roman numerals and alphabet letters or a decimal system is appropriate. Four or five levels of headings should be a maximum, no matter which system you choose. Readers find more heading levels confusing.
The traditional outline system is not appropriate for lengthy reports because "a." can end up on a page by itself and lose its context. The decimal system can be useful in long reports, but should not be carried beyond three decimal places. You may choose to rely solely on the heading rank format _rather than on either numbering system.

- Part IV: Calculations
Calculations: Documenting the Basis of Your Report

Report Writing Manual - Page 52
Calculations: Documenting the Basis of Your Report
Introduction
Purpose and Uses
Calculations are required for a great deal of engineering design work and frequently serve as the basis for the design report. Good documentation of these calculations is essential for effective communication.
Recorded calculations provide a written record of design work and serve to support and augment the design report. These calculations are not always distributed with all copies of the report but are normally included in the appendixes of the author's copy, the immediate supervisor's copy, and the central file copy.
These documented calculations meet a variety of needs for both current readers and for future reference. Here is a partial listing of such needs:
• Provide detailed documentation of the design basis. • List and supply references for physical property data. • List assumptions. • Permit checking of procedures and mathematics. • Provide supplemental information which may not have
been used in the current report but will be useful for future efforts (i.e., stream flow rate and property data, which could be used by the project engineer specifying pumps).
The standard by which such calculations are judged is that a trained professional in the field should be able to follow and verify the work without consulting the author and without guessing as to methods, procedures, or data used.
Design Basis The design basis is the complete statement of the foundation upon which the design is built. The design basis may include written materials provided by others, contracts, vendor specifications, marketing assumptions, or any other material that the engineers used to set the criteria for the design. The design basis may also list assumptions made by the engineer where criteria were not specified by others. Examples might include allowable service life, minimum acceptable return on investment, or turndown ratios for flows.

Report Writing Manual- Pagt 53
Calculations (cont.)
Design Equations and Models
Variables and Units
Computer Calculations
In engineering design, the relationships among variables are generally provided by design equations or models. The validity of the design is dependent on the model selected, and it is important to document the selection properly. If equations are derived as part of the calculation process, then the derivation should be properly documented also.
Variables must be explicitly defined prior to use in equations. Some nomenclature is sufficiently well-accepted to tempt the ·novice to bypass this step, and this bypass is one of the most frequent sources of error. It is especially important to assign dimensions or units to all variables when they are defined and to include the units once the variable has been calculated.
The other most common source of error is failure to maintain dimensional consistency when performing calculations. This is especially difficult to detect when dimensional equations are used from handbooks and values are inserted with incorrect dimensions.
Computers are becoming increasingly important to the design engineer. Repetitive calculations are frequently performed on spreadsheets. Commercial software is frequently applied to portions of a design. Computer programs are sometimes written as part of the design process. In all such cases, give a code listing with enough comments so that a knowledgeable reader can repeat and verify the calculations.
The equations used in either spreadsheets or authorprepared software must be thoroughly documented and either the derivation or a reference must be provided. One sample calculation done by hand will frequently serve to demonstrate that no programming errors have been made.
In the case of commercial software, the reader needs to be able to acquire the software and repeat the calculation if necessary. The complete reference should include both the version number and the source. The record should include the complete listing of input data. Only that computer

Report Writing Manual- Page 54
Calculations (cont.)
Sketches and Notes
output which is necessary to record the calculations should be used in the report. Often the printout is not in a suitable format to document the results; the printout should be clipped, modified, or reworked as necessary to make clear how it supports the report.
Sketches can be very useful in helping the reader to understand a series of calculations. It is frequently possible to illustrate only the portion of the design which is appropriate to the example calculations being performed. This approach helps the reader to identify the portion of the entire system which is of current interest.
l l l l
Notes and comments can serve a similar function in helping
1 the reader to follow your logic and assumptions. Use notes
Checking for Error
Physical Property Data
liberally in documenting your calculations.
You are ultimately responsible for the quality of your work and should make it a practice to check your calculations independently. At the least you should take these precautions against major error:
• Check for misplaced decimals. • Review conversion of units. • Make certain your results are reasonable and agree with
known facts. • Compare your results to those resulting from shortcut
calculations or "rules of thumb." • Do not expect others to check your work, but do provide
sufficient documentation so that the interested reader might catch an error before you build a "mistake."
Design calculations frequently require data about the physical properties of the materials involved. Examples include such items as density, molecular weight, critical temperature, and specific heat. In many cases, the design engineer will rely upon physical property data measured by others or predicted by thermodynamic or transport property models.
Incorrect property data can lead to incorrect or even unworkable or unsafe designs. The documentation of sources is an important part of design calculations, and reference
l l l l l l l l l l l

Report Writint Manual- P11:~ 55
Calculations (cont.)
Organization and Format
citations should be complete, including edition and page number. When using thermodynamic or transport models to predict properties, it is important to document the exact model and source. In addition, any supplemental information employed, such as binary interaction parameters, should be recorded.
Calculations should be presented in the order that they would be performed by an experienced engineer. The reader should be able to repeat the calculations for a new design basis or to verify your work by following the documentation sequentially.
An outline format is one of the most effective ways to show the hierarchy of. calculations. For example, if the objective is to calculate yearly operating costs for a plant, then a partial hierarchy might be as follows:
Annual Operating Expenses
A. Raw materials B. Labor C. Utilities
1. Electricity a. Pump PlOl b. Compressor P102
2. Steam, 50 psig a. Feed preheater- ElOl
1. Flow, composition 2. Bubble point temperature 3. Heat transfer coefficient 4. Duty 5. Annual expense
Standardized forms are sometimes used to present certain types of calculations which are encountered frequently, i.e., pump calculations or heat exchanger calculations. Some companies mandate the use of special calculation paper, which helps to document the company, division, author, project, date, page number, and total number of pages involved.

R~on Writing M11nUlli- P11g~ 56
Example of Sample Calculations: Vernonia Oil
Note: · For a complete example of sample
calculations, see Appendix A.
SA•rl~ C&lc.-. IA:h""-'s
lI.. 5.l""'+ ~w-w."'• s,.tat-LQ.1'1< ~-.-f\4-\e~ ..f "~"c.... .. en be.."~ ;" ~c.. 4-.i:hc:!t.~'fnJC~~t. ~o.c:tlii\c.~ ""'°"""' b~ "JW'O"id~ (...,- ACe.'~ Oit\d -eioritl\~ ~lue."'t s..
A. C~c·,41 ~~•Y"C4:1 c.;ol&r~ ~ 0 ~ c°"s;Je.w-acl
• ita.t~ ., ~·""*'pt.~ • ~(;~j."'C..~Od. ~cl ,~,;~dd&~d • •••C. \Silt~ «W4k-' °'""-' ~~'t • ,.~ \ft"-~~ ~ ~-~ 0.,. -c'J\Kf. .. d~
l. ~~.,.,~ ~c..: "'Akc.-1A.p .&\"'-A.I~ lo•sc.s ed-:~-.tc.. '"~ o...+ o.~-& ·f ~~4' f.....& ~ u... 2ooo lit• .... ..,~ ~ °""' ' 10~ "Mv "'-ca. ~OLi-o ~ .
().oocs lzooo ~kr)(o., t=-ht')= Cf!~ hu~ .&CM .. ~.-. o::n.(t.w-1..Jca-:.Y.",.A11~,, .. , ... n)
nr~ C'*'IM.W\,~ ~c... t~ .A.i ¥1/u.b.ler h...,, -rt~ -'O'ii ~/~~
.A~,A'tO ~/~
lA4'c~ -1-'-.A. vJ&-o(-~•b -ht , .. ~ -.. (!00& - .... "~r'1 o.f s.t-.t. 1M. .... , .... ~ ~k.-,«.. be.. -UDO ,...i.
"'~ ~~ ~~-- ~"'a.ll \ . 2.. o.l\Mry M~d_ 0.".l 1~t~
A._~._ ~k ~ .£&.li~ J- oJtoadsooo ,..i t-- lo...&. •~~ ~ •~•t~c~~ o.. to4'd. w"-•lA.. =~ ·~~ o..+ ~·'"'W\"'-"" ·"~~~·
TA-k. ~~«.. A-\W~ ::it ":1000 a-1 .3. T:-. .. b~ °'~-.~.&.cl-.\~)
11\14' .kp&.wl~ OW\ ~t lou:h~. Few- US o~t\oll\4., A.., Z. ~., J&l"1cry •~ ~-.."°~.,l& • Tk"'' -.U.w .,..c.. "'~ "''"'i ~"'-M ;"~iot] • n•~ i 11 c.o~ ,,,t ~+ w\+k +t..'- ~•"-""'Pof.~ ~i-c.. o.."cl .Id~ WW\4.~• c1, c•"•~.l e.N..d..

Part V: Style
Using Consistent Style in Your Design Report Introduction to Style Considerations Develop Respect for Consistent Style How This Manual Approaches Style Follow Good Reference Manuals
Style Considerations in Engineering Design Reports Recognize Active and Passive Voice Make Sure Subject and Verb Agree Rescue Dangling Modifiers Use Inclusive Language Apply Hyphens Correctly Select Numerals or Words for Numbers
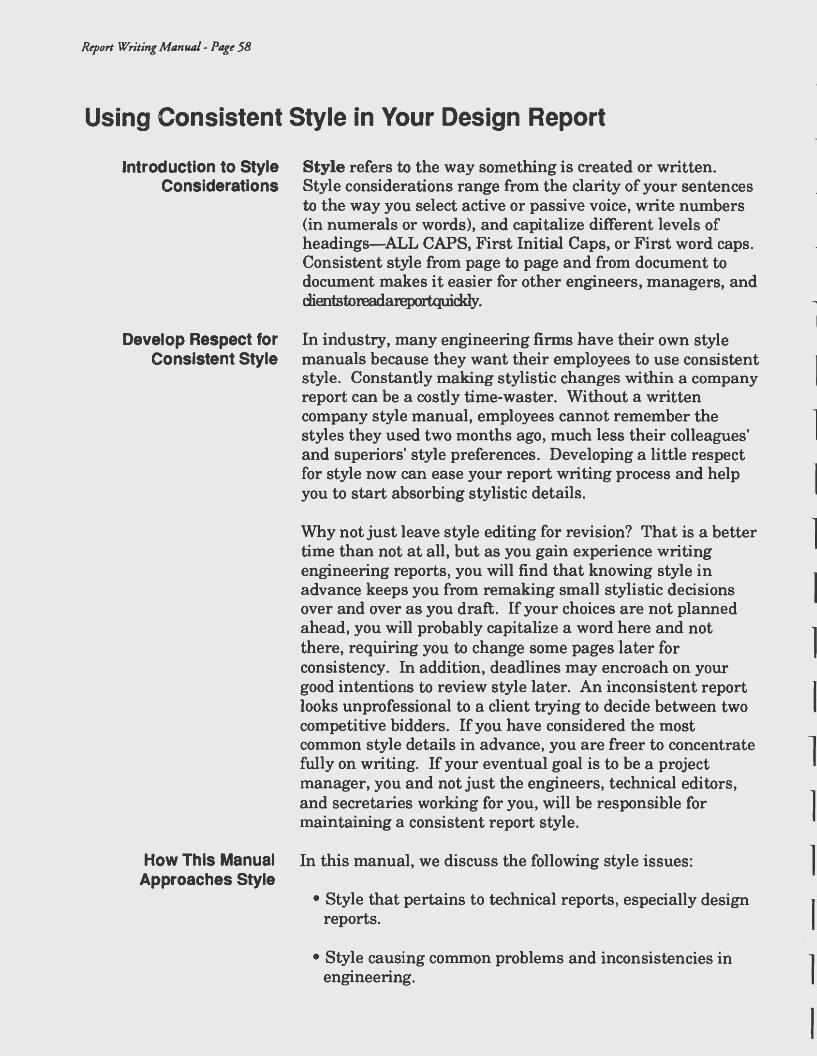
Report Writing Manual - Page 58
Using Consistent Style in Your Design Report
Introduction to Style Considerations
Develop Respect for Consistent Style
Style refers to the way something is created or written. Style considerations range from the clarity of your sentences to the way you select active or passive voice, write numbers (in numerals or words), and capitalize different levels of headings-ALL CAPS, First Initial Caps, or First word caps. Consistent style from page to page and from document to document makes it easier for other engineers, managers, and dient.storeadareportquiddy.
In industry, many engineering firms have their own style manuals because they want their employees to use consistent style. Constantly making stylistic changes within a company report can be a costly time-waster. Without a written company style manual, employees cannot remember the styles they used two months ago, much less their colleagues' and superiors' style preferences. Developing a little respect for style now can ease your report writing process and help you to start absorbing stylistic details.
Why not just leave style editing for revision? That is a better time than not at all, but as you gain experience writing engineering reports, you will find that knowing style in advance keeps you from remaking small stylistic decisions over and over as you draft. If your choices are not planned ahead, you will probably capitalize a word here and not there, requiring you to change some pages later for consistency. In addition, deadlines may encroach on your good intentions to review style later. An inconsistent report looks unprofessional to a client trying to decide between two competitive bidders. If you have considered the most common style details in advance, you are freer to concentrate fully on writing. If your eventual goal is to be a project manager, you and not just the engineers, technical editors, and secretaries working for you, will be responsible for maintaining a consistent report style.
l l l l l 1
l l l l
How This Manual In this manual, we discuss the following style issues: l Approaches Style
• Style that pertains to technical reports, especially design J reports.
• Style causing common problems and inconsistencies in engineering. l
I

Report Wri~ing Manual- Pag~ 59
Using Consistent Style {cont.)
Follow Good Reference Manuals
We recommend you obtain one professional style manualThe Chicago Manual of Style or Modern Language Association Style Manual-as a permanent, personal desk copy. These 200- to 700-page manuals treat matters from sentence clarity ta use of commas. You can use them as reference books to look up answers to on-the-job questions.
Supplement this large reference with one smaller, professional style book from your engineering discipline, such as ASCE, ASME, or IEEE style guidelines. Then make it a point to ask for your company's editorial style manual when you take employment.
Style Considerations in Engineering Design Reports
Recognize Active and Passive Voice
The style considerations discussed here are based on the most common style problems cited by corporate executives, technical editors, and academic engineering and writing experts. Companies sometimes hire technical editors to conduct in-house writing workshops or meet with staff engineers to review aspects of their report writing. You might think of the following tips as giving you a head start on important aspects of communication in engineering.
Today active voice rather than passive voice is recommended for most technical writing in industrial circles. This recommendation applies to industrial instructions, recommendations, proposals, reports, letters, and memos. Passive voice is typically reserved for professional research journals and for some academic writing. Leaming the difference between active and passive voice might be the most important style principle you can learn.
In active voice, the subject of the sentence is the doer, or agent, of the action. Active voice simply means the sentence is arranged in agent-verb-object order.
Active: Joan subj (agent)
moved verb
the car. obj

Report Writing Manual- Page 60
Style Considerations (cont.)
Use Active Voice Widely
Use Passive Voice for Special Needs
In passive voice, the order is reversed, and the important agent is no longer the subject, but ends up as the object toward the end of the sentence after the action verb.
Passive: The car was moved by Joan. subj verb obj (agent)
The car was moved. subj verb no obj (no agent)
According to writing experts, active voice is the most frequent and logical pattern in English, and the easiest to read. Active voice is simpler and more direct because the agent, or doer, precedes the action. The verb "moved" is shorter and more direct than the verb "was moved," and is therefore considered more active or energetic. The reader is not waiting mentally to learn the agent. Passive voice is harder to read because the verb is less direct and is considered less energetic. The reader reaches an action, "was moved," while still looking for an agent (Joan) to do the action.
Although passive voice is wordier and involves more unnatural manipulation of words, passive voice still has special uses today.
• Consider using passive construction to apologize to customers when you want to downplay or remove the agent for a soothing effect.
• Use passive voice to describe scientific research hypotheses, methods, and claims in research reports. Here passive voice is traditional because it downplays the agent and emphasizes objectivity. Many research journal editors in engineering and scientific fields expect passive voice. Readers of research journals are accustomed to sentences with missing agents.
• Using passive voice where it is helpful does not mean you must use it throughout a document, however. The trend is changing. Today industrial managers and technical writing experts recommend using active voice wherever
l 1
l l l I l I l l l l l I l I

Report Writing Mt1nual - Pag~ 61
Style Considerations (cont.)
Make Sure Subject and Verb Agree
Rescue Dangling Modifiers
possible because its directness makes difficult, interdisciplinary concepts easier to understand.
•You must follow your instructor's preferences for how you handle active and passive voice, but you need to be aware of their fundamental distinctions. One of the first tools indus_~al editors use to shorten verbose writing is swttching sentences from passive to active voice.
The subject and its related verb must agree numerically as singular or plural, even if other phrases are between them. Writers make this common error when they misread which word is the subject. Or a writer may have carelessly tied the verb to the last noun that precedes the verb. You need to check for this common error; computer word processing programs will not correct this mistake for you.
Remember that the words "each," "everyone," "anybody," "someone," and "none" all take singular verbs, even when plural nouns or pronouns occur in between:
Example: Each of the contractors wants to win the bid. None of the contractors wants to lose the bid.
Remember, too, that compound subjects, consisting of two nouns, always take a plural verb despite any phrases between the nouns:
Example: A hydrogeologist and a civil engineer supervise landfill development.
A modifier is a word or phrase that describes or modifies another word. Used improperly, a modifier may dangle alone or, worse yet, modify the wrong word, making the sentence sound dumb or silly.
Incorrect Example: Having written the report, the desk was strewn with papers. (This sentence says the desk wrote a report.)
Correct Example: Having written the report, the engineer left the desk strewn with papers.
Report Writing Manual - Pagt 62
Style Considerations (cont.)
Use Inclusive Language
Industry, academia, and society in general are working to improve language so that it does not inadvertently exclude anyone. This means that technical language, like the laws it spells out, should not reflect bias involving gender, age, color, creed, or race. Top companies have had inclusive language policies in place for many years, so the earlier you begin practicing inclusive language, the better for your career. Employees have lost their jobs over prejudiced or inappropriate language that was overheard in public, and today corporate offices are considered public domain. Equally important, we all work better and with greater satisfaction when we know our contributions are valued. The language used around us is one way we can measure that value.
Here are some suggested guidelines:
•Change the wording from singular to plural. This is probably the best and most popular approach. For example, "Each person reads his book" becomes "People read their books." Tip: If you avoid using the word "each" at the beginning of the sentence, you will not need a singular pronoun at the end.
• Rewrite to avoid using pronouns at all. For example, say "the engineer checks it" instead of saying "the engineer checks it herself."
•Avoid using "he and/or she" or "he/she" throughout a document, but use the phrase occasionally rather than using just "he" or just "she."
• Alternate between "he" and "she" if you are using examples involving people to explain a description. This style tends to read more naturally than saying "he or she."
Is this focus on inclusive language silly? No, not unless you want to risk offending an officer of your company or the president of a client company because your outdated language excluded them. Today the professions include everyone, so your language should too.
l
l

RqJort Writing M11nual- P11gt 63
Style Considerations (cont.)
Apply Hyphens Correctly
Some compound words always require hyphens; some compound words do not require hyphens. Hyphenation of some words depends on their use in a report. Therefore, looking up a compound word in a dictionary, which usually indicates proper hyphens, will gradually expand your knowledge of what words are hyphenated.
In engineering reports, you can apply specific guidelines to clear up some of the confusion and avoid two common mistakes in these documents:
• Do not hyphenate prefixes added to the front of words. These prefixes include con, multi, non, pre, post, and sub.
Correct: multidiuisional, multidisciplinary, nonstandard, prewriting, subcontract. The main exception is if two vowels abutt, as in pre-existing or co-op.
Incorrect: multi-divisional, non-standard, subcontractor, pre-writing.
• Do hyphenate a compound word when you combine words to create an adjective before a noun. Do not hyphenate "two feet," because feet is a noun. Do hyphenate two-foot board, because "two-foot" is an adjective describing board, the noun. If you don't hyphenate this adjective, two incorrectly modifies board. You want two to modify or go with foot, which in turn modifies board.

Report Writing Manual-Page 64
Style Considerations (cont.)
Below 10, Use Words for Numbers
Use More Numerals in Technical Text
Technical reports feature many numbers, so stylistic conventions are necessary to keep numbers consistent.
Generally, write out all numbers below 10 as words ~ne, two, five, nine-when they appear in a paragraph of narrative or text. All numbers including 10 and above are written as figures-IO, 11, 22, 33, 111.
In technical text and technical measurements, however, even the numbers one through nine are often written as figures. Here are other guidelines:
• Use numerals for dimensions, sizes, and temperatures.
•Use numerals for ratios, prices, scores, times of day, dates, page numbers, and tabular statistics.
•In a text with frequent numbers, use numerals for all numbers that can be numerals.
•Use numerals for all numbers in a series with mixed numbers below and above 10.
•Use numerals to express sums of money.
• When one number immediately follows another in text, one number is spelled out and the other is written as a numeral. (Example: Ten 2-inch pipes.) If the numbers are part of a series, be sure to treat them consistently.
• Always spell out a number when it starts a sentence; numerals are never used at the start of a sentence. Rewrite the sentence if necessary.
•Write out approximate numbers or large numbers in mixed numerals and words, such as 20 million.
•Use decimals more frequently than fractions in technical style, placing a zero before the decimal point. However, do not use decimals to express customary fractions or to make exact fractions inaccurate.

l
l l l l l l l l l l l
Part VI: Other Concerns
Ethics and Writing: Acting Responsibly Defining Ethical Writing Defending Your Values Considering Your Ethical Roles Striving for Excellence Being Responsible to Society Using Writing with Integrity
Politics and Writing: Reading Power Balances Audiences Have Ranges of Power Writing Influences Power Balances Design Solutions Affect Decisions
Logic and Writing: Making Sense in Your Arguments Methods Should Be Replicable Six Components of an Argument Three Variables Affect Argument Material Reality vs. Value Systems Recognize Value Systems

Report Writing Manual - Page 66
Ethics and Writing: Acting Responsibly
Defining Ethical Writing
Defending Your Values
Considering Your Ethical Roles
What does it mean to be ethical in your writing? Ethical writing may be hard to define, but we can think of it as responsible action. By "responsible," we mean being accountable to yourself, to your employer, to your profession, and to society. Responsible action is tied up with the concept of means and ends. Writing is a means used to accomplish an end, and the end, or goal, needs to be a good one, if the means are to be considered good. Furthermore, even a good goal does not justify the use of unethical means.
Being ethical in your writing means, first, being true to your own value system. What is your goal in life, your vision of good? What are the values that constrain your choice of means to achieve that goal? Normally, the values that are considered praiseworthy include honesty, justice, and fairness. Just as honesty dictates that you tell the truth as you know it, so justice dictates that you consider everyone affected by your action. When you are sure that your action does not oppress anyone, you have taken justice into account. Fairness means that you avoid tricks, that you consider other perspectives, and that you give alternative ideas a fair hearing.
But being true to your own vision and values is not all there is to being ethical. We must also consider the communities of which we are a part: our place of employment, our profession, and society as a whole.
When you think about being responsible to your employer, you need to consider goals and means. What goals does the company have and what means are they willing to employ to reach them? Are these good? If so, then the ethical choice is to further the interest of your employer. If not, ethics would suggest that you should try to reform the company or look for another employer whose goals and means you think are good. In practical terms, this means that if an employer asked you to write a report that aims at a bad goal or that employs unethical means, you would find yourself in an ethical dilemma. Will you go along for the sake of security, or will you take an active stand for what you believe to be good?
1
1
1
l l 1
1
l 1
1
l l 1

Rq>ort Writing Manual - Pag~ 67
Ethics and Writing (cont.)
Striving for Excellence
Being Responsible to Society
Using Writing with Integrity
When you consider being responsible to your profession, the word "excellence" should come to mind. Most professions are professions because their practitioners have tried to achieve excellence; that is, they have done the best they could given their abilities and the state of the art. Doing just enough to get by is unprofessional, not to mention unethical.
Finally, there is society as a whole. What does it mean to be responsible in this sphere? All projects will have effects, and it is part of being responsible to consider how each project will affect the lives of people. How will it affect the environment? What about peoples' jobs? What about social relationships? In other words, responsibility to your employer and to your profession needs to be measured against the larger responsibility that we all have toward society.
Writing is a powerful means of getting things done. Being ethical in your writing means that you employ fair, honest means to accomplish praiseworthy goals. You will be called upon to make many ethical decisions in your professional career - some of them obvious and some of them internal. How you incorporate these ethical decisions into your written communication will require self-awareness and tough choices on your part.

Report Writing Manual - Page 68
Politics and Writing: Reading Power Balances
Audiences Have Ranges of Power
Writing Influences Power Balances
All writing has political dimensions because it is situated in a context that involves power imbalances of one sort or another. The political dimensions of writing are obvious in contexts such as newspaper writing where a single news story can change the course of political events. There are political dimensions to design report writing as well. For one thing, there is a power imbalance between you, the writer of the report, and the instructor who will grade it. You are in the position of an apprentice attempting to learn the conventions of design report writing, whereas the instructor is a knowledgeable professional who is thoroughly familiar with those conventions. This places you in the difficult position of having to write to and for someone who knows more than you do about writing. It is easier to write to a peer or to someone who is less knowledgeable than you are. Issues such as gender, race, country of origin, etc. need to be considered as well. If students from differing backgrounds perceive their positions in the power structure as low, this may inhibit their effectiveness in communicating and their participation in group activities.
Presumably, too, you are attempting to simulate a real-life industrial situation as you prepare your report. You have imagined audiences beyond your instructor-your boss and others who need the information you are providing them. These imaginary individuals will occupy different positions within the hierarchy of the company for which you are working, so they will have varying degrees of power and authority within the institution. Some will be above you in rank and status, some will have the same rank and status, and others will be below you. It is difficult enough to write for a single person who has more authority than you do, but you must also try to write for a variety of others who differ in status within the organization.
You should consider, as well, that writing is a means of acquiring power within an institution. An effective report can actually become a means of changing your own status within the organization. It can even become a means of changing the goals and objectives of the organization itself. The report writing you will do will necessarily involve struggle and numerous negotiations, compromises, and activities that are clearly political ones.
l l l l l l l l 1
l l l l l l
l l

Politics and Writing (cont.)
Design Solutions Affect Decisions
The problems you are attempting to solve exist, of course, within a much larger social and political context or they would not be problems at all. There is almost always more at stake in writing a strong design report than just your position within a single organization. Your design can have political force and can change political realities for better or worse. A report describing equipment to control pollution, for instance, may result in a cleaner environment. In order for the report to be effective, though, the writer or writers of the report must be knowledgeable about state and federal legislation and about political groups that will be influenced by the report or that will respond to it in supportive or antagonistic ways.
As a writer of design reports, you have an obligation to conduct research and prepare reports that are politically responsible. Your work can have a progressive or a regressive effect in the political decision-making arena. Your work can help eliminate political imbalances, and it can promote decision making that is ecological in the broadest sense, concerned with the preservation of us all.

Report Writing Manual - Page 70
Logic and Writing: Making Sense in Your Arguments
Methods Should Be Replicable
Developing a report and preparing it for acceptance by readers are quite different processes. The thinking processes you use to develop a design are not necessarily logical as we usually understand that term. Instead of proceeding in an orderly sequence from step 1 to step n in developing a report, you may make intuitive leaps in your thinking. You are likely to employ what we call free association as one idea suggests another. Often, you will not work alone, but work as a team member. Many ideas develop out of conversations, informal arguments, and planning sessions as the team of engineers works on the problem their developing design is intended to solve.
Finally, though, the completed report must appear well organized and logical. And not only must the report proceed from step 1 to step n; it has to meet a number of engineering, management, and legal criteria combined into a coherent design. Compromises may be inevitable, but the design must not have contradictory features.
In short, your design has to make sense at a number of levels, and it has to be convincing for a number of audiences. Perhaps you can think of a design report as a kind of argument. That is, it is a discussion of a proposed solution to a problem, supported by facts arranged in a way that is meaningful and convincing to the particular audiences. Although the various mental and social processes you use to develop your design may not be conventionally logical, the design itself must be a clearly logical argument. That means it must be able to survive some rigorous logical tests. The purpose of this section is to give you some specific guidelines for testing the arguments in your report.
One requirement for an effective report is that another engineer should be able to duplicate the methods you describe in your report. From those methods he or she should be able to obtain the same results you did, and from those results he or she should be able to reach the same conclusions you reached. The mental and social processes you happened to use in deciding on your methods and in applying your methods may have been as unique as your own
1
l 1
l I l l I l
l l I I
Report Writing Mllnual- Pllgt 71
Logic and Writing (cont.)
Six Components of an Argument
personality and the particular mix of personalities in your team. While those processes probably were not step 1 through n logic, the methods you finally decided to use to represent your design method will be logical.
Another basic requirement of an effective report is that your argument must account for alternative solutions to the problem. Is it really true that your design is the only solution to the problem? Other solutions might also be supported logically. Consider other reasonable solutions and discuss why your solution solves the problem better than any others.
You can analyze most complex arguments in terms of six components.2 A good way to go about analysis of an argument is to ask the following questions:
• Can I identify the conclusion, solution, or claim of the argument?
• Can I find the support for the solution in the form of data, facts, or pieces of information?
•Can I understand the justification, generalizability, or context of similarity in which data are organized?
• Does the argument clearly state the established principles of physics, mathematics, economics, management, or other broad frame of knowledge to which the generalization of data relates?
• Does the argument give the degree of reliability, or margin of error in the data?
• Does the argument explain the restrictions upon the argument, or the conditions under which the solution offered would not be adequate?
2 This discussion of the six components of argument is based on the work of Stephen Toulmin in Stephen Toulmin, et al. An Introduction to Argument. New York: Houghton Miffiin, 1979. ·

Report Writing Manual- Page 72
Logic and Writing (cont.)
Three Variables Affect Argument
Material Reality vs. Value Systems
Your design report might be strong in all of the components of argument, yet you may find that some audiences have good reasons to disagree with your solution. How could this be the case?
It is important to recognize that the basis for your argument, the data you select for your argument, relates to a certain frame of knowledge. If you write your design report intending other engineers like yourself to use it, but not intending marketing personnel as your audience, or community leaders, or environmental agencies, it is possible that the argument you present will not be accepted by those audiences.
Three variables are involved in the success or failure of a well-structured argument:
• the audience
• the field in which the argument is based
• the purpose of the argument
Any one of these variables, or any combination of variables, will change the value and the meaning of the argument and its components. We will discuss the relationship of value and meaning to effective argument in the section that follows.
One important aspect of most arguments in design reports concerns statements about material reality-temperatures, positions, mass, density, etc. These statements may be acceptable to most people and groups in the community. If an engineer says that the river exceeds flood stage by five feet an average of once every ten years, no one in the community may dispute that datum.
However, a second important aspect of most arguments in design reports concerns statements, or perhaps implications, about values, or about what is preferable in the situation. These statements may be disputed in a number of different
l I l I I
I I I I I

Report Writing Manual - Page 73
Logic and Writing (cont.)
Recognize Value Systems
ways in the community. While everyone in the community accepts the information about the flooding of the river, some will prefer that a dam be built, some will prefer that the town be moved, some will prefer that the river be moved, and some will prefer that nothing be done at all. All of these different preferences center in different value systems, different fields of knowledge, and different meanings for the river and the community.
Be aware of the significance of your argument in terms of what meaning and values it relates to in various areas of the surrounding community. You should have an understanding of the system of values (professional, legal, moral, and aesthetic standards) that influence you in writing your report. You should have an understanding of how your argument will relate to the values that influence people affected by your report in other parts of the community.
Very likely you will not be able to resolve all disagreements about values and meanings that relate to your argument. However, the most effective design reports present arguments that are logically sound in their components and address the complexity of their ethical and political contexts.

Part VII: Oral Reports
Differences Between Written and Oral Reporting
Effective Oral Reporting
Group Report Presentations
Creating Effective Visual Aids
Conquering Nervousness

Report Writing Manual - Page 76
Oral Reports
Differences Between Written and Oral
Reporting
In your design class, as in industry, you will often need to present your technical findings in oral form in addition to, or even instead of, written form. While oral reports require many of the same strategies as written reports, oral communication also presents new challenges. These challenges must be examined and dealt with if you are to communicate your important technical information successfully in ways that someone can use. Here we examine some of the important differences between written and oral communication and then present suggestions for effective oral reporting, including planning and organizing your information and delivering a polished, comprehensible report. A special section on group reports highlights some of the potential pitfalls of presenting as a group and suggests ways to ensure group success. Visual aids are usually an integral part of effective oral reports, so we provide guidelines for creating aids to help clarify and support your material. Finally, because giving an oral report is often an intimidating occasion, we offer a section on overcoming the nervousness of public speaking.
When we read a report, we have a tangible record of information in front of us. If we become confused or distracted, we can always backtrack, reread, or even start over. But when we listen to someone speak, particularly in the one-directional manner of an oral report, we have no reference except the speaker. We have only a fleeting moment to grasp information and absorb it. While we puzzle over a question or mentally stray to some distraction, the speaker goes on to new material. Particularly when hearing technical or unfamiliar material, if we get lost, we'll probably stay lost.
As a speaker, your greatest challenge is to overcome the fleeting nature of oral reporting so that your listeners can absorb, understand, and use your information. This isn't an easy task. But it is possible if you use strategies that help your listeners anticipate what you're going to say, connect it to something they already know, and store information away for later use. Keep these goals in mind as you read over the following strategies.

Planning Your · Oral Report
Organizing Your Material
Setting the Stage for Your Material
Report Writing Manual - Page 77
Before you decide how to present your material, you need to decide what you're going to say. As with writing, you must think about what your audience already knows and what they need to learn from you. Their level of expertise and their purpose in listening to you should determine what level of technical information you present and what angle you choose to take with it. For example, an engineer familiar with the details of your project is much more likely to understand and absorb highly technical information than will the marketing person whose job it is to sell the byproducts of your proposed process. These people will have different uses and purposes for your information.
Ample preparation is vital for confidence. If you're still sorting through or organizing your material in your mind, that indecision will be magnified in your delivery. The most certain way to succeed in oral reports is to start your planning early and to give yourself lots of time to perfect your presentation.
As with written text, it is easier to absorb information if it is broken up into sections, rather than presented in one big block. Divide up your material into manageable (but connected) sections, leaving plenty of verbal "white space."
Arrange your information in logical order, using either note cards or an outline, or some other form of guide. Put brief bits of information on each card, going to the next card or section at a logical break. Make sure, however, that the move between sections is smooth and connected, rather than choppy. Remember that graceful transitions between sections or subtopics are even more vital in oral reports than in written ones.
Typically, an oral presentation has three main parts: the introduction, the body, and the ending. All three parts must be complete and thorough for your audience to grasp and understand your information.
The introduction is the most vital part of your speech; it must build expectations and give listeners a system for sorting and filing the information you'll present. This means

Report Writing Manual - Page 78
Arranging the Body of
Your Presentation
that you must provide both the topic and your plan for developing your topic almost immediately. For example, you may tell your listeners that your topic will be the optimization of a natural gas processing plant. But since this is a huge topic with any number of angles, you must also tell them the precise scope of your speech, so they can mentally process and file the information away as they hear it. In your introduction, be sure you say clearly what the objectives of your report are.
Almost immediately provide a thorough "road map" of your presentation: where is this speech going and what route will you take to get there? Without a preview, your audience has little chance of mentally organizing highly technical information as you go along. You can outline the direction of your presentation orally; better yet, provide a visual aid too. Spend enough time on your "road map" to make sure your audience is prepared for and ready to comprehend the technical information in your speech.
The introduction is also the place to establish interest and rapport with your audience. A friendly, pleasant attitude and using "you" early and often helps keep listeners alert and involved. Let your audience know right away what's in it for them, why they should listen. A thorough introduction is the key to a successful oral presentation.
After setting up clear expectations of your speech, you present your information in the body of the speech. The key here is to present material in concise and digestible chunks, making connections for your audience by tying the technical and unfamiliar information to the known. Use transitional phrases to carry your audience along the road map you set out earlier, moving smoothly and logically toward a conclusion.
As in writing, using active and specific language will keep your presentation of information lively and interesting. This is particularly important when presenting technical information, which may contain complex details or be similar to reports others are giving.

Concluding Your Presentation
Practicing Your Presentation
Delivering Your Oral Report
Report Writing Manual - Page 79
The ending may contain two parts: a summary or overview of the material just presented, and a recommendation for future research or action. Recommendations are what most audiences want to hear when listening to an oral report about a design. This is where you tell your listeners what action they should take based on the conclusions you have reached. Let your listeners know you're ending so they can begin to wrap up mentally and store what you've told them. Use a transitional phrase, even ifit seems obvious: "Today I' d " "T . " "I 1 . " ve covere ... , o summanze ... , or even n cone us1on, .... Take a moment or two for a solid finish and then ask for questions.
The key to a smooth, co¢ortable presentation is practice. We are always more confident of our ability to perform something when we've practiced or rehearsed it before. Go through your entire speech several times, making notes on changes that occur to you as you go. One or two brief stabs will not give you the same confidence that several complete run-throughs will. Be sure to time yourelf and adjust your material accordingly.
Don't try to memorize your material; it will sound "canned." Worse, if you forget a word or a phrase, you may lose the entire speech. Conversely, don't try to ad lib, even if you know your topic inside and out (which you should). Information easy to remember at home often evaporates in the stress of speaking to a room full of people.
Having thoroughly planned, organized, and practiced your material, you're ready to present it. The following guidelines can help you deliver your information clearly and comfortably.
• Make eye contact with your listeners. This holds their attention and shows you are confident in your material. Try not to focus on one person or on one side of the room, scan over the top of people's heads, or stare blankly into space. Also avoid the urge to focus on your notes, the transparencies, or the projector screen.

Report Writing Manual - Page RO
•Use comfortable and natural body language. Avoid either standing stiffiy and unmoving or attempting theatrical gestures. Generally, if you don't concentrate on body language, your natural instincts will be fine. However, be conscious of distracting mannerisms such as jingling keys and change, waving the pointer around, or playing with your hair.
• Voices have a tendency to become very rapid and to become flat, low, and monotonous when we're nervous. Try to be conscious of your voice rate, and vary your inflection if your voice flattens out.
• We are often unaware of how often we use fillers like "um," "uh," "you know," and "okay" until it comes time to make a speech; then we become painfully a ware of them. If you use these terms excessively, consciously work on minimizing them in your speech.
• Use appropriate language. Avoid slang, ungrammatical, and overly informal words and phrases, but also avoid using "quarter" words when "nickel" ones will do. Always be positive you know how to pronounce technical or unfamiliar words correctly. Be sensitive to language that might exclude or confuse your audience, such as using "he" to refer to all chemical engineers, factory workers, or university presidents.
Group Report Presentations
Planning the Group Presentation
All of the suggestions presented above for individual speeches are also useful in preparing group reports, as you will frequently do in your design classes. Additionally, you must work to present a cohesive speech with several speakers, rather than several speakers each presenting discrete chunks of information. This takes preparation and practice. Consider the following guidelines for group reports.
First and foremost, get organized. Set up meetings and get every group member to every meeting. It only takes one group member stumbling through his or her section to
l 1
1
l l i l l l l l l l l

Adapting to Time Constraints
Making Consistent Group Visuals
Presenting the Group Report
Report Writing Mttnuttl - Page 81
undennine an entire presentation, and this happens all too frequently. Getting an early start on planning and active group communication can help alleviate this problem.
Have the group practice the report as a whole. Even if each member knows his or her part perfectly, the presentation will be blocky and disjointed if the group has not gone through it together several times in its entirety.
You will often have tight time constraints in group reports. Often, the first two or three speakers take up most of the total time, thus forcing the later speakers to rush through their sections. Besides being unfair, this is a problem because the end of the presentation often contains important conclusions and recommendations for action. All speakers should exercise discipline to stay within their own time allotment.
Have the entire group get together to make visuals, or have one person create all of them. Having different layouts, fonts, and styles of visuals detracts from a cohesive, professional group presentation.
When presenting, introduce each member of the group at the beginning, and say what each person's responsibility will be. You should use a visual for this. This sets up expectations and also helps if classmates or instructors are evaluating the presentation.
Work to provide smooth transitions between each group member's section. Introducing the next member and their topic is one way to do this. In a truly polished presentation, speakers will also weave in references to each other's areas or topics. Referring to each other's information can help create a seamless presentation.
Appearance, dress, courtesy toward audience and each other, sophistication of visuals, and disciplined use of time all add to professional polish. You need to decide as a group how much you will stress these concerns.

Report Writing Manual - Page 82
Creating Effective Visual Aids
Use Key Words
Use White Space Liberally
Make Text Visible
Use Standard Typefaces
Keep Information on the Transparency
Visual aids should help your audience understand your presentation.. They must support your speech, not drive it. Avoid the temptation to depend too much on your visual aids; they are not as memorable as your own lively presentation.
Visual aids take many forms, including slides, videos, flipcharts, and photographs, and all are useful in certain contexts. Probably the most common visual aid used in classroom or industry settings is the overhead transparency, and the most common problem with transparencies is illegibility. Always try to view your transparencies-from the back of the room-well ahead of time, and revise as necessary.
Consider the following guidelines as you prepare your overhead transparencies.
• Put only key words or phrases, rather than sentences, on your overheads.
• Keep your information to very few lines on one transparency, and use white space liberally and consistently. Experts suggest no more than five to ten lines of text.
• Normal, 12-point type is too small to read on an overhead. Use at least 18- or 20-point type, in a clean font such as Helvetica. Consider using bold face.
•Avoid using all capital letters, unnecessary underlining, or extra type faces. All of these require extra internal processing on the part of your audience and detract from comprehension.
• The dimensions of a transparency are the same as an 8 1/2" by 11" sheet of paper. The projection area is 10" by 10", so information which fills the entire sheet, such as a lengthwise flow chart, will run off the sides.
Avoid distributing handouts during your presentation, or your audience will flip through the pages and focus on them, not on you. You should also use caution in using chalkboards or flipcharts, since their use means you may have your back to your audience while writing.

l I l L
l
Report Writing Manual - Pnge 83
Conquering Nervousness
Giving an oral report is often scary. Some people overcome their fears with experience; some speakers always get nervous in varying degrees. If you prepare thoroughly and present your material with a genuine concern for your audience, they will readily overlook a few "um"s, the occasional stumble, or the slight shaking of the hands and knocking of the knees.
However, there are ways to minimize nervousness. If you find yourself getting shaky or nervous, try one of the following strategies:
• Take ten deep, slow breaths that make your stomach, not your chest, go out.
• Unobtrusively wiggle your toes, cross your fingers, flex your muscles, etc. This helps focus nervous energy into physical action.
• If you lose your place or your composure, stop and gather your thoughts. A graceful, "I'm sorry, I meant to tell you about .... This is important because .... " is fine; just make sure your audience knows where you are in your "road map."
• Consciously lift your head and speak louder. This convinces your audience, and yourself, that you're full of confidence.
•Redirect your focus outward-toward your listenersrather than inward. Concentrating on what your audience needs to hear rather than on how sweaty your palms are or how odd your voice sounds will go a long way in reducing anxiety.
An important thing to remember when giving a presentation is that speaking in public makes most of your listeners nervous too, so they are very sympathetic. You should also recognize that we are always our own worst critic, and you are doing far better than you think you are. Knowing your material, planning ahead, and ample practice are the keys to a calm and collected presentation.

Appendix A: Sample Calculations
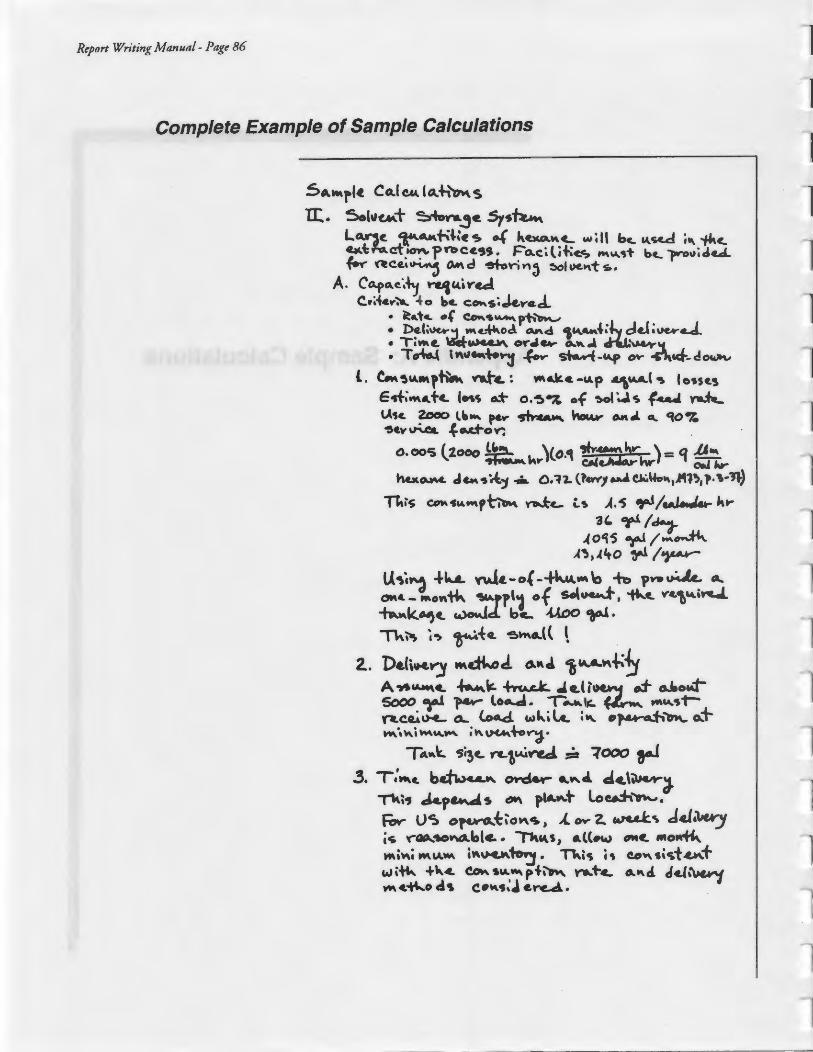
Report Writing Manual - Page 86
Complete Example of Sample Calculations
sA•rl« CG.I CCA.1~-h~ s II:. S.h•fM.T ~n.~e Sy•~
L~~ ~~~~,«~ ..( k~"c.... wilt be.."'~ ;" ~<.. ~th.cf.'°!" f n>C«~S. F"o.c&lii-:c.-; ""~""t be_ °}W'o"idc.cl ~ ~Ce.'~ ~d '9f.orin:) ~lve.t\ts..
A. C4f>ac~~ ~c.c.aYed C.w;icr~ :.f.o l,c. c°"s;Je,yc.cl..
• it-.'t«.. o{ ~ .. ~pt.~ • t>c.(;~j ."'c..~oc!. ~cl 1"-~"-;"6 dcJ ;~c.cl. . ··-~vet-~°"'~ ... o..".l d-'1.~'t • T~ '""-°"~ ~"'" ~-1.\.f> o~ ~.Q-.. d~
L. CM~'4Mf~ ~c.: Wl'~e.-t.A.p .&\~( ~ lo~sc.s e1f;"'._tc.. IM~ o-.+ o.~~ ·.f ~ol ~~ fc.a.l ~ U1c. 2ooo Ua-. pa~ ~ ~ OK.I. ' 'IO~ ~v~ ~od-ovi: .
o.oocs l:zooo ~""')(0.1 :~hr)= q !"'.w. hu~ clCM • ~-l:I • 0.1'L (l•w1..J ca-:.Yv"•"l~, 'P· , ... .,.,
nr~ ~'SM.M\,~ ~<- t~ .A.i ,...&/..J..J .... " ... 3'~/,
-'04ii ~/"'~ A~,A'tO ~/~
lt4'i~ .... "-a. nJ~-o(-~• \o -ht ,"9~ A.
OMC. - Mofttk ~pf \1 of 5°'~ t ~f.. V'C.\"-trc..l '""'-"k.CM)c.. ~c:L be.. .U.00 ~ •
"'~ i~ ~'*4L ~h\a.(( l . 2.. De.l\.e.y_y "'~c! ~"tl 45-..a.~~"!Y
A~Y.M\-.. ~"9 ~ .ic.ll~ .:1- oJ.o.dsooo ,..i ?4W"' lo...&. -r---. ~ ~ ""'"tY'C~\H.. 0.... (o4l.c:l w"-\l.c.. :"- ·~~ ~+ ~··~·W\\,\.~ '"'~~\"'~•
TA9'k.. ~;~~ A..t,1.4&~ ;,, 1000 a.J .3. T.'""c. b.:fi.,~ ~-.~cl ci-..\~)
'""'" cl4.p~~ OW\ pl~t lou-:h""'"'· Fov- US o~t\o~1t, ,( tw 2.. ~~ ddiWN"J t49 V"~~~blc. • lk ... s, a.U.w OM«. •o"'"'- l "'i"'i WUA.W\ tW\~~ • Tl\i41 i, CO"'t\,t~+ ""''~ +"-.c.. ~$~W\, .. ~ ~i-c.. ct.t\cl "d~ W\ c.-t\-..o d' C•"•;J e.~ •
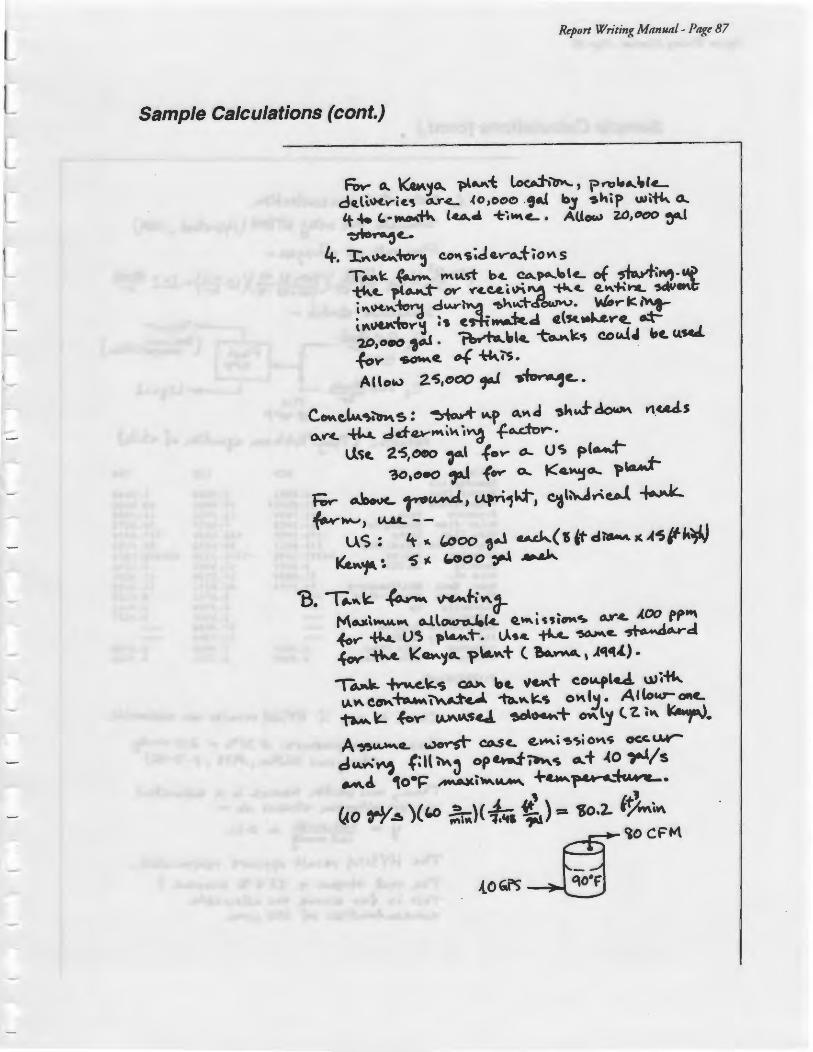
Report Writing Manual - Page 87
Sample Calculations (cont.)
fOv- Q.. ~~°"' 'pl~~ Loc:J-.~, pn>t.~l,lc.... dd\\N.V"i~, ~r-c.. .(o,ooe .9al b.J ~kip w'f"' 4.. tt.._ ,.~~ (~4 ot-iM\~ • AllO&tJ UJ,ooo ,-.& ~...,c-
4. °J:W\~"°"":J COt\'l;d&Y-A.tio~ S
T~k. ~ m'4.rt b~ CA.f~Jol«-. of ~;wt·Mi> tk,c. ?lo-tJ- oY ~~u&\)'\~ ~-- e.t\.i\.,.._ "*'MC i "'"'"'"'°~ d~l"a ~h""'1-ct'oW""'· Wor IC~ tt\\IU\ioY'J :, ~rl;M&.'kc:& C(M.~W'"f!. ~ 20,0.0 to.I. ~"'«- t°""'k4' cocJ4' '-t.. u.M.l .f.oy ~e. '* ~~. AUo~ 2.45,«>0 ,_J -.~~.
C°"c."'4~~ s: ~ ~p Q."' cl <Sh.J-~ l1.uAs Q.~~ ~ c:ld~~\\\i~ ~~.,...
l14ic.. 2.-s,oeo ~' -'•"*"' o- us pt--.t--aa,oeo ,_J (oY" o... K•~o.... ?~
t;..-~ '"'~' ~1~• c-,l~t-iuJ ~ f-.vwv, ~ --
U<i: 't--. f./JOO '.J ~(1,td~J(A4Sf"¥J l(.."''f'. ~ 45" ~00 ,-l ~
~. -r;.~~ ~ ~fiW'-a-M..-\""""' oJ.l~(.c.. Q."'-' niOM'» AY.C. J.00 tP"" ~~ ~ l)~ p~+-. lA•c. tL-e- ~c. .,t~cl ~ ~ \re--.'Jo... -p~t ( ~, Jq .. 4',).
l~ ~\c.-S ~ ~t. ,,&w\t C01Afl4Lel wi""'-\A.~ c~~ "'-d~ 11t..~ k:.4' o~ l:J • A I (o14r Oftc..
~ k.. ~V'" CA-W\~·~ ~04+\+ ~ lj (. 'Z. ;" ~-A ~CL ~ CA.Sc.. e~•~~iot'\~ occ.u-r d~~ ~a(~~ op~~~ -.t .(O ,-J/s ~cl 10·~ ~·""~ +&M~~-
~ \ J; J Yo ,..y~ )(t.o ~)(1,... ~)- io.:z.. '~i"'
~t:ioCFM
. .(.OQ">~

Report Writing Manual-Page 88
Sample Calculations (cont.)
.{, ~~ ... ~ ~UM.iw---h~ 4:>1-.,.lJ-. -flt~ IA~"~ MYS1M l"'rrv~ , ,~~) Flo.., ~c.. Oi6 .. :~,~ -
~~o £t! )(L ~ \/~'51oP:.)('°"'i~)=i22. ~ "'"' ~ ~I\. 4601'10 .,. ~ I hr"'
4S"'JJt-. 9cd-~ -Nz_ Al..0¥
1o•F
Mi1' •~F
iu"'1~: (Ye.~-~\,~~ <t~~ .( 4'-t.:i-c.)
Straaa MIX LIQ VAP De•cription Vapour frac. 0.6891 0.0000 1.0000 Ta•paratura F 90.0000• 90.0000 90.0000 Pr•••ura P•ia 14. 7000 14. 7000 14.7000 Molar Flow Lb•ola/hr 24.0000 7.4627 16.5373 Ma•• Flow Lb/hr 1370.2909 642.6548 727.6358 LiqVol Flow Barrel/day 135.4013 66.4012 69.0001 Enthalpy Btu/hr 94297.1432 -7309.1119 101606.2629 Density Lb/ft3 0.2073 40.5960 0.1103 Mola Wt. 57.0955 86.1160 43.9996 Spec. Heat Btu/lbllola-r 24.2324 45.5131 14 .6292 Thara cond Btu/hr-ft-r 0.0761 o. 0125 Vbco•ity Cp 0.2784 0.0141 z Factor 0.0053 0.9937 Sur Tan•ion Dyna/ca 17.0896 Std Den•ity Lb/ft3 41.5596 n-Haxana aola frac. 0.5000 0.9989 0.2748 Nitr09an aola frac. 0.5000 0.0011 0.7252
C:\HYSIJl>cd\
C.hul ... ~C.& ·.( •W~ltt\ ~4'~l" AA. AA~4Wt.
Hu..-. ~~""re- ~ ~·c. • 2«>"' .. ~ l•·~ AMA ~ .... > A~l~ ) 'PI 1 _.,,,
1'1w.t..) tMok ~~ k~c. :~ .... ....~..J. oJv- oir ~\-boot~ ..n.-.f.Mlt ...:.... -
u ._ i.eo "'-~ • o. i.~ ~ 1'o ••"5
Tk4 M'i 11 M ~.c.s"t~ Apr~ Yd-'So"'.J.' e.. Tkc. \HMt -~ i' 2.1.'5~ ku&M.c.. \ T\\' ~ '~ .(.-.., 0a ~·\K. -tt-.a. •• u • ...,. .. ._,'-c.o~ e.~~"'lM. ..( ..COO PP"'•
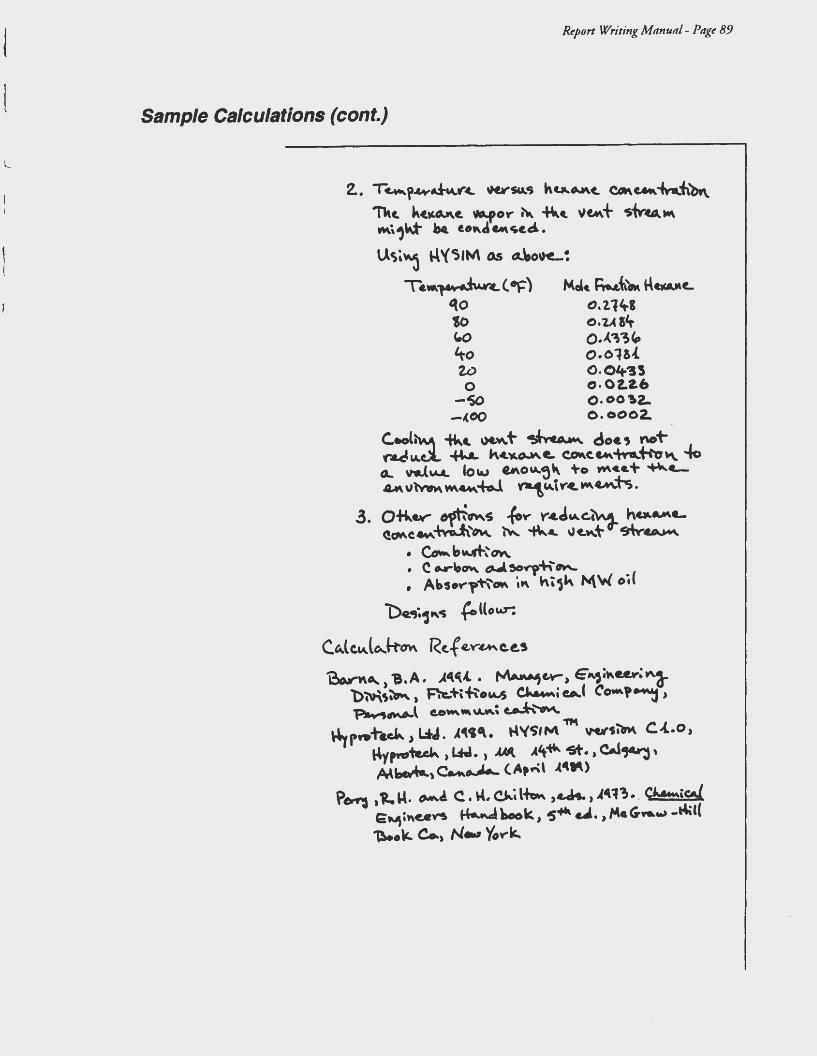
L
Report Writing Manual - Page 89
Sample Calculations (cont.)
2.. T~pA-vJ.~f'~ ~-.'> h""'-~~ COll\CM\-k'h'bw\,
1'\\t. kc."°'""«. #-fOY ~ """'- \If.A\+ ~-fy-~"' W'i\\1\d- lM. t•~ch~49ic.c::l.
Us;~ "4'{51M os o..\.o~~
T·-~( ~) Mel .. ho..c,f~ H~~L 'to 0,114-1 1<> c.u l't c.o o . .(~"?><.. 4o o.01g{ 2.0 O.Olt'!5 0 O·OZ.2.6
--so o.oo-.z.. -.(00 0. 0002.
c.~l~ ~ ... ~+~doe' noi-. ~\A.ci -+'J.. k~~~e... ~c~~i-tu"'- -.le 4... V&lv..t. lo"-' C!.f\O"'-~" +o W\c.a.+ ~.__ 4M\ "~ "'~-t-o.1 rai ~t Y"C.. WW\~'k .
.3. 0~_,. ~~is 1oy Y.&d\A.C.~ hu.~L (!~C~~~ ~ ~"- \Jt.~t-d-~~
. ~"~~OW\. • c ....-\oO\I\. ~ ~-rp+\°"'-• Absov--,-t-\'&M it\ ki1h MW oi(
1)~~~1 "-; .follov.r:
C.""'lc.""l~tt-~ Rc..f ~Y~C.e.S ~W\', -a.A . .A~C\.t. ~,\'"9, E"'''"°u.~;""3-
b(Vi\~~ , ~+i+i'o~ ~· eA.( Co•'~ , ~~l C.0~""'""""; e.o..:h~
'TM ~rw.+&~, LI-.&. A4't~. H'(~IM VU-t~ C..(..o,
~YP"'~, LH., .AMl A't~ 4St., CAI~, A.U1wk) ~o..J,... (A•'°" l .t4W')
f>~ ,.,._&-4. ~~C.H., C"ahM ,W.., -'"·:r~ •. C~iCAl C:~i~~~ ~lw.ok., ~~Ml., 19\ct<F"w -'4\l(
~·"- c.., N~ Yov-k.

Appendix B: Sample Engineering Reports
Civil Engineering Electrical Engineering Mechanical Engineering Mining Engineering

Report Writing Manual-Page 92
Appendix Bl: Civil Engineering Village of Ontonagon Water Distribution System
Evaluation Project
This is a report about the results of a study of the hydraulics of a municipal water system. The sample report illustrates how to report and discuss the results of simulations made using commercially available computer software. The original report contained several figures, tables, and appendixes. These have not been included in this writing manual in order to save space. For the same reason, the reference list has also been omitted.

Edward, IOieg, & Wilson Associates, Inc. Walling Building, Suite 400 Haven, MI 49989
May8, 1992
Dr. Neil J. Hutzler, PhD., P. E. Professor Civil and Environmental Engineering Michigan Technological University Houghton, MI 49931
Dear Dr. Hutzler:
We are submitting the accompanying report, "Village of Ontonagon Water Distribution System Evaluation Project," for your review and approval. This report was commissioned by the Ontonagon Village Council on March 1, to determine if the village's existing water distribution system should be modified.
This report discusses the adequacy of the existing Ontonagon water distribution system. The report includes data on pressures and flows at specific points in the system and outlines the fire protection capabilities for various regions of the system. Moving one pressure-reducing valve will enable the system to serve the needs of the community better without making a major investment.
If you have questions or comments about the report, we would be happy to discuss them with you. Please write or call us at (123) 456-7890 Ext 5.
Sincerely,
dz/~~ t~[;,1J~~et_
Carmine Edward Anna IOieg Julian Wilson
Encl. "Village of Ontonagon Water Distribution System Evaluation Project"

Village of Ontonagon Water Distribution System Evaluation Project
Submitted to Dr. Neil J. Hutzler May8, 1992
Carmine Edward Anna Klieg
Julian Wilson
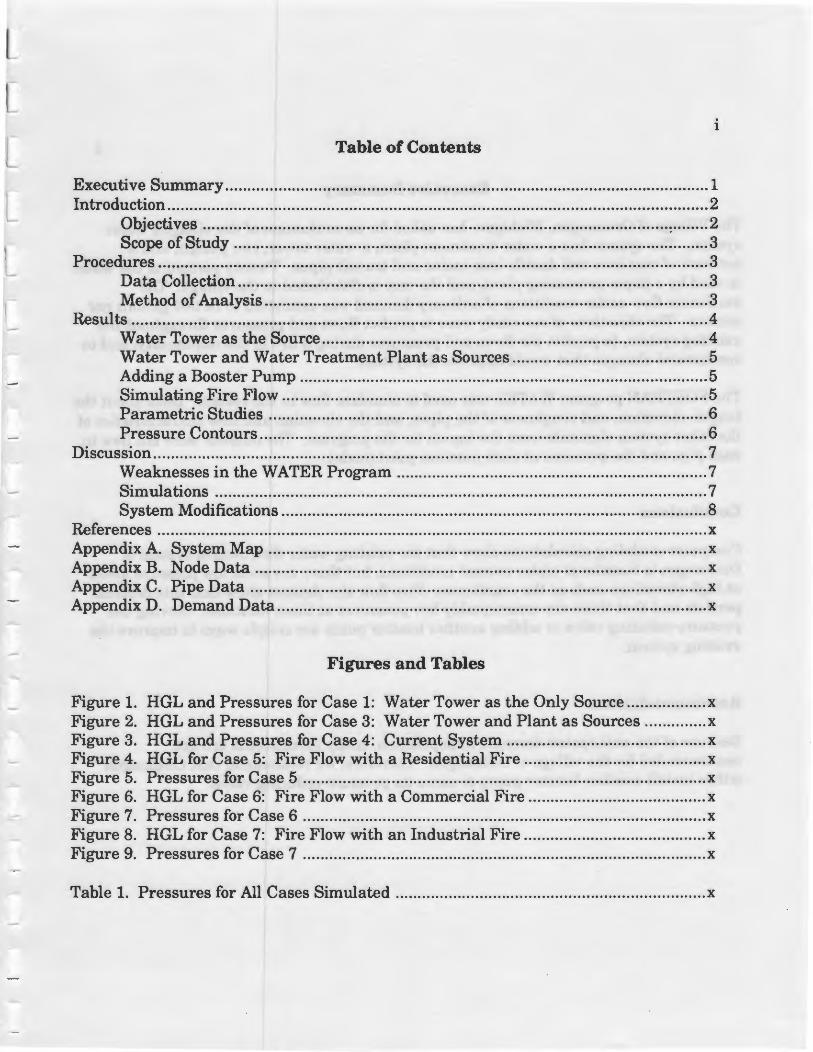
1
Table of Contents
Executive Summary ............................................................................................................. 1 Introduction .......................................................................................................................... 2
Objectives ·········································································································~········2 Scope of Study ........................................................................................................... 3
Procedures ............................................................................................................................ 3 Data. Collection .......................................................................................................... 3 Method of Analysis .................................................................................................... 3
Results .................................................................................................................................. 4 Water Tower as the Source ....................................................................................... 4 Water Tower and Water Treatment Plant as Sources ............................................ 5 Adding a Booster Pump ............................................................................................ 5 Simulating Fire Flow ................................................................................................ 5 Parametric Studies ................................................................................................... 6 Pressure Contours ..................................................................................................... 6
Discussion ............................................................................................................................. 7 Weaknesses in the WATER Program ...................................................................... 7 Simulations ............................................................................................................... 7 System Modifications ................................................................................................ 8
References ............................................................................................................................ x Appendix A. System Map ................................................................................................... x Appendix B. Node Data ...................................................................................................... x Appendix C. Pipe Data ....................................................................................................... x Appendix D. Demand Data ................................................................................................. x
Figures and Tables
Figure 1. HGL and Pressures for Case 1: Water Tower as the Only Source .................. x Figure 2. HGL and Pressures for Case 3: Water Tower and Plant as Sources .............. x Figure 3. HGL and Pressures for Case 4: Current System ............................................. x Figure 4. HGL for Case 5: Fire Flow with a Residential Fire ......................................... x Figure 5. Pressures for Case 5 ........................................................................................... x Figure 6. HGL for Case 6: Fire Flow with a Commercial Fire ........................................ x Figure 7. Pressures for Case 6 ........................................................................................... x Figure 8. HGL for Case 7: Fire Flow with an Industrial Fire ......................................... x Figure 9. Pressures for Case 7 ........................................................................................... x
Table 1. Pressures for All Cases Simulated ...................................................................... x
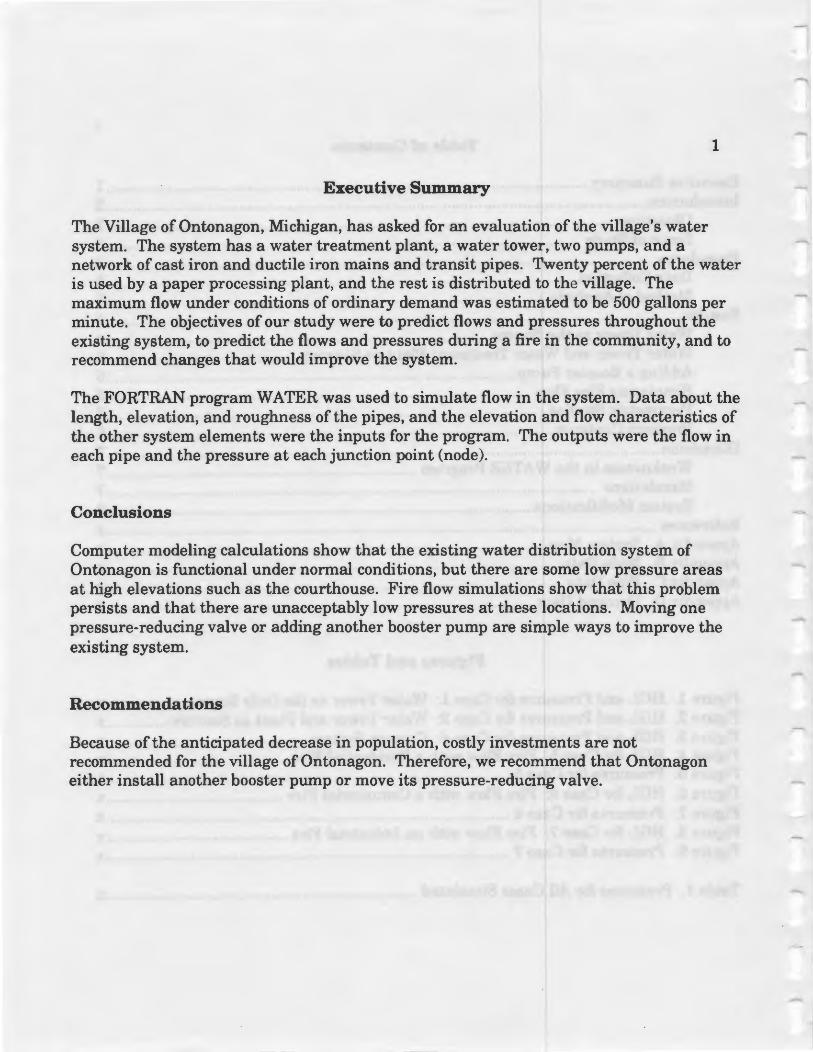
1
Executive Summary
The Village of Ontonagon, Michigan, has asked for an evaluation of the village's water system. The system has a water treatment plant, a water tower, two pumps, and a network of cast iron and ductile iron mains and transit pipes. Twenty percent of the water is used by a paper processing plant, and the rest is distributed to the village. The maximum flow under conditions of ordinary demand was estimated to be 500 gallons per minute. The objectives of our study were to predict flows and pressures throughout the existing system, to predict the flows and pressures during a fire in the community, and to recommend changes that would improve the system.
The FORTRAN program WATER was used to simulate flow in the system. Data about the length, elevation, and roughness of the pipes, and the elevation and flow characteristics of the other system elements were the inputs for the program. The outputs were the flow in each pipe and the pressure at each junction point (node).
Conclusions
Computer modeling calculations show that the existing water distribution system of Ontonagon is functional under normal conditions, but there are some low pressure areas at high elevations such as the courthouse. Fire flow simulations show that this problem persists and that there are unacceptably low pressures at these locations. Moving one pressure-reducing valve or adding another booster pump are simple ways to improve the existing system.
Recommendations
Because of the anticipated decrease in population, costly investments are not recommended for the village of Ontonagon. Therefore, we recommend that Ontonagon either install another booster pump or move its pressure-reducing valve.
2
Introduction
The village of Ontonagon, Michigan is located on the shore of Lake Superior in Michigan's Upper Peninsula in northwestern Ontonagon County. The terrain of the village gradually slopes downward toward Lake Superior. Elevations range from 710 feet at the southern edge of the village down to 602 feet at Lake Superior.
There are two water sources for the village. The first is a water intake pipe extending into Lake Superior, which supplies the water treatment plant. The second is an infiltration gallery (shore collector) located in the northern portion of the village near Lake Superior. For the purposes of this project, the infiltration gallery was not considered as a source.
The water treatment plant is located on the west side of the Ontonagon River, while most of the village lies east of the river. The plant provides a nominal treatment capacity of 720,000 gallons per day.
The water distribution system for Ontonagon contains one elevated water tower (100,000 gallon capacity), two pumps, old cast iron mains, and ductile iron and transit pipes. The elevation of the water in the tower ranges from 7 40 feet at the low water level to 756 feet at high water level. One of the pumps is located at the treatment plant, and the other pump (a booster pump) is located near the water tower. The major consumer of water in Ontonagon is Stone Container Company, which uses 20 percent of the village's water supply for paper processing.
The current population of the village of Ontonagon is 1,910 (Department of Management and Budget, 1986). The population trend over the next 20 years is uncertain. If another paper mill is built in Ontonagon, the population will probably increase. Otherwise it is assumed that the population of the village will decrease because of the rural setting of the village and the lack of employment opportunities in the area. The total maximum water demand for the system over the next 20 years was estimated to be 500 gallons per minute (gpm).
Objectives
This project has three objectives:
1. To predict the flows and pressures in the current system during a time of ordinary maximum water demand-500 gpm-and determine if the pressures at any point in the system fall below a minimum of 30 psi or rise above a maximum of 100 psi.

3
2. To determine ifthe system meets the following minimum standards for flow and pressure during a fire in the community: a. Minimum pressure of 20 psi at any point in the system. b. Residential area: fire flow >500 gpm c. Commercial area: fire flow >1,000 gpm d. Industrial area: fire flow >2,000 gpm
3. To determine if the system needs to be modified to meet future demands and, if so, how the system should be modified.
Scope of the Study
The current Ontonagon water distribution system was evaluated during maximum day demand and fire flow conditions to determine if the system meets the pressure and flow conditions specified.
Procedures
Data Collection
Pipe and node data for Ontonagon's existing water distribution system were obtained from a water distribution map of the village in the following manner:
1. The pipes on the original map were traced on Mylar with colored pencils, each color denoting different pipe dimensions. Most two-inch pipes and select fourinch pipes were deleted. (See Appendix A)
2. The nodes and pipes were numbered from northeast to southwest and recorded on data sheets. (See Appendixes Band C)
3. The length of each pipe was measured and recorded. (See Appendixes B and C) 4. The elevation of each node was determined from topographical contours and
recorded. (See Appendix B) 5. The demand at each node was determined and recorded (See Appendix D) 6. The roughness coefficient, C, was determined for each pipe and recorded.
Because the smaller pipes are usually the older pipes, the two-inch and four-inch pipes were given C values of 60 (very old and corroded cast iron), and the six-, eight-, ten-, and twelve-inch pipes were given C Values of 100 (old cast iron).
Method of Analysis
The FORTRAN program WATER (Municipal Hydraulics, Vancouver, B. C., 1984) was used to analyze the system. This program uses the Hazen-Williams equation and the Hardy Cross method to solve for the pressures and flows in complex piping networks.

4
The node and pipe data were entered directly into the program. The node inputs were elevati.on and demand. The pipe data were the nodes at each end of the pipe, length, diameter, and roughness factor. The units for water demand were gallons per minute. The roughness coefficient was dimensionless. The pump characteristics were obtained from a system head curve for each pump and were entered as X and Y coordinates; X represented the flow, and Y represented the head produced by the pump. The pipe output consisted of flows, headlosses, velocities, and upstream and downstream hydraulic grade lines and pressures. These results were used to analyze the system and its various strengths and weaknesses.
During the analysis of the Ontonagon system, the following seven simulations were run with the WATER program.
1. The water tower at low water level (Y =7 40 feet minus 640 feet ground elevation = 100 feet) as the only water source node.
2. The water tower at high water level (Y =756 feet minus 640 feet ground elevation = 116 feet) as the only water source node.
3. The water tower at low water level and the water treatment plant reservoir at high water level (elev=617 feet) as two source nodes.
4. The water tower at low water level, the water treatment plant at high water level as two source nodes, plus a booster pump near the water tower. A pressure-reducing valve (PRV) was added to pipe 107 to ensure that the booster pump served the correct area. This case simulates the existing system.
5. The water tower at low water level, the water treatment plant at high water level, and a fire in the residential area of Ontonagon as three source nodes, plus the booster pump (Y=46). See Appendix D for headloss value determination.
6. The water tower at low water level, the water treatment plant at high water level, and a fire in the commercial area of Ontonagon as three source nodes, plus the booster pump (Y =46). See Appendix D for headloss value determination.
7. The water tower at low water level, the water treatment plant at high water level, and a fire in the industrial area of Ontonagon as three source nodes, plus the booster pump (Y=46). See Appendix D for headloss value determination.
In each case twenty percent of the water supply was allocated to Stone Container, and the rest was divided equally among the remaining users.
Results
Water Tower as the Source
If the water tower is the only source node, the hydraulic grade line (HGL) from the water treatment plant to the water tower ranged from 750 feet to 756 feet for low water

5
level as shown in Figure 1. The pressure at the courthouse (node 85) fell below the minimum pressure limit of 30 psi (24.4 psi), as shown in Table 1. Possible causes for this low pressure are the high elevation of the courthouse and the large diameter ( 12 inches) of the pipe leading directly to the building.
Water Tower and Water Treatment Plant as Sources
If the water tower (at low water level) and the water treatment plant are source nodes, the HGL increased from 740 feet at the water tower to approximately 775 feet at the water treatment plant as shown in Figure 2. This was due to the effect of the pump at the water treatment plant. Again the pressure at the courthouse fell below the minimum pressure limit of 30 psi (26.4 psi) as shown in Table 1.
Adding a Booster Pump
This simulation modeled the existing Ontonagon water distribution system which has the water tower and the water treatment plant as source nodes and a booster pump near the water tower. As shown in Figure 3, the HGLjumped from 740 feet at the water tower to approximately 802 feet near the southernmost node (node 110). The energy that the booster pump added to the system caused the jump. During this simulation the pressure at the courthouse increased to 27.4 psi but still did not meet the 30 psi standard (See Table 1).
Simulating Fire Flow
During the residential fire flow simulation (at node 12), the HGL at the northeast node (node 1) was 675 feet and at the southernmost node (node 110) was still approximately 800 feet (See Figure 4). According to Table 1, the courthouse water pressure was 24.4 psi which is over the 20 psi minimum limit for fire flow. The pressure of node 1 decreased below the minimum to 15 psi, possibly because node 1 is upstream of node 123. Node 110 was well above the minimum limit at approximately 40 psi as shown in Figure 6, primarily because the booster pump was still in operation during the fire flow simulation.
The commercial fire flow simulation produced an HGL that began at node 1 at approximately 668 feet, reached 740 feet at the water tower, dipped to 725 feet just before the booster pump, then increased to 785 feet at node 110 as shown in Figure 7. The water pressures in this simulation decreased at the courthouse and the golf course, to 2.8 and 10.3 psi respectively (See Table 1). As shown in Figure 8, the pressures dipped at the booster pump. Node 1 only reached 10 psi, while node 110 was still well above the 20 psi minimum at 32 psi. Node 1 was upstream from the fire.
6
The industrial fire simulation did not affect the HGL as much as the other fire flow simulations~ The HGL at node 1 was approximately 720 feet, increased to 7 40 feet at the water tower, clipped to 735 feet just before the booster pump, and increased to approximately 800 feet at node 110 (See Figure 8). Figure 9 shows that the water pressures from node 1 to node 110 were above the 20 psi minimum. As shown in Table 1, the water pressure at the courthouse was 18.4 psi, again below the 20 psi minimum limit.
Parametric Studies
Varying Maximum Flow
When the maximum flow was varied from 500 gpm to 1,000 gpm, the pressures at the different nodes did not fluctuate significantly (approximately 1 psi). The pressures at the treatment plant dropped 4 to 5 psi, and the pressures at the water storage tank did not change. From these results, it was concluded that it is unnecessary to calculate an exact maximum flow to be used in a water distribution system simulation.
Varying Roughness Coefficient
The effect of varying the relative roughness of the pipes was tested by changing the roughness coefficient (C) in the computer program. This caused fluctuations of about 1 psi in the pressure in the pipes under normal conditions. When the pressures were below normal in the system, such as during a fire flow, the effect of changing the C value altered the pressures significantly. Therefore, during fire flow simulations, it may be important to obtain accurate C values.
Determining Water Demand Allocation
It was found that performing a water demand allocation by counting houses, finding areas, etc., was time consuming and unnecessary. When this method of analysis was compared to the method of subtracting the Stone Container demand from the total maximum demand and then dividing the remaining demand by the remaining number of nodes, there was only a difference of 0.5 psi between the two results.
Considering Minor Losses
When considering minor losses, worst-case K values were used (K=5). The result was less than a 1 psi change when compared to a simulation without minor losses. This is not significant in a water distribution system of this size.

7
Pressure Contours
On the map of Ontonagon (Figure 5), pressure contours were plotted of the simulation of fire flow in the residential area (at node 12). The map was color-coded to indicate the pressure distribution in certain areas, and stars marked the points of interest.
During this simulation, pressures ranged from a high of 83 psi to a low of 10 psi. The high of 83 psi was located near the booster pump. All of the pressures located to the south of the booster pump ranged in the 70s. Another region of high pressures was in the industrial area of Ontonagon, ranging in the 70s.
Lower pressures directly to the north of the booster pump ranged in the 40s. This was due to the pressure-reducing valve in pipe 107, which directs the booster pump flow toward the south. The low of 10 psi (node 2) was directly upstream of node 12, where the fire was located. The high demand at node 12 caused the pressure at node 10 to drop dramatically. Another area oflow pressure was located at the courthouse. These pressures ranged in the 20s due to the lack of flow coming from the booster pump and the high elevation of the courthouse.
Several areas in the middle pressure range existed during this simulation. Pressures ranged between 50 and 60 psi in the commercial area of Ontonagon. The regions covering the river and approaching the treatment plant, those lying directly to the north of the booster pump (containing the water tower), and those containing the residential area ranged in the 30s, 40s, and 60s respectively.
Discussion
Weaknesses in the WATER Program
While using the WATER program certain weaknesses were discovered. In certain error messages, WATER named what were actually nodes "pipes," making it difficult to locate the sources of error in the data. Also, the program did not provide for a global demand value. Ifit was necessary to modify the demand in all of the nodes, the new demand had to be entered at each node.
Simulations
The significant decrease in pressure resulting during each fire flow simulation showed that fire flow should be taken into account when modeling a water distribution system (See Appendix C). However, the small changes in pressure during the simulations incorporating varied maximum flow and roughness coefficients, accurate demand

8
allocation, and minor losses showed that it is unnecessary to consider these factors when modeling a small water distribution system such as Ontonagon's.
Two observations were made during the analysis of the fire simulation results and the pressure contour map. First. pressures near any pump, whether a booster or treatment plant ptimp~ were higher than without a pump. Second, higher elevations and fire flows caused dramatic decreases in pressures, especially at locations far from a pump.
System Modifications
There are many ways to modify the existing Ontonagon water distribution system. Some ways are more economical than others; however, the more costly solutions may better improve the system.
One economical solution is to add a booster pump in one of the pipes leading directly into the courthouse (105 or 106). However, maintenance costs could make this solution less economical in the long run. Another less costly solution would be to move the pressure-reducing valve from pipe 107 to pipe 104. This would allow the booster pump to pump more water to the courthouse, an area of consistently low pressures, while also serving the other high elevation areas.
Hitch Engineering proposed a new water tower, to be built near the courthouse, that would raise the hydraulic grade line from 756 feet to 800 feet. If the HGL was increased, higher pressures and better flows would result throughout the entire system. This would greatly improve the system and would have low maintenance costs, but there would be a large initial investment. Another costly solution would be to install more piping to create more loops in the system, making the system more efficient.
In order to decide which alternative is best for improving the Ontonagon water system, an economic analysis of all the alternatives proposed in this report and in the Hitch Engineering report is needed. The Ontonagon Village Council must decide about population changes and industrial development during the life of the project. A discounted cash flow analysis will show the true cost changes in the system. Preliminary findings based on a declining population indicate that one of the less costly improvements would be best.

Report Writing M""ual - P•ge 104
Appendix B2: Electrical Engineering Design of a Thin-Film RC Circuit
This report describes the steps needed to design a filter circuit. It also includes a discussion of fabrication steps and a comparison of two designs for the same circuit. The choice between the two designs would be made on the basis of an economic analysis of the manufacturing process, but this analysis is not one of the objectives of the report.
Some of the figures have been included in this report; these would normally fit into the text just after they are first discussed but are here grouped just before the appendix. Some figures and the tables have been omitted to save space.

December 20, 1991
Dr. Anand Kulkarni Department of Electrical Engineering Michigan Technological University Houghton, MI 49931
Dear Dr. Kulkarni:
215 W. Houghton Ave. Houghton, MI 49931
The attached report, "Design of a Thin-Film RC Circuit" describes the design of a resistorcapacitor (RC) circuit to be used as a Butterworth filter. The design will be fabricated using thin-film technology. We have considered four design parameters- substrate material, resistor and capacitor materials, dielectric thickness, and temperature coefficient of resistance of the resistor-in designing a RC low pass circuit with a 3 dB frequency of 30 kHz. We anticipate using this thin-film circuit as a high fidelity audio filter. We recommend using an Bmm x 4mm glass slide as the substrate material, sputtered tantalum as the resistor material, and tantalum oxide as a capacitor material. Our calculations show that a capacitor of value of 1X10·8 F will take up a substrate area of0.0992 cm2 and a resistor value of 500 n will require 14 squares, i.e., length= 1.01 cm and width = 0.0725 cm.
We wish to acknowledge the assistance of Mr. Dan Smith for providing us his drafting experience in the layout of the circuit and Mrs. Helen Kruger for typing this report.
Sincerely,
L;,_ C~---J Lin Chang Robert Johnson Michael Weber

Design of a Thin-Film RC Circuit
EE452: Integrated Circuit Engineering Winter 1991-92
Submitted to Dr. Anand Kulkarni
By Lin Chang
Robert Johnson Michael Weber
December 20, 1991

1
TABLE OF CONTENTS
Page LIST OF FIGURES ................................................................................................................... ii LIST OF TABLES ..................................................................................................................... ii EXECUTIVE SUMMARY ......................................................................................................... 1
Synopsis ........................................................................................................................... 1 Conclusions ..................................................................................................................... 1 Recommendations ........................................................................................................... 1
INTRO DU CTI 0 N ...................................................................................................................... 2 Background ..................................................................................................................... 2 Scope ................................................................................................................................ 2
DESIGN DEFINITION ............................................................................................................. 3 Design Parameters ......................................................................................................... 3 Calculating the Values of the Design Parameters ............................ '. ........................... 3 System Design ................................................................................................................. 4
ANALYSIS OF DESIGN ........................................................................................................... 5 Alternate Design ............................................................................................................. 5 Advantages and Disadvantages of Two-Design Methods ............................................. 5
FABRICATION PROCEDURES .............................................................................................. 6 - Fabrication of RC Circuit on a Single Substrate .......................................................... 6 DISCUSSION ............................................................................................................................ 6
Design of Resistors ......................................................................................................... 6 Design of Capacitors ....................................................................................................... 8
CONCLUSIONS ........................................................................................................................ 8 RECOMMENDATIONS ............................................................................................................ 8 REFERENCES ........................................................................................................................ 10 FIGURES ................................................................................................................................. 11 APPENDIX .............................................................................................................................. 13

11
LIST OF FIGURES
Fig. 1: Layout of the circuit diagram ....................................................................................... x Fig. 2: Process sequence for the fabrication ............................................................................ x Fig. 3: The outline of a meander resistor ................................................................................ x Fig. 4: Number of squares vs. resistor area ............................................................................ x
LIST OF TABLES
Table 1: Characteristics of thin-film capacitors ..................................................................... .4 Table 2: Characteristics of thin-film resistors ....................................................................... .4

1
EXECUTIVE SUMMARY
Synopsis
The focus of this report is the design of a resistor-capacitor (RC) circuit using thinfilm materials and technology. We have designed a simple RC low pass circuit with a 3 dB frequency at 30 khz. Such filters are commonly used as high fidelity audio filters in communications systems. We have considered substrate material, resistor and capacitor materials, dielectric layer thickness, and layout of the capacitor and resistor in our design. One of our main objectives was to fit this circuit on an 8 mm x 4mm glass slide.
Conclusions
One of the design constraints considered here is the sheet resistance of the deposited film. The conflicting requirements of a high sheet resistance material for the resistor and low sheet resistance material for the electrodes must be balanced, so several choices such as nichrome, tantalum, tantalum nitrides, and cermets were considered. Materials and fabrication facilities available in our laboratory limited us to selecting tantalum as the electrode and resistor material. To obtain high and low sheet resistances, we chose to deposit high resistivity material by sputtering a tantalum target and to deposit low resistivity electrodes by thee-beam evaporation process. The dimensions of the capacitor of value 1 x 10-sF will be 0.32 cm x 0.32 cm. The thickness of resistor material will be 50 µm.
Recommendations
We recommend to use sputtered tantalum as the resistor material and electronbeam deposited tantalum as the electrode material.

INTRODUCTION
The focus of this report is on designing a resistor-capacitor (RC) circuit using thin-film deposit techniques. Several design parameters applicable to this film RC circuit are investigated. The objectives of this study are as follows:
2
1. Design a simple RC low pass circuit with a 3 dB frequency of 30 kHz to be used as a high-fidelity audio filter.
2. Select suitable materials for the substrate, resistor, and capacitor. 3. Devise a layout so that the resistor and capacitor thin-film device structures will
fit on a 8mm x 4mm substrate.
Background
The rapid development of the microelectronics industry over the last two decades has challenged the thin-film technologist to develop new and improved processes for thinfilm resistors and capacitors. These thin-film materials can be deposited by several techniques such as vacuum evaporation, sputtering, chemical vapor deposition, and sedimentation [1,2].
Most thin-film resistor requirements can be met by films having sheet resistance in the range of 10 to 1,000 ohms/sq. Besides a suitable sheet resistance, films must possess a low temperature coefficient of resistance (generally less than 100 ppm/°C). Several resistor materials, i.e., tantalum, tantalum nitride, nichrome, and cermets, are deposited by one of the techniques mentioned above.
A large number of dielectric materials are available for the fabrication of thin-film capacitors. These materials are tantalum oxide, aluminum oxide, silicon dioxide, silicon monoxide, and silicon nitride. The most important property these materials must possess is thermal and chemical stability. The dielectric constant, dielectric strength, and dielectric loss are other important parameters.
Scope
We have investigated several materials in the selection of substrate material, resistor material, and capacitor material. The material and deposition techniques available in our laboratory imposed constraints on the choice of materials. The major emphasis is on the design of the RC circuit choosing appropriate material and layout diagrams.
In the section on Design Definition, we describe the design parameters in detail and also an optimization procedure to select the optimum values. Detailed analysis of the design is given next. The Discussion section contains arguments for and against certain

materials considered for the substrate, resistor, and capacitor. This leads to our Conclusions and Recommendations.
DESIGN DEFINITION Design Parameters
3
The following design parameters are important in the design and fabrication of an RC circuit to be used as a Butterworth filter.
1. Time constant of the circuit: 't =RC. 2. The resistance value of the resistor and its dimensions in the layout. 3. The capacitance value of the capacitor and its dimensions in the layout. 4. Sheet resistivity of the resistor material and temperature coefficient of the
resistance. 5. Thickness of the resistor material. 6. Dielectric constant of the capacitor material. 7. Thickness of the dielectric material. 8. Area of the capacitor electrodes.
Calculating the Values of Design Parameters
In the appendix, we have shown detailed calculations related to the selection of design parameters shown above. Given the 3 dB frequency equal to 30 kHz, we need the time constant, RC= 5 x 10-s s. The most crucial design constraint here is the size of the substrate available in the laboratory. The dimensions of the substrate are: 0.8 cm x 0.4 cm= .0322 cm2• Since the capacitor requires maximum area, we need to choose a suitable value for the capacitor and select its dimensions first. The capacitance is given by
EE A C = o r
d
(1)
where C is capacitance in F, E0
is the permittivity of free space, Er is the relative dielectric constant on the material, A is the area of the electrode, and dis the thickness of the dielectric. Reasonable ranges of values for C, Er, and dare:
C=l0-8-l0-9 F, Er=l0-25, d=l00-1000 µm
Table 1 gives the characteristics of thin-film capacitors made of Si02 and T~05 [3].

Table 1 - Characteristics of Thin-Film Capacitors
Material Characteristics Dielectric Constant Breakdown Voltage Fabrication Tolerance
Si02
3.9 50V 20%
Ta20 5
22 20V 20%
4
Because of the large dielectric constant and ease of fabrication, we decided to use Ta
20
5 as the capacitor material. Hence, using the maximum value of C = 1 x 10-s F and
typical thickness (d) = 200 nm, we calculate the area of the capacitor electrode (A) to be 0.1 cm2• This area is about one third of the area of the substrate, so the capacitor can be laid out conveniently on the substrate.
Perhaps the most widely used thin-film resistors are those made by evaporation of nichrome, a nickel-chromium alloy. Table 2 compares the characteristics of two important resistor materials, nichrome and tantalum [3].
Table 2 · Characteristics of Thin-Film Resistors
Material Range of Sheet Resistance (n/sq) Temperature Coefficient(ppm/°C) Fabrication Tolerance, %
Ni Cr 40-400 <100
5
Ta 80-4000 0-150
5
The calculated value of resistor, as shown in the appendix, is 500Q. The resistor value, R, is given by
(2)
where Rs is the sheet resistance, /is the length of the resistor, and w is the width. In order to obtain smaller dimensions, we decided to use Ta as the resistor material. Using a low value of Rs= 36 n/sq., we find l/w = 14 squares. As-shown in calculations, W = 725 µm and /z 1.0 cm which are again reasonable values.
System Design
The layout diagram of the thin-film RC circuit is shown in Figure 1. As seen in this diagram, a Ta
20
5 capacitor and a Ta resistor with appropriate dimensions are sketched.
They are connected together by an aluminum interconnecting layer. The compatibility of materials and thin-film fabrication procedures will be discussed later to illustrate the feasibility of this simple circuit.

L
L
ANALYSIS OF DESIGN
Alternate Design
The design of the RC circuit as described in the previous section is based on the assumption that a glass substrate of dimensions 0.8 cm x 0.4 cm is used. Another approach to this design would be as follows:
£ £.,iA RC= 0
4 R2
(#of squares)= 5 x 10-ss
5
(3)
Using Ta20 5 as capacitor material (£T = 22) and Ta as the resistor material (R.=36n/sq.), we find
A(# of squares) = 71
,335 (4)
A reasonable value for minimum d = 300 µm = 3 x 10⁻⁵ cm and minimum width for the resistor as 10 µm = 10-3 cm, one can calculate Al= 2.14 x 10⁻³ cm3• This requires roughly one tenth of the glass substrate area using the area of the capacitor electrode (A)= 1x10⁻²
cm2 and length of the resistor(/)= 0.214 cm. This alternate design uses a smaller substrate area.
Advantages and Disadvantages of Two-Design Methods
Desim 1: Adyanta~es
1. The large areas are easy to implement in the laboratory. 2. This approach does not require sophisticated photolithographic techniques. 3. With large areas, fabrication tolerances are better.
Disadvantaees
1. Large areas have poor uniformity of materials. 2. Large areas consume more material.
Desim 2: Advanta~es
1. Small areas have better uniformity of materials. 2. No waste of materials because the dimensions are determined by proper optimization
technique. 3. Requires less area on the substrate.

6
Disadvanta~es
1. Process complexity; requires sophisticated photolithographic techniques. 2. Fabrication tolerances are worse because of smaller dimensions. 3. More expensive.
FABRICATION PROCEDURES
Fabrication of RC Circuit on a Single Substrate
Figure 2 shows the process sequence for the fabrication of tantalum thin-film circuit containing a resistor and capacitor on the same substrate.
The circuit area will be divided into a capacitor region and a resistor region based on the calculations. Tantalum will be deposited to a thickness of 500 µm onto the capacitor region by electron-beam evaporation method. During this process, the resistor region is masked. The resistivity of evaporated Ta films at 300 K is about 20 microohmcm [4]. This will provide the layer oflow sheet resistance (approximately 0.4 ohms/sq.) which is necessary for the plates of the capacitor. Then this capacitor region will be masked while Ta is sputtered onto the resistor region to a thickness of 50 µm. This sputtered Ta will have a much higher resistivity than the evaporated Ta, e.g., typically 180 microohm-cm [ 4]. Using 50 µm thickness, the sheet resistance is calculated as 36 ohms/sq. The resistor and capacitor regions will be separated by at least 100 µm to insure that the resistor and capacitor regions remain isolated from each other.
DISCUSSION
Design of Resistors [5]
The design of thin-film resistors involves:
(i) choice of suitable material, (ii) determination of film thickness to yield the desired sheet resistance,
(iii) choice of a suitable pattern with the required number of squares, and (iv) the selection ofline width and spacing that results in a power density that is
within acceptable limits imposed by resistor stability requirements.
Film Material: The choice of film material is based on considerations such as the temperature coefficient of resistance (TCR), stability of resistance with time, the allowable power density, and the method of film deposition. One commonly used resistive material is nichrome which is 80% nickel and 20% chromium. The material has a bulk resistivity of
l f
l

7
108-110 µ0-cm and a nominal TCR of 85-110 ppm/°C. However, it is difficult to obtain nichrome film of uniform composition by usual vacuum evaporation techniques because of the difference in vapor pressures of chromium and nickel.
Tantalum (Ta) is a better choice for resistor material because of ease of deposition and stability. Bulk Ta has a resistivity of 14 µ0-cm, and thin films having resistivity of 20 µ0-cm are deposited by the sputtering technique. Undoped, sputtered Ta films are usually in a tetragonal crystal structure known as beta phase which has a resistivity that is much higher than that of bulk material. The resistivity of (3-Ta is 180 µ0-cm with a TCR between -100 and +100 ppm/°C. Nitrogen-doped Ta films have resistivities in the range of 280 to 400 µm-cm and TCRs between -100 and -200 ppm °C.
The permissible power density for any resistor is a function of the resistor material, the substrate, any conductive films on the substrate, and external heat sinks. The temperature of the resistive film is given by
T-T +_g_ - A h
(5)
where TA is the ambient temperature, Q is the power density, and his the thermal conductivity of the substrate to an infinite heat sink. For glazed ceramic substrates (0.76 mm thick), his about 31 mW/cm2°C.
The outline of a meander resistor is shown in Figure 3. The effective area of the meander resistor is the area of the rectangle enclosing the resistor pattern, that is A1 = W I, where W is the pattern width and I is the pattern length. Knowing the power de~sity (Q) ana the required power dissipation (P), ~ = P/Q. Knowledge of the resistance value (R) and sheet resistance(R.) of the film specifies the number of squares (n) of the resistor material, n = RIR.. The approximate number of squares of a meander resistor, neglecting the bend correction factor for each meander, is the number of meanders multiplied by the number of squares per meander. Thus for a meander resistor,
n= W2(1+W/W) (6)
This equation is plotted in Figure 4 for W. = W1• There is parasitic series inductance and shunt capacitance associated with thin-film resistors.

8
Design of Capacitors [5]
As shown in the section on Design Optimization, the capacitance of a thin-film parallel plate capacitor is given by
EEA C= or
d
A characteristic of the dielectric film is the capacitance density
The dielectric film thickness, breakdown electric field strength, E8 , and the breakdown voltage, V 8 , are related by
(7)
(8)
(9)
A very useful film material property which determines the area of a thin-film capacitor is the capacitor charge storage factor. It is the product of capacitance density given by equation (8) and the working voltage, V R' which is usually a fraction of V 8 •
(10)
where K is in the range 0 to 1. The capacitor charge storage factor for a Ta20 5 film is 3.1 QC/cm2 • Dielectric films that are very thin or very thick have higher defect densities than films of moderate thickness. The optimum thickness range for Ta
20
5 films on ceramic is
found to be 300 to 350 µm.
CONCLUSIONS
We have designed a simple RC low pass circuit with a 3 dB frequency of 30 kHz. Suitable materials for the substrate, resistor, and capacitor were selected for the fabrication of this circuit. Based on the availability of materials and fabrication facilities in the laboratory, tantalum deposited by electron-beam evaporation will be used as
l

L
L L
9
electrode material because of its low resistivity. For the resistor, a high resistivity material is required. Here the choice of sputter-deposited tantalum is reasonable. This material has high sheet resistivity and low temperature coefficient of resistance. Because oflarge dielectric constant and ease of fabrication, we have selected T&.i06 as the capacitor material.
The calculations on the resistor and capacitor values have yielded appropriate dimensions on the layout of the resistor and capacitor. A capacitor of value 1x10·8F will take up a substrate area equal to 0.0992 cm2 and a resistor value of 500 Q will have the dimensions of 10.0 cm x 0.0725 cm. The thickness of the dielectric for the capacitor is chosen as 500 µm, and the thickness of the resistor material is to be 50 µm. These are our optimum design parameters to lay out the resistor and capacitor thin-film device structures on a 0.8 cm x 0.4 cm substrate.
RECOMMENDATIONS
We recommend using glass as the substrate material, sputtered tantalum as the resistor material, and tantalum oxide as the capacitor material. We also recommend using electron-beam deposition process for the deposition of the electrode material and sputter deposition process for the deposition of resistor material.

REFERENCES
1. L. Holland, Ed., Thin Film Microelectronics: The Preparation and Properties of Components and Circuit Arrays, Wiley, New York, 1965. Chapter 1.
10 -
2. L. V. Gregor, "Thin Film Processes for Microelectronic Application," Proceedings of the IEEE 59, 1971. pp. 1390-1402.
3. D. J. Hamilton and W. G. Howard, Basic Integrated Circuit Engineering, McGraw-Hill, New York, 1975. pp. 96-98.
4. R. W. Berry, Thin Film Technology, D. Van Nostrand Company, Princeton, New Jersey, 1968. Chapters 7-11.
5. A. B. Glaser and G. E. Suback-Sharpe, Integrated Circuit Engineering, Addison-Wesley, Reading, Massachusetts, 1977. Chapter 8.
l
l
l

1
r
1 -· -~--c-I _ __.. 2
T 3300µrn
Ta Resistor w- 725µ111
100µrn
E~::~:::~~~~!!!!!!-L Au or Al
L = 3(3300µrn) + 200µm = 10100µrn W=725µm L/W-= 13.9 0
Contacts
Cap. Area: A = (31 OOµrn)(3200µrn)
= 0.0992cm2
3100µrn
3
Fig. 1: Layout of the circuit diagram

e .. :::: A. SPOT GLAZE B. SPUTTER UNDERLAY
SPUTTER /3-Ta
C. ETCH R WINDOW ANO C-SLIT
0. PREANOOIZE C
E. SPUTTER TazN EVAPORATE Ti, Pd
F. ETCH Ti, Pd OFF R8C
G. ETCH R TRACK ANO C WINDOW
H. PREANOOIZE R TRACK
STABILIZE BAKE
1. ANODIZE C EVAPORATE Ni Cr, Au
J.ETCH CONDUCTOR PATTERN
K. ETCH Ni Cr, Au FROM R WINDOW ANO FORM COUNTERELECTROOE PATTERN
L . TRIM ANODIZE R
12
Fig. 2: Process sequence for the fabrication Fig. 3: The outline of a meander resistor
a:
i 10 i 5
2
104 t01 101 1rl 10-
RESISTOR AREA (1"9'1)
Fig. 4: Number of squares vs. resistor area
1

13
Appendix
Low pass calculations: Given f = 30 kHz
0
f0
=1/(2 xx x RC) (1) RC =1/(2 xx x f)
0
RC = 5.305 x 10⁻⁵
For simplification of calculations: RC = 5.00 x 10⁻⁵
Sheet Resistances: Given a resistivity of 20 µ!l-cm, the sheet resistance was calculated as follows: Rs= p/d (2)
Where p =Resistivity d = Thickness of Ta layer
Evaporated Ta: Rs = 20 µ!l-cm/ 0.05 = 0.4 n/square Sputtered Ta: Rs = 180 µQ-cm/ 0.05 = 36 n/square
Capacitor Values: Assuming the value of capacitance as C = 1x10⁻⁸F, and the dielectric thickness as 2000 A, the following calculations were made:
C = E0Ed A/d
Where E0
=Permittivity of free space Ed = Dielectric constant = 22 for Ta20 5
A = Area of the plates d = Thickness of the dielectric
A= c d/EoEd = 0.10 cm2
Resistor Values: Given that C = 1 x 10·8F, and RC = 5.0 x 10⁻⁶s
R = 5.0 x 10⁻⁵/1.0 x 10-s = 500 Also, R = R (l/ro)
s
Where Rs = sheet resistivity I= length (J) =width
1/ro = R/Rs = 500//36//square = 14 squares

Report Writing Manual- Page 122
Appendix BS: Mechanical Engineering Design of a Steam Condenser
This sample report on the design of a steam condenser begins with a memorandum assigning the task and provides the skeleton of a report written to satisfy the objectives of the task. The report illustrates how the general guidelines given in this report writing manual can be adapted to fit specific needs. The body of this report contains details of calculation methods. An alternative would be to place them in an appendix along with a numerical example. The figures, tables, references, and appendixes are not included in this sample report, and the discussion is briefer than one would normally find in a report. The section on discussion is intended to demonstrate the style and to suggest the content rather than to be exhaustive.
The executive summary for this report contains figures (omitted here) which are also part of the report. Figures are not commonly included in an executive summary, but in this case, the mechanical details are an important part of the results being presented.
This sample report relates to a device or a product design; the example in the manual relates to a process design. The writing and format of these two types of reports can be the same, but the content and the number of details presented in the body of the report can be different. 1
l l
l I

l l
Design Project Design of a Steam Condenser
Report Writing Manual- Page 123
Power Consultants, of which you are an employee, has been awarded a contract for the design of a small experimental power plant. You are one of the members of the team responsible for the design. The design of one of the important components of the plant, the condenser, has been assigned to a subgroup to which you belong. The following information is provided to you.
Type of condenser: Double tube pass - single shell pass Heat load (kW) Coolant: Water Maximum length of tubes (m) Inlet temperature of coolant (°C) Maximum exit temperature of coolant (°C) Diameter of available tubes (cm) State of steam at inlet Maximum velocity of coolant (m/s) Maximum length of condenser (m)
Propose a suitable design. In your proposal please include the following:
• Sketches of the condenser showing all principal details and dimensions. • Graphs showing the length of the tubes and pumping power for different diameters of
the tubes, and several velocities for each diameter of the tube. The information provided in this section will be used to select the appropriate condenser for the plant.
• For your recommended design, graphs showing the heat transfer rate for mass flow rates of the coolant varying from 30 percent to 100 percent of the design rate, and for inlet temperatures of 10°C above and below the design inlet temperature.
Your proposal is due before the close of day on (date).

Letter of Transmittal
To: From: Date: Subject: Preliminary design of a steam condenser
On (date) we were asked to design a steam condenser for a duty of .... kW. This condenser is part of the experimental power plant. The report detailing the preliminary design is enclosed. One of our concerns is the high length-to-diameter ratio of the condenser. The length of the condenser can be reduced by changing some of the design parameters. If a shorter condenser with a larger diameter is desired, please let us know.

Executive Summary
Design Objectives
As part of the experimental power plant project, a steam condenser is to be designed for a duty of .... kW. The specified design constraints are:
Type: Double tube pass - single shell pass Pressure of steam at inlet (kPa) Design heat load (kW) Coolant: Water Maximum length of condenser (m) Inlet temperature of coolant (°C) Maximum rise in coolant temperature (°C) Diameter of available tubes (cm) Maximum velocity of coolant (mis)
Methodology
The coolant velocity and the temperature rise of the coolant were fixed at .... mis and .... °C respectively. The total mass rate of flow of the water for the designed heat load was calculated. The total number of tubes required for the computed mass rate of flow of the coolant was calculated for each diameter of the tubes. The inside and outside convective heat transfer coefficients were then computed. From the overall heat transfer coefficient and the terminal temperatures of the fluids, the total heat transfer surface area and the length of the tubes were determined. From the computed friction factor for the design velocity and mass flow rate of the coolant, the required pumping power was calculated. The performance of the condenser under off-design conditions was computed for different flow rates and inlet temperatures of the coolant.
Final Design
The recommended final design is given below:
Type: Double tube pass - single shell pass Heat load .... kW Temperature rise of the coolant (°C) Velocity of coolant (mis) Mass rate of flow of coolant (kg/s) Material of tubes Diameter of tubes (cm) Number of tubes

Executive Summary (cont.)
Arrangement of tubes Spacing between tubes (cm) Material of shell Outer diameter of condenser (m) Length of condenser (m) Weight of condenser Pumping power (W)
Figures 1 and 2 show the main details of the proposed condenser.
Off-Design Performance
Figure 3 shows the performance of the condenser with mass flow rates ranging from 30 to 100 percent of the designed flow rates, and inlet temperatures of .... °C, .... °C, and .... oc.
Although tubes of different diameters were considered in the design, no attempt was made to optimize the design because of lack of time.
The proposed design has a length-to-diameter ratio of ...... , which is considered higher than the value used in normal practice. A shorter condenser with a larger diameter can be designed, but it will have a slightly higher pumping power.

l l I j L
DESIGN OF A STEAM CONDENSER
Submitted to Dr. N. V. Suryanarayana
(Date) Project Engineers 1. 2. 3.

1
Contents
Page Introduction ............................................................................................................................... 1 Procedure ................................................................................................................................... 1
Methodology .................................................................................................................... 1 Details of Computations ................................................................................................. 2
Results and Discussion ............................................................................................................. 4 Conclusions and Recommendations ......................................................................................... 5 Nomenclature ............................................................................................................................ 7 References .................................................................................................................................. x Appendix A: Sample Calculations .......................................................................................... x

[ 1
Design of a Steam Condenser
Introduction
Earlier this month, our team was formed to propose a design for a steam power plant. We were assigned the responsibility for the design of the condenser for the plant. A preliminary design of the condenser for a duty of .... kW is proposed. The requirements for the condenser are:
Type: Double tube pass - single shell pass Design heat load (kW) Coolant water Maximum length of condenser (m) Inlet temperature of coolant (°C) Maximum temperature rise of coolant (°C) Diameter of available tubes (cm) Maximum velocity of coolant (mis) State of steam at inlet to condenser
After completing the design, we evaluated the performance of the condenser under off-design conditions, with mass flow rates of coolant ranging from 30 percent to 100 percent of the designed mass flow rate, and the inlet temperature of the coolant varying from .... (°C) to .... (°C). The proposed design meets all the specified requirements for the condenser.
Procedure Methodology
The following methodology was adopted in the design:
• Define the temperature rise in the coolant. • From the heat load, determine the mass rate of coolant. •Assume a velocity for the coolant (not to exceed the maximum specified velocity). • For each diameter of the tubes, determine the number of tubes from the total
mass rate of flow of the coolant. • Determine the overall heat transfer coefficient for each tube diameter. • Compute the total surface area required and the length of the tubes. • Determine the friction factor and the pumping power. •Repeat computations for different values of the velocity of the coolant and its
temperature rise. • Compute off-design performance.

2
Details of Computations
The given design conditions stipulate the inlet temperature of the coolant and maximum temperature rise. With the design inlet temperature and the temperature rise of the coolant, the exit temperature of the coolant was almost equal to the saturation temperature of the steam. Hence, the given temperature rise was also the maximum possible temperature rise. The maximum allowable temperature rise results in a smaller mass flow rate but may lead to a very large surface area. Because of this, a fraction of the allowable temperature rise was chosen. Neglecting changes in kinetic and potential energies, the mass flow rate of the coolant is found from an energy balance as follows. (The symbols used are defined in the list of nomenclature at the end of the report.)
(1)
For a given tube diameter and the selected velocity, the number of tubes is given by
m n=----pVAc
(2)
The condenser shell can be either circular or rectangular. Because a circular shell is stronger than a rectangular shell for a given thickness of the shell, a circular shell was chosen. The overall heat transfer coefficient was determined next. The definition of the overall heat transfer coefficient is
1 r r 1 - = - 0
- + ~In (r /r.) + -U h.r. k 0 1 h
o 1 1 av
(3)
The convective heat transfer coefficient on the coolant side was found from the DittusBoelter correlation, (reference)
(4)
(5)
The condensation heat transfer coefficient, h, was determined from the correlation, 0
(reference)
[_g_p_(p_-_P_)k_3_h_'rg_ ]114
h 0 = 0.875 ~Tdo (6)
h'ri is the corrected enthalpy of vaporization to account for the subcooling of the co~densate and is given by (reference)

L 3
To evaluate h0
, the temperature of the tube surface, which is not known, was needed. It was determined by iteration; the iteration procedure is given below:
i. Assume a reasonable value of Ts between the saturation temperature Tsat and the bulk temperature of the coolant.
ii. Compute h0
•
iii. With the assumption of negligible axial heat transfer in the tube, the outer surface temperature Ts must satisfy the relation
T =T -s sat (7)
From Eq. (7) compute Ts
1v. If the newly computed value ofT is within 0.5°C ofT used in step ii, the correct value ofT
8 and h have been foruid. Otherwise, repeat steps ii through iv using
the newly computed value of T8
•
The value h0
found from Eq. (7) is for condensation on a single horizontal tube. The heat exchanger contains n number of tubes as calculated from Eq. (2), which are arranged in a square or rectangular pattern. The dripping of the condensate on a tube from the tubes above it decreases the heat transfer coefficient. The average condensation heat transfer coefficient with N tubes in a column is given by (reference)
h h =-0-av N0.26
(8)
The values ofh1 and h.v were used to determine the overall heat transfer coefficient in Eq. (2). From a discussion with the group responsible for the system design, it was found that the coolant was water from a cooling tower. The overall heat transfer coefficient was modified to include the effect of fouling of tubes in service. The fouling resistance was taken from (reference).
The total surface area required was determined from the relation (reference)
The length of the tubes is given by the relation
A. L = mtd
0
(10)
(9)

The power required to pump the coolant through a single tube is given by (reference)
f =m gh n n r
The total pumping power is, therefore, given by
The friction head (in each tube), h.., was determined from the relation
hr= f- .1. V2 d, 2
(11)
(12)
4
In determining the friction factor, f, in Eq. (12), a value of .... mm was used for the roughness of the tubes. The friction factor was obtained from the correlation (reference)
f = f .slog g:: [f ff"] r (13)
To find the effect of the velocity of the coolant on the configuration of the condenser (surface area and length) and the pumping power, computations were repeated for different velocities of the coolant, from .... mis to .... mis in steps of .... mis and for the different diameters of the tubes. From the results of the computations, the final design of the condenser that required the lowest pumping power was determined.
A condenser may not always operate under the design conditions. The inlet temperature of the coolant may vary depending on the time of the year. The mass rate of flow of the coolant may vary due to different operating conditions of the pump or the conditions of the pipes. The performance of the condenser under off-design conditions was determined by computing the overall heat transfer coefficient. The effect of fouling was considered in computing the overall heat transfer coefficient. The exit temperature of the coolant was computed from Eq. (9). The heat transfer rate is then given by
The pumping power was determined from Eqs. (11) and (12). Off-design performance for the final design of the condenser was determined for coolant mass flow rates ranging from 30 percent to 100 percent in steps of 10 percent, and inlet temperatures of 5°C and 10°C above and below the design temperature.

l l
5
Results and Discussion
The length and total surface area of the tubes, and the pumping power are shown in Figure .... for different velocities of the coolant. As the velocity is increased, the overall heat transfer coefficient also increases, and this leads to shorter length of the tubes. But the increase in velocity is accompanied by an increase in the friction factor leading to higher pumping power. The total surface area is an indication of the capital cost; the pumping power contributes to the running costs. Thus higher velocities result in lower capital costs but also lead to higher running costs. Within the time available for proposing the design, we were not able to perform an economic analysis of the condenser to determine the design that will lead to the lowest overall cost. From Figure ..... we determined the tube diameter and the coolant velocity that required the lowest pumping power. The specifications of the condenser follow:
Outer diameter of tubes (cm) Inner diameter of tubes (cm) Temperature rise of coolant (°C) Mass rate of flow of coolant (kg/s) Coolant velocity (m/s) Number of tubes Length of tubes (m) Total heat transfer surface area (m) Diameter of shell (m) Length of shell (m) Pumping power (W)
The proposed design with details of construction is shown in Figures.... To account for the uncertainties in the computed values of the heat transfer coefficients, the final design incorporates a 15-percent-higher surface area than that obtained from the computations. Details such as the computations of heat transfer coefficients, overall heat transfer coefficient, surface area, etc., are given in the Appendix for all the configurations considered.
The performance of the condenser under off-design conditions is shown in Figure .... As a result of the safety factor built into the design, the condenser will operate satisfactorily even if the coolant mass flow rate is reduced to .... percent of the designed flow rate, or at a higher coolant inlet temperature at the designed mass flow rate. The safety margin will permit long intervals between cleaning the condenser. Even if 10 percent of the tubes are blocked, the condenser will continue to function satisfactorily.
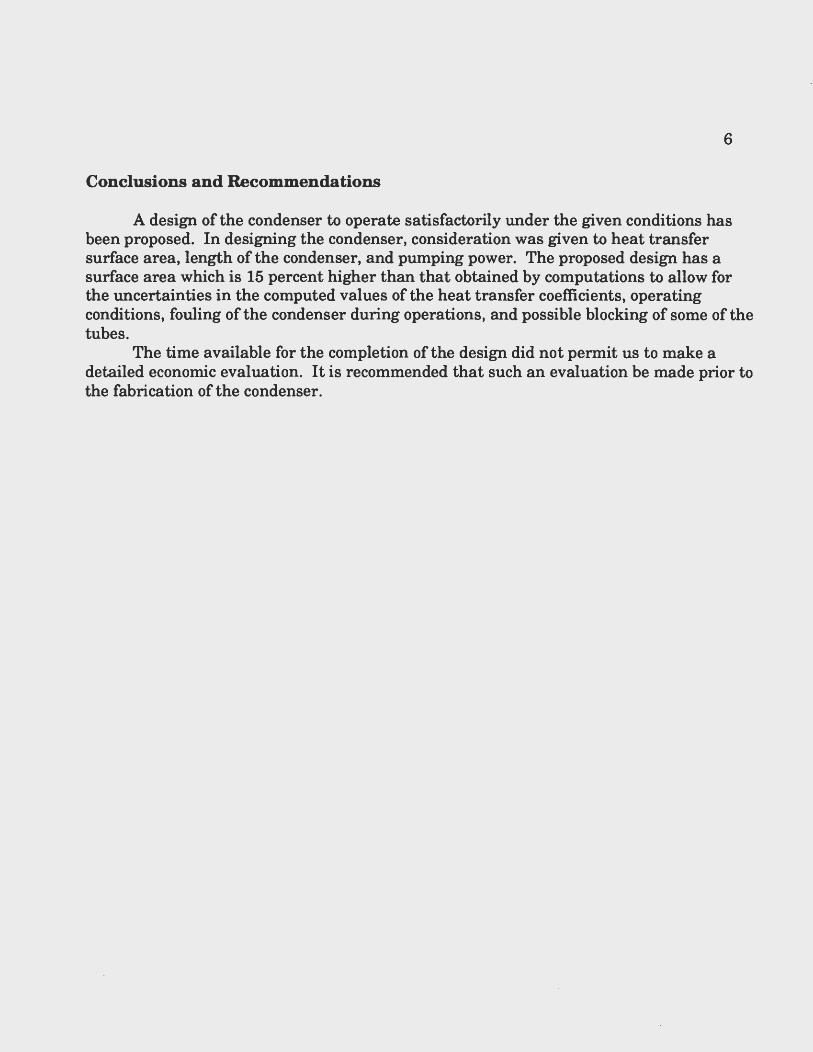
6
Conclusions and Recommendations
A design of the condenser to operate satisfactorily under the given conditions has been proposed. In designing the condenser, consideration was given to heat transfer surface area, length of the condenser, and pumping power. The proposed design has a surface area which is 15 percent higher than that obtained by computations to allow for the uncertainties in the computed values of the heat transfer coefficients, operating conditions, fouling of the condenser during operations, and possible blocking of some of the tubes.
The time available for the completion of the design did not permit us to make a detailed economic evaluation. It is recommended that such an evaluation be made prior to the fabrication of the condenser.
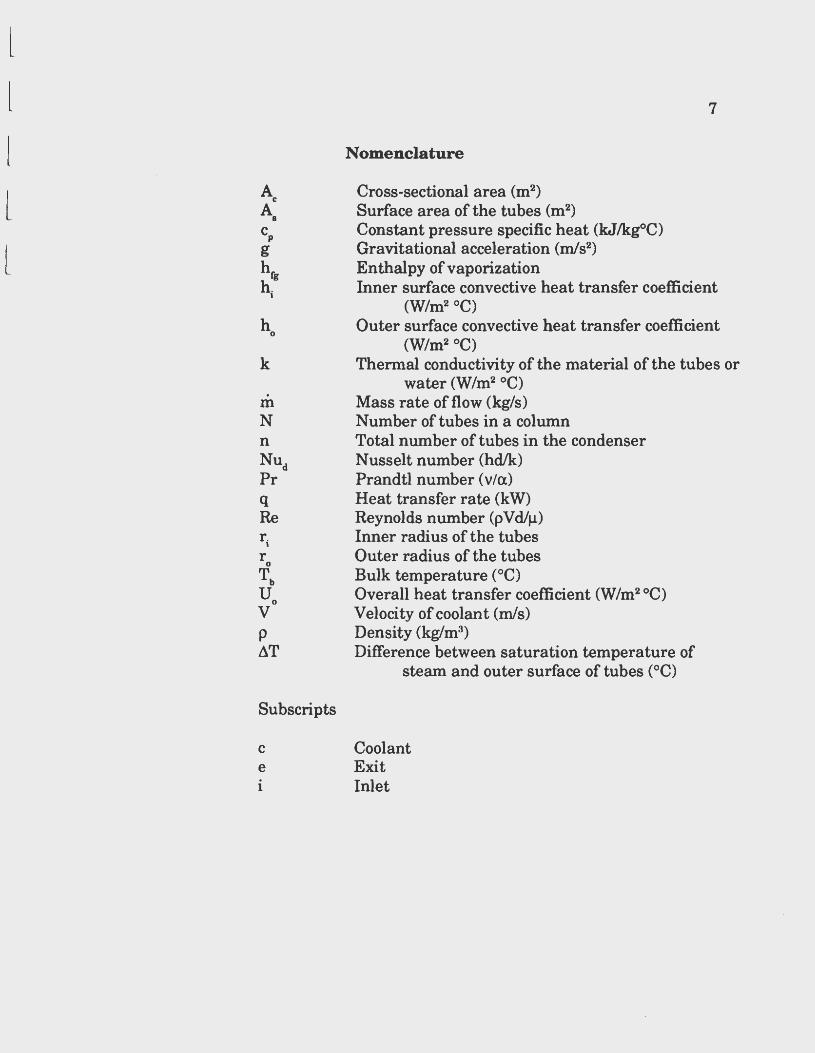
l l l l l
A c
A 8
c p g hfj h.g
1
h 0
k
m N n Nud Pr q Re r.
1
r 0
Tb u
0 v p ~T
Subscripts
c e 1
Nomenclature
Cross-sectional area (m2)
Surface area of the tubes (m2)
Constant pressure specific heat (kJ/kg°C) Gravitational acceleration (m/s2
)
Enthalpy of vaporization
7
Inner surf ace convective heat transfer coefficient (W/m2 °C)
Outer surface convective heat transfer coefficient (W/m2 °C)
Thermal conductivity of the material of the tubes or water (W/m2 °C)
Mass rate of flow (kg/s) Number of tubes in a column Total number of tubes in the condenser N usselt number (hd/k) Prandtl number (via) Heat transfer rate (kW) Reynolds number (pVd/µ) Inner radius of the tubes Outer radius of the tubes Bulk temperature (°C) Overall heat transfer coefficient (W/m2 °C) Velocity of coolant (m/s) Density (kg/m3 )
Difference between saturation temperature of steam and outer surface of tubes (°C)
Coolant Exit Inlet

Report Writing Mllnual-P11g~ 136
Appendix B4: Mining Engineering
Design of Underground Haulage Level and Location of a Production Shaft
This report discusses the location and size of haulage levels and a production shaft for a mine, based on geological, geotechnical, and economic data. The lists of figures and tables, appendixes, figures, and tables are not provided with this example as they would be in a formal report.

l May 10, 1992
Dr. Francis Otuonye Mining Engineering Department Michigan Technological University Houghton, MI 49931
Dear Dr. Otuonye:
The attached report titled "Design of Underground Mine Haulage Level and Location of a Production Shaft" is a report about the second part of a four-part project, Underground Hardrock Mine Design. The project proposal was accepted on March 15, 1992, requiring our team to develop plans and specifications for the location of haulage levels and a production shaft for the Yonker Mine in South Porcupine, Michigan.
The report covers geological, geotechnical, and economic factors that led to the choice of the location of haulage levels and a production shaft. Based on analysis of the data provided, we recommend that haulage levels of dimension 15 x 16 ft. be located in the footwall rock at 350 ft. intervals and be driven parallel to the strike of the orebody. We recommend that a sublevel be located between the main levels and accessed by 180-degree system of ramps. This would facilitate the movement of equipment from one level to another. We also recommend that a 24-ft. diameter concrete-lined production shaft be sunk in the footwall rock to a depth of 2,500 ft., which will provide the primary access to the mine.
We wish to acknowledge the assistance of Minetech Consultants of Hancock, Michigan, in providing us with geological and geotechnical data on the Yonker orebody. Please feel free to contact us if you have questions about any aspect of the report or design.
Sincerely,
:~:~;0~~~~£ J)Lt-e-·~5 Aver Gavelling Frederick Heiring (Group Leader)

DESIGN OF UNDERGROUND MINE HAULAGE LEVEL AND LOCATION OF A PRODUCTION SHAFT
Submitted to: Dr. Francis Otuonye
May 10, 1992
by
James Colder Aver Gavelling
Frederick Heiring

CONTENTS
LIST OF FIGURES ....................................................................................................... i LIST 0 F TABLES ......................................................................................................... ii EXECUTIVE SUMMARY ........................................................................................... iii mTRODUCTION ......................................................................................................... 1 PROCEDURES AND RE SUL TS ................................................................................. 2
wcation of Haulage ~vel ...................................................................................... 2 Size of Haulage ~vel .............................................................................................. 3 Size and Type of Ramp ............................................................................................ 4 wcation of Production Shaft .................................................................................. 5 Size of Production Shaft .......................................................................................... 6
DISCUSSION AND ANALYSIS .................................................................................. 6 CONCLUSION ............................................................................................................. 7 RECOMMENDATIONS ............................................................................................... 8 REFERENCES ............................................................................................................. 9

iii
EXECUTIVE SUMMARY
Optimal locations of haulage levels and a production shaft for the Yonker Mine were determined based on available geological, geotechnical, and economic data. The design provides a basis for the economic development and exploitation of the orebody.
The calculations presented are valid for the first 2,000 ft. of the ore body in the dip direction where the shape and mineralogy of the orebody were well defined. The exploration data were provided by Minetech Consultants of Hancock, Michigan. The fixed costs were estimated as $10.0 million per year per level and the variable costs as $18.0 million per 1,000 ft. oflevel location. These costs are comparable to those for similar mines in the same geologic environment as Yonker Mine.
Based on analysis of the data, we recommend that haulage levels of dimension 15 x 16 ft. be located in the footwall at 350 ft. intervals. The levels will be driven parallel to the strike of the ore body and connected to the shaft by haulage crosscuts. We recommend that a sublevel be located between main levels and accessed by a 180-degree system of ramps so that equipment is not captive in stopes. We also recommend that a 24-ft.-diameter concrete-lined production shaft be constructed in the footwall rock and used as the primary access to the mine. The shaft should be sunk to a depth of 2,500 ft.
1
INTRODUCTION
Mining is capital-intensive, and any decisions that affect the development and exploitation of the ore body must be carefully assessed. The inherent variability and the limited amount of data that are available at the initial stages of planning and design make it imperative to develop flexible plans. These plans can be revised as more information becomes available about the physical characteristics of the orebody.
During the feasibility study of the Yonker orebody in South Porcupine, Michigan, which was the subject of the first report, the following tasks were accomplished:
1. The reserves of ore were determined as 93 million tons. The average grade of ore was determined as 6.8 percent zinc, 1.4 percent copper, and other lower grades of minerals. This estimate, based on 180 drill holes, is subject to updating as new geologic data become available.
2. The economic mining method was determined as sublevel stoping based on geological, geotechnical, environmental, and economic factors.
3. The conceptual size of stopes and the sequence in which stopes are planned to be mined were determined based on geotechnical and geological data.
4. Tonnage estimates for each stope were made. Based on the sequence in which stopes are mined, a production rate of 14,000 tons of ore per day was determined. The production rate was based on the assumption that the mine will operate three 8-hour shifts per day for 250 days per year. At this production rate of3.5 million tons per year, the orebody will sustain a 30-year-plus mine operation.
Yonker Mine needs a system of excavation in the rock or ore to gain access to the mineralized area of the orebody. The accesses include shafts, drifts, ramps, crosscuts, etc., which must be strategically and economically located. The objectives of this study are to determine the following:
1. The optimal location of haulage levels based on geological, geotechnical, and economic data provided.
2. The size of haulage levels and ramps to sublevels and main levels. 3. The location and size of a production shaft for the mine.

2
PROCEDURES AND RESULTS
Location of Haulage Level
Geological, geotechnical, and economic conditions often determine where a haulage system should be developed. Normally, no problems are encountered in deciding whether to place the haulage system in the footwall rock or in ore. One disadvantage in locating the haulage level in the footwall rock is the high development costs due to the absence of ore. On the other hand, if the haulage level is located in the orebody, higher ore losses result between the footwall and the orebody. Often rock conditions are so poor that it is necessary to place the haulage level in a more competent rock in the footwall.
Geologic and geotechnical data of the Yonker ore body show that the host rock as well as the ore is competent; therefore, the level could be located either in the ore or the footwall rock. Because the orebody is differentially mineralized with the higher grade ore near the footwall contact, it would be economical to locate the haulage in the footwall rock. This, we believe, would reduce the loss of the higher grade ore.
Economic factors that influence the location of the haulage levels include the fixed investments, which are invariabie with respect to the depth of the haulage level location, such as the costs of the haulage level and crushing station workshops. The other group of investments is the variable investments which are proportional to the depth oflocation of the haulage level. These investments include the costs of ramps, raises, ore passes, and hoisting shaft.
If the haulage is located at deeper levels, the total investment will decrease because fewer levels will be required. However, the capital investment for that level will increase. A haulage level at a greater depth suggests that more ore will be extracted, and a longer life for the haulage system, ore passes, and crushing stations will result. Maintenance costs for these systems will increase, as will hoisting costs during the initial lifetime of the level. Another effect of having a haulage level at a greater depth is that the layout of the mine would be tied to the available technology. If geologic or geotechnical conditions of the rock or ore change, it could be difficult and expensive to adjust the layout of the mine in order to take advantage of the change. In the event of a decreased demand for ore, it might be more economical to limit the capital investment for a limited lifetime than to invest more money for a longer time in a speculative and perhaps less profitable venture. This is particularly true in the mining industry where there are boom and bust cycles.

3
On the other hand, a shorter haulage level interval ensures enough flexibility in mine planning and design to take advantage of changing ore grades or geologic or geotechnical properties of the rock. A shorter haulage interval ensures that the haulage and hoisting capacity can be increased when development at deeper levels starts in the future. A shorter haulage interval also means that the total investment in haulage levels will increase because more levels will be required for the mine. In addition, the hoisting system must be shut down during the deepening of the shaft. Unless alternative means of hauling or hoisting ore from the mine are provided, or the mine has a large stockpile of ore on the surface, the continuity of ore production would be interrupted. This might cause cash flow problems.
Recognizing these factors, we adopted an economic analysis technique to determine the optimal level. It was assumed that the gross revenue is invariant with respect to the location of the level. It was also assumed that the cost of operating a level and tax costs do not vary with the location of the level. However, other costs vary with depth; therefore, the total investment varies with the location of the haulage level.
The capital costs for five levels were simulated to determine the optimal location of the haulage level. At each level, the quantity of ore that would be extracted was determined and the life of the level calculated. The total investment in each level was calculated as the sum of the fixed and variable investments. The capital cost for each level over its life was then determined. A graph of capital cost against haulage level was plotted, and the location where the capital cost is a minimum was determined. The estimated yearly production from the feasibility study was 3.5 million tons of ore. The mine will operate three 8-hour shifts per day. Fixed costs were estimated as $10.0 million per level and the variable costs as $18.0 million per 1,000 ft. of depth. This data was based on information obtained from similar mines operating in the same geologic environment (Brassman, 1991). Other information on the orebody used in the simulation is given in Table 1. Based on an interest rate of 12 percent, the data generated by simulation are plotted in Figure 1. From this figure the optimal haulage level was determined as 350 ft., corresponding to a minimum capital cost of $24 million. ·
Size of Haulage Level
All haulage drifts are dimensioned to accommodate equipment that will travel through or work inside them and to provide the required clearance for the roof, walls, walkways, ventilation ducts, and service lines. Based on the production rate and rock conditions, it was determined that five cubic-yard, diesel-powered, rubber-tired "load-haul-dump" (LHD) vehicles will be required in combination with 15 cubic-yard trucks. The sequence of haulage we propose is to load the blasted

4
rock from a draw point under a stope with LHD machines, transport the ore through the drawpoint drift, and dump it into trucks on a haulage level. The trucks will then travel on the haulage level and dump the ore into ore raises (passes) that are vertical or near-vertical openings that feed the ore by gravity to a crusher located at a lower level. The location of the ore passes will be determined by computer simulation of mobile equipment haulage networks and by production schedule requirements which would be integrated to provide optimum utilization, flexibility, and productivity.
Drift level development, stope development, ramps, and draw points will be accomplished using air-powered and electrirlhydraulic-powered drill jumbos. These will be used for drilling small diameter holes to a depth of9-12 ft., which, when loaded with explosives and blasted in a predetermined sequence, provide an advance equal to the depth of the hole drilled. Mucking of the broken rock will be accomplished using LHD vehicles. To accommodate the drilling equipment, the LHD vehicles, walkways, and service lines, it was determined that the crosssectional area of the haulage drift would be 15 ft. x 16 ft. (240 square ft.).
Size and Type of Ramp
Ramps are indispensable for the development and mining of orebodies with vertical extension. In analogy with drifts, the size of a ramp is determined by the machines that will travel through it. Ramps are prepared with the same drill jumbos, LHD machines, and trucks that will later travel through them. It was determined, based on gradability curves of the vehicles, to prepare ramps on grades · less than 15 percent in the footwall, which can be negotiated with vehicles and equipment with less powerful traction. We determined from the calculation of the size of the vehicles and drill jumbos that a 12 ft. x 12 ft. (144 square feet) crosssectional area of ramp would be adequate.
Two types of ramps were considered-spiral (helical or circular) and switchbacks (180-degree turns). The circular ramps allow access to sublevels or different levels along a straight vertical line, if sublevels are situated directly above one another. Circular ramps can be constructed around ventilation shafts, thus making ventilation of the ramp easier during construction. However, it is expensive to use drilling, loading, and haulage equipment in the many curves of a circular ramp. Switch-back ramps or 180-degree ramps, on the other hand, are less expensive to construct than circular ramps. Switch-backs are safer and provide access to different levels which are not situated above one another. Switch-backs allow higher vehicle speeds, resulting in higher productivity and lower operating and maintenance costs.

5
A third type of ramp, the inclined straight ramp, was not considered appropriate for the exploitation of the orebody. Based on an analysis of the two types of ramps that were considered, it was decided that, because the levels were not planned to be located directly above one another, a 180-degree system of ramps would be more economical and therefore appropriate for this mine.
Location of Production Shaft
Having determined the size and optimal location of haulage level, and the size and type of access to sublevels and main levels, we then determined the optimal location and size of the production shaft. One of the major decisions in developing a deep orebody is the selection of the optimum location of the shaft. The best location is the one that minimizes the cost of exploiting the ore body. The choice is dependent on many factors including the cost of underground and surface haulage, sequence of stope development, surface and underground investment, size of reserves, and geological and geotechnical factors.
Shafts are normally sunk in the footwall of an ore zone away from any possible effects of blasting or production operations in the· stoping process. In some cases, a central location for hoisting should be as close to the center of the minable reserves as practical, so that the haulage of materials, workers, supplies, and equipment is kept to a minimum. Although this may mean that a large shaft pillar is left in the center of the orebody, it does make for an efficient mining operation. The stability of the shaft and pillar should also be primary considerations in locating the shaft.
The procedure adopted in determining the optimum location of the shaft was modified from the work of Humphreys and Leonard (1978). The modified form facilitates the location of a central facility or nodal point on a plane to minimize excavation and transportation costs. The central facility must serve several facilities on a plane.
Having determined the size of stopes and the sequence in which stopes are developed and mined on a specific haulage level, consistent with the daily ore production (refer to the report about part I of this project-Feasibility Study of Yonker Orebody ), we took the following steps to determine the optimal location of the shaft.
1. The center of gravity of all the stopes mined on a particular level or serving a haulage level was determined. This point was translated on the same latitude to the footwall rock. The new point was selected, based on a stability analysis, so that adequate pillar size was left between the shaft and the footwall contact.
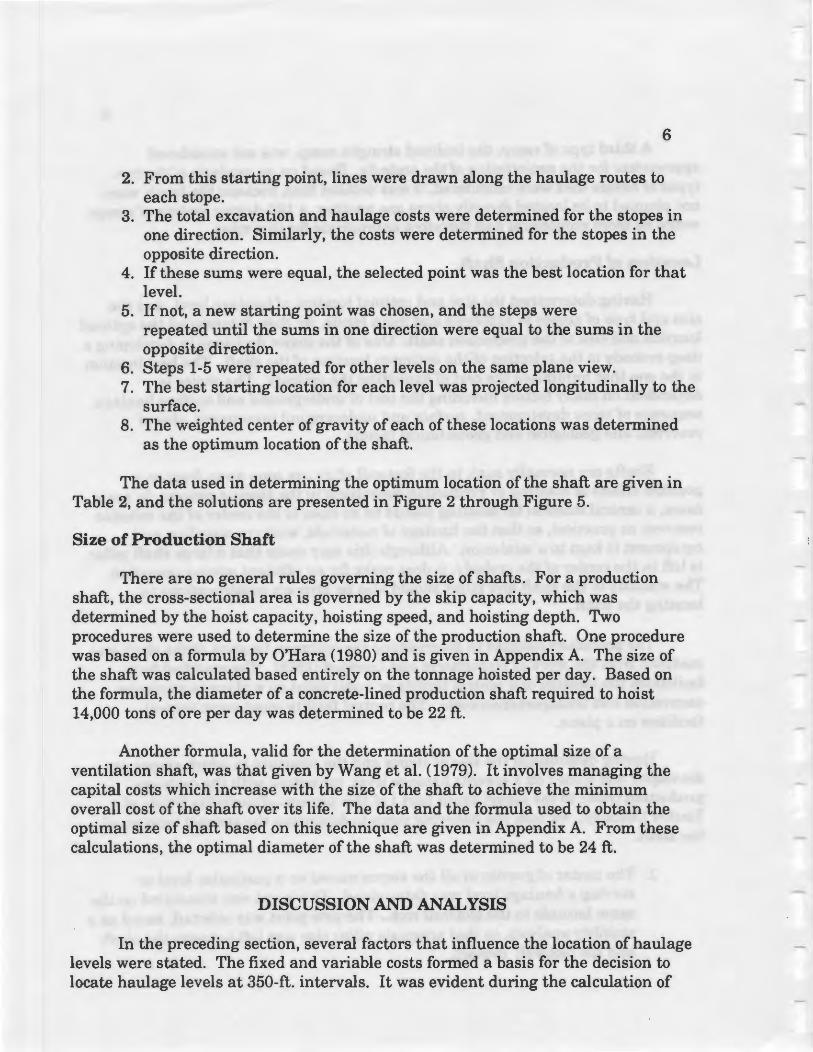
6
2. From this starting point, lines were drawn along the haulage routes to each stope.
3. The total excavation and haulage costs were determined for the stopes in one direction. Similarly, the costs were determined for the stopes in the opposite direction.
4. If these sums were equal, the selected point was the best location for that level.
5. If not, a new starting point was chosen, and the steps were repeated until the sums in one direction were equal to the sums in the opposite direction.
6. Steps 1-5 were repeated for other levels on the same plane view. 7. The best starting location for each level was projected longitudinally to the
surface. 8. The weighted center of gravity of each of these locations was determined
as the optimum location of the shaft.
The data used in determining the optimum location of the shaft are given in Table 2, and the solutions are presented in Figure 2 through Figure 5.
Size of Production Shaft
There are no general rules governing the size of shafts. For a production shaft, the cross-sectional area is governed by the skip capacity, which was determined by the hoist capacity, hoisting speed, and hoisting depth. Two procedures were used to determine the size of the production shaft. One procedure was based on a formula by O'Hara (1980) and is given in Appendix A. The size of the shaft was calculated based entirely on the tonnage hoisted per day. Based on the formula, the diameter of a concrete-lined production shaft required to hoist 14,000 tons of ore per day was determined to be 22 ft.
Another formula, valid for the determination of the optimal size of a ventilation shaft, was that given by Wang et al. (1979). It involves managing the capital costs which increase with the size of the shaft to achieve the minimum overall cost of the shaft over its life. The data and the formula used to obtain the optimal size of shaft based on this technique are given in Appendix A. From these calculations, the optimal diameter of the shaft was determined to be 24 ft.
DISCUSSION AND ANALYSIS
In the preceding section, several factors that influence the location of haulage levels were stated. The fixed and variable costs formed a basis for the decision to locate haulage levels at 350-ft. intervals. It was evident during the calculation of

l
7
the haulage level location that the higher the variable costs in comparison with the fixed costs, the lower the level intervals. If the variable costs had been $25.0 million instead of $18.0 million, the level intervals would be 300 ft. instead of 350 ft. Although the optimal haulage level needs to be re-evaluated ifthe variable costs are significantly different from the values used in the design, the procedure presented would still be valid.
Haulage costs are not directly proportional to the distance traveled as was tacitly assumed in the calculations. In reality, there is a fixed component that is independent of the distance traveled and that varies with the route traveled. Because of this, the costs would be followed by a transport simulation model to compute actual haulage costs for each route traveled.
Excavation costs are also not directly proportional to the Euclidean distance as was assumed in the design. Excavating a haulage level or drift in one direction may be more costly than in another because of the heterogeneity of the rock mass. This geotechnical and economic method of assessing the cost differential was not considered. However, in determining the haulage level location, the layout that provides maximum safety and stability of opening was considered based on geological and geotechnical factors.
The ramp will provide underground supplementary access to mine levels and sublevels. The ramp access will facilitate the movement of personnel, equipment, and supplies throughout the mine. Therefore, the ramp was designed so that it could be extended to the surface at some future time.
In deciding the optimal location of a production shaft for the Yonker Mine, the discussions regarding haulage costs and excavation costs for haulage levels are also valid for the location of a shaft. A decision was made to use a 24-ft.-diameter concrete-lined production shaft instead of the 22-ft.-diameter shaft calculated using the formula given by O'Hara (1980) because, in addition to serving as a production shaft to hoist workers and material, a service compartment was planned to accommodate electrical, communication, and service lines. Therefore, a 24-ft.diameter shaft would be required. The shaft would be sunk in the footwall rock from the surface to a depth of 2,500 ft., which is the depth of the explored section of the orebody.
CONCLUSION
Optimal size and location of haulage levels and a production shaft were determined based on available geological, geotechnical, and economic data. The

8
assumptions that were made and the procedures that were adopted in determining the size and location of these mine accesses (haulage level and production shaft) are indispensable in the economic development and exploitation of the mineral reserves of the Yonker orebody.
Alternative designs were considered and discussed, and the best designs are presented in this report. This design report is subject to updating as more geologic or geotechnical data regarding the rock or ore become available or if economic conditions change. Based on the current economic conditions and data given, the design we have presented is accurate and economical.
RECOMMENDATIONS
Based on the results of analysis of data on the Yonker orebody in South Porcupine, Michigan, we make the following recommendations:
1. Locate haulage levels that are 240 square ft. in cross-sectional area at 350 ft. vertical intervals. The haulage levels should be driven into the footwall rock and parallel to the strike of the orebody.
2. Locate a switch-back (180-degree turns) system of ramps in the footwall rock to connect the different levels and sublevels. The size of the ramp should be 144 square ft. in cross-sectional area.
3. Locate a 24-ft.-diameter production shaft in the footwall away from the influences of blasting or other production activities during the stoping process.

REFERENCES
Brassman, P. K. "Analysis of Costs of Three Operating Mines in Pickerington County." Skilling Mining Review, Vol. 80, No. 5, 1991, pp. 20-25.
9
Humphreys, K. K. and Leonard, J. W. "Optimum Selection of Mining Sites." Coal Age, November 1978, pp. 72-77.
Minetech Consultants. "Geologic and Geotechnical Data of the Yonker Orebody." U.S. Geological Survey Report, No. 807, 1991, 92 pp.
O'Hara, T. A. "Quick Guides to the Evaluation of Orebodies." Canadian Mining and Metallurgical Bulletin, Vol. 73, No. 814, 1980, pp. 87-99.
Wang, W. J., Mutmansky, J.M., and Walrod, G. H. "Optimal Sizing of Conventionally-Sunk Ventilation Shafts Based upon Capital and Operating Criteria." Mining Engineering, January 1979, pp. 47-54.