manpower annual reports 2000
TRANSCRIPT

bilingual call center agent

venezuela
Manpower Venezuela used a creative compensation idea
to win the staffing business for 3 call centers operated by the national
telecommunications company, CANTV. Rather than receiving payment
for each person assigned to work in the call centers, Manpower’s
compensation is performance-based, with a set rate to be paid
for each call that is efficiently handled.
power

soldier

australia
The Australian Defense Force, in an unprecedented move, decided to
outsource its recruitment of military personnel to Manpower in 2000,
due to our ability to provide a full-service solution, in part, through a
collaborative effort with our new Empower Group operating unit.
Approximately 10,000 full-time soldiers and reserve personnel will
be needed per year, and the ADF expects the outsourcing
agreement to cut its recruiting costs by 30 percent.
power

PC builder

power
united states
In North Carolina, USA, Manpower’s Workforce Flexing Program
helped IBM create significant savings associated with contractor staffing
costs. Our Managed Services program includes a full management and
support staff to recruit and train Manpower employees to support IBM PC
Manufacturing, IBM Customer Solutions Center and administrative/
clerical functions. Manpower accomplished critical staffing objectives –
in a market with a 1.4% unemployment rate average.

supervisor

power
germany
Weltbild, a media enterprise that publishes and sells books,
CDs and videos by mail order, is one of the major players of its kind
in Germany. To gain a more efficient and flexible recruitment process,
the company decided to outsource the recruiting function to Manpower
Germany. We were able to successfully recruit 800 employees in a
ten-week period and provide on-site management of the workforce,
consistent with our worldwide reputation for delivering results.

ticket agent

power
hong kong
Over the past several years, Cirque de Soleil has turned to
Manpower in several countries worldwide to staff its popular shows.
This year, Manpower was hired to staff the 2-1/2 month show,
“Saltimbanco” during its run in Hong Kong. Within a 2-week period,
Manpower Hong Kong succeeded in recruiting 150 staff for a
wide range of positions. We also provided on-site management
of the temporary employee workforce for the duration of the show.

payroll manager

ecuador
Outsourcing business functions has become a popular way
for companies to improve their productivity and efficiency measures.
In Ecuador, payroll outsourcing has become a growing part of the
Manpower service mix, with clients such as MasterCard,
Johnson & Johnson, Albonova and Gillette.
power

waitress

power
belgium
Manpower was the first European staffing firm to open an
in-house branch within a football stadium. At every football (soccer) game
in the Anderlecht stadium, Manpower Belgium recruits and manages
200 trained temporary employees for the catering and hospitality
areas of the stadium.

construction worker

power
switzerland
Manpower opened four new offices in 2000 to support a
major construction project in Switzerland, which consists of building
two tunnels through the Alps to ease transportation across the country.
We are providing temporary construction workers for three different
firms that are managing the project: AST from Austria, SATCO
based in England, France, Sweden and Switzerland; and Matrans,
a merger of French, Austrian and Swiss companies.

salesperson

power
argentina
Through its dedicated sales personnel division, SalesPower,
Manpower Argentina recruited, selected and trained more
than 1,000 sales people for Movicom Bell South, helping the
telecommunications company to become the leading seller
of wireless phones in Argentina in 2000.

warehouse worker

power
singapore
Manpower Singapore provides the total HR solution
for the provision of logistics warehouse staff, including supervisors,
for Sandvik Coromant, in Singapore. The scope of work includes selection
of supervisors and deployment to Sandvik’s facility in Holland for training.
Manpower Singapore has been responsible for staffing the facility,
plus developing and implementing HR processes and procedures,
including achievement recognition programs, performance bonus
programs and performance evaluation programs.

programmer

power
Elan Group Ltd.
Leading blue chip companies with major IT projects turned to Elan
in 2000 to provide the right resources for the job in the United Kingdom,
Netherlands, Ireland, Switzerland, Germany and Hong Kong. Elan's
managed service business supplied on-site IT staffing services to
global clients in the telecommunications and software services sectors,
providing improved delivery of scarce human resources and
organizational efficiencies.

systems engineer

power
japan
As a preferred staffing vendor for global corporations like
Hewlett-Packard, American Express and AIG, Manpower Japan
is rapidly expanding its presence and quality reputation throughout the
country. In 2000, we expanded our office network by 100 percent and
opened dedicated recruiting and testing offices to meet the
growing demand for our services.

welder

power
france
In response to the shortage of skilled workers in the industrial,
construction and logistics sectors, Manpower France launched a
nationwide program designed to recruit and train more than 1,000 people
for new careers in 20 occupations with noted regional shortages. The
program was completely financed by Manpower, with a budget of
15 million francs (US$2.3 million), and was open to anyone, regardless of
age, level of education or previous employment experience. Manpower
successfully provided a new pool of workers for our customers, and
created new career opportunities for people to work as welders,
masons, draftsmen and other skilled occupations.

IT administrator

power
finland
In 2000, Manpower Finland began a large-scale Solutions Management
and Cooperation agreement with International Computers Limited, a
global IT company belonging to the Fujitsu Group, which is Europe’s
leading provider of e-business and e-infrastructure solutions. In addition
to staffing IT and administrative positions, we provide facility management
services, support systems and human resource services for ICL’s
e-infrastructure outsourcing projects at companies like Nokia,
another key Manpower client in Finland.

training manager

power
colombia
Training services are a hallmark of Manpower’s brand leadership
around the world. Many companies hire us to provide training to their
employees as a stand-alone service due to our quality reputation.
In Colombia, we provide temporary employees for Almacenes Exito,
as well as a comprehensive training program, including Quality Service,
Personal Presentation Skills, Values and other topics, for employees
in Medellín, Bogotá and Cali.

assembler

power
austria
In Austria, Manpower played a critical role in helping Magna,
a leading global supplier of technologically advanced automotive systems,
resolve the high labor turnover in three of its sites. We developed a plan to
create precise job specifications and use Manpower’s proprietary Ultradex
system to assess the skills of job candidates and place them in jobs that
match their skills. As a result, the turnover rate has been reduced from
35% to nearly zero, and Manpower has become a preferred supplier
for the three Magna sites.

recruiter

power
israel
Manpower Israel manages several C.V. Centers (résumé centers)
as an outsourced function for high technology companies like Lucent,
Intel and Applied Materials. Our expertise in recruiting, assessment
of the candidates’ skills and abilities, and management of the
employee intake process, provides these clients with a more efficient
way to recruit talented employees in the highly competitive
technology sector.

contact center manager

power
united kingdom
In the United Kingdom, Manpower provided a total contact center
solution for leading CRM specialist, 7C, during 2000. In addition to
providing the building and associated infrastructure, Manpower recruited
the management team and a full workforce of contact center agents.
The contact center supports 7C’s client, ONdigital, the world’s first
digital terrestrial TV platform. The center opened at the end of July and,
by late December, had handled its one-millionth call for ONdigital.

engineer

power
denmark
Manpower provides companies worldwide with professional staff
in fields such as engineering, information technology, and
laboratory science, to fill their needs for expert assistance on short-term
projects. In Denmark, engineers are frequently provided for companies
like Glunz & Jensen, a manufacturer of process automation equipment.
The contractor lifestyle is increasingly attractive to professionals
in these fields because of the flexible work schedule and the variety
of experience that they can gain in a short period of time.

HR consultant

power
The Empower Group
A key development for Manpower in 2000 was the launch of its
Empower Group operating division to provide organizational performance
consulting services to major companies worldwide. From its official
opening in July with offices in 10 countries, The Empower Group has
generated great interest from many of the world’s largest
corporations who are seeking more effective ways to
manage their human resources.

production line worker

power
mexico
In Mexico, Manpower provides large-scale recruiting services
for manufacturers like Solectron through the use of creative techniques
such as mobile recruitment teams. They travel with vans and portable
recruitment stands to find the qualified employees needed to fill the jobs.
In 2000, our teams visited 40 villages as far as 55 miles away from
the Solectron facilities to find the qualified workers.

web site developer

power
sweden
The explosion in e-business worldwide has been particularly
evident in countries like Sweden, which has embraced technology
more quickly than other areas of the world. For Manpower, this
technically savvy culture serves as a fertile proving ground for
new technologies. Manpower Sweden now operates the largest
e-recruitment Web site in the country, offering its services
free of charge for both its customers and its candidates.
This has transformed the market and resulted in a
substantial increase in market share.

mechanic

power
italy
Manpower Italy provided an average of 1,300 temporary employees
to Fiat at four different locations across Italy during 2000. Our services
included on-site management of the temporary workforce, as well as
recruiting, assessment and selection of all candidates. In addition, we
created a program called “Iride” to support qualified candidates who were
available to work at Fiat, but needed to move from other areas of Italy
in order to accept the jobs. “Iride” provided the candidates with grants
and other assistance, including temporary accommodations,
to ease their transition to their new residence.

store clerk

power
spain
In Barcelona, Manpower Spain is finding new ways to fill
sales clerk positions for Zara boutiques, one of the companies owned
by Inditex, the third largest textile company in the world. Our talented
recruiters target places that are frequented by young, fashionable people –
universities, resorts, amusement parks, sports clubs, etc. This successful
program is expanding to the other stores of Inditex in 2001, including
Pull & Bear, Bershka, Stradivarius and Massimo Dutti

accountant

power
norway
In 2000, Manpower Norway formed a joint venture company with
one of its top customers, Norsk Hydro, to provide a more consistent
approach to Hydro’s workforce of temporary employees. Quality People
is 50.1% owned by Manpower and 49.9% owned by Hydro, and we
jointly share the responsibility for managing Hydro’s workforce
of temporary employees. The joint venture provides a single
resource for the 1,000 employees that work for Hydro every day,
including office workers, engineers, accountants
and IT consultants.

systems analyst

power
philippines
Systems Integration Solutions (SIS), a rapidly growing
US-based IT consulting services company, relies on Manpower to
recruit highly skilled IT experts for its operations in the Philippines.
By outsourcing the recruitment of permanent employees to
Manpower Philippines, SIS is able to focus more of its employees
on client service and other core business functions.

teacher

netherlands
A few short years ago, the Ministry of Education in the Netherlands
turned to Manpower for a solution to the substantial shortage of school
teachers. To solve this problem, Manpower has recruited and retrained
more than 3,500 former teachers, as well as people from other careers,
to fill the teaching vacancies – and this work continues today. As a result,
Manpower has become the market leader in staffing services for the
elementary and secondary education system in the Netherlands,
providing career development, relocation and outplacement services,
as well as mobility plans and substitute teacher pools.
power

merchandiser

power
uruguay
Manpower Uruguay manages a workforce of more than 400 people
for Supermarket Devoto, part of the Geant – Excel Group,
during the summer months in the cities of Punta del Este and Piriapolis.
The employees required for this customer include warehouse workers,
customer service representatives, accounting clerks and merchandisers
who present products and promotions to customers at the stores.

With more than 2.7 million skilled, talented people in 59 countries worldwide,
we deliver top-caliber staffing solutions to more than 400,000 customers
around the globe.

manpower

Manpower Inc. 57
Dear Shareholder,The people of Manpower throughout the world marked an impressiveperformance in all categories in 2000. We entered the year withambitious plans to advance Manpower’s profitability, visibility, anddurability, and our efforts are being rewarded.
In 2000, Manpower achieved new records. Systemwidesales reached $12.4 billion, which is an organic growth rate of 15% inconstant currency, but most importantly operating margins rose torecord levels totaling $311 million, up 34.8% from 1999. This resultedin earnings per diluted share of $2.22, a 16% increase. Additionally,good progress was made on working capital with free cash flow of$130 million.
These results are good to report, but much moreremains to be done. Changing markets, new economic uncertainty,increasingly complex customer needs, and the continual worldwidetightening of the labor market – these and many other factors continueto affect our company. We view many of these market forces as realopportunities for Manpower.
CEO Letter

58 Manpower Inc.
The condition of the labor market is an important issueon everyone’s mind — from corporate executives to employees – andthis is true in all geographies. This concern has served to increaseour visibility on many fronts. As a result, over 400,000 customersand 2.7 million employees have found that Manpower is the answer.The responsibility to resolve the challenges of the workforce, fromboth the employer and employee perspectives, is one that weassume with pride and passion. We know that we owe our success tothe power of people and our ability to match a person’s skills withour customer’s job requirements to ensure these working relation-ships are successful for everyone involved.
Our efforts in the year 2000 were concentrated onexpanding the key assets of the company. We continued to grow ournetwork of offices to nearly 3,700 in 2000 with more than 285 newoffices, which has strengthened our position in some of the fastestgrowing markets throughout the world. Countries like Sweden, Italyand Japan all added offices and continue to show positive signs ofhandsome returns to our shareholders. France contributed to share-holder value in extraordinary terms by increasing gross margins andimproving operating profits by $30 million – or 49% in local currency.

Manpower Inc. 59
We also continued to expand our wide array of servicesto our customers. We have recognized for several years that ourcustomers need more help in the area of specialty and professionalstaffing services. Accordingly, we have invested in developing ourspecialty staffing resources, which now account for nearly 20% ofour total business. Manpower Professional in the U.S. grew at 12%,which substantially exceeded industry growth, and we are poisedto do even better in 2001. Additionally, we have begun to expand ourIT staffing capabilities across continental Europe under the Elanbrand. Elan Group Ltd., our European IT staffing subsidiary, has beenfully integrated since we acquired it in January 2000. By combiningManpower’s IT staffing services with Elan’s capabilities, we nowoffer the premier service capabilities in the U.K. market.
Globally, we launched The Empower Group in 2000. Wedeveloped this independent operating unit through a combination ofacquisitions, alliances, and internal capabilities, to provide humanresource consulting services to our major customers. Headquarteredin London, The Empower Group is strategically important for ourcustomer base, as they rely on us to supply a higher level of expertiseto help them overcome the challenges of the tight labor market and

60 Manpower Inc.
navigate the constantly changing dynamics of their organizationalstructures. The Empower Group currently has offices across theAmericas, Europe and Asia/Pacific, and we plan to expand its sizeand number of locations throughout 2001.
Technology plays a key role in business today, and itwill continue to be a critical business issue as we move into thefuture. At Manpower, our commitment to technology remainsstrong, as we believe that the Internet is revolutionizing the staffingindustry and offers tremendous opportunities to strengthen ourrelationships with our customers and our temporary employees.E-commerce may appear to have settled down because of the coolingof the “dot-coms,” but it is no less important than it was a year ago.The difference now is that results must accompany the vision, andthat is the standard to which we are holding ourselves. Our view ofe-commerce is that it is a powerful and effective means to conductbusiness with our customers, and we have made great progressconnecting our customers to us via the Internet. In fact, nearly $300million worth of staffing business is conducted annually through ourInternet offering on a global basis.

Manpower Inc. 61
Additionally, we have used our global resources todiscover and develop new and better ways of attracting people toManpower so that we can assign employees to job assignments moreaccurately and efficiently than ever before. This has been achieved, inpart, by delivering a wealth of free training to our employees over theInternet, and offering our people challenging assignments working atsome of the most exciting companies throughout the world.
These accomplishments throughout the year 2000have added to the diversity of Manpower’s offerings and earnings.Our expansion in offices, our expansion in services, and our expansionin our customer base will add to the durability of our earnings as weenter into potentially unpredictable economies. The rapid rate ofeconomic growth that we have experienced in the U.S. and manymarkets worldwide in the past year is expected to slow markedly in2001. We began, in fact, to feel the effects of the slowdown in thefourth quarter of 2000. While the extent and impact of the slowingeconomy remains to be seen, we believe our geographic spread andwide range of services can reduce our exposure to these changesover the next year.

62 Manpower Inc.
We have accomplished a tremendous amount over thepast year. We have improved the ways in which we operate; leveragingthe strength of our global brand, our worldwide network, and ourcombined expertise and knowledge more effectively than everbefore. When you look at our financial results, our range of services,our quality, and our ability to respond to customers’ increasinglycomplex requests, it is clear to see how far we have come. Thisprogress is a credit to the hard work and diligence of the Manpowerpeople around the world – and I thank them for their efforts.
We had a good year in 2000, but we have only startedto demonstrate what this company is capable of achieving. All ofus at Manpower are focused on the power of people to make 2001even better.
Cordially,
Jeffrey A. Joerres President and CEO March 1, 2001

Manpower Inc. 63
Financial Highlights
(a) Represents total sales of Company-owned branches and franchises. (b) Represents Operating profit excluding nonrecurring items in 1999 and 1998.
96 97 98 99 00
96 97 98 99 00
96 97 98 99 00
Systemwide Sales (a) (in millions of U.S. Dollars)
12,500
10,000
7,500
5,000
2,500
Revenues (in millions of U.S. Dollars)
12,000
10,000
8,000
6,000
4,000
2,000
Operating Margin(b) (in millions of U.S. Dollars)
350300250200150100
50

65 Management’s Discussion and Analysis
74 Report of Independent Public Accountants
75 Consolidated Statements of Operations
75 Supplemental Systemwide Information (Unaudited)
76 Consolidated Balance Sheets
78 Consolidated Statements of Cash Flows
Consolidated Statements of Shareholders’ Equity 79
Notes to Consolidated Financial Statements 80
Quarterly Data (Unaudited) 95
Selected Financial Data 96
Corporate Information 97
Principal Operating Units 98
Table of Contents

Manpower Inc. 65
Management’s Discussion and Analysisof Financial Condition and Results of Operations
Nature of Operations
Manpower Inc. (the “Company”) is a global staffing
leader delivering high-value staffing and workforce
management solutions worldwide. Through a system-
wide network of nearly 3,700 offices in 59 countries,
the Company provides a wide range of human resource
services including professional, technical, specialized,
office and industrial staffing; temporary and permanent
employee testing, selection, training and develop-
ment; and organizational-performance consulting.
The staffing industry is large and fragmented,
comprised of thousands of firms employing millions of
people and generating billions in annual revenues. It is
also a highly competitive industry, reflecting several
trends in the global marketplace, notably increasing
demand for skilled people and consolidation among
customers and in the industry itself.
The Company attempts to manage these
trends by leveraging established strengths, including
one of the staffing industry’s best-recognized brands;
geographic diversification; size and service scope; an
innovative product mix; and a strong customer base.
While staffing is an important aspect of our business,
our strategy is focused on providing both the skilled
employees our customers need and high-value work-
force management solutions.
Systemwide information referred to through-
out this discussion includes both Company-owned
branches and franchises. The Company generates
revenues from sales of services by its own branch
operations and from fees earned on sales of services by
its franchise operations. (See Note 1 to the Consolidated
Financial Statements for further information.)
Results of Operations – Years Ended December 31, 2000,
1999 and 1998
CONSOLIDATED RESULTS – 2000 COMPARED TO 1999 Systemwide
sales increased 8.1% to $12.4 billion in 2000 from $11.5
billion in 1999.
Revenues from services increased 11.0%.
Revenues were unfavorably impacted during the year
by changes in currency exchange rates, as the U.S. Dollar
strengthened relative to the functional currencies of
the Company’s European subsidiaries. At constant
exchange rates, the increase in revenues would have
been 20.8%. The increase in revenue includes the impact
of acquisitions made during 2000. Organic constant
currency revenue growth was approximately 19%.
Operating profit increased 34.8% during
2000. Excluding the impact of the $28.0 million of non-
recurring items recorded in 1999, related to employee
severances, retirement costs and other associated
realignment costs, Operating profit increased 20.2%.
As a percentage of revenues, Operating profit, excluding
the non-recurring items, increased 30 basis points
(.3%) to 2.9% in 2000.
Gross profit increased 14.2% during 2000,
reflecting both the increase in revenues and an improve-
ment in the gross profit margin. The gross profit
margin improved to 18.0% in 2000 from 17.5% in 1999
due primarily to the enhanced pricing in France and the
Company’s continued focus on higher-margin business.
Selling and administrative expenses increased
10.9% during 2000. Excluding the impact of the
nonrecurring items recorded in 1999, Selling and
administrative expenses increased 13.1%. As a percent
of Gross profit, excluding nonrecurring items, these
expenses were 84.0% in 2000 and 84.8% in 1999. This
improvement was achieved despite the increased
administrative costs in France resulting from the 35
hour work week instituted during 2000 and the invest-
ments in Manpower Professional in the U.S. and new
markets worldwide. The Company opened more than
285 offices during 2000, with the majority being
opened throughout mainland Europe.
Interest and other expenses increased $21.0
million during 2000 due primarily to higher net interest
expense levels. Net interest expense was $27.7 million
in 2000 compared to $9.3 million in 1999. This increased
expense is due to higher borrowing levels required
to finance the Company’s acquisitions, the share
repurchase program and the ongoing investments in
its global office network.
Systemwide Offices
United States 1,155
France 927
United Kingdom 292
Other Europe 926
Other Countries 385
66 Manpower Inc.
Management ’s Discussion and Analysis (continued)
of Financial Condition and Results of Operations
The Company provided for income taxes at a
rate of 35.4% in 2000 compared to 27.1% in 1999. The
increase in the rate primarily reflects the impact of the
1999 nonrecurring items, including a one-time tax
benefit of $15.7 million related to the Company’s
dissolution of a non-operating subsidiary. Without
these nonrecurring items, the 1999 tax rate would
have been 35.5%. The 2000 rate is different than the
U.S. Federal statutory rate due to foreign repatriations,
foreign tax rate differences, state income taxes and
net operating loss carryforwards which had been fully
reserved for in prior years.
Net earnings per share, on a diluted basis,
increased 16.2% to $2.22 in 2000 compared to $1.91 in
1999. Excluding the nonrecurring items recorded in
1999, diluted earnings per share was $1.92. The 2000
earnings per share, on a diluted basis, was negatively
impacted by the lower currency exchange rates during the
year. At constant exchange rates, 2000 diluted earnings
per share would have been $2.52, an increase of 31.9%
over 1999. The weighted average shares outstanding
decreased 2.0% for the year due to the Company’s
treasury stock purchases. On an undiluted basis, net
earnings per share was $2.26 in 2000, which compares
to $1.95 in 1999, excluding the nonrecurring items.
CONSOLIDATED RESULTS – 1999 COMPARED TO 1998 Systemwide
sales were $11.5 billion during 1999, increasing 9.4%
over the 1998 level of $10.5 billion.
Revenues from services increased 10.8%.
Revenues were unfavorably impacted during the year
by changes in currency exchange rates, as the U.S.
Dollar strengthened relative to the currencies in most
of the Company’s non-U.S. markets. At constant
exchange rates, the increase in revenues would have
been 13.2%.
Operating profit increased 76.9% during 1999.
Excluding the impact of the $28.0 million of non-
recurring items recorded in 1999, and the $92.1 million
write-down of capitalized software in 1998, Operating
profit increased 16.3%. As a percentage of revenues,
Operating profit increased to 2.6% in 1999 from 2.5%
in 1998.
Gross profit increased 13.4% during 1999,
reflecting both the increase in revenues and an
improvement in the gross profit margin. The gross
profit margin improved to 17.5% in 1999 from 17.1% in
1998 due primarily to the enhanced pricing of our
business in France.
Selling and administrative expenses increased
15.1% during 1999. Excluding the impact of the nonre-
curring items recorded in 1999, Selling and administrative
expenses increased 12.9%. As a percent of Gross profit,
these expenses were 84.8% in 1999 and 85.2% in 1998,
excluding nonrecurring items. This improvement was
achieved despite an increase in France’s business tax
(taxe professionnelle) and the continued investment in
new or expanding markets. On a worldwide basis, the
Company opened more than 200 new offices during
1999, with the majority being opened throughout
mainland Europe.
Interest and other expense increased $8.2
million during 1999 primarily due to the higher bor-
rowing levels required to finance the Company’s share
repurchase program and the ongoing investments in
its global office network.
The Company provided for income taxes at a
rate of 27.1% in 1999 compared to 33.5% in 1998. The
decrease in the rate primarily reflects the nonrecurring
items, including a one-time tax benefit of $15.7 million
in 1999. Without these nonrecurring items, the tax rate
would have been 35.5%, which is different than the U.S.
Federal statutory rate due to foreign repatriations,
foreign tax rate differences and net operating loss
carryforwards which had been fully reserved for in
prior years.
Net earnings per share, on a fully diluted
basis, was $1.91 in 1999 compared to $.93 in 1998.
Excluding the nonrecurring items recorded in 1999
and the write-down of capitalized software in 1998,
diluted earnings per share was $1.92 in 1999 compared
to $1.64 in 1998. The 1999 earnings were negatively
impacted $.05 per share due to the lower currency
exchange rates during the year. The weighted average
shares outstanding decreased 3.0% due to the Company’s
treasury stock purchases. On an undiluted basis, net
earnings per share was $1.94 in 1999 ($1.95 excluding the
nonrecurring items) and $.94 in 1998 ($1.66 excluding
the write-down of capitalized software).

Manpower Inc. 67
SEGMENT RESULTS The Company is organized and man-
aged on a geographical basis. Each country has its
own distinct operations, is managed locally by its own
management team and maintains its own financial
reports. Each country reports directly, or indirectly
through a regional manager, to a member of executive
management. Given this reporting structure, all of the
Company’s operations have been segregated into the
following segments – the United States, France, the
United Kingdom, Other Europe and Other Countries.
(See Note 14 to the Consolidated Financial Statements
for further information.)
United States – Systemwide sales in the United States
reached a new record high, exceeding $3.8 billion.
Revenues also reached a new high, increasing 7% to
$2.4 billion. While year-over-year revenue growth
rates were generally stable for the first nine months of
the year, the U.S. experienced slower growth rates in the
fourth quarter as a result of the slowing U.S. economy.
Manpower Professional was the fastest
growing sector within the U.S. with revenues increasing
12% during the year. Expansion of higher-value
service through the Manpower Professional brand was
a primary objective of the U.S. organization.
Operating profit increased 5% to $84.6 million,
while the operating margin declined slightly to 3.5%
from 3.6% in 1999. During the year, the U.S. organization
implemented a number of productivity initiatives, the
savings of which were offset by additional invest-
ments in Manpower Professional.
The company acquired three U.S. franchises
during the year, adding approximately $50 million of
revenue. The impact of these acquisitions on Operating
profit was negligible.
France – Revenues in France grew 20% in local currency
to FFR 28.0 billion ($3.9 billion). This strong organic
growth rate, which slightly exceeded the staffing
industry’s market rate of growth, was fueled by the
strong French economy.
More importantly, our French organization
was able to achieve this strong revenue gain while
improving operating margins. Operating profit
increased 49% in local currency in 2000, following a
39% improvement in 1999. Operating profit margins
improved to 3.3% in 2000, representing the second
consecutive year with a 60 basis point improvement.
These improvements are primarily the result of
enhanced pricing initiatives.
United Kingdom – In January 2000, the Company
acquired Elan Group Limited (‘Elan’), a European
specialty IT staffing company with significant opera-
tions in the U.K. (See Note 11 to the Consolidated
Financial Statements for further information.) All of the
Company’s IT business in the U.K. has been integrated
into Elan, strengthening our position as the leading
IT staffing provider in the U.K. The Company expects
that this integration will provide a strong platform
for the rapid expansion of its IT staffing business
throughout mainland Europe.
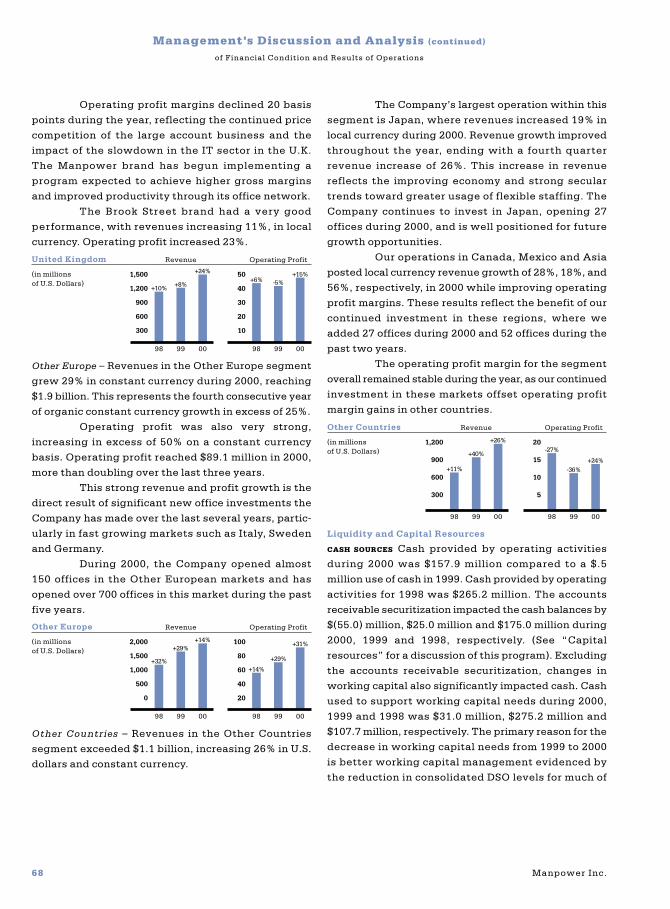
Revenues in the U.K. grew 33%, in local
currency, reaching $1.5 billion for the year 2000. This
growth includes the impact of the Elan acquisition.
Revenue Operating Profit
98
+34% +4% +4%
-16%
+31%
+29%
99 00 98 99 00
France
(in millions of U.S. Dollars)
4,000
3,200
2,400
1,600
800
14012010080604020
Systemwide Sales Operating Profit
98
+7% +5% +2%
-16% +3% +5%
99 00 98 99 00
United States
(in millions of U.S. Dollars)
4,000
3,200
2,400
1,600
800
100
80
60
40
20
Systemwide Sales
(in millions of U.S. Dollars)
United States 3,814.9
France 3,939.2
United Kingdom 1,453.1
Other Europe 2,051.4
Other Countries 1,186.3
68 Manpower Inc.
Management ’s Discussion and Analysis (continued)
of Financial Condition and Results of Operations
Operating profit margins declined 20 basis
points during the year, reflecting the continued price
competition of the large account business and the
impact of the slowdown in the IT sector in the U.K.
The Manpower brand has begun implementing a
program expected to achieve higher gross margins
and improved productivity through its office network.
The Brook Street brand had a very good
performance, with revenues increasing 11%, in local
currency. Operating profit increased 23%.
Other Europe – Revenues in the Other Europe segment
grew 29% in constant currency during 2000, reaching
$1.9 billion. This represents the fourth consecutive year
of organic constant currency growth in excess of 25%.
Operating profit was also very strong,
increasing in excess of 50% on a constant currency
basis. Operating profit reached $89.1 million in 2000,
more than doubling over the last three years.
This strong revenue and profit growth is the
direct result of significant new office investments the
Company has made over the last several years, partic-
ularly in fast growing markets such as Italy, Sweden
and Germany.
During 2000, the Company opened almost
150 offices in the Other European markets and has
opened over 700 offices in this market during the past
five years.
Other Countries – Revenues in the Other Countries
segment exceeded $1.1 billion, increasing 26% in U.S.
dollars and constant currency.
The Company’s largest operation within this
segment is Japan, where revenues increased 19% in
local currency during 2000. Revenue growth improved
throughout the year, ending with a fourth quarter
revenue increase of 26%. This increase in revenue
reflects the improving economy and strong secular
trends toward greater usage of flexible staffing. The
Company continues to invest in Japan, opening 27
offices during 2000, and is well positioned for future
growth opportunities.
Our operations in Canada, Mexico and Asia
posted local currency revenue growth of 28%, 18%, and
56%, respectively, in 2000 while improving operating
profit margins. These results reflect the benefit of our
continued investment in these regions, where we
added 27 offices during 2000 and 52 offices during the
past two years.
The operating profit margin for the segment
overall remained stable during the year, as our continued
investment in these markets offset operating profit
margin gains in other countries.
Liquidity and Capital Resources
CASH SOURCES Cash provided by operating activities
during 2000 was $157.9 million compared to a $.5
million use of cash in 1999. Cash provided by operating
activities for 1998 was $265.2 million. The accounts
receivable securitization impacted the cash balances by
$(55.0) million, $25.0 million and $175.0 million during
2000, 1999 and 1998, respectively. (See “Capital
resources” for a discussion of this program). Excluding
the accounts receivable securitization, changes in
working capital also significantly impacted cash. Cash
used to support working capital needs during 2000,
1999 and 1998 was $31.0 million, $275.2 million and
$107.7 million, respectively. The primary reason for the
decrease in working capital needs from 1999 to 2000
is better working capital management evidenced by
the reduction in consolidated DSO levels for much of
Revenue Operating Profit
98
+11%
+40%
+26%
-27%
-36%+24%
99 00 98 99 00
Other Countries
(in millions of U.S. Dollars)
1,200
900
600
300
20
15
10
5
Revenue Operating Profit
98
+32%
+29%+14%
+14%
+29%
+31%
99 00 98 99 00
Other Europe
(in millions of U.S. Dollars)
2,000
1,500
1,000
500
0
100
80
60
40
20
Revenue Operating Profit
98
+10% +8%
+24%+6% -5%
+15%
99 00 98 99 00
United Kingdom
(in millions of U.S. Dollars)
1,500
1,200
900
600
300
50
40
30
20
10
Manpower Inc. 69
2000. The increase in working capital needs from 1998
to 1999 was due to the revenue growth in France and
Italy, as it is normal in these markets to have a DSO
in excess of 70 days. Cash provided by operating
activities before working capital changes was $243.9
million, $249.7 million and $197.9 million during 2000,
1999, and 1998, respectively.
Accounts receivable increased to $2,094.4
million at December 31, 2000 from $1,897.6 million at
December 31, 1999. This change is due to the increased
sales levels in all of the Company’s major markets and
a $55.0 million reduction in the amount of accounts
receivable sold under the Company’s securitization
agreement. At constant exchange rates, the receiv-
ables balance would have been $145.0 million higher.
Net cash provided by borrowings was $71.8
million and $246.6 million in 2000 and 1999, respec-
tively. Borrowings in 2000 and 1999 were used for
acquisitions, investments in new markets, capital
expenditures and repurchases of the Company’s
common stock. In 1999, borrowings were also used
to fund working capital growth.
CASH USES Capital expenditures were $82.6 million,
$74.7 million and $140.8 million during 2000, 1999 and
1998, respectively. These expenditures are primarily
comprised of purchases of computer equipment, office
furniture and other costs related to office openings
and refurbishments, as well as capitalized software
costs of $6.9 million, $3.0 million and $40.1 million in
2000, 1999 and 1998, respectively.
In January 2000, the Company acquired Elan
and as of December 31, 2000, the total consideration
paid for Elan was approximately $116.2 million. In
addition, there is approximately $30.0 million in
deferred consideration expected to be paid during
March 2001.
From time to time, the Company acquires
and invests in companies throughout the world. The
total consideration paid for such transactions, excluding
the acquisition of Elan in 2000, was $60.2 million,
$18.8 million and $32.5 million in 2000, 1999 and
1998, respectively.
The Board of Directors has authorized the
repurchase of 15 million shares under the Company’s
share repurchase program. Share repurchases may be
made from time to time and may be implemented
through a variety of methods, including open market
purchases, block transactions, privately negotiated
transactions, accelerated share repurchase programs,
forward repurchase agreements or similar facilities. At
December 31, 2000, 8.9 million shares at a cost of $249.8
million have been repurchased under the program,
$20.0 million of which were repurchased during 2000.
During September 2000, the Company entered
into a forward repurchase agreement to purchase
shares of its common stock under its share repurchase
program. Under the agreement, the Company will,
from time to time over the next two years, repurchase
a total of one million shares at a forward price of
$31.70, which approximates the market price at the
inception of the agreement, plus a financing charge.
The Company may choose the method by which it
settles the agreement (i.e., cash or shares). As of
December 31, 2000, no shares have been purchased
under this agreement.
The Company paid dividends of $15.1 mil-
lion, $15.3 million and $15.2 million in 2000, 1999 and
1998, respectively.
Cash and cash equivalents decreased by
$60.0 million in 2000 compared to increases of $61.2
million and $38.2 million in 1999 and 1998, respectively.
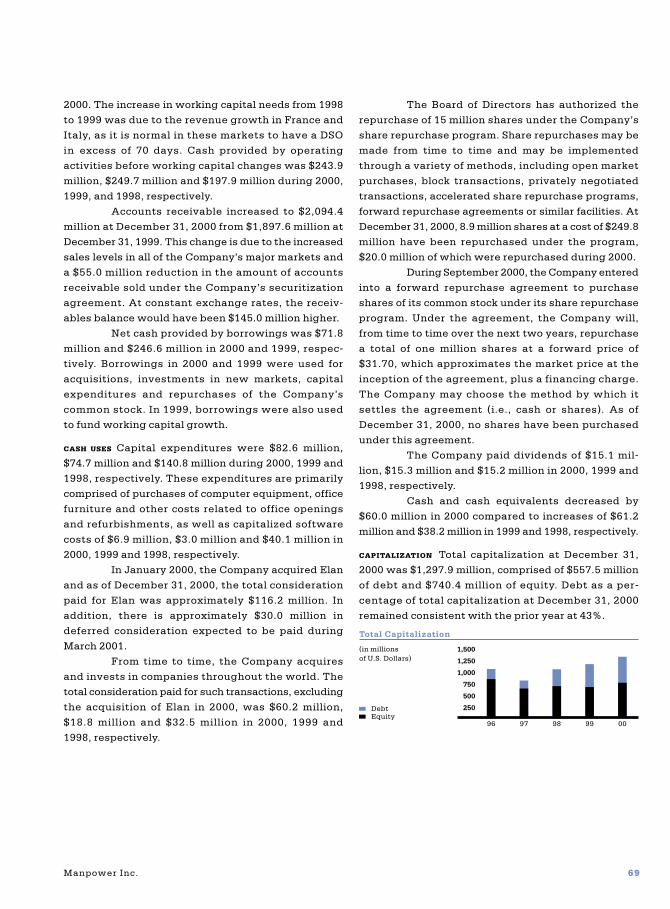
CAPITALIZATION Total capitalization at December 31,
2000 was $1,297.9 million, comprised of $557.5 million
of debt and $740.4 million of equity. Debt as a per-
centage of total capitalization at December 31, 2000
remained consistent with the prior year at 43%.
96 97 98 99 00
Total Capitalization
(in millions of U.S. Dollars)
DebtEquity
1,500
1,250
1,000
750
500
250

70 Manpower Inc.
Management ’s Discussion and Analysis (continued)
of Financial Condition and Results of Operations
CAPITAL RESOURCES In March 2000, the Company issued
€150.0 million in unsecured notes due March 2005. Net
proceeds of $143.1 million from the issuance were
used to repay amounts under the Company’s unsecured
revolving credit agreement.
In July 1999, the Company issued €200.0
million in unsecured notes due July 2006. Net proceeds
of $200.9 million from the issuance of these notes
were used to repay amounts under the Company’s
unsecured revolving credit agreement and commercial
paper program.
The Company has a $415.0 million unsecured
revolving credit agreement that allows for borrowings
in various currencies and includes a $90.0 million
commitment to be used exclusively for standby letters
of credit. Borrowings of $138.4 million and letters of
credit of $62.1 million were outstanding under the
facility at December 31, 2000. The facility matures in
November 2002 and may be increased to a maximum
of $500.0 million or extended for an additional year
with the lenders’ consent. The agreement requires,
among other things, that the Company comply with an
interest coverage ratio of not less than 3.0 to 1, a debt-to-
capitalization ratio of less than .60 to 1 and a maximum
subsidiary debt level of $50.0 million. As defined by
the agreement, the Company had an interest coverage
ratio, debt-to-capitalization ratio and a subsidiary debt
level of 10.6 to 1, .50 to 1 and $21.6 million, respectively,
as of December 31, 2000.
The Company also has a $300.0 million unse-
cured revolving credit agreement. The facility was
extended in November 2000 to expire in November 2001,
and may be extended for an additional year with the
lenders’ consent. This agreement has similar restrictive
covenants to the Company’s $415.0 million revolving
credit agreement. As of December 31, 2000, the Company
had no borrowings under this agreement.
Borrowings of $4.6 million were outstanding
under the Company’s $75.0 million U.S. commercial
paper program. Commercial paper borrowings, which
are backed by the $415.0 million unsecured revolving
credit agreement, have been classified as long-term
debt due to the availability to refinance them on a
long-term basis under the revolving credit facility.
In addition to the above, the Company and
some of its foreign subsidiaries maintain separate
lines of credit with local financial institutions to meet
working capital needs. As of December 31, 2000, such
lines totaled $205.1 million, of which $144.4 million
was unused.
A wholly-owned U.S. subsidiary of the Com-
pany has an agreement to sell, on an ongoing basis, up to
$200.0 million of an undivided interest in its accounts
receivable. The amount of receivables sold under this
agreement totaled $145.0 million at December 31,
2000. Unless extended by amendment, the agreement
expires in December 2001. (See Note 4 to the Consoli-
dated Financial Statements for further information.)
The Company’s principal ongoing cash needs
are to finance working capital, capital expenditures,
acquisitions and the share repurchase program.
Working capital is primarily in the form of trade
receivables, which increase as revenues increase. The
amount of financing necessary to support revenue
growth depends on receivable turnover, which differs
in each market in which the Company operates.
The Company believes that its internally
generated funds and its existing credit facilities are
sufficient to cover its near-term projected cash needs.
With continued revenue increases or additional acqui-
sitions or share repurchases, additional borrowings
under the existing facilities would be necessary to
finance the Company’s cash needs.
Significant Matters Affecting Results of Operations
MARKET RISKS The Company is exposed to the impact of
foreign currency fluctuations and interest rate changes.
EXCHANGE RATES The Company’s exposure to exchange
rates relates primarily to its foreign subsidiaries and
its Euro and Yen denominated borrowings. For its
foreign subsidiaries, exchange rates impact the U.S.
Dollar value of their reported earnings, the Company’s
investments in the subsidiaries and the intercompany
transactions with the subsidiaries.
Approximately 75% and 80% of the Company’s
revenues and operating profits, respectively, are gen-
erated outside of the United States, the majority of
which are in Europe. As a result, fluctuations in the
value of foreign currencies against the dollar may have
a significant impact on the reported results of the
Company. Revenues and expenses denominated in
foreign currencies are translated into United States
dollars at the weighted average exchange rate for
the year. Consequently, as the value of the dollar

Manpower Inc. 71
strengthens relative to other currencies in the
Company’s major markets, as it did in the European
markets during 2000, the resulting translated revenues,
expenses and operating profits are lower. Using constant
exchange rates, 2000 revenues and operating profits
would have been approximately 9% and 12% higher
than reported, respectively.
Fluctuations in currency exchange rates
also impact the U.S. Dollar amount of shareholders’
equity of the Company. The assets and liabilities of the
Company’s non-U.S. subsidiaries are translated into
United States dollars at the exchange rates in effect at
year-end. The resulting translation adjustments are
recorded in Shareholders’ equity as Accumulated other
comprehensive income (loss). The dollar was stronger
relative to many of the foreign currencies at December
31, 2000 compared to December 31, 1999. Consequently,
the Accumulated other comprehensive income (loss)
component of Shareholders’ equity decreased $50.6
million during the year. Using the year-end exchange
rates, the total amount permanently invested in non-
U.S. subsidiaries at December 31, 2000 is approximately
$1.9 billion.
As of December 31, 2000 the Company had
$467.4 million of long-term borrowings denominated
in Euro ($412.7 million) and Yen ($54.7 million). These
borrowings provide a hedge of the Company’s net
investment in subsidiaries with the related functional
currencies. Since the Company’s net investment in
these subsidiaries exceeds the respective amount of
the borrowings, all translation gains or losses related
to these borrowings are included as a component of
Accumulated other comprehensive income (loss). The
Accumulated other comprehensive income (loss)
component of Shareholders’ equity increased $15.0
million during the year due to the currency impact on
these borrowings.
Although currency fluctuations impact the
Company’s reported results and Shareholders’ equity,
such fluctuations generally do not affect the Company’s
cash flow or result in actual economic gains or losses.
Substantially all of the Company’s subsidiaries derive
revenues and incur expenses within a single country
and consequently, do not generally incur currency
risks in connection with the conduct of their normal
business operations. The Company generally has few
cross border transfers of funds, except for transfers to the
United States to fund the expense of the Company’s
international headquarters and working capital loans
made from the United States to the Company’s foreign
subsidiaries. To reduce the currency risk related to the
loans, the Company may borrow funds under the
Revolving Credit Agreement in the foreign currency
to lend to the subsidiary, or alternatively, may enter
into a forward contract to hedge the loan. Foreign
exchange gains and losses recognized on any trans-
actions are included in the Consolidated Statements of
Operations and historically have been immaterial. The
Company generally does not engage in hedging
activities, except as discussed above. As of December
31, 2000, the only derivative instruments held by the
Company were foreign currency exchange contracts
and interest rate swap agreements.
The Company holds a 49% interest in its
Swiss franchise, which holds an investment portfolio
of approximately $67.9 million as of December 31,
2000. This portfolio is invested in a wide diversity of
European and U.S. debt and equity securities as well
as various professionally managed funds. To the
extent that there are realized gains or losses related to
this portfolio, the Company’s ownership share is
included in its Consolidated Statements of Operations.
INTEREST RATES The Company’s exposure to market risk
for changes in interest rates relates primarily to the
Company’s long-term debt obligations. The Company
has historically managed interest rates through the use
of a combination of fixed and variable rate borrowings
and interest rate swap agreements. Excluding the
impact of the swap agreements, the Company has
$203.7 million in variable rate borrowings at a weighted
average interest rate of 4.69% and $353.8 million in
fixed rate borrowings at a weighted average interest
rate of 5.95% as of December 31, 2000.
In June 2000, the Company entered into
various interest rate swap agreements in order to fix
its interest costs on a portion of its Euro and Yen
denominated variable rate borrowings. The Euro
interest rate swap agreements have a notional value of
€100.0 million ($94.0 million) and expire in 2010. The
Yen interest rate swap agreement has a notional value
of ¥4,000.0 million ($35.0 million) and expires in 2003.
The Company also had an interest rate swap agreement
that expired in January 2001, which throughout 2000
fixed the interest rate at 6.0% on $50.0 million of the
Company’s U.S. dollar-based borrowings. At December
31, 2000, including the impact of the interest rate
swap agreements, the Company effectively had $74.7

72 Manpower Inc.
Management ’s Discussion and Analysis (continued)
of Financial Condition and Results of Operations
million and $482.8 million in variable and fixed rate
borrowings, respectively, at a weighted average interest
rate of 5.18% and 5.65%, respectively. The fair value of
these agreements and the impact on the interest
expense recorded during 2000 was not material.
A 52 basis point (.52%) move in interest rates
on the Company’s variable rate borrowings (10% of
the weighted average variable interest rate, including
the impact of the swap agreements) would have an
immaterial impact on the Company’s earnings before
income taxes and cash flows in each of the next five
years. In addition, a 52 basis point move in interest
rates would have an immaterial impact on the fair
value, interest expense and cash flows related to the
Company’s interest rate swap agreements.
IMPACT OF ECONOMIC CONDITIONS Because one of the
principal attractions of using temporary staffing
solutions is to maintain a flexible supply of labor to
meet changing economic conditions, the industry has
been and remains sensitive to economic cycles. To
help counter the effects of these economic cycles, the
Company continues to provide a wide range of human
resource services including professional, technical,
specialized, office and industrial staffing; temporary
and permanent employee testing, selection, training,
and development; organizational-development con-
sulting; strategic outsourcing; major-project planning,
staffing and management; and human resource informa-
tion management. While the Company believes that
the breadth of its operations and the diversity of its
service mix cushions it against the impact of an
adverse economic cycle in any single country or industry,
adverse economic conditions in any of its three largest
markets would likely have a material impact on the
Company’s consolidated operating results.
THE EURO Twelve of the fifteen member countries of the
European Union (the “participating countries”) have
established fixed conversion rates between their
existing sovereign currencies (the “legacy currencies”)
and the Euro and have agreed to adopt the Euro as
their common legal currency. The legacy currencies
will remain legal tender in the participating countries
as denominations of the Euro between January 1, 1999
and January 1, 2002 (the “transition period”). During
the transition period, public and private parties may
pay for goods and services using either the Euro or the
participating country’s legacy currency. Beginning on
January 1, 2002, Euro-denominated bills and coins will
be issued and legacy currencies will be withdrawn
from circulation.
The Company has significant operations in
many of the participating countries and continues to
assess the impact of the Euro on its business opera-
tions. Since the Company’s labor costs and prices are
generally determined on a local basis, the near-term
impact of the Euro has been and is expected to be
primarily related to making internal information
systems modifications to meet customer invoicing and
financial reporting requirements. Such modifications
relate to converting currency values and to operating
in a dual currency environment during the transition
period. Modifications of internal information systems
will occur throughout the transition period and will
be coordinated with other system-related upgrades
and enhancements.
On a long-term basis, the Company believes
that the introduction of the Euro may cause a greater
level of price harmonization between participating coun-
tries, notwithstanding certain country-specific costs.
The Company will account for all related sys-
tem modification costs in accordance with its existing
policy and does not expect such costs to be material to
the Company’s Consolidated Financial Statements.
LEGAL REGULATIONS AND UNION RELATIONSHIPS The temporary
employment services industry is closely regulated
in all of the major markets in which the Company
operates except the United States and Canada. In
addition to licensing or registration requirements,
many countries impose substantive restrictions on
temporary employment services, either on the tempo-
rary staffing company or the ultimate client company.
They may restrict the length of temporary assign-
ments, the type of work permitted for temporary workers
or the occasions on which temporary workers may
be used. Changes in applicable laws or regulations
have occurred in the past and are expected in the
future to affect the extent to which temporary employ-
ment services firms may operate. These changes could
impose additional costs or taxes, additional record
keeping or reporting requirements; restrict the tasks

Manpower Inc. 73
to which temporaries may be assigned; limit the dura-
tion of or otherwise impose restrictions on the nature
of the temporary relationship (with the Company or the
customer) or otherwise adversely affect the industry.
In many markets, the existence or absence of
collective bargaining agreements with labor organi-
zations has a significant impact on the Company’s
operations and the ability of customers to utilize the
Company’s services. In some markets, labor agree-
ments are structured on a national or industry-wide
(rather than a company) basis. Changes in these
collective labor agreements have occurred in the past
and are expected in the future and may have a material
impact on the operations of temporary staffing firms,
including the Company.
FORWARD-LOOKING STATEMENTS Certain information included
or incorporated by reference in this filing and identified
by use of the words “expects,” “believes,” “plans” or the
like constitutes forward-looking statements, as such
term is defined in Section 27A of the Securities Act of
1933 and Section 21E of the Securities Exchange Act
of 1934. In addition, any information included or incor-
porated by reference in future filings by the Company
with the Securities and Exchange Commission, as well
as information contained in written material, releases
and oral statements issued by or on behalf of the Com-
pany may include forward-looking statements. All
statements which address operating performance,
events or developments that the Company expects or
anticipates will occur or future financial performance
are forward-looking statements.
These forward-looking statements speak
only as of the date on which they are made. They rely
on a number of assumptions concerning future events
and are subject to a number of risks and uncertainties,
many of which are outside of the Company’s control,
that could cause actual results to differ materially from
such statements. These risks and uncertainties
include, but are not limited to:
material changes in the demand from larger cus-
tomers, including customers with which the Company
has national or global arrangements
availability of temporary workers or workers with
the skills required by customers
increases in the wages paid to temporary workers
competitive market pressures, including pricing
pressures
ability of the Company to successfully expand into
new markets or service lines
ability to successfully invest in and implement
information systems
unanticipated technological changes, including
obsolescence or impairment of information systems
changes in customer attitudes toward the use of
staffing services
government, tax or regulatory policies adverse to
the employment services industry
general economic conditions in international markets
interest rate and exchange rate fluctuations
difficulties related to acquisitions, including
integrating the acquired companies and achieving
the expected benefits
The Company disclaims any obligation to
update publicly or revise any forward-looking state-
ments, whether as a result of new information, future
events or otherwise.
ACCOUNTING CHANGES Since June 1998, the Financial
Accounting Standards Board (“FASB”) has issued SFAS
Nos. 133, 137, and 138 related to “Accounting for
Derivative Instruments and Hedging Activities”
(“SFAS No. 133, as amended” or “Statements”). These
Statements establish accounting and reporting
standards requiring that every derivative instrument
be recorded on the balance sheet as either an asset or
liability measured at its fair value. The Statements
require that changes in the derivative’s fair value be
recognized currently in earnings unless specific hedge
accounting criteria are met, in which case the gains or
losses would offset the related results of the hedged
item. The Company enters into certain derivative
financial instruments to manage its exchange rate and
interest rate risks, as discussed previously.
On January 1, 2001, the Company adopted
SFAS No. 133, as amended. As a result of adopting this
standard, the Company recognized the fair value of
all derivative contracts as a net liability of $3.4 million
on the balance sheet at January 1, 2001. This amount
was recorded as an adjustment to Shareholders’
equity through Accumulated other comprehensive
income (loss). There was no impact on Net earnings.

74 Manpower Inc.
Report of Independent Public Accountants
To the Board of Directors and
Shareholders of Manpower Inc.:
We have audited the accompanying consolidated balance
sheets of Manpower Inc. (a Wisconsin corporation) and
subsidiaries as of December 31, 2000 and 1999, and the
related consolidated statements of operations, cash
flows and shareholders’ equity for each of the three
years in the period ended December 31, 2000. These
consolidated financial statements are the responsibility
of the Company’s management. Our responsibility is to
express an opinion on these consolidated financial
statements based on our audits.
We conducted our audits in accordance with
auditing standards generally accepted in the United
States. Those standards require that we plan and
perform the audit to obtain reasonable assurance
about whether the financial statements are free of
material misstatement. An audit includes examining,
on a test basis, evidence supporting the amounts and
disclosures in the financial statements. An audit also
includes assessing the accounting principles used and
significant estimates made by management, as well
as evaluating the overall financial statement presen-
tation. We believe that our audits provide a reasonable
basis for our opinion.
In our opinion, the consolidated financial
statements referred to above present fairly, in all
material respects, the financial position of Manpower
Inc. and subsidiaries as of December 31, 2000 and
1999, and the results of their operations and their cash
flows for each of the three years in the period ended
December 31, 2000, in conformity with accounting
principles generally accepted in the United States.
ARTHUR ANDERSEN LLP
Milwaukee, Wisconsin
January 31, 2001

Manpower Inc. 75
Year Ended December 31 2000 1999 1998
Revenues from services $ 10,842.8 $ 9,770.1 $ 8,814.3Cost of services 8,896.1 8,065.2 7,311.3
Gross profit 1,946.7 1,704.9 1,503.0Selling and administrative expenses 1,635.7 1,474.3 1,280.5Write-down of capitalized software – – 92.1
Operating profit 311.0 230.6 130.4Interest and other expense 45.8 24.8 16.6
Earnings before income taxes 265.2 205.8 113.8Provision for income taxes 94.0 55.8 38.1
Net earnings $ 171.2 $ 150.0 $ 75.7
Net earnings per share $ 2.26 $ 1.94 $ .94
Net earnings per share – diluted $ 2.22 $ 1.91 $ .93
The accompanying Notes to Consolidated Financial Statements are an integral part of these statements.
Supplemental Systemwide Information (Unaudited)(dollars in millions)
Year Ended December 31 2000 1999 1998
Systemwide sales $ 12,444.9 $ 11,511.4 $ 10,523.4Systemwide offices at year-end 3,685 3,396 3,189
Systemwide information represents total of Company-owned branches and franchises.
Consolidated Statements of Operations(in millions, except per share data)

76 Manpower Inc.
December 31 2000 1999
Assets
Current Assets:Cash and cash equivalents $ 181.7 $ 241.7Accounts receivable, less allowance for doubtful accounts
of $55.3 and $47.1, respectively 2,094.4 1,897.6Prepaid expenses and other assets 51.8 66.0Future income tax benefits 68.8 52.0
Total current assets 2,396.7 2,257.3
Other Assets:Intangible assets, less accumulated amortization of $27.2 and $16.3, respectively 247.6 89.4Investments in licensees 41.8 37.0Other assets 163.9 152.6
Total other assets 453.3 279.0
Property and Equipment:Land, buildings, leasehold improvements and equipment 440.9 416.1Less: accumulated depreciation and amortization 249.3 233.7
Net property and equipment 191.6 182.4
Total assets $ 3,041.6 $ 2,718.7
Consolidated Balance Sheets(in millions, except share data)

Manpower Inc. 77
December 31 2000 1999
Liabilities and Shareholders’ Equity
Current Liabilities:Accounts payable $ 453.1 $ 388.0Employee compensation payable 81.2 71.9Accrued liabilities 269.2 180.2Accrued payroll taxes and insurance 341.8 340.9Value added taxes payable 311.0 305.6Short-term borrowings and current maturities of long-term debt 65.9 131.5
Total current liabilities 1,522.2 1,418.1
Other Liabilities:Long-term debt 491.6 357.5Other long-term liabilities 287.4 292.5
Total other liabilities 779.0 650.0
Shareholders’ Equity:Preferred stock, $.01 par value, authorized 25,000,000 shares, none issued – –Common stock, $.01 par value, authorized 125,000,000 shares,
issued 84,717,834 and 84,272,460 shares, respectively .8 .8Capital in excess of par value 1,631.4 1,621.4Accumulated deficit (496.9) (653.0)Accumulated other comprehensive income (loss) (145.1) (88.8)Treasury stock at cost, 8,945,200 and 8,286,400 shares, respectively (249.8) (229.8)
Total shareholders’ equity 740.4 650.6
Total liabilities and shareholders’ equity $ 3,041.6 $ 2,718.7
The accompanying Notes to Consolidated Financial Statements are an integral part of these balance sheets.

78 Manpower Inc.
Consolidated Statements of Cash Flows(in millions)
Year Ended December 31 2000 1999 1998
Cash Flows from Operating Activities:Net earnings $ 171.2 $ 150.0 $ 75.7Adjustments to reconcile net earnings to net cash
provided (used) by operating activities:Depreciation and amortization 66.8 63.7 55.6Deferred income taxes (15.8) 15.3 (37.5)Provision for doubtful accounts 21.7 20.7 12.0Write-down of capitalized software – – 92.1Change in operating assets and liabilities:
Amounts advanced under the Receivable Facility (55.0) 25.0 175.0Accounts receivable, net of sale (261.2) (457.4) (353.2)Other assets (32.6) (51.7) 9.5Other liabilities 262.8 233.9 236.0
Cash provided (used) by operating activities 157.9 (.5) 265.2
Cash Flows from Investing Activities:Capital expenditures (82.6) (74.7) (140.8)Acquisitions of businesses, net of cash acquired (172.4) (18.8) (31.7)Proceeds from the sale of property and equipment 7.3 14.9 1.0
Cash used by investing activities (247.7) (78.6) (171.5)
Cash Flows from Financing Activities:Net change in payable to banks (76.4) 45.5 23.1Proceeds from long-term debt 259.3 460.4 22.7Repayment of long-term debt (111.1) (259.3) (55.6)Proceeds from stock option and purchase plans 10.0 18.7 12.0Repurchase of common stock (20.0) (100.8) (43.9)Dividends paid (15.1) (15.3) (15.2)
Cash provided (used) by financing activities 46.7 149.2 (56.9)
Effect of exchange rate changes on cash (16.9) (8.9) 1.4
Net (decrease) increase in cash and cash equivalents (60.0) 61.2 38.2
Cash and cash equivalents, beginning of year 241.7 180.5 142.3
Cash and cash equivalents, end of year $ 181.7 $ 241.7 $ 180.5
Supplemental Cash Flow Information:Interest paid $ 27.1 $ 12.4 $ 18.9
Income taxes paid $ 83.2 $ 66.9 $ 69.0
The accompanying Notes to Consolidated Financial Statements are an integral part of these statements.

Manpower Inc. 79
AccumulatedCapital in Other
Common Excess of Accumulated Comprehensive TreasuryStock Par Value Deficit Income (Loss) Stock Total
Balance, December 31, 1997 $ .8 $ 1,590.7 $ (848.2) $ (40.7) $ (85.1) $ 617.5Comprehensive income:
Net earnings 75.7Foreign currency translation 22.8
Total comprehensive income 98.5Issuances under option
and purchase plans – 12.0 12.0Dividends ($.19 per share) (15.2) (15.2)Repurchases of common stock (43.9) (43.9)
Balance, December 31, 1998 .8 1,602.7 (787.7) (17.9) (129.0) 668.9Comprehensive income:
Net earnings 150.0Foreign currency translation (70.9)
Total comprehensive income 79.1Issuances under option
and purchase plans – 18.7 18.7Dividends ($.20 per share) (15.3) (15.3)Repurchases of common stock (100.8) (100.8)
Balance, December 31, 1999 .8 1,621.4 (653.0) (88.8) (229.8) 650.6Comprehensive income:
Net earnings 171.2Foreign currency translation (50.6)Unrealized loss on investments (5.7)
Total comprehensive income 114.9Issuances under option
and purchase plans – 10.0 10.0Dividends ($.20 per share) (15.1) (15.1)Repurchases of common stock (20.0) (20.0)
Balance, December 31, 2000 $ .8 $ 1,631.4 $ (496.9) $ (145.1) $ (249.8) $ 740.4
The accompanying Notes to Consolidated Financial Statements are an integral part of these statements.
Consolidated Statements of Shareholders’ Equity(in millions, except per share data)

80 Manpower Inc.
1. SUMMARY OF SIGNIFICANT ACCOUNTING POLICIES
Nature of operations Manpower Inc. (the “Company”) is a global staffing leader with nearly 3,700 systemwide
offices in 59 countries. The Company’s largest operations, based on revenues, are located in the United States,
France and the United Kingdom. The Company provides a wide range of human resource services, including
professional, technical, specialized, office and industrial staffing; temporary and permanent employee testing,
selection, training and development; and organizational-performance consulting. The Company provides services
to a wide variety of customers, none of which individually comprise a significant portion of revenues within a
given geographic region or for the Company as a whole.
Basis of consolidation The consolidated financial statements include the accounts of the Company and all
subsidiaries. For subsidiaries in which the Company has an ownership interest of 50% or less, but more than
20%, the Consolidated Financial Statements reflect the Company’s ownership share of those earnings using the
equity method of accounting. These investments are included as Investments in licensees in the Consolidated
Balance Sheets. Included in Shareholders’ equity at December 31, 2000 are $36.8 of unremitted earnings from
investments accounted for using the equity method. All significant intercompany accounts and transactions
have been eliminated in consolidation.
Revenues The Company generates revenues from sales of services by its own branch operations and from fees
earned on sales of services by its franchise operations. Revenues from services are recognized as the services are
rendered and revenues from franchise fees are recognized as earned. Franchise fees, which are included in revenues
from services, were $37.4, $37.7 and $37.8 for the years ended December 31, 2000, 1999 and 1998, respectively.
In December 1999, the Securities and Exchange Commission issued Staff Accounting Bulletin No. 101 (‘SAB 101’),
“Revenue Recognition in Financial Statements.” SAB 101 provides additional guidance in applying generally
accepted accounting principles to revenue recognition in financial statements. The revenue recognition criteria
prescribed by SAB 101 became effective for the Company in the fourth quarter of 2000. The Company has evaluated
SAB 101 and determined that it had no impact on the Company’s Consolidated Financial Statements.
Derivative financial instruments Since June 1998, the Financial Accounting Standards Board (“FASB”) has
issued Statements of Financial Accounting Standards (‘SFAS’) Nos. 133, 137, and 138 related to “Accounting
for Derivative Instruments and Hedging Activities” (“SFAS No. 133, as amended” or “Statements”). These
Statements establish accounting and reporting standards requiring that every derivative instrument be recorded
on the balance sheet as either an asset or liability measured at its fair value. The Statements require that
changes in the derivative’s fair value be recognized currently in earnings unless specific hedge accounting criteria
are met, in which case the gains or losses would offset the related results of the hedged item. The Company has
adopted SFAS No. 133, as amended, on January 1, 2001.
Accounts receivable securitization The Company accounts for the securitization of accounts receivable in
accordance with SFAS No. 125, “Accounting for Transfers and Servicing of Financial Assets and Extinguishment
of Liabilities.” At the time the receivables are sold, the balances are removed from the Consolidated Balance
Sheets. Costs associated with the sale of receivables, primarily related to the discount and loss on sale, are
included in Other expense in the Consolidated Statements of Operations.
In October 2000, the FASB issued SFAS No. 140, “Accounting for Transfers and Servicing of Financial
Assets and Extinguishments of Liabilities.” This statement replaces SFAS No. 125 and revises the accounting
and disclosures of such transactions, however, most of SFAS No. 125’s provisions will continue to be applicable.
This statement will be effective for servicing of financial assets and extinguishments of liabilities occurring after
March 31, 2001. The Company does not expect the adoption of SFAS No. 140 to have an impact on the Consolidated
Financial Statements.
Notes to Consolidated Financial Statements(in millions, except share data)

Manpower Inc. 81
Foreign currency translation The financial statements of the Company’s non-U.S. subsidiaries have been
translated in accordance with SFAS No. 52. Under SFAS No. 52, asset and liability accounts are translated at the
current exchange rate and income statement items are translated at the weighted average exchange rate for the
year. The resulting translation adjustments are recorded as a component of Accumulated other comprehensive
income (loss), which is included in Shareholders’ equity. In accordance with SFAS No. 109, no deferred taxes have
been recorded related to the cumulative translation adjustments.
The Company’s various Euro and Yen denominated borrowings are accounted for as a hedge of the
Company’s net investment in its subsidiaries with the related functional currencies. Since the Company’s
net investment in these respective subsidiaries exceeds the amount of the related borrowings, all translation
gains or losses related to these borrowings are included as a component of Accumulated other comprehensive
income (loss).
Translation adjustments for those operations in highly inflationary economies and certain other
transaction adjustments are included in earnings. Historically these adjustments have been immaterial to the
Consolidated Financial Statements.
Capitalized software The Company capitalizes purchased software as well as internally developed software.
Internal software development costs are capitalized from the time the internal use software is considered probable
of completion until the software is ready for use. Business analysis, system evaluation, selection and software
maintenance costs are expensed as incurred. Capitalized software costs are amortized using the straight-line
method over the estimated useful life of the software. The Company regularly reviews the carrying value of all
capitalized software and recognizes a loss when the carrying value is considered unrealizable. The net capital-
ized software balance of $10.8 and $6.3 as of December 31, 2000 and 1999, respectively, is included in Other
assets in the Consolidated Balance Sheets.
Intangible assets Intangible assets consist primarily of the excess of cost over the fair value of net assets
acquired. The excess of cost over the fair value of net assets acquired is amortized on a straight-line basis over
its useful life, estimated based on the facts and circumstances surrounding each individual acquisition, not
to exceed twenty years. The intangible asset and related accumulated amortization are removed from the
Consolidated Balance Sheets when the intangible asset becomes fully amortized. The Company regularly
reviews the carrying value of all intangible assets and recognizes a loss when the unamortized balance is con-
sidered unrealizable. Amortization expense was $13.3, $6.9 and $5.4 in 2000, 1999 and 1998, respectively.
Property and equipment A summary of property and equipment at December 31 is as follows:
2000 1999
Land $ 1.6 $ 1.4Buildings 23.2 20.4Furniture, fixtures and autos 170.5 175.5Computer equipment 110.3 90.8Leasehold improvements 135.3 128.0
$ 440.9 $ 416.1
Property and equipment are stated at cost and depreciated using the straight-line method over the
following estimated useful lives: buildings – up to 40 years; leasehold improvements – lesser of life of asset or
lease term; furniture and equipment – 3 to 10 years. Expenditures for renewals and betterments are capitalized
whereas expenditures for repairs and maintenance are charged to income as incurred. Upon sale or disposition of
properties, the difference between unamortized cost and the proceeds is charged or credited to income.

82 Manpower Inc.
Shareholders’ equity The Board of Directors has authorized the repurchase of up to fifteen million shares of stock
under the Company’s share repurchase program. Share repurchases may be made from time to time and may be
implemented through a variety of methods, including open market purchases, block transactions, privately
negotiated transactions, accelerated share repurchase programs, forward repurchase agreements or similar
facilities. Total shares repurchased under the program at December 31, 2000 and 1999, were 8.9 million and 8.3
million shares, respectively, at a cost of $249.8 and $229.8, respectively.
During September 2000, the Company entered into a forward repurchase agreement to purchase
shares of its common stock under its share repurchase program. Under the agreement, the Company will, from
time to time over the next two years, repurchase a total of one million shares at a forward price of $31.70, which
approximates the market price at the inception of the agreement, plus a financing charge. The Company may
choose the method by which it settles the agreement (i.e., cash or shares). As of December 31, 2000, no shares
have been purchased under this agreement.
Advertising costs The Company generally expenses production costs of media advertising as they are incurred.
Advertising expenses were $44.0, $39.6 and $41.7 in 2000, 1999, and 1998, respectively.
Statement of cash flows The Company considers all highly liquid investments with a maturity of three months or
less when purchased to be cash equivalents.
Use of estimates The preparation of financial statements in conformity with generally accepted accounting
principles requires management to make estimates and assumptions that affect the reported amounts of assets
and liabilities and disclosure of contingent assets and liabilities at the date of the financial statements and
the reported amounts of revenues and expenses during the reporting period. Actual results could differ from
these estimates.
Reclassifications Certain amounts in the 1999 and 1998 financial statements have been reclassified to be consis-
tent with the current year presentation.
2. EARNINGS PER SHARE
The calculation of net earnings per share for the years ended December 31, 2000, 1999 and 1998, is as follows:
2000 1999 1998
Net earnings available to common shareholders $ 171.2 $ 150.0 $ 75.7Weighted average common shares outstanding (in millions) 75.9 77.3 80.1
$ 2.26 $ 1.94 $ .94
The calculation of net earnings per share - diluted for the years ended December 31, 2000, 1999 and
1998, is as follows:2000 1999 1998
Net earnings available to common shareholders $ 171.2 $ 150.0 $ 75.7Weighted average common shares outstanding (in millions) 75.9 77.3 80.1Effect of dilutive securities – Stock options (in millions) 1.2 1.4 1.1
77.1 78.7 81.2
$ 2.22 $ 1.91 $ .93
Notes to Consolidated Financial Statements (continued)
(in millions, except share data)

Manpower Inc. 83
The calculation of net earnings per share - diluted for the years ended December 31, 2000, 1999 and
1998 does not include certain stock option grants because the exercise price for these options is greater than the
average market price of the common shares during that year. The number, exercise prices and weighted average
remaining life of these antidilutive options is as follows:
2000 1999 1998
Shares (000) 535 1,146 625Exercise prices $35-$41 $27-$49 $32-$49Weighted average remaining life 8.0 years 7.9 years 8.1 years
3. INCOME TAXES
The provision for income taxes consists of:
2000 1999 1998
Current:United States:
Federal $ 13.1 $ (4.0) $ 9.9State 1.8 5.6 3.3
Foreign 97.3 38.9 62.4
Total current 112.2 40.5 75.6
Deferred:United States:
Federal 1.3 (4.2) (21.3)State – (.6) (3.7)
Foreign (19.5) 20.1 (12.5)
Total deferred (18.2) 15.3 (37.5)
Total provision $ 94.0 $ 55.8 $ 38.1
A reconciliation between taxes computed at the United States Federal statutory tax rate of 35% and the
consolidated effective tax rate is as follows:
2000 1999 1998
Income tax based on statutory rate $ 92.8 $ 72.0 $ 39.8Increase (decrease) resulting from:
Foreign tax rate differences 5.0 3.9 3.2State income taxes 1.2 2.6 (.4)Benefit on dissolution(a) – (15.7) –Tax effect of foreign repatriations (1.6) (11.3) 2.8Change in valuation reserve (4.0) 5.0 (7.6)Other, net .6 (.7) .3
Total provision $ 94.0 $ 55.8 $ 38.1
(a) The Benefit on dissolution of $15.7 represents the one-time tax benefit realized during 1999 related to the dissolution of a non-operating subsidiary.
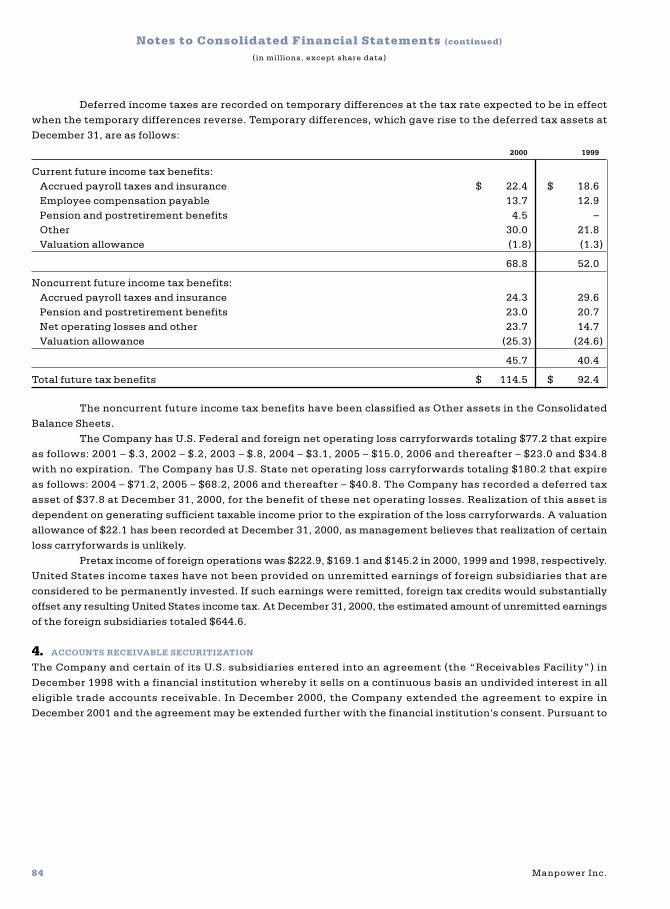
84 Manpower Inc.
Deferred income taxes are recorded on temporary differences at the tax rate expected to be in effect
when the temporary differences reverse. Temporary differences, which gave rise to the deferred tax assets at
December 31, are as follows:
2000 1999
Current future income tax benefits:Accrued payroll taxes and insurance $ 22.4 $ 18.6Employee compensation payable 13.7 12.9Pension and postretirement benefits 4.5 –Other 30.0 21.8Valuation allowance (1.8) (1.3)
68.8 52.0
Noncurrent future income tax benefits:Accrued payroll taxes and insurance 24.3 29.6Pension and postretirement benefits 23.0 20.7Net operating losses and other 23.7 14.7Valuation allowance (25.3) (24.6)
45.7 40.4
Total future tax benefits $ 114.5 $ 92.4
The noncurrent future income tax benefits have been classified as Other assets in the Consolidated
Balance Sheets.
The Company has U.S. Federal and foreign net operating loss carryforwards totaling $77.2 that expire
as follows: 2001 – $.3, 2002 – $.2, 2003 – $.8, 2004 – $3.1, 2005 – $15.0, 2006 and thereafter – $23.0 and $34.8
with no expiration. The Company has U.S. State net operating loss carryforwards totaling $180.2 that expire
as follows: 2004 – $71.2, 2005 – $68.2, 2006 and thereafter – $40.8. The Company has recorded a deferred tax
asset of $37.8 at December 31, 2000, for the benefit of these net operating losses. Realization of this asset is
dependent on generating sufficient taxable income prior to the expiration of the loss carryforwards. A valuation
allowance of $22.1 has been recorded at December 31, 2000, as management believes that realization of certain
loss carryforwards is unlikely.
Pretax income of foreign operations was $222.9, $169.1 and $145.2 in 2000, 1999 and 1998, respectively.
United States income taxes have not been provided on unremitted earnings of foreign subsidiaries that are
considered to be permanently invested. If such earnings were remitted, foreign tax credits would substantially
offset any resulting United States income tax. At December 31, 2000, the estimated amount of unremitted earnings
of the foreign subsidiaries totaled $644.6.
4. ACCOUNTS RECEIVABLE SECURITIZATION
The Company and certain of its U.S. subsidiaries entered into an agreement (the “Receivables Facility”) in
December 1998 with a financial institution whereby it sells on a continuous basis an undivided interest in all
eligible trade accounts receivable. In December 2000, the Company extended the agreement to expire in
December 2001 and the agreement may be extended further with the financial institution’s consent. Pursuant to
Notes to Consolidated Financial Statements (continued)
(in millions, except share data)

Manpower Inc. 85
the Receivables Facility, the Company formed Ironwood Capital Corporation, a wholly owned, special purpose,
bankruptcy-remote subsidiary (“ICC”). ICC was formed for the sole purpose of buying and selling receivables
generated by the Company and certain subsidiaries of the Company. Under the Receivables Facility, the
Company and certain subsidiaries, irrevocably and without recourse, transfer all of their accounts receivable to
ICC. ICC, in turn, has sold and, subject to certain conditions, may from time to time sell an undivided interest in
these receivables and is permitted to receive advances of up to $200.0 for the sale of such undivided interest.
This two-step transaction is accounted for as a sale of receivables under the provisions of SFAS No. 125,
“Accounting for Transfers and Servicing of Financial Assets and Extinguishment of Liabilities.” There was $145.0
and $200.0 advanced under the Receivables Facility at December 31, 2000 and 1999, respectively, and accordingly,
that amount of accounts receivable has been removed from the Consolidated Balance Sheets. Costs associated
with the sale of receivables, primarily related to the discount and loss on sale, were $9.8, $9.8 and $.7 in 2000, 1999
and 1998, respectively, and are included in Other expenses in the Consolidated Statements of Operations.
5. WRITE-DOWN OF CAPITALIZED SOFTWARE
In December 1998, in accordance with its ongoing review of capitalized software, the Company recorded a $92.1
($57.1 after tax, or $.70 per share on a diluted basis) non-cash charge to write off the carrying value of software
costs and certain hardware and network infrastructure costs related to the development of a complex and
proprietary information system for its North American branch office administration, invoicing and payroll pro-
cessing. This comprehensive information system had been under development for several years and portions of
the system were in field-testing and deployment.
After a period of field testing, management and the Board of Directors decided in December 1998 that
it was necessary to significantly alter the technological architecture of the system in order to reduce ongoing
support, maintenance and communications costs. This decision required the application software under
development to be abandoned and a new application to be purchased or developed for the new architecture. In
addition to the developed software, certain hardware, network infrastructure and software licenses were
also abandoned as a result of the change in system architecture. The non-cash charge included the costs of
abandoning all of these assets.
6. DEBT
Information concerning short-term borrowings at December 31 is as follows:
2000 1999
Payable to banks $ 60.7 $ 127.9Average interest rates 6.6% 3.9%
The Company and some of its foreign subsidiaries maintain lines of credit with foreign financial
institutions to meet short-term working capital needs. Such lines totaled $205.1 at December 31, 2000, of which
$144.4 was unused. The Company has no significant compensating balance requirements or commitment fees
related to these lines.

86 Manpower Inc.
A summary of Long-term debt at December 31 is as follows:2000 1999
Euro denominated notes, at a rate of 5.7% $ 188.0 $ 201.2Euro denominated notes, at a rate of 6.3% 141.0 –Commercial paper, maturing within 90 days, at average
interest rates of 7.0% and 6.3%, respectively 4.6 14.8Revolving credit agreement:
Euro denominated borrowings, at a rate of 5.4% 83.7 –Yen denominated borrowings, at a rate of 1.4% and .5%, respectively 54.7 38.7U.S. dollar denominated borrowings, at a rate of 6.4% – 95.0
Other 24.8 11.4
496.8 361.1Less—Current maturities 5.2 3.6
Long-term debt $ 491.6 $ 357.5
Euro notes In March 2000, the Company issued €150.0 in unsecured notes due March 2005. Net proceeds of $143.1
from the issuance were used to repay amounts under the Company’s unsecured revolving credit agreement.
In July 1999, the Company issued €200.0 in unsecured notes due July 2006. Net proceeds of $200.9
from the issuance of these notes were used to repay amounts under the Company’s unsecured revolving credit
agreement and commercial paper program.
Revolving credit agreements The Company has a $415.0 unsecured revolving credit agreement that allows for
borrowings in various currencies and includes a $90.0 commitment to be used exclusively for standby letters of
credit. Outstanding letters of credit totaled $62.1 and $57.9 as of December 31, 2000 and 1999, respectively.
Additional borrowings of $182.0 were available to the Company under this agreement at December 31, 2000.
The interest rate and facility fee on the entire line and the issuance fee on the letter of credit
commitment related to this agreement vary based on the Company’s debt rating and borrowing level. Currently,
the interest rate is LIBOR plus .215%, and the fees are .14% and .215%, respectively. The facility matures in
November 2002, and may be increased to a maximum of $500.0 or extended for an additional year with the
lenders’ consent. The agreement requires, among other things, that the Company comply with minimum interest
coverage and debt-to-capitalization ratios and a maximum subsidiary debt level.
The Company also has a $300.0 unsecured revolving credit agreement. The interest rate and facility
fee on the entire line and the participation fee vary based on the Company’s debt rating and borrowing level.
Currently, the fees are .10% and .25%, respectively. The facility was extended in November 2000 to expire in
November 2001, and may be extended for an additional year with the lenders’ consent. This agreement has similar
restrictive covenants to the Company’s $415.0 revolving credit agreement. As of December 31, 2000, the Company
had no borrowings under this agreement.
Interest rate swaps In June 2000, the Company entered into various interest rate swap agreements in order
to fix its interest costs on a portion of its Euro and Yen denominated variable rate borrowings. The Euro interest
rate swap agreements have a notional value of €100.0 ($94.0) and expire in 2010. The Yen interest rate swap
agreement has a notional value of ¥4,000.0 ($35.0) and expires in 2003. These swap agreements have had an
immaterial impact on the recorded interest expense during 2000.
The Company also had an interest rate swap agreement that expired in January 2001. Throughout 2000,
this agreement fixed the interest rate at 6.0% on $50.0 of the Company’s U.S. dollar-based borrowings. This swap
agreement had an immaterial impact on the recorded interest expense during 2000 and 1999.
Notes to Consolidated Financial Statements (continued)
(in millions, except share data)

Manpower Inc. 87
Other Due to the availability of long-term financing, commercial paper borrowings have been classified as
Long-term debt. The carrying value of Long-term debt approximates fair value, except for the Euro denominated
notes, which had a fair value of $327.6 and $191.6 at December 31, 2000 and 1999, respectively.
The maturities of long-term debt payable within each of the four years subsequent to December 31,
2001 are as follows: 2002 – $151.6, 2003 – $2.6, 2004 – $7.5 and 2005 – $141.9 and thereafter – $188.0.
7. STOCK COMPENSATION PLANS
The Company accounts for all of its fixed stock option plans and the 1990 Employee Stock Purchase Plan in
accordance with APB Opinion No. 25 and related Interpretations. Accordingly, no compensation cost related to
these plans was charged against earnings in 2000, 1999 and 1998. Had the Company determined compensation
cost consistent with the method of SFAS No. 123, the Company’s Net earnings and Net earnings per share would
have been reduced to the pro forma amounts indicated as follows:
2000 1999 1998
Net earnings:as reported $ 171.2 $ 150.0 $ 75.7pro forma 167.9 146.4 74.4
Net earnings per share:as reported $ 2.26 $ 1.94 $ .94pro forma 2.22 1.90 .93
Net earnings per share – diluted:as reported $ 2.22 $ 1.91 $ .93pro forma 2.18 1.86 .92
The fair value of each option grant is estimated on the date of grant using the Black-Scholes option-pricing
model with the following weighted-average assumptions used for grants in 2000, 1999 and 1998, respectively:
risk-free interest rates of 5.8%, 5.6% and 4.5%; expected volatility of 19.2%, 17.2% and 24.4%; dividend yield of
.5% in all years; and expected lives of 5.8 years, 7.6 years and 5.7 years. The weighted-average fair value of
options granted was $6.46, $6.16 and $4.36 in 2000, 1999 and 1998, respectively.
Fixed stock option plans The Company has reserved 7,625,000 shares of common stock for issuance under the
Executive Stock Option and Restricted Stock Plans. Under the plans, all full-time employees of the Company are
eligible to receive stock options, purchase rights and restricted stock. The options, rights and stock are granted
to eligible employees at the discretion of a committee appointed by the Board of Directors.
All options have generally been granted at a price equal to the fair market value of the Company’s
common stock at the date of grant. The purchase price per share pursuant to a purchase right is determined
by the Board of Directors. The committee also determines the period during which options and rights are
exercisable. Generally, options are granted with a vesting period of up to five years and expire ten years from the
date of grant. Rights may generally be exercised for up to sixty days from the date of grant. Under the plans, the
committee may also authorize the granting of stock appreciation rights and cash equivalent rights in conjunction
with the stock options and purchase rights, respectively. As of December 31, 2000, no purchase rights, stock
appreciation rights or cash equivalent rights had been granted.
The Company has reserved 800,000 shares of common stock for issuance under the 1991 Directors Stock
Option Plan. Under the plan, each non-employee director of the Company may receive an option to purchase
shares of the Company’s common stock in lieu of cash compensation. The number of shares covered by the option
is determined pursuant to a formula set forth in the plan. The per share purchase price for each option awarded is
equal to the fair market value of the Company’s common stock at the date of grant. Options are exercisable for
the vested portion during the director’s tenure and a limited period thereafter.

88 Manpower Inc.
The Company also has the Savings Related Share Option Scheme for United Kingdom employees with at
least one year of service. These employees are offered the opportunity to obtain an option for a specified number
of shares of common stock at not less than 85% of their market value on the day prior to the offer to participate in
the plan. Options vest after either 3, 5, or 7 years, but may lapse earlier. Funds used to purchase the shares are
accumulated through specified payroll deductions over a 60-month period.
Information related to options outstanding under the plans, and the related weighted-average exercise
prices, is as follows:2000 1999 1998
Shares (000) Price Shares (000) Price Shares (000) Price
Options outstanding, beginning of period 4,371 $ 20 3,840 $ 21 3,362 $ 21Granted 1,385 30 1,119 26 930 24Exercised (279) 19 (496) 17 (237) 15Expired or cancelled (136) 32 (92) 25 (215) 35
Options outstanding, end of period 5,341 $ 25 4,371 $ 23 3,840 $ 21
Options exercisable, end of period 2,268 $ 21 2,055 $ 20 2,354 $ 17
Options outstanding as of December 31, 2000 are as follows:
Options outstanding Options exercisable
Weighted-average Weighted- Weighted-
Exercise remaining average averageprices Shares (000) contractual life exercise price Shares (000) exercise price
$10 – $20 1,425 2.0 $ 15 1,329 $ 1521 – 25 1,448 7.9 23 225 2326 – 30 1,543 9.0 29 284 2831 – 41 925 7.6 35 430 35
5,341 6.6 $ 25 2,268 $ 21
Other stock plans The Company has reserved 2,250,000 shares of common stock for issuance under the 1990
Employee Stock Purchase Plan. Under the plan, designated Manpower employees meeting certain service
requirements may purchase shares of the Company’s common stock through payroll deductions. These shares
may be purchased at the lesser of 85% of their fair market value at the beginning or end of each year. During 2000,
1999 and 1998, 80,000, 138,500 and 155,500 shares, respectively, were purchased under the plan.
Notes to Consolidated Financial Statements (continued)
(in millions, except share data)

Manpower Inc. 89
8. RETIREMENT PLANS
Defined benefit plans The Company sponsors several qualified and nonqualified pension plans covering
substantially all permanent employees. The reconciliation of the changes in the plans’ benefit obligations and
the fair value of plan assets and the statement of the funded status of the plans are as follows:
U.S. Plans Non-U.S. Plans
2000 1999 2000 1999
Change in benefit obligation:Benefit obligation, beginning of year $ 38.2 $ 31.1 $ 58.2 $ 49.9
Service cost .4 1.6 4.1 4.0Interest cost 3.0 2.4 3.0 2.7Curtailment loss 3.7 – – –Special termination benefits – 8.0 – –Actuarial loss (gain) .8 (3.2) .5 3.3Plan participant contributions – – 1.0 1.0Benefits paid (2.8) (1.7) (1.9) (1.8)Currency exchange rate changes – – (4.8) (.9)
Benefit obligation, end of year $ 43.3 $ 38.2 $ 60.1 $ 58.2
Change in plan assets:Fair value of plan assets, beginning of year $ 30.9 $ 25.7 $ 53.4 $ 44.2
Actual return on plan assets .7 5.8 (.1) 7.3Plan participant contributions – – .9 1.0Company contributions 1.6 1.1 3.0 3.0Benefits paid (2.8) (1.7) (1.9) (1.8)Currency exchange rate changes – – (4.3) (.3)
Fair value of plan assets, end of year $ 30.4 $ 30.9 $ 51.0 $ 53.4
Funded status:Funded status of plan $ (12.9) $ (7.3) $ (9.1) $ (4.8)Unrecognized net (gain) loss (8.2) (10.6) 8.9 5.4Unrecognized prior service cost – – .3 .3Unrecognized transitional asset (.4) (.6) .1 –
Net amount recognized $ (21.5) $ (18.5) $ .2 $ .9
Amounts recognized:Prepaid benefit cost $ – $ – $ 3.5 $ 3.8Accrued benefit liability (21.5) (18.5) (3.3) (2.9)
Net amount recognized $ (21.5) $ (18.5) $ .2 $ .9
The components of the net periodic benefit cost for all plans are as follows:
2000 1999 1998
Service cost $ 4.5 $ 5.6 $ 4.2Interest cost 6.0 5.1 4.3Expected return on assets (5.7) (5.0) (4.8)Amortization of:
unrecognized (gain) loss (.1) .1 –unrecognized transitional asset (.2) (.2) (.2)
Curtailment loss 3.7 – –Special termination benefits – 8.0 –
Total benefit cost $ 8.2 $ 13.6 $ 3.5

90 Manpower Inc.
The weighted-average assumptions used in the measurement of the benefit obligation are as follows:
U.S. Plans Non-U.S. Plans
2000 1999 2000 1999
Discount rate 7.5% 7.5% 5.6% 5.5%Expected return on assets 8.5% 8.5% 6.7% 6.8%Rate of compensation increase 6.0% 6.0% 4.2% 4.2%
Projected salary levels utilized in the determination of the projected benefit obligation for the pension
plans are based upon historical experience. The unrecognized transitional asset is being amortized over the esti-
mated remaining service lives of the employees. Plan assets are primarily comprised of common stocks and U.S.
government and agency securities.
In April 1999, the Company amended a U.S. plan to allow for special termination benefits related to senior
executives. This amendment resulted in a one-time expense of $8.0 in 1999.
Retiree health care plan The Company provides medical and dental benefits to certain eligible retired employees
in the United States. Due to the nature of the plan, there are no plan assets. The reconciliation of the changes in
the plan’s benefit obligation and the statement of the funded status of the plan are as follows:
2000 1999
Benefit obligation, beginning of year $ 26.6 $ 28.8Service cost .7 2.4Interest cost 1.7 1.9Actuarial gain (1.1) (6.2)Benefits paid (1.3) (.3)Curtailment gain (4.1) –
Benefit obligation, end of year 22.5 26.6Unrecognized net gain 5.9 6.1
Accrued liability recognized $ 28.4 $ 32.7
The discount rate used in the measurement of the benefit obligation was 7.5% in both 2000 and 1999.
The components of net periodic benefit (gain) cost for this plan are as follows:
2000 1999 1998
Service cost $ .7 $ 2.4 $ 1.9Interest cost 1.7 1.9 1.7Amortization of unrecognized gain (.3) – –Curtailment gain (4.1) – –
$ (2.0) $ 4.3 $ 3.6
The health care cost trend rate was assumed to be 7.0% for 2000 and decreases gradually to 6.5% for the
years 2001 and beyond. Assumed health care cost trend rates have a significant effect on the amounts reported.
A one-percentage point change in the assumed health care cost trend rate would have the following effects:
1% increase 1% decrease
Effect on total of service and interest cost components $ .4 $ (.4)Effect on postretirement benefit obligation 3.1 (2.7)
Notes to Consolidated Financial Statements (continued)
(in millions, except share data)

Manpower Inc. 91
Curtailments On February 29, 2000, the Company froze all benefits in each of its U.S. defined benefit pension
plans. The Company also offered a voluntary early retirement package and certain other benefits to eligible
employees. These benefits are expected to be paid from the respective defined benefit pension plans. In addition,
the Company will no longer provide medical and dental benefits under its U.S. retiree health care plan to certain
employees retiring on or after March 1, 2000. The net impact of these plan changes was not material to the
Consolidated Financial Statements.
Defined contribution plans The Company has defined contribution plans covering substantially all permanent
U.S. employees. Under the plans, employees may elect to contribute a portion of their salary to the plans.
Effective January 1, 2000, the Company amended its defined contribution plans to include a mandatory matching
contribution. In addition, profit sharing contributions are made if a targeted earnings level is reached in the U.S.
The total expense was $3.2, $.4 and $.4 for 2000, 1999 and 1998 respectively.
9. LEASES
The Company leases property and equipment primarily under operating leases. Renewal options exist for
substantially all leases.
Future minimum payments, by year and in the aggregate, under noncancelable operating leases with
initial or remaining terms of one year or more consist of the following at December 31, 2000:
Year
2001 $ 120.32002 64.02003 41.82004 30.22005 22.7Thereafter 61.3
Total minimum lease payments $ 340.3
Rental expense for all operating leases was $118.0, $108.5 and $91.8 for the years ended December 31,
2000, 1999, and 1998, respectively.
10. INTEREST AND OTHER EXPENSE (INCOME)
Interest and other expense (income) consists of the following:
2000 1999 1998
Interest expense $ 35.0 $ 17.3 $ 19.2Interest income (7.3) (8.0) (8.4)Foreign exchange losses 2.3 1.9 2.4Loss on sale of accounts receivable 9.8 9.8 .7Miscellaneous, net 6.0 3.8 2.7
Interest and other expense $ 45.8 $ 24.8 $ 16.6

92 Manpower Inc.
11. ACQUISITIONS OF BUSINESSES
In January 2000, the Company acquired Elan Group Limited (“Elan”), a European specialty IT staffing company
with significant operations in the U.K. and several other countries throughout the world. As of December 31,
2000, the total consideration paid for Elan was approximately $116.2. In addition, there is approximately $30.0 in
deferred consideration expected to be paid during March 2001. This transaction was accounted for as a purchase
and the excess of the purchase price over the fair value of net assets acquired was recorded as intangible assets.
From time to time, the Company acquires and invests in companies throughout the world. The total
consideration paid for such transactions, excluding the acquisition of Elan in 2000, was $60.2, $18.8 and $32.5 in
2000, 1999 and 1998, respectively, the majority of which was recorded as intangible assets.
12. DERIVATIVE FINANCIAL INSTRUMENTS
The Company has entered into certain derivative financial instruments to manage risks, including interest rate
swap agreements and foreign currency contracts.
On January 1, 2001, the Company adopted SFAS No. 133, as amended. As a result of adopting this standard,
the Company recognized the fair value of all derivative contracts as a net liability of $3.4 on the Consolidated
Balance Sheets at January 1, 2001. This amount was recorded as an adjustment to Shareholders’ equity through
Accumulated other comprehensive income (loss). There was no impact on Net earnings.
13. CONTINGENCIES
The Company is involved in a number of lawsuits arising in the ordinary course of business which will not, in
the opinion of management, have a material effect on the Company’s results of operations, financial position or
cash flows.
14. BUSINESS SEGMENT DATA BY GEOGRAPHICAL AREA
The Company is organized and managed on a geographical basis. Each country has its own distinct operations, is
managed locally by its own management team, and maintains its own financial reports. Under SFAS No. 131,
“Disclosures about Segments of an Enterprise and Related Information,” the Company has four reportable segments
– the United States, France, the United Kingdom and Other Europe. All remaining countries have never met the
quantitative thresholds for determining reportable segments.
Each reportable segment derives at least 96% of its revenues from the placement of temporary help.
The remaining revenues are derived from other human resource services, including temporary and permanent
employee testing, selection, training and development; and organizational-performance consulting. Segment
revenues represent sales to external customers within a single segment. Due to the nature of its business, the
Company does not have export or intersegment sales. The Company provides services to a wide variety of
customers, none of which individually comprise a significant portion of revenues within a reporting segment,
geographic region or for the Company as a whole.
The accounting policies of the segments are the same as those described in the summary of significant
accounting policies. The Company evaluates performance based on Operating Unit Profit, which is equal to
segment revenues less direct costs and branch and national head office operating costs. This profit measure
does not include nonrecurring items, goodwill amortization, interest and other income and expense amounts or
income taxes. Total assets for the segments are reported after the elimination of investments in subsidiaries and
intercompany accounts.
Notes to Consolidated Financial Statements (continued)
(in millions, except share data)

Manpower Inc. 93
2000 1999 1998
Revenues from services:United States (a) $ 2,413.5 $ 2,250.5 $ 2,152.8Foreign:
France 3,939.2 3,775.1 3,639.5United Kingdom 1,453.1 1,170.3 1,088.2Other Europe 1,896.3 1,665.5 1,286.3Other Countries 1,140.7 908.7 647.5
Total foreign 8,429.3 7,519.6 6,661.5
$ 10,842.8 $ 9,770.1 $ 8,814.3
Operating Unit Profit:United States $ 84.6 $ 80.3 $ 78.0France 130.6 100.9 77.0United Kingdom 46.2 40.2 42.3Other Europe 89.1 68.0 52.9Other Countries 13.2 10.6 16.3
363.7 300.0 266.5Corporate expenses 39.4 34.5 38.6Amortization of intangible assets 13.3 6.9 5.4Interest and other expense 45.8 24.8 16.6Nonrecurring expenses (b) – 28.0 –Write-down of capitalized software (c) – – 92.1
Earnings before income taxes $ 265.2 $ 205.8 $ 113.8
Depreciation and amortization expense:United States $ 16.0 $ 16.4 $ 14.4France 11.8 12.2 12.5United Kingdom 7.4 8.2 8.1Other Europe 16.1 13.2 9.8Other Countries 6.5 5.2 3.5
$ 57.8 $ 55.2 $ 48.3
Earnings from investments in licensees:United States $ (.1) $ .1 $ .2Other Europe 2.0 2.0 1.4Other Countries (.5) .9 .9
$ 1.4 $ 3.0 $ 2.5
(a) Total Systemwide sales in the United States, which include sales of Company-owned branches and franchises, were $3,814.9, $3,758.7and $3,577.2 for the years ended December 31, 2000, 1999 and 1998, respectively.
(b) Represents nonrecurring items ($16.4 after tax) in the second quarter of 1999 related to employee severances, retirement costs andother associated realignment costs.
(c) The write-down of capitalized software relates to the abandonment of an information system that was being developed in the U.S.

94 Manpower Inc.
2000 1999 1998
Total assets:United States $ 384.8 $ 364.4 $ 285.8France 1,204.6 1,140.0 1,128.3United Kingdom 438.8 269.9 230.2Other Europe 674.1 609.7 465.3Other Countries 255.1 250.5 215.6Corporate(a) 84.2 84.2 66.5
$ 3,041.6 $ 2,718.7 $ 2,391.7
Investments in licensees:United States $ .6 $ .9 $ .5Other Europe 38.5 34.0 31.5Other Countries 2.7 2.1 1.1
$ 41.8 $ 37.0 $ 33.1
Long-lived assets:United States $ 40.1 $ 44.2 $ 48.0Foreign:
France 57.6 51.4 66.3United Kingdom 30.7 26.2 30.2Other Europe 57.7 47.9 38.9Other Countries 17.6 19.7 14.7
Total foreign 163.6 145.2 150.1Corporate (a) 1.3 2.1 3.9
$ 205.0 $ 191.5 $ 202.0
Additions to long-lived assets:United States $ 15.0 $ 16.7 $ 64.0France 22.2 16.9 33.4United Kingdom 9.7 4.9 10.0Other Europe 22.2 27.4 25.7Other Countries 15.0 10.0 7.8Corporate(a) .7 1.0 .9
$ 84.8 $ 76.9 $ 141.8
(a) Corporate assets include assets that are not used in the operations of any geographical segment.
Notes to Consolidated Financial Statements (continued)
(in millions, except share data)

Manpower Inc. 95
First Second Third FourthQuarter Quarter Quarter Quarter Total
Year Ended December 31, 2000
Revenues from services $ 2,568.3 $ 2,714.1 $ 2,820.9 $ 2,739.5 $ 10,842.8Gross profit 446.0 477.8 507.4 515.5 1,946.7Net earnings 25.6 38.0 54.1 53.5 171.2Net earnings per share $ .34 $ .50 $ .71 $ .71 $ 2.26Net earnings per share - diluted $ .33 $ .49 $ .70 $ .70 $ 2.22Dividends per share $ – $ .10 $ – $ .10 $ .20Market price:
High $ 36.81 $ 39.81 $ 39.50 $ 38.75Low 26.75 30.63 30.63 28.69
Year Ended December 31, 1999
Revenues from services $ 2,175.2 $ 2,327.6 $ 2,606.8 $ 2,660.5 $ 9,770.1Gross profit 380.2 404.7 451.8 468.2 1,704.9Net earnings 20.6 31.8 48.9 48.7 150.0Net earnings per share $ .26 $ .41 $ .64 $ .64 $ 1.94Net earnings per share - diluted $ .26 $ .40 $ .63 $ .63 $ 1.91Dividends per share $ – $ .10 $ – $ .10 $ .20Market price:
High $ 28.00 $ 25.56 $ 29.94 $ 38.69Low 22.25 21.00 21.19 28.44
Quarterly Data (Unaudited)
(in millions, except per share data)

96 Manpower Inc.
Year Ended December 31 2000 1999 1998 1997 1996
Operations Data:Revenues from services $ 10,842.8 $ 9,770.1 $ 8,814.3 $ 7,258.5 $ 6,079.9Gross profit 1,946.7 1,704.9 1,503.0 1,310.2 1,148.0Write-down of capitalized software – – (92.1) – –Operating profit 311.0 230.6 130.4 255.4 227.0Net earnings 171.2 150.0 75.7 163.9 162.3
Per Share Data:Net earnings $ 2.26 $ 1.94 $ .94 $ 2.01 $ 1.98Net earnings - diluted 2.22 1.91 .93 1.97 1.94Dividends .20 .20 .19 .17 .15
Balance Sheet Data:Total assets $ 3,041.6 $ 2,718.7 $ 2,391.7 $ 2,047.0 $ 1,752.3Long-term debt 491.6 357.5 154.6 189.8 100.8
The Notes to Consolidated Financial Statements should be read in conjunction with the above summary.
Selected Financial Data(in millions, except per share data)

Manpower Inc. 97
World Headquarters
P.O. Box 20535301 N. Ironwood Rd.Milwaukee, WI 53201(414) 961-1000www.manpower.com
Transfer Agent and Registrar
Mellon Investor Services, L.L.C.P.O. Box 3315South Hackensack, NJ 07606www.mellon-investor.com
Stock Exchange Listing
NYSE Symbol: MAN
10-K Report
A copy of form 10-K filed with the Securities and Exchange Commission for the year endedDecember 31, 2000 is availablewithout charge after March 31,2001 by writing to:
Michael J. Van HandelManpower Inc.P.O. Box 20535301 N. Ironwood Rd.Milwaukee, WI 53201
Annual Meeting of Shareholders
May 1, 200110:00 a.m.Marcus Center for the Performing Arts929 N. Water St.Milwaukee, WI 53202
Shareholders
As of February 26, 2001, Manpower Inc. common stock was held by 6,102 record holders.
Directors
John R. Walter, ChairmanRetired President and COO of AT&TCorp. Former Chairman, President& CEO of R.R. Donnelley & Sons
Jeffrey A. JoerresPresident & Chief Executive OfficerManpower Inc.
Nancy BrinkerChairmanSusan G. Komen Breast Cancer Foundation
Dudley J. Godfrey, Jr.Senior PartnerGodfrey & Kahn, S.C.
Marvin B. GoodmanRetired Shareholder and Officer of Manpower Services(Toronto) Limited, formerly a Company franchise
J. Ira HarrisChairman of J.I. Harris & Associates and Vice Chairman ofThe Pritzker Organization, L.L.C.
Terry A. HuenekeExecutive Vice PresidentManpower Inc.
Newton N. MinowCounsel and former Partner of Sidley & Austin
Gilbert PalayRetired Senior Executive Vice President Manpower Inc.
Dennis StevensonChairman of Halifax plc and Pearson plc
Edward J. ZorePresidentNorthwestern Mutual
Officers
Jeffrey A. JoerresPresident & Chief Executive Officer
Terry A. HuenekeExecutive Vice PresidentThe Americas, Japan, Australia and the Far East
Michael J. Van HandelSenior Vice President & Chief Financial Officer
Executive Management
Michael GruneliusManaging DirectorFrance & Region
Yoav MichaelySenior Vice PresidentEurope, Middle East and Africa(Excluding France)
Dominique TurcqSenior Vice PresidentStrategic Planning
David ArklessSenior Vice PresidentManpower Inc. and Chief Executive The Empower Group
Tammy JohnsVice PresidentGlobal Accounts and Chairman Canadian Operations
Michael LynchVice President International Support and General Counsel
Corporate Information

98 Manpower Inc.
Principal Operating Units
Manpower Inc. provides a full range of staffing solutions
to more than 400,000 customers per year through nearly
3,700 offices in the 59 countries shown below.
In addition, Elan Group Ltd. is a fully-owned
subsidiary of Manpower Inc., headquartered in the United
Kingdom, that was acquired in 2000. It is a leading provider
of IT staffing solutions in the United Kingdom, Netherlands,
Ireland, Switzerland, Germany and Hong Kong.
The Empower Group is an independent operating
division of Manpower Inc. that provides organizational per-
formance consulting services to multi-national corporations
worldwide. It was launched in 2000 and is based in London.
The Empower Group has operations worldwide, with the
largest in Australia, New Zealand, United Kingdom and
the United States.
Brook Street Bureau is a fully-owned subsidiary
of Manpower Inc. in the United Kingdom. Its core business
is the supply of temporary, permanent and contract staff
to office, secretarial and light industrial positions.
Argentina
Australia
Austria
Belgium
Bolivia
Brazil
Canada
Chile
China (PRC)
Colombia
Costa Rica
Czech Republic
Denmark
Ecuador
El Salvador
Finland
France
Germany
Greece
Guatemala
Honduras
Hong Kong
Hungary
India
Ireland
Israel
Italy
Japan
Korea
Luxembourg
Malaysia
Mexico
Monaco
Morocco
Netherlands
New Caledonia
New Zealand
Norway
Panama
Paraguay
Peru
Philippines
Poland
Portugal
Puerto Rico
Reunion
Russia
Singapore
South Africa
Spain
Sweden
Switzerland
Taiwan
Thailand
Tunisia
United Kingdom
United States
Uruguay
Venezuela
All countries shown in blue are served by Manpower’s worldwide network of operations.

Des
ign
:Sa
ma
taM
aso
nM
ajor
Ph
otog
rap
hy
:Sa
nd
roC
EO
Por
trai
t:M
arc
No
rbe
rgP
rin
tin
g:H
. Ma
cDo
na
ld

International Headquarters
P.O. Box 2053
5301 North Ironwood Road
Milwaukee, Wisconsin 53201 USA
414.961.1000
www.manpower.com
AR
-10
3 (3
/01
)©
20
01
Ma
np
ow
er In
c.