manos matsaganis & panos tsakloglou athens university of economics fbbva microsimulation...
Post on 20-Dec-2015
213 views
TRANSCRIPT

Manos Matsaganis & Panos TsakloglouAthens University of Economics
FBBVA Microsimulation WorkshopMadrid 15-16 November 2004
Microsimulation and the analysis of poverty and inequality
an illustration

Microsimulation, poverty and inequality (1)
MS can help analyse the effect of policy changes
examine redistributive impact of current policies
explore impact of reforms vs. some baseline
answer counterfactual («what if»-type) questions
Microsimulation, poverty and inequality (2)
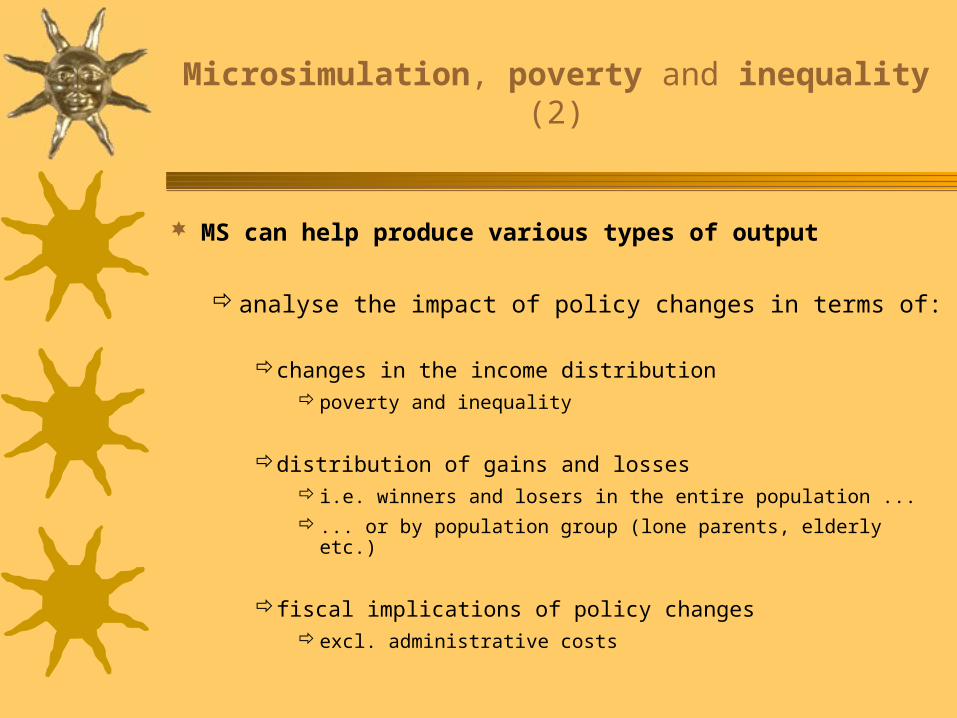
MS can help produce various types of output
analyse the impact of policy changes in terms of:
changes in the income distributionpoverty and inequality
distribution of gains and losses i.e. winners and losers in the entire population ... ... or by population group (lone parents, elderly etc.)
fiscal implications of policy changesexcl. administrative costs

Microsimulation, poverty and inequality (3)
MS can help calculate RRs and METRs
replacement ratesdoes work pay?
marginal effective tax ratespoverty trap?
unemployment trap?

Microsimulation, poverty and inequality (4)
MS can help disentangle separate effects
taxes and benefits interact
e.g. raising benefit rates will raise pre-tax incomes, so it may move recipients to a higher tax band ...
... while lowering taxes will raise pre-tax incomes, so it may cause recipients of income-tested benefits to lose eligibility
no other way to account (separately and jointly) for the effect of taxes and benefits on final disposable incomes

An illustration
Matsaganis M., O’Donoghue C., Levy H., Coromaldi M., Mercader-Prats M., Rodrigues C.F., Toso S., Tsakloglou P.
«Child poverty and family transfers in southern Europe»
Working Paper EM 2/04
Microsimulation Unit, University of Cambridge
http://www.econ.cam.ac.uk/dae/mu/emod.htm

1. Introduction
2. Data and methodology
3. Incidence of child poverty by household type
4. Distributional impact of family transfers
5. Simulating reforms
6. Discussion and policy implications

The paper
aims to assess the impact – of family transfers
– on child poverty
– in southern Europe
• Greece
• Italy
• Spain
• Portugal
using microsimulation
– the tax-benefit model EUROMOD

Family transfers
definition all income transfers to families with children
child benefits (non-contributory)
family allowances (contributory)
tax relief for dependent children
non-cash benefits (e.g. child care) not included

Child poverty
issue has risen to prominence
– poor children by definition “deserving”
– social costs of child poverty vs. benefits of early intervention
anti-poverty measures human capital investments high future returns!
political commitments
– Blair pledge to eliminate child poverty in Britain by 2020
– Commission proposal to halve child poverty in the EU by 2010 (not endorsed by the Council)

Southern Europe
tradition of “familialism”
strength of informal safety nets but are family resources adequate for intra-family redistribution?
subsidiary role of formal safety nets public assistance to families meagre / not available at all reliance of tax benefits what about those too poor to pay tax?
uneven coverage gaps in protection

1. Introduction
2. Data and methodology
3. Incidence of child poverty by household type
4. Distributional impact of family transfers
5. Simulating reforms
6. Discussion and policy implications

EUROMOD (1)
what is it? – a tax-benefit model for all 15 “old” EU members
construction funded by EC TSER / FP5 programmes 40 persons in 18 centres led by Cambridge University main objective: comparability
what can it do?– analyse policy changes in a comparative setting
examine impact of current policies explore impact of reforms answer “what if?”-type questions

EUROMOD (2)
what data does it rely upon? EC Household Panel (Greece / Spain / Portugal) Bank of Italy Survey of Household Income & Wealth
updated to 19982001 dataset in progress
what sort of policies does it simulate? income taxes, social contributions social assistance, housing, family, unemployment and
some social insurance benefits, e.g. social pensions1998 & 2001 rules applied2003 update in progress
EUROMOD (3)
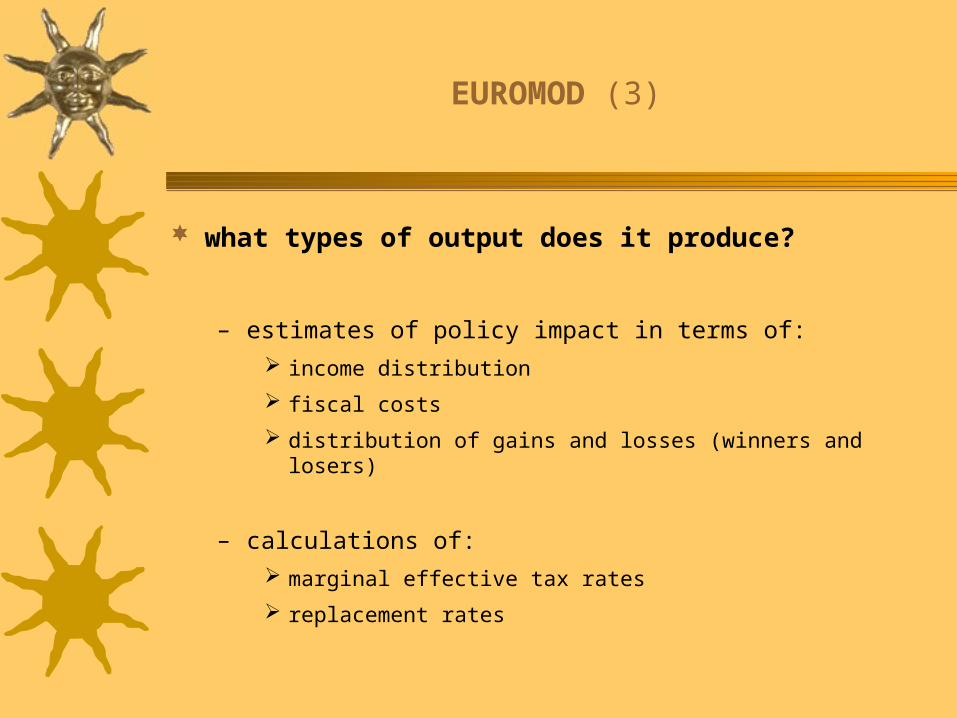
what types of output does it produce?
– estimates of policy impact in terms of: income distribution
fiscal costs
distribution of gains and losses (winners and losers)
– calculations of: marginal effective tax rates
replacement rates

EUROMOD (4)
temporary difficulties?
– no simulation of benefits in kind (publicly provided services)
– full tax compliance (no tax evasion)
– no targeting errors (100% take up / no leakage)
given sufficient effort (and funding), all of the above may be fully or partly amenable to treatment
EUROMOD (5)
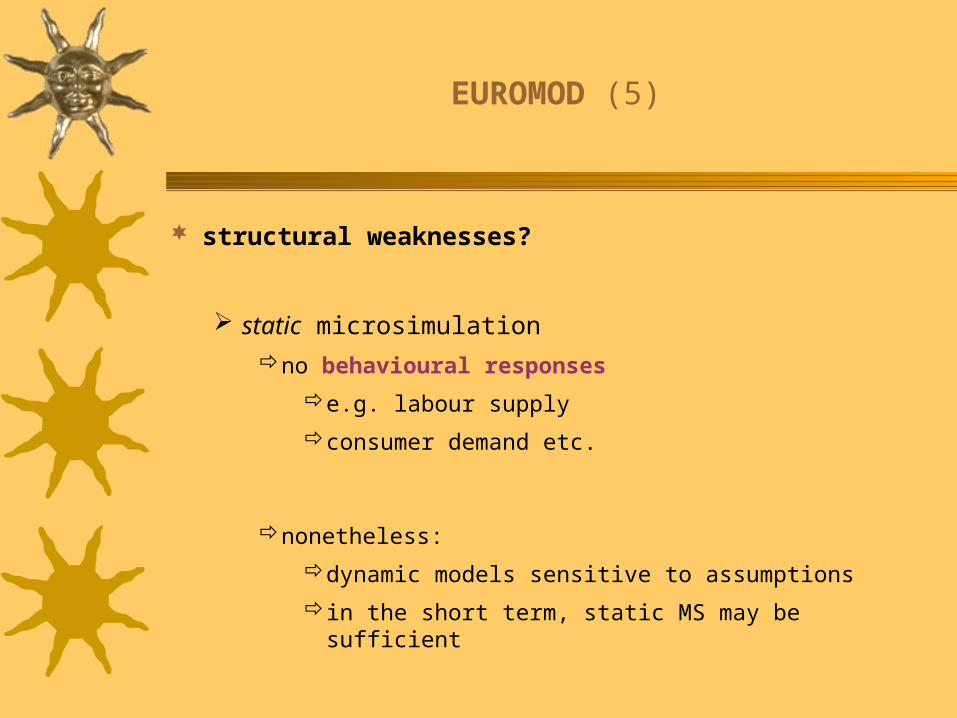
structural weaknesses?
static microsimulationno behavioural responses
e.g. labour supply
consumer demand etc.
nonetheless:
dynamic models sensitive to assumptions
in the short term, static MS may be sufficient

1. Introduction
2. Data and methodology
3. Incidence of child poverty by household type
4. Distributional impact of family transfers
5. Simulating reforms
6. Discussion and policy implications

Table 2a Child poverty rates
Greece Italy Spain Portugal
couple with 1 child 0-17 10.0 13.0 12.5 11.3
couple with 2 children 0-17 14.9 20.7 15.6 16.1
couple with 3+ children 0-17 12.0 37.0 33.8 35.7
lone parent: all children 0-17 42.2 49.0 45.2 56.6
lone parent: 1+ child 18+ 30.0 67.7 41.6 34.4
couple with 1+ child 18+ 18.3 36.0 30.2 21.2
other hh types with children 28.5 27.6 19.5 27.4
all households with children 17.0 26.5 21.6 23.1
all households 20.5 20.7 18.3 22.0

Table 2b Contribution to aggregate child poverty
Greece Italy Spain Portugal
couple with 1 child 0-17 8.6 7.8 8.4 7.9
couple with 2 children 0-17 39.3 30.7 29.6 21.4
couple with 3+ children 0-17 8.7 24.2 19.9 19.6
lone parent: all children 0-17 7.2 5.2 5.4 13.5
lone parent: 1+ child 18+ 2.1 3.0 3.1 2.0
couple with 1+ child 18+ 10.3 20.0 24.7 13.7
other hh types with children 23.8 9.3 9.0 21.9
all households with children 100.0 100.0 100.0 100.0

1. Introduction
2. Data and methodology
3. Incidence of child poverty by household type
4. Distributional impact of family transfers
5. Simulating reforms
6. Discussion and policy implications

Table 7a Estimated value of cash benefits
family size income Greece Italy Spain Portugal
1 child
low 88 250 36 191
middle 71 267 16 188
high 114 41 5 185
2 children
low 76 640 124 233
middle 72 390 9 202
high 131 29 2 182
3 children
low 319 569 165 227
middle 313 664 24 225
high 172 93 0 217
4+ children
low 327 177 203 254
middle 457 895 95 308
high 275 47 36 249

Table 7b Estimated value of tax relief
family size income Greece Italy Spain Portugal
1 child
low 67 188 114 80
middle 68 202 138 87
high 84 203 126 89
2 children
low 27 120 60 49
middle 71 165 158 86
high 79 159 176 96
3 children
low 11 85 42 38
middle 83 147 185 76
high 108 161 210 85
4+ children
low 47 71 0 24
middle 88 129 113 24
high 132 163 210 80

Graph 1 Concentration curves
Greece
0
20
40
60
80
100
0 20 40 60 80 100
Cumulative population share(by equivalent income)
Sh
are
cash benefits
tax relief
all family transfers
disposable income (net of familytransfers)line of perfectequality
I taly
0
20
40
60
80
100
0 20 40 60 80 100
Cumulative population share (by equivalent income)
Sh
are
cash benefits
tax relief
all family transfers
disposable income (net of familytransfers)line of perfectequality
Portugal
0
20
40
60
80
100
0 20 40 60 80 100
Cumulative population share (by equivalent income)
Sh
are
cash benefits
tax relief
all family transfers
disposable income (net of familytransfers)
line of perfectequality
Spain
0
20
40
60
80
100
0 20 40 60 80 100
Cumulative population share (by equivalent income)
Share
cash benefits
tax relief
all family transfers
disposable income (net of familytransfers)line of perfectequality

Table 11a Impact on child poverty rates
Greece Italy Spain Portugal
couple with 1 child 0-17 0.0 17.6 2.7 5.9
couple with 2 children 0-17 3.3 25.6 6.4 17.6
couple with 3+ children 0-17 32.0 23.4 7.8 34.6
lone parent: all children 0-17 4.1 14.1 4.4 9.8
lone parent: 1+ child 18+ 0.0 0.0 2.3 4.0
couple with 1+ child 18+ 5.5 10.1 5.7 14.4
other hh types with children 9.4 8.1 7.5 24.1
all households with children 8.1 19.0 7.3 20.8
Percentage reduction in the number of poor children due to current policies
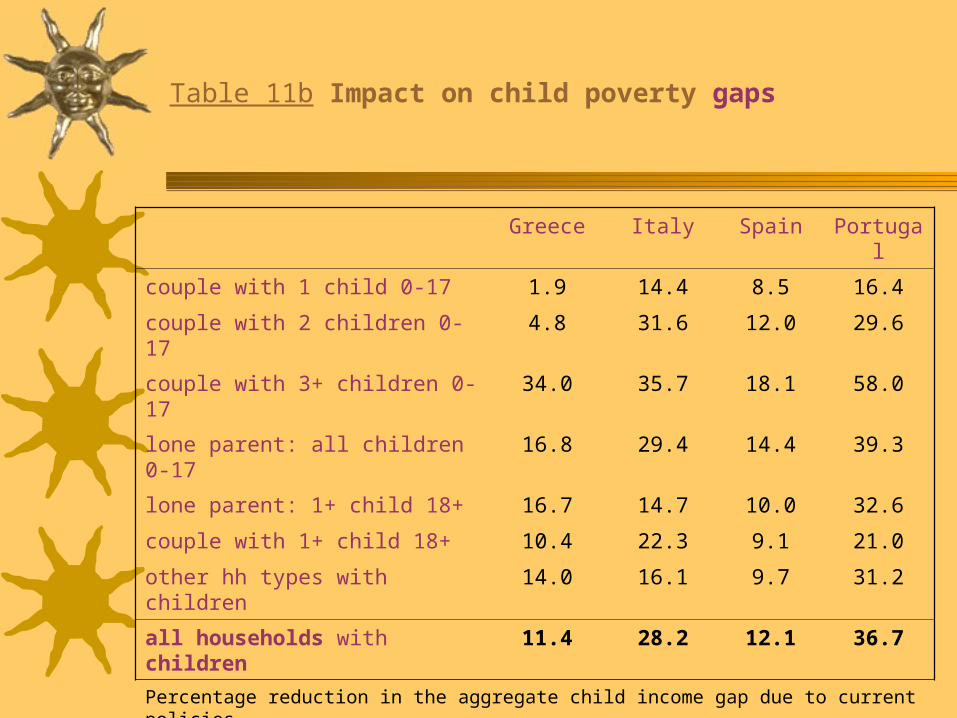
Table 11b Impact on child poverty gaps
Greece Italy Spain Portugal
couple with 1 child 0-17 1.9 14.4 8.5 16.4
couple with 2 children 0-17 4.8 31.6 12.0 29.6
couple with 3+ children 0-17 34.0 35.7 18.1 58.0
lone parent: all children 0-17 16.8 29.4 14.4 39.3
lone parent: 1+ child 18+ 16.7 14.7 10.0 32.6
couple with 1+ child 18+ 10.4 22.3 9.1 21.0
other hh types with children 14.0 16.1 9.7 31.2
all households with children 11.4 28.2 12.1 36.7
Percentage reduction in the aggregate child income gap due to current policies
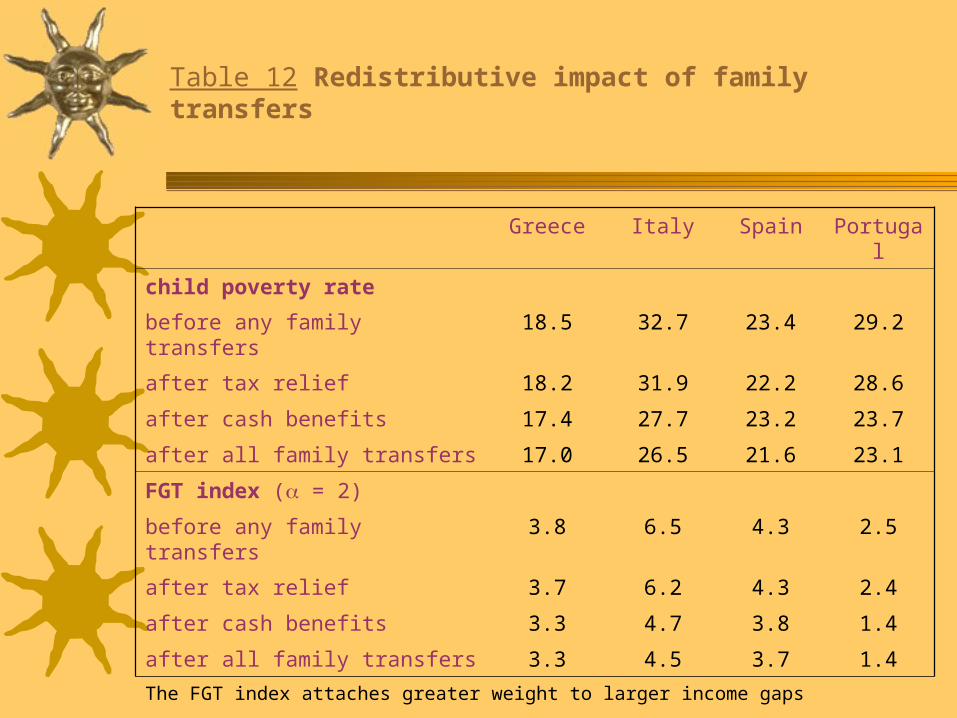
Table 12 Redistributive impact of family transfers
Greece Italy Spain Portugal
child poverty rate
before any family transfers 18.5 32.7 23.4 29.2
after tax relief 18.2 31.9 22.2 28.6
after cash benefits 17.4 27.7 23.2 23.7
after all family transfers 17.0 26.5 21.6 23.1
FGT index ( = 2)
before any family transfers 3.8 6.5 4.3 2.5
after tax relief 3.7 6.2 4.3 2.4
after cash benefits 3.3 4.7 3.8 1.4
after all family transfers 3.3 4.5 3.7 1.4
The FGT index attaches greater weight to larger income gaps

Figure 1 Target efficiency of social transfers
A
CB
D
post-transfer disposable income
pre-transfer disposable income
households ranked by income
PREA / A+B+C
PGEA / A+D
poverty line
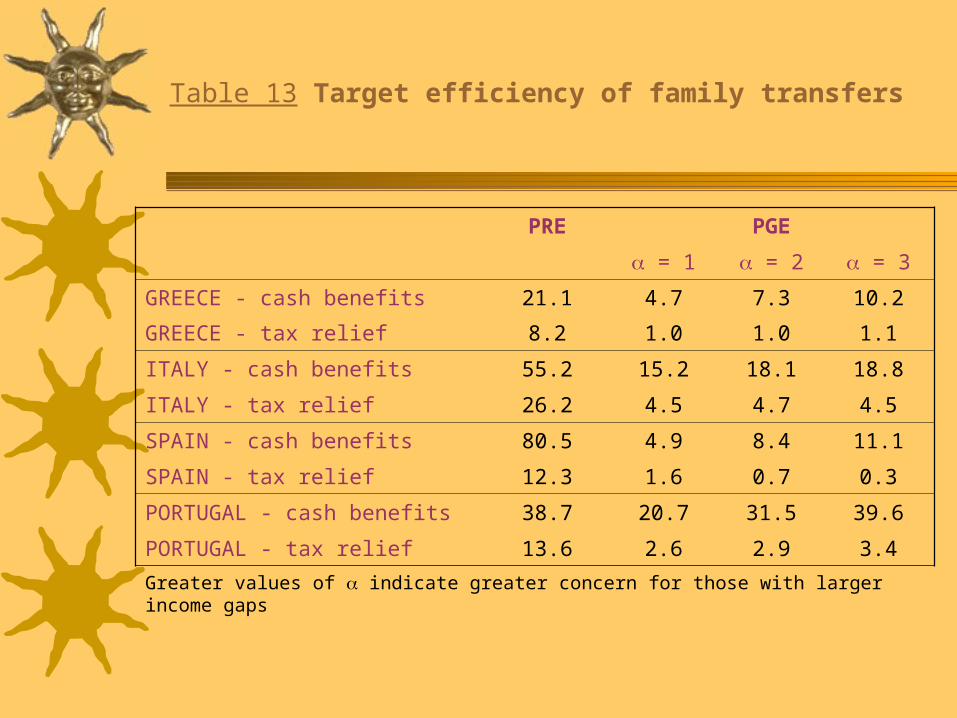
Table 13 Target efficiency of family transfers
PRE PGE
= 1 = 2 = 3
GREECE - cash benefits 21.1 4.7 7.3 10.2
GREECE - tax relief 8.2 1.0 1.0 1.1
ITALY - cash benefits 55.2 15.2 18.1 18.8
ITALY - tax relief 26.2 4.5 4.7 4.5
SPAIN - cash benefits 80.5 4.9 8.4 11.1
SPAIN - tax relief 12.3 1.6 0.7 0.3
PORTUGAL - cash benefits 38.7 20.7 31.5 39.6
PORTUGAL - tax relief 13.6 2.6 2.9 3.4
Greater values of indicate greater concern for those with larger income gaps

1. Introduction
2. Data and methodology
3. Incidence of child poverty by household type
4. Distributional impact of family transfers
5. Simulating reforms
6. Discussion and policy implications

Reforms (1)
reforming family transfers
abolish all current policies
introduce universal child benefits
what if ...?
Reforms (2)
why universal child benefits?
obvious solution to the problem of gaps in coverage ... though controversial
good for illustrationeasy to explainsimple to implement
Reforms (3)
which universal child benefits?
various issues involvedbenefit level
variation by age
variation by no. of children etc.
5 variations of UCB reform
2 “artificial” universal child benefits
poverty-neutral / budget-neutral
3 “actually existing” universal child benefits
British / Danish / Swedish schemes ...
... adjusted in terms of average male f-t earnings
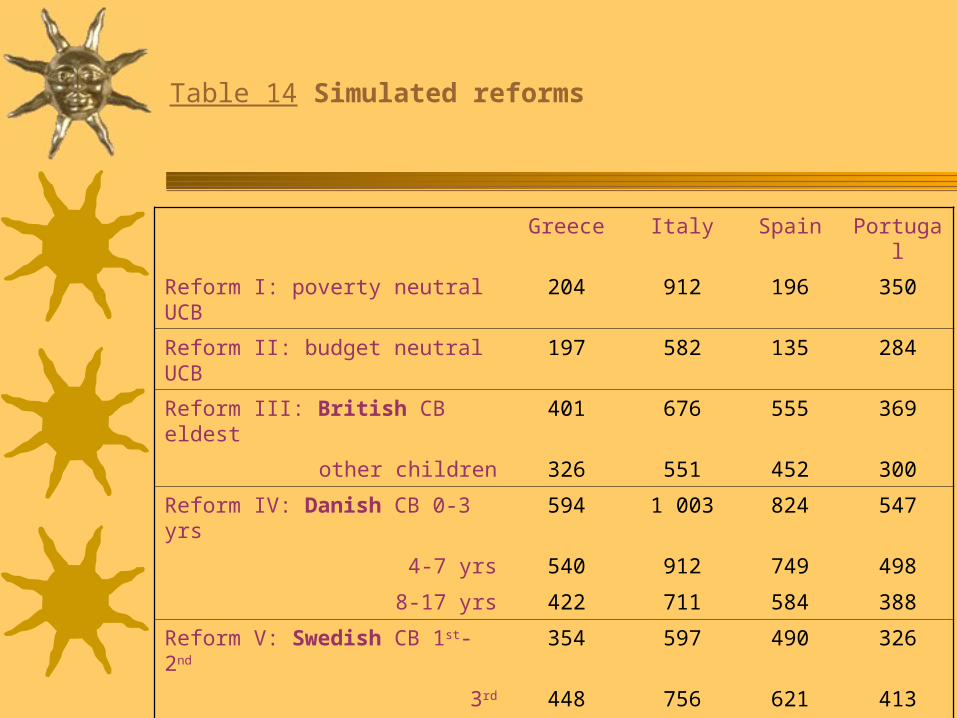
Table 14 Simulated reforms
Greece Italy Spain Portugal
Reform I: poverty neutral UCB 204 912 196 350
Reform II: budget neutral UCB 197 582 135 284
Reform III: British CB eldest 401 676 555 369
other children 326 551 452 300
Reform IV: Danish CB 0-3 yrs 594 1 003 824 547
4-7 yrs 540 912 749 498
8-17 yrs 422 711 584 388
Reform V: Swedish CB 1st-2nd 354 597 490 326
3rd 448 756 621 413
4th 637 1 074 883 586
5th+ 707 1 194 981 651
annual earnings male f-t employee 10 253 17 300 14 212 9 441
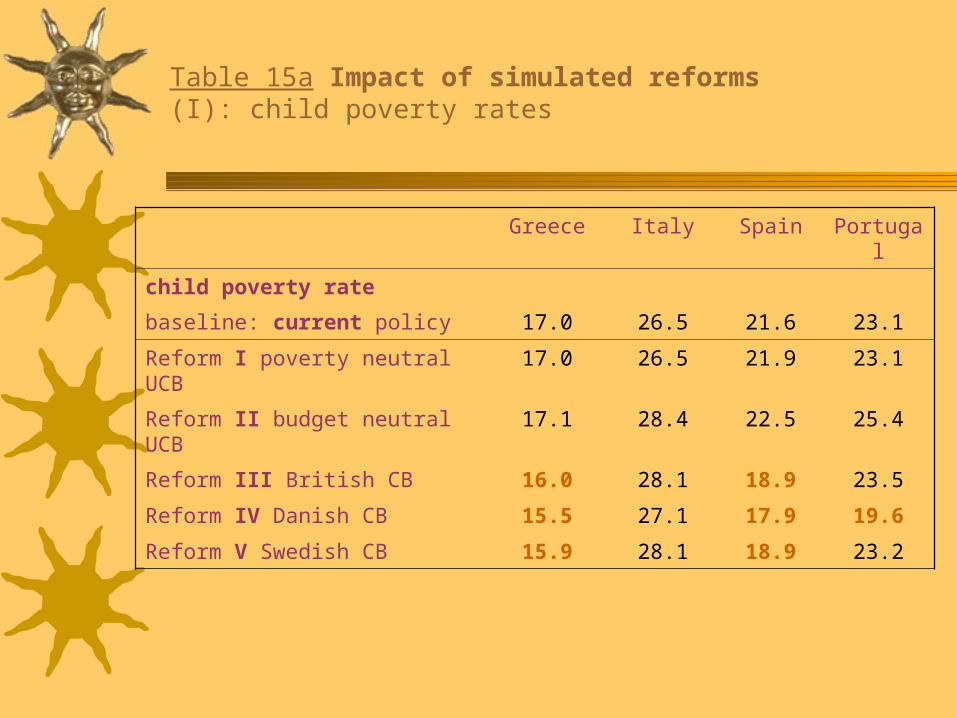
Table 15a Impact of simulated reforms(I): child poverty rates
Greece Italy Spain Portugal
child poverty rate
baseline: current policy 17.0 26.5 21.6 23.1
Reform I poverty neutral UCB 17.0 26.5 21.9 23.1
Reform II budget neutral UCB 17.1 28.4 22.5 25.4
Reform III British CB 16.0 28.1 18.9 23.5
Reform IV Danish CB 15.5 27.1 17.9 19.6
Reform V Swedish CB 15.9 28.1 18.9 23.2

Table 15b Impact of simulated reforms(II): intensity of child poverty
Greece Italy Spain Portugal
FGT index (α=2)
baseline: current policy 3.3 4.5 3.7 1.4
Reform I poverty neutral UCB 3.2 3.8 3.7 1.2
Reform II budget neutral UCB 3.2 4.7 3.9 1.3
Reform III British CB 2.8 4.6 3.0 1.3
Reform IV Danish CB 2.6 4.2 2.6 1.0
Reform V Swedish CB 2.8 4.5 2.9 1.2

Table 17 Winners vs. losersreform II (budget neutral CB)
Greece
0
10
2030
40
50
1 2 3 4 5 6 7 8 9 10
income decile
perc
ent
winners
losers
I taly
0
20
40
60
80
1 2 3 4 5 6 7 8 9 10
income decile
perc
ent
winners
losers
Spain
0
20
40
60
80
1 2 3 4 5 6 7 8 9 10
income decile
perc
ent
winners
losers
Portugal
0102030405060
1 2 3 4 5 6 7 8 9 10
income decile
perc
ent
winners
losers

Table 19 Winners vs. losersreform IV (Danish UCB)
Spain
010203040506070
1 2 3 4 5 6 7 8 9 10
income decile
per
cent
winners
losers
Greece
0102030405060
1 2 3 4 5 6 7 8 9 10
income decile
perc
en
t
winners
losers
Portugal
0
20
40
60
80
1 2 3 4 5 6 7 8 9 10
income decile
per
cent
winners
losers
Italy
0102030405060
1 2 3 4 5 6 7 8 9 10
income decile
perc
en
t
winners
losers
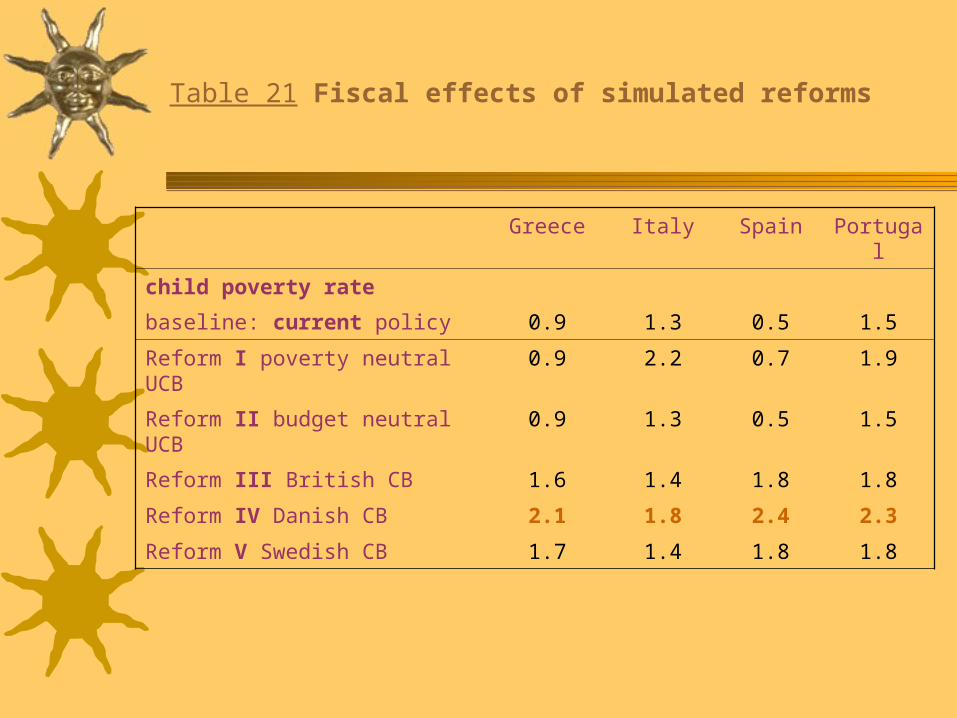
Table 21 Fiscal effects of simulated reforms
Greece Italy Spain Portugal
child poverty rate
baseline: current policy 0.9 1.3 0.5 1.5
Reform I poverty neutral UCB 0.9 2.2 0.7 1.9
Reform II budget neutral UCB 0.9 1.3 0.5 1.5
Reform III British CB 1.6 1.4 1.8 1.8
Reform IV Danish CB 2.1 1.8 2.4 2.3
Reform V Swedish CB 1.7 1.4 1.8 1.8

1. Introduction
2. Data and methodology
3. Incidence of child poverty by household type
4. Distributional impact of family transfers
5. Simulating reforms
6. Discussion and policy implications

Concluding remarks (1)
performance of family transfers modest
many poor families are ineligible for assistance (GR / IT)
... or receive low benefits (SP / PT)
non-refundable tax credits exclude poor families by design

Concluding remarks (2)
performance of UCBs disappointing?
replacing current policies by UCBs would not reduce the number of poor children by much – and could even increase it!
impact of UCBs weak or negative where current policies provide substantial benefits to a considerable subset of the low-income population (as in Italy)
Concluding remarks (3)
headcount poverty too severe a test for UCBs
where existing policies leave coverage gaps, those currently ineligible for assistance will be better off under a UCB even when they remain below the poverty line
headcount poverty rates cannot capture such improvements
bringing in the FGT index (implying more concern for those at the bottom of the income distribution) does more justice to the anti-poverty impact of UCBs

Concluding remarks (4)
not all UCBs are the same
the Danish UCB, paying higher amounts to younger children, emerges ahead of the others in terms of generosity and anti-poverty effectiveness
The British and the Swedish UCBs, though different in structure (the former paying a higher rate to the eldest child, the latter rising in value with family size) have similar effects on child poverty and fiscal costs

Concluding remarks (5)
playing field uneven
100% take up a reasonable assumption for universal benefits – not so for currrent income-tested policies
in favour of universal child benefits low administrative costsno stigmano adverse labour incentives (i.e. no poverty traps)
Concluding remarks (6)
the case for UCB wider
horizontal redistributionfrom single tax payers to families with childrenchildren a (partly) public good
social citizenshipaccess to certain benefits can be a citizen right
political economy considerationsnarrowly targeted programmes at risk of backlashsupport for universal programmes broader-based

Concluding remarks (7)
a basic trade off at work
more generous UCBs are more effective but costlier
but: current spending on family transfers far too low
hard to reduce poverty via internal reallocations alone

Concluding remarks (8)
way forward?
judiciously combine
a universal (even if low) income base ... to address the problem of gaps in coverage
to achieve horizontal redistribution
... with more targeted (non-categorical) interventions to direct extra resources to families in need
to improve effectiveness of both type I and II
Concluding remarks (9)
bring in services ...
there is more to fighting child poverty than cash benefits alone
universal access to affordable, good-quality family services a high priority
a child care guarantee a promising route out of poverty

Concluding remarks (10)
... but avoid the other extreme
services a complement of cash benefits, not a substitute
proper design of income transfers still relevant!

Concluding remarks (11)
the role of microsimulation: counterfactual
“what if”-type questions
involve interactions between benefits and taxes ...
... that are difficult to predict
only tax-benefit modelscan provide full answers to counterfactual questions
in spite of their limitations!
Concluding remarks (12)
the role of microsimulation: aid to policy making
a valuable tool to decision making
“informing” policy dilemmas
promoting a more rational and dispassionate debate on tax-benefit reform