manny and andrew
DESCRIPTION
Manny and Andrew. What is Starcraft II. RTS (real time strategy game) Made by Blizzard entertainment Came out in 2010 Sequel to original Starcraft (1998) Over 5 million copies sold. Competitive Starcraft. Starcraft is a huge competitive game - PowerPoint PPT PresentationTRANSCRIPT
Manny and Andrew
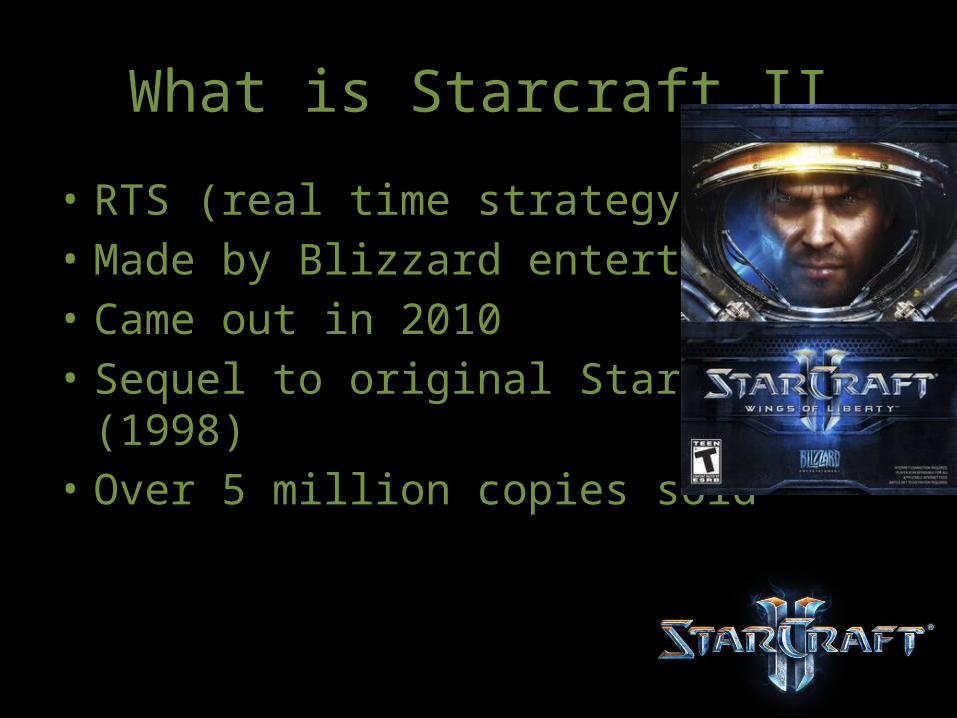
What is Starcraft II
• RTS (real time strategy game)• Made by Blizzard entertainment• Came out in 2010• Sequel to original Starcraft (1998)• Over 5 million copies sold
Competitive Starcraft
• Starcraft is a huge competitive game• Played in large tournaments for huge cash
prizes• Played all around the world• Especially in South Korea• Starcraft II starting to gain popularity, in the
current American MLG circuit
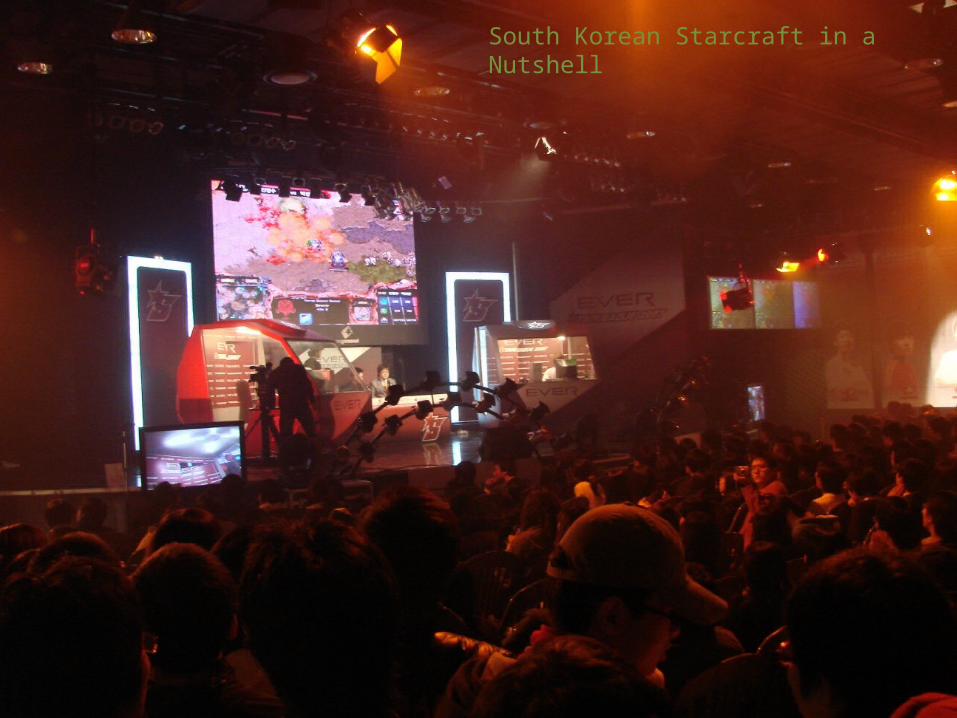
South Korean Starcraft in a Nutshell
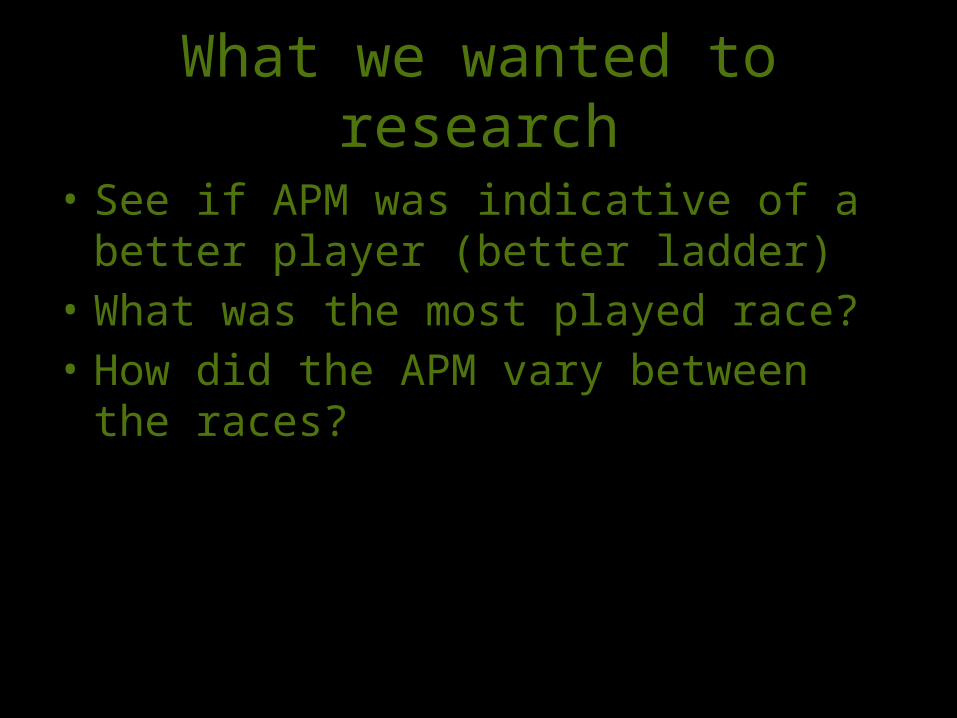
What we wanted to research
• See if APM was indicative of a better player (better ladder)
• What was the most played race?• How did the APM vary between the races?
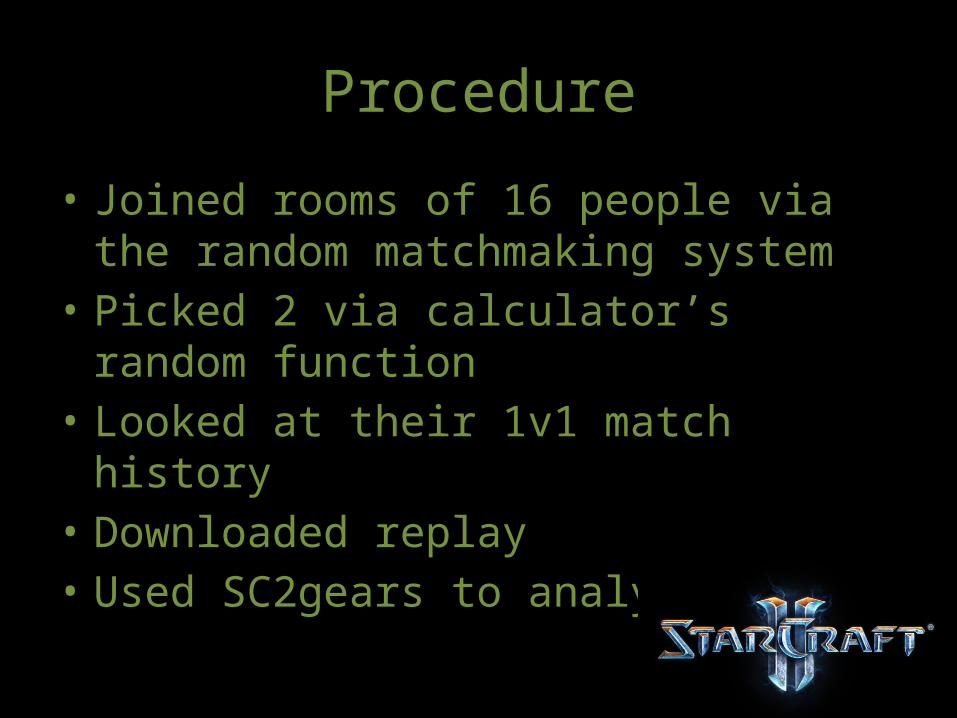
Procedure
• Joined rooms of 16 people via the random matchmaking system
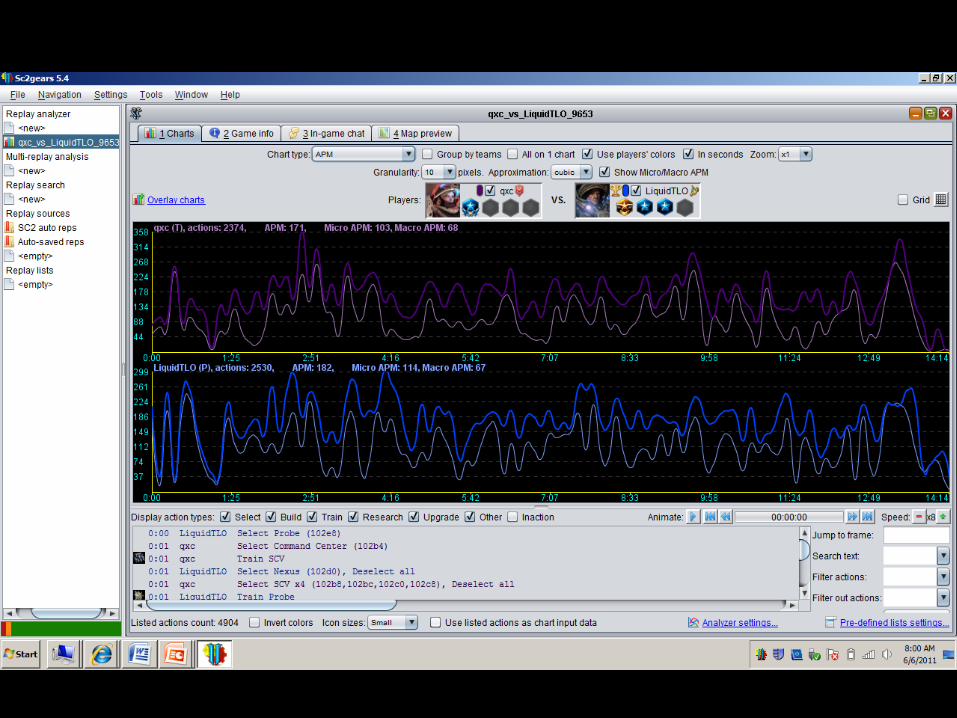
• Picked 2 via calculator’s random function • Looked at their 1v1 match history • Downloaded replay• Used SC2gears to analyze data
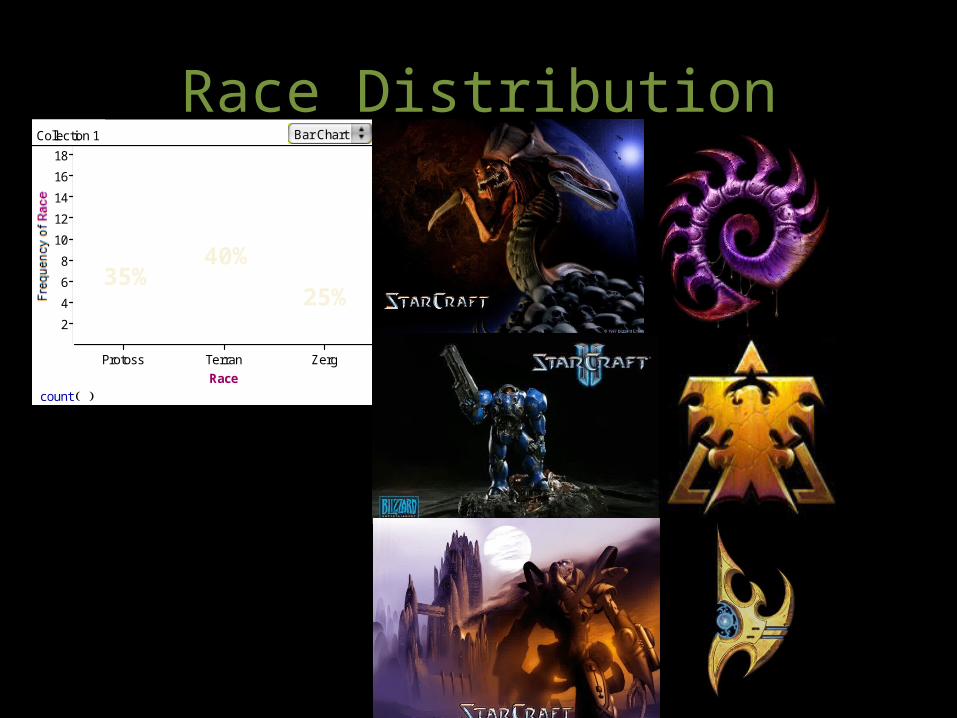
Race Distribution
2
4
6
8
10
12
14
16
18
Protoss Terran ZergRace
count
Collection 1 Bar Chart
40%
25%35%
Actions Per Minute
• APM: ‘Actions per minute’• Every time you do something (keystroke,
mouse click, etc)• http://www.youtube.com/watch?v=YbpCLqry
N-Q
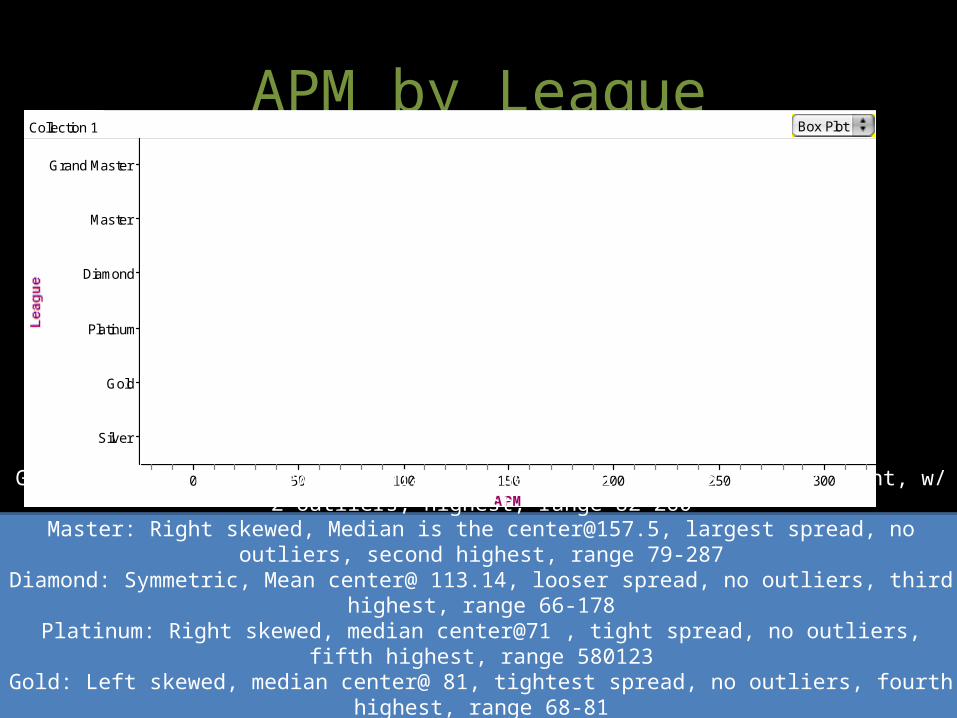
APM by LeagueGrand Master
Master
Diamond
Platinum
Gold
Silver
0 50 100 150 200 250 300APM
Collection 1 Box Plot
Grand master: Left skewed, median is the center @ 181.5, Fairly tight, w/ 2 outliers, highest, range 82-260Master: Right skewed, Median is the [email protected], largest spread, no outliers, second highest, range 79-287
Diamond: Symmetric, Mean center@ 113.14, looser spread, no outliers, third highest, range 66-178Platinum: Right skewed, median center@71 , tight spread, no outliers, fifth highest, range 580123Gold: Left skewed, median center@ 81, tightest spread, no outliers, fourth highest, range 68-81Silver: Symmetric, mean center@ 69.75, tight spread, no outliers, smallest center, range 54-83
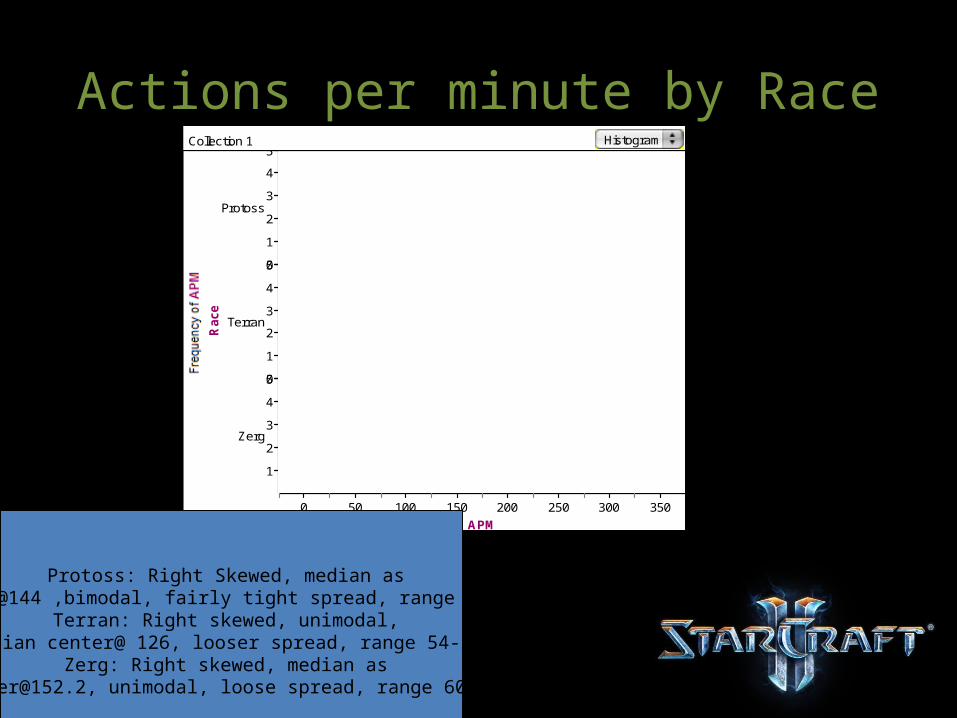
Actions per minute by Race
Rac
e
0
1
2
3
4
5
Protoss
0
1
2
3
4
5
Terran
1
2
3
4
5
Zerg
0 50 100 150 200 250 300 350APM
Collection 1 Histogram
Protoss: Right Skewed, median as Center@144 ,bimodal, fairly tight spread, range 58-227
Terran: Right skewed, unimodal, Median center@ 126, looser spread, range 54-287
Zerg: Right skewed, median as [email protected], unimodal, loose spread, range 60-271
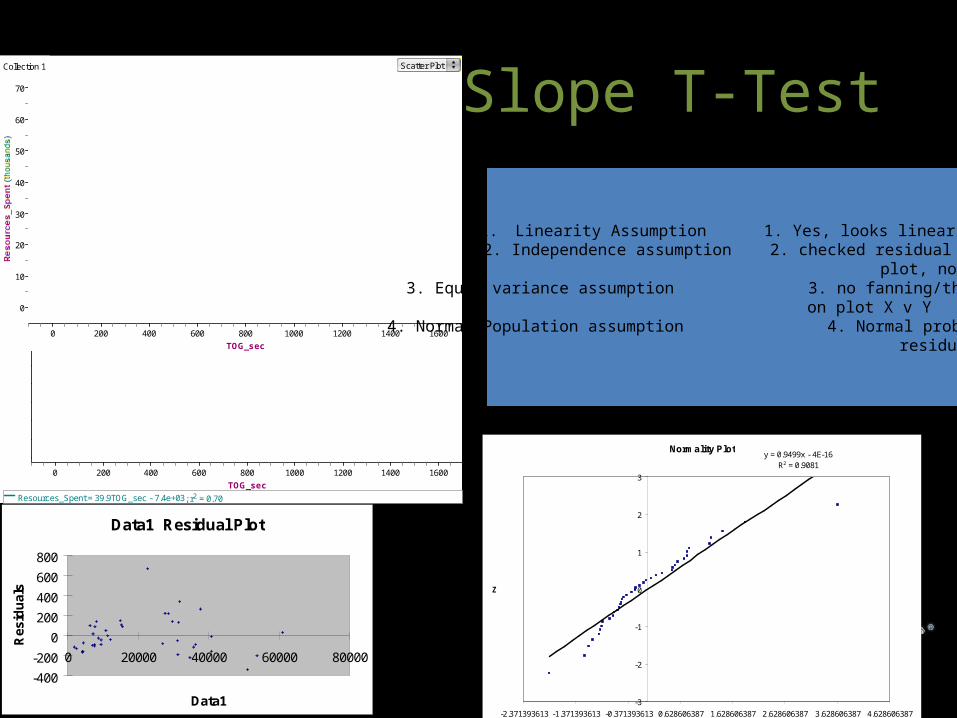
Regression Slope T-Test
,,::0
AHH
-30
-20
-10
0
10
20
0 200 400 600 800 1000 1200 1400 1600TOG_sec
0
10
20
30
40
50
60
70
0 200 400 600 800 1000 1200 1400 1600TOG_sec
Resources_Spent = 39.9TOG_sec - 7.4e+03; r2 = 0.70
Collection 1 Scatter Plot
1. Linearity Assumption 1. Yes, looks linear 2. Independence assumption 2. checked residual
plot, no pattern3. Equal variance assumption 3. no fanning/thickening
on plot X v Y4. Normal Population assumption 4. Normal prob. Plot of
residuals looks linear
Data1 Residual Plot
-400-200
0200400600800
0 20000 40000 60000 80000
Data1
Res
idua
ls
Normality Ploty = 0.9499x - 4E-16
R2 = 0.9081
-3
-2
-1
0
1
2
3
-2.371393613 -1.371393613 -0.371393613 0.628606387 1.628606387 2.628606387 3.628606387 4.628606387
Z
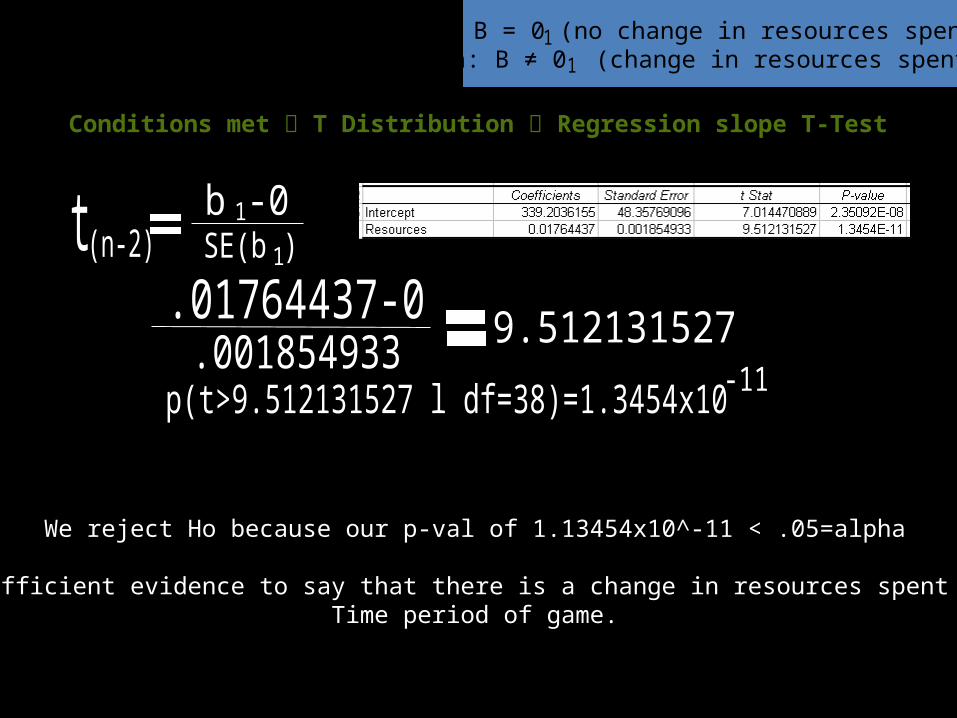
H0: Β = 0 (no change in resources spent) Ha: Β ≠ 0 (change in resources spent)
Conditions met T Distribution Regression slope T-Test
We reject Ho because our p-val of 1.13454x10^-11 < .05=alpha
We have sufficient evidence to say that there is a change in resources spent over the Time period of game.
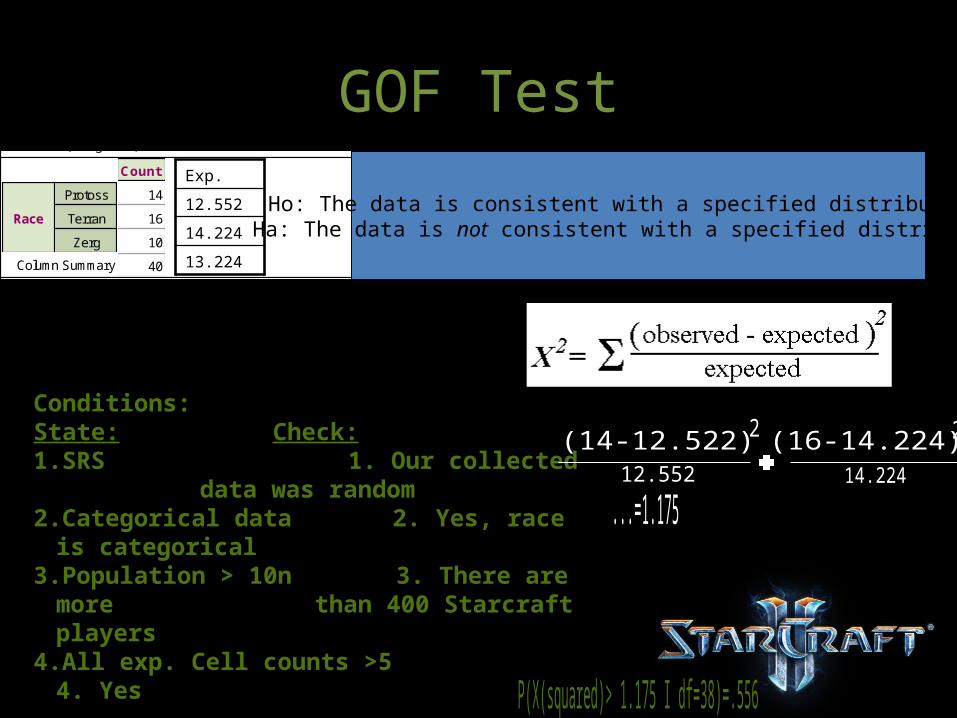
GOF TestAttribute: (categorical): Race
Attribute: RaceNumber of categories: 3Alternative hypothesis: Categories of Race are not equally likely
The test statistic, chi-square, is 1.4. There are 2 degrees of freedom (one less than the number of categories).
If it w ere true that the categories of Race were equally likely (the null hypothesis), and the sampling process w ere performed repeatedly, the probability of getting a value for chi-square this great or greater w ould be 0.5.
Column Summary
Count
Protoss
Terran
Zerg
Race
14
16
10
40
Conditions:State: Check:1.SRS 1. Our
collected data was random
2.Categorical data 2. Yes, race is categorical
3.Population > 10n 3. There are more than 400 Starcraft players
4.All exp. Cell counts >5 4. Yes
Exp.
12.552
14.224
13.224
Ho: The data is consistent with a specified distribution. Ha: The data is not consistent with a specified distribution.
• We fail to reject Ho because the p-value of .556>(alpha)=.05
• We have sufficient evidence to say that our sample races matches the race distribution of all Starcraft players
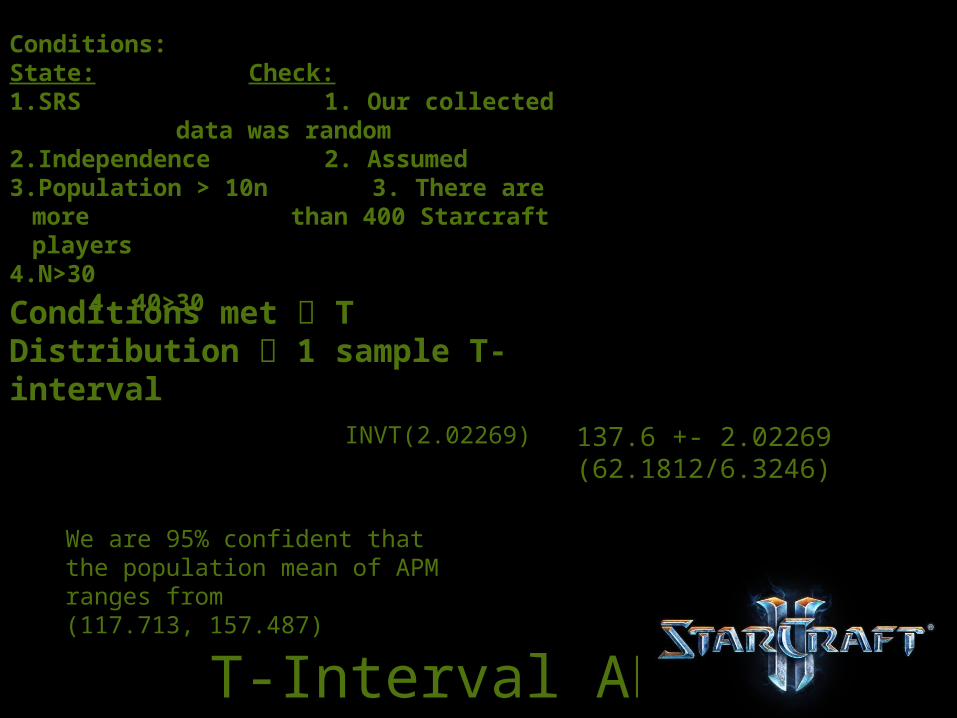
T-Interval APM
Conditions:State: Check:1.SRS 1. Our
collected data was random
2.Independence 2. Assumed3.Population > 10n 3. There are
more than 400 Starcraft players
4.N>30 4. 40>30Conditions met T Distribution 1 sample T-interval
137.6 +- 2.02269 (62.1812/6.3246)INVT(2.02269)
We are 95% confident that the population mean of APM ranges from(117.713, 157.487)
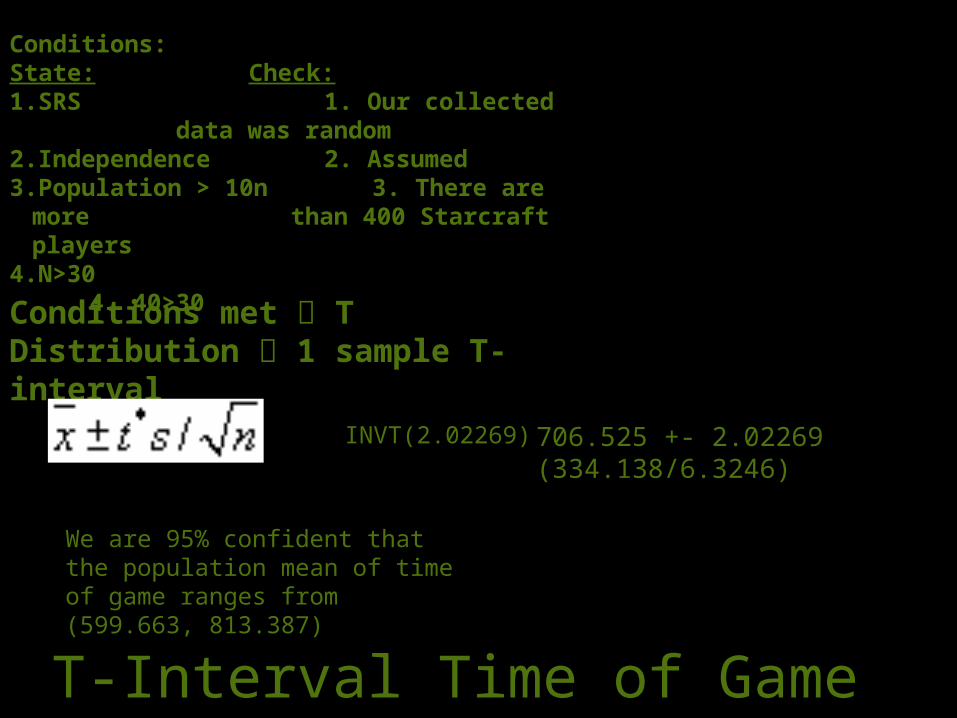
Conditions:State: Check:1.SRS 1. Our
collected data was random
2.Independence 2. Assumed3.Population > 10n 3. There are
more than 400 Starcraft players
4.N>30 4. 40>30Conditions met T Distribution 1 sample T-interval
INVT(2.02269) 706.525 +- 2.02269 (334.138/6.3246)
We are 95% confident that the population mean of time of game ranges from(599.663, 813.387)
T-Interval Time of Game
Bias/Error
• Different styles of keyboard (mechanical/rubber dome/scissor switch)
• Playing a different race for a little while• Undercoverage• ‘going easy’
Personal opinions
• Manny:– Blizzard fanboy– Love the competitive scene that it spawns– Believe APM is reflective of better players– APM based on race
• Andrew– Love the game– Also believe APM is reflective of better players– APM based on race as well
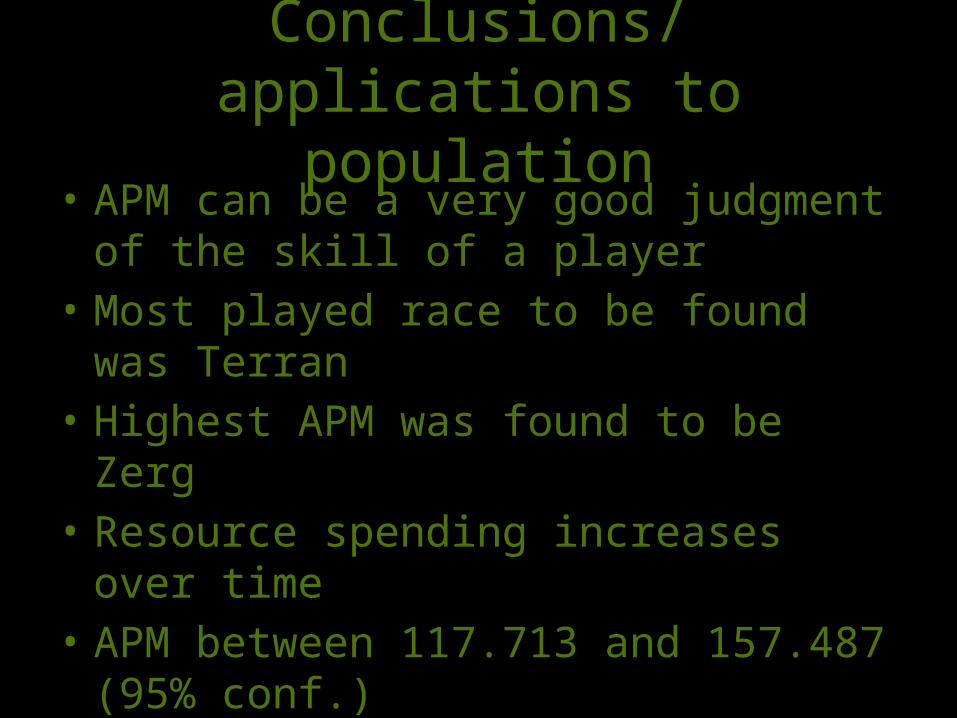
Conclusions/applications to population
• APM can be a very good judgment of the skill of a player
• Most played race to be found was Terran• Highest APM was found to be Zerg• Resource spending increases over time• APM between 117.713 and 157.487 (95%
conf.)• Time of game between 599.663 and 813.387
seconds (95% conf.)
Sources
• http://sites.google.com/site/sc2gears/ • http://www.sc2ranks.com/