manitoba provincial report - manitoba education and … provincial report tell them from me: ......
TRANSCRIPT

Manitoba Provincial Report
Tell Them From Me: Bullying and School Safety
2013/2014


2014Manitoba Education and Advanced Learning
M a n i t o b a P r o v i n c i a l r e P o r t
Tell Them From Me: Bullying and School Safety
2013/2014

Manitoba provincial report [electronic resource] : tell them from me : bullying and school safety. 2013/2014
Includes bibliographical references.
ISBN: 978-0-7711-5970-1
1. Bullying in schools—Manitoba—Statistics. 2. Harassment in schools—Manitoba—Statistics. 3. School violence—Manitoba—Statistics. I. Manitoba. Manitoba Education and Advanced Learning. 371.78097127
Copyright © 2014, the Government of Manitoba, represented by the Minister of Education and Advanced Learning.
Manitoba Education and Advanced Learning School Programs Division Winnipeg, Manitoba, Canada
Every effort has been made to acknowledge original sources and to comply with copyright law. If cases are identified where this has not been done, please notify Manitoba Education and Advanced Learning. Errors or omissions will be corrected in a future edition.
All images found in this document are copyright protected and should not be extracted, accessed, or reproduced for any purpose other than for their intended educational use in this document.
Schools are encouraged to share this document with parents, guardians, and communities, as appropriate.
This resource is available on the Manitoba Education and Advanced Learning website at <www.edu.gov.mb.ca/k12/safe_schools/>.
Websites are subject to change without notice.
Disponible en français.
Available in alternate formats upon request.

C o n t e n t s iii
c o n t e n t s
1. Introduction 1
1.1 What is Tell Them From Me? 3
Bullying and school safety theme 3
Thematic reports for schools and school divisions 4
1.2 Manitoba Education and Advanced Learning and Tell Them From Me 4
1.3 What happened in 2013/2014? 5
2. Presentation of the Data 7
2.1 The prevalence of bullying, overall
Elementary students 8
Secondary students 9
2.2 The prevalence of bullying, by type
Elementary students 10
Secondary students 11
2.3 How students respond to bullying, by type
Elementary students 12
Secondary students 13
2.4 How students respond when they see others being bullied
Elementary students 14
Secondary students 15
2.5 Where and when bullying occurs
Elementary students 16
Secondary students 17
2.6 Measures to prevent bullying
Elementary students 18
Secondary students 19
2.7 Students who feel excluded by their peers
Elementary students 20
Students who feel excluded by their peers (or unfairly treated by school staff)
Secondary students 21
2.8 Feeling safe at school
Elementary students 22
Secondary students 23
T e l l T h e m F r o m M e : B u l l y i n g a n d S c h o o l S a f e t y 2 0 1 3 / 2 0 1 4iv
2.9 Indicators of an unsafe environment
Elementary students 24
Secondary students 25
3.0 Sexual harassment at school (secondary students only) 26
3. Conclusions and Next Steps 27
4. Anti-Bullying Initiatives and Resources 31
References 35

M a n i t o b a P r o v i n c i a l r e P o r t
Tell Them From Me: Bullying and School Safety
1. Introduction


I n t r o d u c t i o n 3
1 . i n t r o d u c t i o n
The Province of Manitoba is committed to supporting school communities in providing safe and caring learning environments for all students. Since 2001, the government has issued a number of amendments to The Public Schools Act to promote safety in schools and establish respect for human diversity policies. Most recently, Bill 18, The Public Schools Amendment Act (Safe and Inclusive Schools), was proclaimed into law in September of 2013. In this act, bullying is “behaviour that is intended to cause, or should be known to cause, fear, intimidation, humiliation, distress or other forms of harm to another person’s body, feelings, self-esteem, reputation or property; or is intended to create, or should be known to create, a negative school environment for another person. Bullying may take place by any form of expression, including written, verbal or physical, or by means of any form of electronic communication (also referred to as cyber bullying), including social media, text messaging, or e-mail.”1 The Act requires that school boards expand their policies to address the issue of bullying, in all of its forms, and promote supportive and inclusive school environments.
1.1 What is Tell Them From Me?
Tell Them From Me (TTFM) is an online student survey, created by The Learning Bar (TLB), which allows students to provide their input into school improvement anonymously. Surveyed students are asked questions regarding their perceptions of the prevalence of bullying in the school, when and where bullying occurs, and what coping strategies they are most likely to use when they are bullied or see other students being bullied.
Bullying and school safety theme
The “bullying and school safety theme” is a focused 15-minute survey which includes questions and accompanying definitions about bullying, exclusion (a form of bullying), and school safety. Secondary students are asked additional questions regarding feeling unfairly treated by school staff and being sexually harassed. For most of the questions, students are asked to consider their answers on the basis of “the past four weeks.”
Bullying is defined by TLB as “behaviour where the same person has pushed or punched you more than once (physical bullying), called you names or teased you more than once (verbal bullying), told lies about you or tried to make you look bad more than once (social bullying), or used email or text messages to tease or threaten you more than once (cyber bullying) in the past four weeks. The bully usually has power over the person being bullied, such as when the bully is bigger or more popular. Sometimes a group of students will bully others.”2
__________1. The Public Schools Amendment Act (Bill 18, Safe and Inclusive Schools), S.M. 2013, c. 62. Tell Them From Me Elementary and Secondary Bullying & School Safety 2013-14, Student Survey
Questions.

T e l l T h e m F r o m M e : B u l l y i n g a n d S c h o o l S a f e t y 2 0 1 3 / 2 0 1 44
Exclusion is defined by TLB as “behaviour that makes a student feel left out by other students.”3
Sexual harassment is defined by TLB as “any unwanted or inappropriate language or touching that makes you feel upset, hurt, or angry. It can be verbal, such as comments about your body, sexual remarks, or the spreading of rumours about a person. It can be physical, such as touching, rubbing, pinching, or hugging in a sexual way. It can be a request for a sexual favour in return for something else. It can happen to both boys and girls.”4
Thematic reports for schools and school divisions
Following the administration of the elementary and secondary surveys, thematic reports are produced by TLB which provide valuable information for shaping effective learning strategies, reducing barriers to learning, and ensuring that schools and school divisions offer the safest and most welcoming environment for all students. In addition, participating schools can access TLB’s online interactive tool which allows them to look at the data in a variety of ways including by gender and by individual grade level, while maintaining student anonymity.
1.2 Manitoba Education and Advanced Learning and Tell Them From Me
TTFM is a critical component of the anti-bullying initiative supported by the province. A successful pilot project of TTFM was conducted in May and November of 2012 with over 8,000 students participating from grades 7 to 12. Given the widespread support of the student survey and TLB’s powerful interactive tools which provide schools and school divisions with survey data for school improvement in terms of bullying and school safety, Education and Advanced Learning entered into a 3-year agreement with TLB to include students from grades 4 to 12. Beginning in 2013/2014, schools will survey their students once or twice per school year in terms of the bullying and school safety theme. This will be repeated in the 2014/2015 and 2015/2016 school years.
A safe school environment is critical for students’ learning and well-being. Schools are safer when staff, students, parents, and community agencies work together to prevent bullying and exclusion. The TTFM provincial initiative is helping to bring bullying and school safety to the forefront in schools throughout Manitoba and providing school and school division administrators with reliable and timely data to support evidence-based practice.
__________3. Ibid.4. Ibid.

I n t r o d u c t i o n 5
1.3 What happened in 2013/2014?
QQ The Fall 2013 implementation of TTFM included 34 out of 37 school divisions.
QQ Over 84,000 students participated (approximately 30,000 students from grades 4 to 6 and 54,000 students from grades 7 to 12) from 525 schools in rural, urban, and northern Manitoba.
QQ Webinar sessions were provided by TLB for division and school coordinators. These sessions included an orientation to TTFM, training sessions for both new and returning division and school coordinators, and report features training for both new and returning division and school coordinators. Sessions were recorded to facilitate further access to the information required for the successful administration of the elementary and secondary student survey.
QQ TLB provided ongoing technical support for all participating schools.QQ Education and Advanced Learning provided a cost-sharing arrangement for
all participating school divisions and will continue to provide support in 2014/2015 and 2015/2016.
QQ Education and Advanced Learning and TLB worked in partnership to ensure the smooth administration of TTFM for grades 4 to 12 students across the province.
QQ Participating schools in the province now have baseline data on the rate, types, and locations of bullying affecting students in their schools, as well as their students’ feeling of safety at school.
Statements made by division coordinators:
QQ As a result of the TTFM data obtained from students, our school division is changing the structure of the change rooms in our schools to make them safer. As requested, individual cubicles are being installed to increase the privacy for each student. We have told our students that this change is occurring as a direct result of their responses to the survey. Our hope is that, if they see positive change happening as a result of their feedback, students will continue to take the TTFM survey seriously.
QQ What’s important about the TTFM survey is that it’s based in research and also provides a great collection of accompanying resources. It’s a tremendous opportunity to be a part of this initiative.
QQ As a direct result of our TTFM data, we have changed our break time supervision. Students identified that bullying was occurring in the canteen and in the stairwells during breaks and class changes. Teachers are now posted in the canteen and stairwells during break times and over lunch, and students are reporting that less bullying is occurring in these areas.
QQ With TTFM, we can listen to the views of our students directly. There is no doubt that the specificity of the data has helped our schools plan for targeted improvement. We learned that we had underestimated the incidence of
T e l l T h e m F r o m M e : B u l l y i n g a n d S c h o o l S a f e t y 2 0 1 3 / 2 0 1 46
bullying in unsupervised areas. We also learned about how troubled students are by verbal bullying, especially when it refers to their appearance or their grades. Trustees and senior administration have discussed the data and have set the priority in our divisional plan to: nurture positive and respectful relationships among students, teachers, school leaders, parents, and the community.
QQ Our schools, school division staff, and school board have used the data as part of our division and school plans. We have also implemented strategies to address bullying in our schools.
QQ For many years, our school division has supported safe schools and communities by listening to students tell us about issues of safety in their school experiences. The TTFM data has been an excellent resource for our school staff, providing us with timely information about safety and bullying in site-specific areas. Our schools are safer places to learn because of the strategies being used at the school level and the importance we are placing on student voice.
QQ TTFM is an extremely effective tool to collect data related to student voice. The data from TTFM is used for planning in our school division.

M a n i t o b a P r o v i n c i a l r e P o r t
Tell Them From Me: Bullying and School Safety
2. Presentation of the Data

T e l l T h e m F r o m M e : B u l l y i n g a n d S c h o o l S a f e t y 2 0 1 3 / 2 0 1 48
2 . P r e s e n t a t i o n o f t h e d a t a
The first implementation year of TTFM has provided Education and Advanced Learning with a starting point in terms of baseline data regarding the rates of bullying and school safety that exist within the province.
2.1 The prevalence of bullying, overall—Elementary students (Grades 4 to 6)
The percentage of students who report being victims of bullying is a useful school-level measure of the extent of bullying and its potential effects on youth. The provincial data includes students’ reports for all types and all frequencies of bullying. The results are shown in Figure 1.
Figure 1Percentage of elementary students who report being bullied in Manitoba
49% 47% 48%
0%
10%
20%
30%
40%
50%
60%
70%
80%
90%
100%
Boys Girls Overall
Percentage of students

P r e s e n t a t i o n o f t h e D a t a 9
2.1 The prevalence of bullying, overall—Secondary students (Grades 7 to 12)
The percentage of students who report being victims of bullying is a useful school-level measure of the extent of bullying and its potential effects on youth. The provincial data includes students’ reports for all types and all frequencies of bullying. The results are shown in Figure 2.
Figure 2Percentage of secondary students who report being bullied in Manitoba
33% 39%
36%
0%
10%
20%
30%
40%
50%
60%
70%
80%
90%
100%
Boys Girls Overall
Percentage of students

T e l l T h e m F r o m M e : B u l l y i n g a n d S c h o o l S a f e t y 2 0 1 3 / 2 0 1 410
2.2 The prevalence of bullying, by type—Elementary students (Grades 4 to 6)
Elementary students in Manitoba were asked to indicate if they had been victims of verbal, social, physical, or cyber bullying. The results are shown in Figures 3 to 6. Definitions for the types of bullying can be found on pages 3 and 4.
Figure 3 Prevalence of verbal bullying
36%
34%
34%
35%
36%
35%
64%
66%
66%
65%
64%
65%
0% 20% 40% 60% 80% 100%
Boys
Girls
Grade 6
Grade 5
Grade 4
Elementary
Percentage of students
Verbally bullied Never verbally bullied
Figure 4 Prevalence of social bullying
30%
31%
29%
31%
32%
31%
70%
69%
71%
69%
68%
69%
0% 20% 40% 60% 80% 100%
Boys
Girls
Grade 6
Grade 5
Grade 4
Elementary
Percentage of students
Socially bullied Never socially bullied
Figure 5 Prevalence of physical bullying
26%
16%
19%
21%
25%
22%
74%
84%
81%
79%
75%
78%
0% 20% 40% 60% 80% 100%
Boys
Girls
Grade 6
Grade 5
Grade 4
Elementary
Percentage of students
Physically bullied Never physically bullied
Figure 6 Prevalence of cyber bullying
7%
7%
7%
7%
7%
7%
93%
93%
93%
93%
93%
93%
0% 20% 40% 60% 80% 100%
Boys
Girls
Grade 6
Grade 5
Grade 4
Elementary
Percentage of students Cyber bullied Never cyber bullied

P r e s e n t a t i o n o f t h e D a t a 11
2.2 The prevalence of bullying, by type—Secondary students (Grades 7 to 12)
Secondary students in Manitoba were asked to indicate if they had been victims of verbal, social, physical, or cyber bullying. The results are shown in Figures 7 to 10. Definitions for the types of bullying can be found on pages 3 and 4.
Figure 7 Prevalence of verbal bullying
28%
28%
23%
25%
27%
29%
31%
31%
28%
72%
72%
77%
75%
73%
71%
69%
69%
72%
0% 20% 40% 60% 80% 100%
Boys
Girls
Grade 12
Grade 11
Grade 10
Grade 9
Grade 8
Grade 7
Secondary
Percentage of students
Verbally bullied Never or hardly ever verbally bullied
Figure 8 Prevalence of social bullying
19%
27%
20%
21%
23%
23%
24%
24%
23%
81%
73%
80%
79%
77%
77%
76%
76%
77%
0% 20% 40% 60% 80% 100%
Boys
Girls
Grade 12
Grade 11
Grade 10
Grade 9
Grade 8
Grade 7
Secondary
Percentage of students Socially bullied Never or hardly ever socially bullied
Figure 9 Prevalence of physical bullying
14%
10%
9%
10%
11%
12%
14%
16%
12%
86%
90%
91%
90%
89%
88%
86%
84%
88%
0% 20% 40% 60% 80% 100%
Boys
Girls
Grade 12
Grade 11
Grade 10
Grade 9
Grade 8
Grade 7
Secondary
Percentage of students Physically bullied Never or hardly ever physically bullied
Figure 10 Prevalence of cyber bullying
11%
15%
12%
12%
13%
14%
14%
12%
13%
89%
85%
88%
88%
87%
86%
86%
88%
87%
0% 20% 40% 60% 80% 100%
Boys
Girls
Grade 12
Grade 11
Grade 10
Grade 9
Grade 8
Grade 7
Secondary
Percentage of students Cyber bullied Never or hardly ever cyber bullied

T e l l T h e m F r o m M e : B u l l y i n g a n d S c h o o l S a f e t y 2 0 1 3 / 2 0 1 412
2.3 How students respond to bullying, by type—Elementary students (Grades 4 to 6)
Elementary students in Manitoba who reported being bullied were asked to indicate how they responded the last time they were bullied. The results are shown in Figures 11 to 14.Note: Anecdotal data gathered from the response “Do something else” is only available to school divisions.
Figure 11 Response to being verbally bullied
18%
22%
24%
29%
29%
39%
42%
55%
0% 20% 40% 60% 80% 100%
Do something else
Fight back
Try to talk to the bully
Ignore it
Stand up to the bully
Tell a friend
Tell a teacher at school
Tell a parent or guardian
Percentage of students
Figure 12 Response to being socially bullied
18%
22%
24%
29%
31%
40%
43%
56%
0% 20% 40% 60% 80% 100%
Do something else
Fight back
Try to talk to the bully
Ignore it
Stand up to the bully
Tell a friend
Tell a teacher at school
Tell a parent or guardian
Percentage of students
Figure 13 Response to being physically bullied
19%
23%
26%
28%
30%
38%
43%
55%
0% 20% 40% 60% 80% 100%
Do something else
Try to talk to the bully
Fight back
Ignore it
Stand up to the bully
Tell a friend
Tell a teacher at school
Tell a parent or guardian
Percentage of students
Figure 14 Response to being cyber bullied
23%
24%
26%
27%
31%
39%
41%
56%
0% 20% 40% 60% 80% 100%
Do something else
Try to talk to the bully
Fight back
Ignore it
Stand up to the bully
Tell a friend
Tell a teacher at school
Tell a parent or guardian
Percentage of students
P r e s e n t a t i o n o f t h e D a t a 13
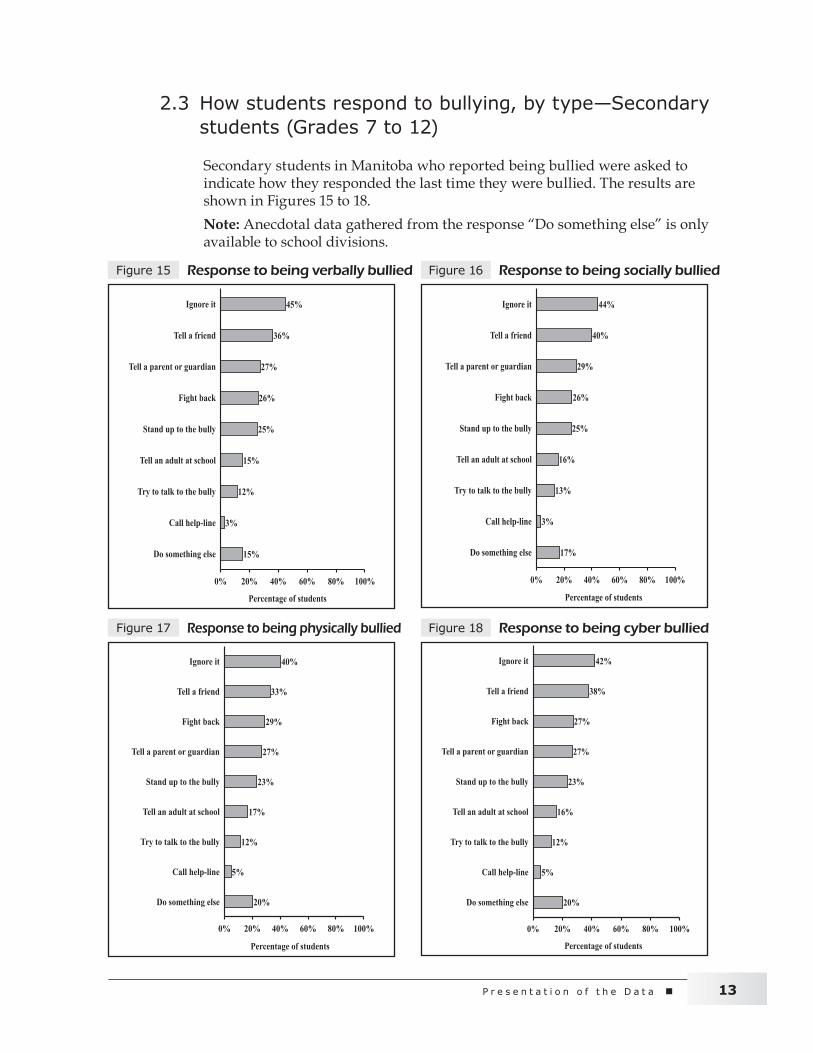
2.3 How students respond to bullying, by type—Secondary students (Grades 7 to 12)
Secondary students in Manitoba who reported being bullied were asked to indicate how they responded the last time they were bullied. The results are shown in Figures 15 to 18.Note: Anecdotal data gathered from the response “Do something else” is only available to school divisions.
Figure 15 Response to being verbally bullied
15%
3%
12%
15%
25%
26%
27%
36%
45%
0% 20% 40% 60% 80% 100%
Do something else
Call help-line
Try to talk to the bully
Tell an adult at school
Stand up to the bully
Fight back
Tell a parent or guardian
Tell a friend
Ignore it
Percentage of students
Figure 16 Response to being socially bullied
17%
3%
13%
16%
25%
26%
29%
40%
44%
0% 20% 40% 60% 80% 100%
Do something else
Call help-line
Try to talk to the bully
Tell an adult at school
Stand up to the bully
Fight back
Tell a parent or guardian
Tell a friend
Ignore it
Percentage of students
Figure 17 Response to being physically bullied
20%
5%
12%
17%
23%
27%
29%
33%
40%
0% 20% 40% 60% 80% 100%
Do something else
Call help-line
Try to talk to the bully
Tell an adult at school
Stand up to the bully
Tell a parent or guardian
Fight back
Tell a friend
Ignore it
Percentage of students
Figure 18 Response to being cyber bullied
20%
5%
12%
16%
23%
27%
27%
38%
42%
0% 20% 40% 60% 80% 100%
Do something else
Call help-line
Try to talk to the bully
Tell an adult at school
Stand up to the bully
Tell a parent or guardian
Fight back
Tell a friend
Ignore it
Percentage of students

T e l l T h e m F r o m M e : B u l l y i n g a n d S c h o o l S a f e t y 2 0 1 3 / 2 0 1 414
2.4 How students respond when they see others being bullied—Elementary students (Grades 4 to 6)
Elementary students in Manitoba were asked to indicate how they responded the last time they saw another student being bullied. The results are shown in Figure 19.
Note: Anecdotal data gathered from the response “Do something else” is only available to school divisions.
Figure 19 Response to seeing others being bullied
26%
28%
36%
48%
51%
54%
58%
62%
67%
69%
70%
0% 20% 40% 60% 80% 100%
Do something else
Do not do anything
Help victim to fight back
Try to talk to the bully
Tell a parent or guardian
Make effort to include victim
Encourage victim to ignore it
Tell a friend
Tell a teacher at school
Stand up for the victim
Comfort the victim
Percentage of students

P r e s e n t a t i o n o f t h e D a t a 15
2.4 How students respond when they see others being bullied—Secondary students (Grades 7 to 12)
Secondary students in Manitoba were asked to indicate how they responded the last time they saw another student being bullied. The results are shown in Figure 20.
Note: Anecdotal data gathered from the response “Do something else” is only available to school divisions.
Figure 20 Response to seeing others being bullied
15%
22%
26%
26%
29%
34%
41%
45%
48%
50%
66%
0% 20% 40% 60% 80% 100%
Do something else
Tell an adult at school
Try to talk to the bully
Help victim to fight back
Tell a parent or guardian
Do not do anything
Make effort to include victim
Stand up for the victim
Encourage victim to ignore it
Comfort the victim
Tell a friend
Percentage of students

T e l l T h e m F r o m M e : B u l l y i n g a n d S c h o o l S a f e t y 2 0 1 3 / 2 0 1 416
2.5 Where and when bullying occurs—Elementary students (Grades 4 to 6)
Elementary students in Manitoba were asked to indicate where and when bullying happened most often in and near their school. The results are shown in Figures 21 and 22.
Figure 21 Where bullying occurs
2%
12%
17%
17%
23%
26%
30%
41%
61%
0% 20% 40% 60% 80% 100%
Library or computer room
Lunch room or cafeteria
Classrooms
Gym
Washrooms
On the bus
Change rooms or locker rooms
Hallways
Outside of the school
Percentage of students
Figure 22 When bullying occurs
15%
16%
31%
35%
55%
73%
0% 20% 40% 60% 80% 100%
During classes
During after-school activities
Before school
During lunch
After school
During recess
Percentage of students

P r e s e n t a t i o n o f t h e D a t a 17
2.5 Where and when bullying occurs—Secondary students (Grades 7 to 12)
Secondary students in Manitoba were asked to indicate where and when bullying happened most often in and near their school. The results are shown in Figures 23 and 24.
Figure 23 Where bullying occurs
13%
18%
19%
19%
21%
37%
60%
61%
0% 20% 40% 60% 80% 100%
Gym
On the bus
Lunch room
Classrooms
Washrooms
Locker rooms
Outside of the school
Hallways
Percentage of students
Figure 24 When bullying occurs
19%
24%
28%
40%
58%
66%
0% 20% 40% 60% 80% 100%
During school clubs/sports
During classes
Before school
Between classes
During break periods
After school
Percentage of students

T e l l T h e m F r o m M e : B u l l y i n g a n d S c h o o l S a f e t y 2 0 1 3 / 2 0 1 418
2.6 Measures to prevent bullying—Elementary students (Grades 4 to 6)
School policies and practices can help prevent student bullying. Elementary students in Manitoba were asked to what extent anti-bullying measures were practised in their school. The results are shown in Figure 25.
Figure 25 Perception regarding school measures to prevent bullying
8%
6%
6%
5%
4%
4%
3%
3%
8%
9%
8%
7%
4%
4%
3%
2%
24%
22%
20%
16%
15%
13%
12%
9%
31%
30%
28%
28%
34%
29%
33%
28%
29%
32%
38%
45%
44%
50%
49%
57%
0% 20% 40% 60% 80% 100%
Teachers can identify bullying.
Teachers provide adequate supervision.
There are clear consequences for bullying.
Teachers step in quickly.
There are safe ways to report bullying.
Teachers inform students what to do when they are
bullied.
Teachers help students understand bullying.
There are adults at school that victims can talk to.
Percentage of students
Strongly disagree Disagree Neither agree nor disagree Agree Strongly agree

P r e s e n t a t i o n o f t h e D a t a 19
2.6 Measures to prevent bullying—Secondary students (Grades 7 to 12)
School policies and practices can help prevent student bullying. Secondary students in Manitoba were asked to what extent anti-bullying measures were practised in their school. The results are shown in Figure 26.
Figure 26 Perception regarding school measures to prevent bullying
12%
10%
10%
9%
9%
8%
8%
7%
13%
13%
12%
10%
9%
8%
8%
5%
31%
31%
26%
27%
26%
25%
24%
19%
32%
33%
34%
35%
37%
40%
42%
43%
12%
13%
18%
18%
19%
19%
19%
26%
0% 20% 40% 60% 80% 100%
Staff can identify bullying.
Staff provide adequate supervision.
Staff step in quickly.
There are clear consequences for bullying.
Staff inform students about what to do when they are bullied.
Staff help students understand bullying.
There are safe ways to report bullying.
There are adults at school that victims can talk to.
Percentage of students
Strongly disagree Disagree Neither agree nor disagree Agree Strongly agree

T e l l T h e m F r o m M e : B u l l y i n g a n d S c h o o l S a f e t y 2 0 1 3 / 2 0 1 420
2.7 Students who feel excluded by their peers—Elementary students (Grades 4 to 6)
Elementary students were asked to indicate if they felt excluded by their peers because of their ethnic or cultural background, gender, social class, religion, disability, or other perceived categorical boundaries. The results in Figure 27 show the percentages of elementary students in Manitoba who have felt excluded by their peers for various reasons.
Note: Anecdotal data gathered from the response “Other reasons” is only available to school divisions.
Figure 27 Reasons students feel excluded by their peers
15%
7%
8%
8%
9%
9%
10%
14%
19%
0% 20% 40% 60% 80% 100%
Other reasons
Aboriginal background
Skin colour
Ethnic or cultural background
Language background
Religion or faith
A disability
Low or high grades
Appearance
Percentage of students

P r e s e n t a t i o n o f t h e D a t a 21
2.7 Students who feel excluded by their peers or treated unfairly by school staff—Secondary students (Grades 7 to 12)
Secondary students were asked to indicate if they felt excluded by their peers because of their ethnic or cultural background, gender, social class, religion, disability, or other perceived categorical boundaries. The results in Figure 28 show the percentages of secondary students in Manitoba who have felt excluded by their peers or treated unfairly by school staff for various reasons.
Note: Anecdotal data gathered from the response “Other reasons” is only available to school divisions.
Figure 28Reasons students feel excluded by their peers or treated unfairly by staff
6%
5%
5%
5%
5%
5%
5%
6%
5%
8%
16%
9%
6%
7%
7%
7%
9%
9%
9%
10%
21%
18%
0% 20% 40% 60% 80% 100%
Other reasons
Sexual orientation
A disability
Language background
Aboriginal background
Ethnic or cultural background
Religion or faith
Skin colour
Level of family income
Appearance
Low or high grades
Percentage of students
Excluded by their peers Treated unfairly by school staff

T e l l T h e m F r o m M e : B u l l y i n g a n d S c h o o l S a f e t y 2 0 1 3 / 2 0 1 422
2.8 Feeling safe at school—Elementary students (Grades 4 to 6)
Elementary students were asked to indicate whether they felt safe at school, and felt safe going to and from school. The results are shown in Figure 29.
Figure 29 A feeling of safety
4%
4%
4%
4%
4%
4%
12%
14%
13%
26%
28%
27%
55%
50%
51%
0% 20% 40% 60% 80% 100%
Feeling safe going home from school
Feeling safe at school
Feeling safe going to school
Percentage of students Strongly disagree Disagree Neither agree nor disagree Agree Strongly agree

P r e s e n t a t i o n o f t h e D a t a 23
2.8 Feeling safe at school—Secondary students (Grades 7 to 12)
Secondary students were asked to indicate whether they felt safe at school, and felt safe going to and from school. The results are shown in Figure 30.
Figure 30 A feeling of safety
5%
6%
5%
4%
5%
4%
15%
18%
14%
43%
43%
44%
33%
29%
33%
0% 20% 40% 60% 80% 100%
Feeling safe going home from school
Feeling safe at school
Feeling safe going to school
Percentage of students Strongly disagree Disagree Neither agree nor disagree Agree Strongly agree

T e l l T h e m F r o m M e : B u l l y i n g a n d S c h o o l S a f e t y 2 0 1 3 / 2 0 1 424
2.9 Indicators of an unsafe environment—Elementary students (Grades 4 to 6)
Based on six other questions regarding elementary students’ responses about feeling safe at school, indicators of an unsafe environment are shown in Figure 31.
Figure 31 Indicators of an unsafe environment
3%
9%
18%
25%
36%
44%
0% 20% 40% 60% 80% 100%
Give money to someone who threatens to hurt you
Stay at home because you feel unsafe
Are in a physical fight
Have something stolen at school
Hear students make threats to another student
See a fight on school property where someone gets hurt
Percentage of students

P r e s e n t a t i o n o f t h e D a t a 25
2.9 Indicators of an unsafe environment—Secondary students (Grades 7 to 12)
Based on six other questions regarding secondary students’ responses about feeling safe at school, indicators of an unsafe environment are shown in Figure 32.
Figure 32 Indicators of an unsafe environment
3%
6%
8%
14%
16%
25%
0% 20% 40% 60% 80% 100%
Give money to someone who threatens to hurt you
Stay at home because you feel unsafe
Are in a physical fight
Have something stolen at school
See a fight on school property where someone gets hurt
Hear students make threats to another student
Percentage of students

T e l l T h e m F r o m M e : B u l l y i n g a n d S c h o o l S a f e t y 2 0 1 3 / 2 0 1 426
3.0 Sexual harassment at school—Secondary students (Grades 7 to 12)
Secondary students were presented with a definition of sexual harassment and asked if they had felt sexually harassed at school. The results are shown in Figure 33. Those who felt they had been sexually harassed were also asked to indicate how they had responded. The results are shown in Figure 34.
Note: Anecdotal data gathered from the response “Do something else” is only available to school divisions.
Figure 33 Prevalence of sexual harassment
10%
10%
11%
10%
12%
10%
9%
7%
10%
90%
90%
89%
90%
88%
90%
91%
93%
90%
0% 20% 40% 60% 80% 100%
Boys
Girls
Grade 12
Grade 11
Grade 10
Grade 9
Grade 8
Grade 7
Overall
Percentage of students
Felt sexually harassed Did not feel sexually harassed
Figure 34 Response to being sexually harassed
24%
7%
10%
14%
19%
29%
29%
33%
33%
0% 20% 40% 60% 80% 100%
Do something else
Make formal complaint
Tell an adult at school
Tell a parent or guardian
Blame oneself
Tell person it is inappropriate
Give clear message to stop
Tell a friend
Do not do anything about it
Percentage of students

M a n i t o b a P r o v i n c i a l r e P o r t
Tell Them From Me: Bullying and School Safety
3. Conclusions and Next Steps


C o n c l u s i o n s a n d N e x t S t e p s 29
3 . c o n c l u s i o n s a n d n e x t s t e P s
Conclusion no. 1
The province-wide implementation of Tell Them From Me (TTFM) in 2013/2014 has been a success. School divisions now have baseline data to guide decisions which will improve student learning and promote safe and welcoming school environments for all students.
Next steps
QQ Education and Advanced Learning will continue to work in partnership with The Learning Bar to support school divisions and provide them with the tools they need to collect and interpret important information from students regarding bullying and school safety.
QQ Education and Advanced Learning will continue to provide funding to school divisions until the end of June 2016 in support of their participation in Tell Them From Me, a critical component of the department’s Anti-Bullying Action Plan.
QQ Using the Manitoba Professional Learning Environment (Maple), Education and Advanced Learning will continue to collaborate with school divisions to discuss and share programs, resources, and strategies that address bullying and school safety.
QQ Education and Advanced Learning will continue to assist school divisions in professional learning activities related to bullying and safe schools.
QQ Education and Advanced Learning will continue to support school divisions in planning for the provision of safe and caring schools using a whole-school approach.
Conclusion no. 2
The analysis of the provincial raw data collected through the TTFM student survey indicates an overall high prevalence in verbal, social, and physical bullying, and a lower prevalence in cyber bullying.
Next steps
QQ Along with the Manitoba Association of Parent Councils, Education and Advanced Learning will continue to work with partner organizations such as Children and Youth Opportunities, Safe Schools Manitoba, the Canadian Red Cross, and Kids Help Phone, to share resources that will support parents. These resources will include information on recognizing
T e l l T h e m F r o m M e : B u l l y i n g a n d S c h o o l S a f e t y 2 0 1 3 / 2 0 1 430
the warning signs associated with bullying and understanding the effects of bullying, and will increase awareness regarding the assistance that can be provided by the school and the community. Support will be provided to help parents communicate with their child about bullying, in general, and how to respond appropriately when their child is experiencing cyber bullying
QQ Education and Advanced Learning and Children and Youth Opportunities will continue to work with our partners to assist teachers and school administrators in recognizing when and where bullying is taking place, learning about the importance of increased supervision in high-risk areas, responding appropriately and effectively to reports of bullying, and planning and implementing strategies that make schools safer.
QQ Education and Advanced Learning will refresh the Literacy with ICT (Implementation and Communication Technology) Across the Curriculum Initiative with an emphasis on digital citizenship and addressing issues of bullying using information and communication technologies.

M a n i t o b a P r o v i n c i a l r e P o r t
Tell Them From Me: Bullying and School Safety
4. Anti-Bullying Initiatives and Resources


A n t i - B u l l y i n g I n i t i a t i v e s a n d R e s o u r c e s 33
4 . a n t i - b u l l y i n g i n i t i a t i v e s a n d r e s o u r c e s
Education and Advanced Learning has been working for a number of years to ensure that all students have access to a quality education in safe and caring learning environments. Please visit the Safe and Caring Schools website at <www.edu.gov.mb.ca/k12/safe_schools/index.html> for a list of current provincial partnerships and services, publications, and resources for school-wide programming.

T e l l T h e m F r o m M e : B u l l y i n g a n d S c h o o l S a f e t y 2 0 1 3 / 2 0 1 434

M a n i t o b a P r o v i n c i a l r e P o r t
Tell Them From Me: Bullying and School Safety
References


R e f e r e n c e s 37
Manitoba Education and Advanced Learning. “Safe and Caring Schools.” 2014. <www.edu.gov.mb.ca/k12/safe_schools/index.html>.
Manitoba Laws. “The Public Schools Amendment Act (Safe and Inclusive Schools)”. Bill 18, 2nd Session, 40th Legislature, 2013. Available online at <web2.gov.mb.ca/laws/statutes/2013/c00613e.php>.
Tell Them From Me School Surveys. Preconfigured Surveys: Bullying and School Safety. Elementary and Secondary Student Surveys, 2014. Available online at <www.thelearningbar.com>.

T e l l T h e m F r o m M e : B u l l y i n g a n d S c h o o l S a f e t y 2 0 1 3 / 2 0 1 438

