manitoba hydro 2017/18 & 2018/19 general rate application
TRANSCRIPT
Corporates: Utilities & Independent Power November 25, 2016
Rating Report
The Manitoba Hydro-Electric Board
Debt Rating TrendLong-Term Obligations A (high) Stable
Short-Term Obligations R-1 (middle) Stable
Note: These Obligations are based on the status of the Manitoba Hydro-Electric Board as a Crown agent of the Province of Manitoba and the unconditional guarantee provided by the Province on Manitoba Hydro’s third-party debt, and thus reflect the Province’s debt ratings.
Ratings
Rating UpdateDBRS Limited (DBRS) has updated its report on the Manitoba Hydro-Electric Board (Manitoba Hydro or the Utility). The ratings assigned to the Utility’s Long-Term Obligations and Short-Term Obligations are a flow-through of the ratings of the Province of Manitoba (the Province; rated A (high) and R-1 (middle) with Stable trends by DBRS). Pursuant to The Manitoba Hydro Act, the Province unconditionally guaran-tees almost all of Manitoba Hydro’s outstanding third-party debt (please see the DBRS Criteria: Guarantees and Other Forms of Support methodology for further details). The Province also pro-vides most of the Utility’s financing through provincial advances (approximately 99% of total debt as at March 31, 2016). DBRS considers Manitoba Hydro to be self-supporting, as it is able to fund its own operations and service debt obligations.
In early 2016, Manitoba Hydro engaged the Boston Consulting Group to conduct a review of its financial, operating and capi-tal plans, with particular focus on the Bipole III Transmission Reliability Project (Bipole III), the Keeyask Infrastructure and Generating Station Project (the Keeyask Project) and the Manitoba-Minnesota Transmission Project (MMTP). The re-sults, issued in September 2016 (the BCG Report), concluded
that although the decision to proceed with the Keeyask Project was imprudent as some major risks were not fully considered, the best path forward was to continue construction on all three projects. The BCG Report noted, however, that total cost over-runs of $1 billion could occur along with possible delays to the in-service dates of 12 months for Bipole III and 21 months for the Keeyask Project. The BCG Report also noted the rising le-verage at the Utility as a result of the substantial capex; debt-to-capital at Manitoba Hydro had risen to 83% at F2016 and had been expected to peak at 88%, significantly above the target capi-tal structure of 75% debt. A new board appointed at Manitoba Hydro in 2016 intends to limit the deterioration in the Utility’s balance sheet. As a result, the Utility has begun reviewing initia-tives to help alleviate pressure on its key financial ratios, such as improving operational efficiencies, requesting annual rate increases higher than the previously planned 3.95%, as well as a potential equity injection from the Province. DBRS sees these initiatives, if actualized, as positive to Manitoba Hydro’s finan-cial profile, as they will provide some financial flexibility for the Utility, especially in the event of adverse drought conditions or further cost overruns on the projects.
The Manitoba Hydro-Electric Board, a wholly owned Crown corporation of the Province of Manitoba, is a vertically integrated electric utility that provides generation, transmission and distribution of electricity to approximately 567,634 customers throughout Manitoba, and natural gas service to approximately 276,858 customers via its subsidiary, Centra Gas Manitoba Inc. The Utility also exports electricity to more than 25 electric utilities through its participation in four wholesale markets in Canada and in the Midwestern United States.
Issuer Description
Financial InformationThe Manitoba Hydro-Electric Board For the year ended March 31 1
(CAD millions where applicable) 2016 2015 2014 2013 2012Total debt in capital structure 2 83.0% 81.3% 79.4% 78.5% 77.9%Cash flow/Total debt 5.4% 5.3% 6.4% 6.1% 6.3%EBIT gross interest coverage (times) 0.91 1.07 0.96 0.89 0.80 Net income before non-recurring items 55 145 178 92 61 Cash flow from operations 791 665 691 589 567 1 2015 to 2016 based on IFRS; 2012 to 2014 based on Canadian GAAP. 2 Adjusted for other comprehensive income.
Tom Li+1 416 597 7378
Ravikanth Rai+1 416 597 7388
Continued on P. 2
Manitoba Hydro 2017/18 & 2018/19 General Rate Application Apendix 4.4
1 of 40
Available in accessible formats upon request

Corporates: Utilities & Independent Power November 25, 2016
Rating Report | The Manitoba Hydro-Electric Board DBRS.COM 2
Rating Considerations
Strengths
1. Debt is a direct obligation of the ProvinceManitoba Hydro is an agent of the Crown, and its debt securities, except for $65 million of Manitoba Hydro-Electric Board Bonds (less than 1% of total debt at March 31, 2016), are held or guaran-teed by the Province; therefore, the ratings assigned to Manitoba Hydro’s obligations are a flow-through of the ratings assigned to the Province.
2. Low-cost hydro-based generationLow-cost hydroelectric-based generating capacity results in one of the lowest variable cost structures in North America, which has enabled Manitoba Hydro to provide electricity to its domestic customers at one of the lowest rates on the continent. This gives the Utility the flexibility to increase rates in the future, especially in light of the substantially heightened capex requirements.
3. Access to export marketsManitoba Hydro’s interconnections (approximately 43% of installed capacity), with firm export transfer capability of 2,100 megawatts (MW) to the United States, 175 MW to Saskatchewan and 200 MW to Ontario, along with additional non-firm transfer capability, provide the Utility with access to favourable export markets. The interconnections also provide a secure supply of electricity for domestic customers during times of poor hydrology.
Challenges
1. High leverageLeverage at Manitoba Hydro has been increasing over the past years as a result of the significant capital projects currently be-ing undertaken. As such, the debt-to-capital ratio reached 83% at F2016, above the target capital structure of 75% debt. The Utility had forecast leverage to peak at 88% when the Keeyask Project is brought in service, but with the possibility of cost overruns and delays detailed in the BCG Report for Bipole III and the Keeyask Project, leverage could potentially further increase if mitigants are not enacted. The Utility is currently reviewing potential ini-tiatives, such as requesting higher rate increases or an equity in-jection from the Province, which could help alleviate pressure on its key financial ratios.
2. High level of planned capexThe Utility is currently undergoing a period of substantial capex, with major projects that include Bipole III (total capex of ap-proximately $4.65 billion) and the Keeyask Project (total capex of approximately $6.5 billion). As a result, capex for the Utility had been forecast to average approximately $2.4 billion per year before falling to $900 million beginning in F2022. However, the BCG Report notes that total capex for Bipole III could increase to $5 billion, while the Keeyask Project could reach $7.8 billion. As such, average capex for the medium term may continue to climb and further pressure the already high debt levels.
3. Hydrology riskGiven that approximately 92% of Manitoba Hydro’s installed generating capacity is hydroelectricity-based, earnings and cash flows are highly sensitive to hydrological conditions. The Utility is also exposed to significant price and volume risk because of its export commitments under the fixed price-to-volume contract, which may require the Utility to procure power supply from im-port markets if hydrological conditions are unfavourable.
DBRS continues to view Manitoba Hydro as self-supporting, as its earnings and cash flows continue to be sufficient to cover its operating expenses and to service its outstanding debt. However, DBRS could consider reclassifying a portion of the Utility’s debt to be tax-supported should the financial health of the Utility de-teriorate to the point where its expenses cannot be recovered
through rates. If this were to occur, it could potentially put downward pressure on the Province’s credit rating. Similarly, a large equity injection by the Province that materially increases tax-supported debt could also put downward pressure on the Province’s credit profile. At this time, however, DBRS expects the Province’s ratings to remain stable.
Rating Update (CONTINUED)
Manitoba Hydro 2017/18 & 2018/19 General Rate Application Apendix 4.4
2 of 40
Corporates: Utilities & Independent Power November 25, 2016
Rating Report | The Manitoba Hydro-Electric Board DBRS.COM 3
Major Projects (Under Construction and Planned)
• Bipole III: This project involves the construction of a 500-kilovolt (kV) high-voltage direct current transmission line, along with new converter stations. Construction began during winter 2013/2014, and the transmission line is expect-ed to be in service for 2018. The BCG Report noted that the cost for the project may increase to approximately $5 billion with the in-service date delayed until mid-2019.
• Keeyask Project: This project includes the development of a 695 MW generation station on the Nelson River. Construction began in July 2014; the first generator is expected to be in ser-vice for 2019 and the remaining units are expected to be in service by 2021. The BCG Report noted that the cost for the project may increase to approximately $7.8 billion with the in-service date delayed until mid-2021.
• MMTP: This proposed project involves the construction of a 500 kV alternating current transmission line from Winnipeg to the Manitoba-Minnesota border, where it will interconnect with the Great Northern Transmission Line (GNTL) to be built by Minnesota Power. The Province authorized Manitoba Hydro to proceed with the project in July 2014, and the Utility filed an Environmental Impact Statement in September 2015, which began the formal regulatory review process. Minnesota Power has received all major regulatory approvals for the GNTL including a Presidential Permit, and expects to start construction early in 2017.
ProjectEstimated Cost
($ millions)Planned Construction
Start DateIn-Service
Target DateBipole III Transmission Reliability Project 4,650 2013 2019
Keeyask Infrastructure and Generating Station Projects 6,500 2014 2021
Manitoba-Minnesota Transmission Project 450 2017 mid-2020
Manitoba Hydro 2017/18 & 2018/19 General Rate Application Apendix 4.4
3 of 40

Corporates: Utilities & Independent Power November 25, 2016
Rating Report | The Manitoba Hydro-Electric Board DBRS.COM 4
F2016 Summary• Earnings declined in F2016 as milder winter temperature for
the period reduced revenues from both the domestic electric and natural gas segments, while depreciation and interest ex-pense rose from the continued high capex.
� This was slightly offset by a 3.95% rate increase effective August 1, 2015.
F2017 Outlook• Manitoba Hydro has forecast earnings in F2017 to remain
low, with expected net income of approximately $25 million. While rates increased by 3.36% effective August 1, 2016, this will likely be more than offset by rising depreciation and interest costs.
� The Utility had requested a rate increase of 3.95% ef-fective April 1, 2016. The delay in implementation and lower approved increase will also have a negative impact on earnings.
• DBRS expects the Utility’s profitability to remain challenged over the medium term as the Utility continues to invest signifi-cant amounts for Bipole III and the Keeyask Project. However, the new board at Manitoba Hydro appointed earlier in 2016 intends to improve leverage at the Utility back to the target debt-to-capital ratio of 75%.
� While Manitoba Hydro had planned to file for more mod-erate annual rate increases of 3.95% until F2029, the Utility is currently considering requesting higher rate increases for the next few years to help improve the leverage ratio. DBRS had noted that rate increases of 3.95% were expect-ed to be insufficient for Manitoba Hydro to recover costs related to major projects for the medium term.
� Other initiatives include the plan to reduce the workforce (approximately 6,000 employees), largely through attri-tion and managing vacancies, to help contain operating costs at the Utility.
Earnings and OutlookFor the year ended March 31 1
(CAD millions where applicable) 2016 2015 2014 2013 2012 Total electricity revenues 1,791 1,812 1,861 1,733 1,573 Net gas revenues 172 161 163 147 132 Total revenues 1,963 1,973 2,024 1,880 1,705 EBITDA 983 990 1,068 991 865 EBIT 595 621 626 568 484 Gross interest expense 654 581 654 636 603 Earning before taxes 45 134 156 79 61 Net income before non-recurring items 55 145 178 92 61 Reported net income 49 136 174 92 61 Return on equity 2 1.9% 5.0% 6.6% 3.5% 2.4%1 2015 to 2016 based on IFRS; 2012 to 2014 based on Canadian GAAP. 2 Adjusted for other comprehensive income.
Manitoba Hydro 2017/18 & 2018/19 General Rate Application Apendix 4.4
4 of 40

Corporates: Utilities & Independent Power November 25, 2016
Rating Report | The Manitoba Hydro-Electric Board DBRS.COM 5
Financial ProfileFor the year ended March 31 1
(CAD millions where applicable) 2016 2015 2014 2013 2012Cash receipts from customers 2,298 2,359 2,176 2,015 1,998 Cash paid to suppliers and employees (950) (1,203) (1,053) (981) (1,048)Interest paid (580) (517) (502) (489) (418)Interest received 23 26 70 44 35 Cash flow from operations 791 665 691 589 567 Dividends paid 0 0 0 0 0 Capital expenditures (2,280) (1,730) (1,394) (1,037) (1,124)Free cash flow (1,489) (1,065) (703) (448) (557)Acquisitions & investments (89) (105) (103) (98) (90)Net sinking fund withdrawals/(payments) 114 (3) 206 22 (75)Net debt change 1,803 1,556 707 565 673 Other 123 (31) 3 (59) 29 Change in cash 462 352 110 (18) (20)
Total debt (net sinking fund investments) 14,527 12,566 10,757 9,633 9,010 Cash and equivalents 953 487 142 32 50 Total debt in capital structure 2 83.0% 81.3% 79.4% 78.5% 77.9%Cash flow/Total debt 5.4% 5.3% 6.4% 6.1% 6.3%EBIT gross interest coverage (times) 0.91 1.07 0.96 0.89 0.80 Dividend payout ratio 0.0% 0.0% 0.0% 0.0% 0.0%1 2015 to 2016 based on IFRS; 2012 to 2014 based on Canadian GAAP. 2 Adjusted for other comprehensive income.
F2016 Summary• Manitoba Hydro’s key financial ratios weakened in F2016
largely because of the increase in debt to fund the large capex requirements.
• Cash flow from operations increased in F2016 from higher payable balances related to the capex projects and to the lower cost of gas and purchase gas costs caused by warmer weather.
• Gross capex of $2.4 billion included $872 million for Bipole III and $742 million for the Keeyask Project.
• The significant free cash flow deficit for the fiscal period was funded through advances from the Province.
F2017 Outlook• Manitoba Hydro’s key financial ratios are expected to remain
weak for the medium term as it continues its large capex pro-gram. While the debt-to-capital ratio had been forecast to peak at 88% in F2022, the Utility is currently reviewing poten-tial initiatives to help improve its financial health.
� Manitoba Hydro is seeking to identify internal efficien-cies to improve operating results.
� The Utility may request higher annual rate increases than the planned 3.95% in order to improve its earnings and cash flows.
� A potential equity injection from the Province would also help alleviate pressure on Manitoba Hydro’s leverage.
• Manitoba Hydro has forecast capex of approximately $3.5 billion for F2017, including around $1.5 billion for Bipole III and $1.1 billion for the Keeyask Project.
� The Utility had forecast capex to peak in F2017 and F2018 ($3.1 billion) when Bipole III comes in service. It had also forecast capex to moderate to around $900 million a year following the in-service date of the Keeyask Project in F2021.
� However, the BCG Report estimates that an additional ap-proximately $1 billion may be needed for the two projects to be completed. As well, the BCG Report also expects de-lays to the in-service date of the two projects.
• The high level of capex is expected to result in continued neg-ative free cash flows, which will likely be funded through ad-vances from the Province. Without a corresponding increase in equity, either through higher earnings or an equity injec-tion from the Province, the increasing debt load could further weaken Manitoba Hydro’s key financial ratios.
� The Utility does have some financial flexibility, as it has no mandatory dividend payment requirements.
Manitoba Hydro 2017/18 & 2018/19 General Rate Application Apendix 4.4
5 of 40

Corporates: Utilities & Independent Power November 25, 2016
Rating Report | The Manitoba Hydro-Electric Board DBRS.COM 6
Long-Term Debt Maturities and Bank Lines
For the year ended March 31
Debt Profile (CAD millions) % 2016 2015 2014Advances from the Province 98.8% 14,437 12,485 10,683 Manitoba Hydro Bonds 0.2% 26 76 169 Manitoba Hydro-Electric Board Bonds* 1.0% 145 157 158
100.0% 14,608 12,718 11,010 Other adjustments (81) (38) (142)Total 14,527 12,680 10,868 * Includes $65 million of unguaranteed bonds at March 31, 2016.
Debt MaturitiesYear 2017 2018 2019 2020 2021 Thereafter Total(CAD millions) 326 331 996 345 1,299 11,311 14,608 % 2% 2% 7% 2% 9% 78% 100%
Summary• The Province supports Manitoba Hydro by advancing funds
or guaranteeing the Utility’s long-term debt issuances. Long-term debt at March 31, 2016, consisted of the following:
� $14,437 million in advances from the Province (all of which have annual sinking fund requirements).
� $26 million of Manitoba Hydro Bonds.
� $145 million of Manitoba Hydro-Electric Board Bonds.
• Only $65 million of Manitoba Hydro-Electric Board Bonds, which were issued for mitigation projects, do not carry the provincial guarantee.
• Manitoba Hydro maintains a relatively smooth maturity profile with potential volatility from foreign currency debt, mostly mitigated through natural and cash flow hedges and a moderate level of floating-rate debt (10% of total debt at March 31, 2016), which adds stability to debt servicing costs and minimizes interest rate risk.
• The Utility has bank credit facilities that provide for over-drafts and notes payable of up to $500 million denominated in Canadian and/or U.S. dollars. At March 31, 2016, there were no amounts outstanding. Manitoba Hydro issues short-term promissory notes in its own name for its short-term cash re-quirements and does not receive short-term funding from the Province. These short-term notes are guaranteed by the Province.
Manitoba Hydro 2017/18 & 2018/19 General Rate Application Apendix 4.4
6 of 40

Corporates: Utilities & Independent Power November 25, 2016
Rating Report | The Manitoba Hydro-Electric Board DBRS.COM 7
RegulationManitoba Hydro is governed by The Manitoba Hydro Act, and its electricity and natural gas rates are regulated by the Public Utilities Board (PUB).
Electricity• Each year, Manitoba Hydro reviews its financial targets with
particular focus on its debt-to-equity target capital structure of 75% to 25%. If the Utility deems a rate adjustment necessary to continue progress toward attaining its financial targets, it submits a rate application to the PUB.
• The PUB reviews the rate adjustment application with the ob-jective of allowing Manitoba Hydro to recover its cost of ser-vice and achieve its long-term debt-to-equity target. The PUB does not have the mandate to pre-approve capex. The capex planning responsibility resides with Manitoba Hydro and the government of Manitoba.
• Manitoba Hydro submitted its 2015/16 & 2016/17 General Rate Application (GRA) in January 2015, requesting 3.95% rate increases effective April 1, 2015, and April 1, 2016.
� The PUB advised the Utility that it would not set rates for 2016/17 as part of this application.
� On July 24, 2015, the PUB finalized the previous-ly approved interim rate increase of 2.75% effective May 1, 2014, and approved a 3.95% increase in rates effec-tive August 1, 2015. In its decision, the PUB indicated that it would consider various options regarding a process to review rates effective for April 1, 2016.
� For the 2015 rate increase, the PUB directed 1.80% of the revenues associated with the rate increase to be ap-plied to general revenues, and for the remaining 2.15% to be placed in a deferral account to mitigate rate increases when Bipole III comes in service. This was similar to the PUB’s direction for rate increases approved in 2013/14 and 2014/15, where a portion of the revenues was also al-located to the Bipole III deferral account.
• On November 18, 2015, the Utility submitted its Supplemental Filing for Interim Rates effective April 1, 2016, requesting a 3.95% general rate increase.
� In April 2016, the PUB approved an interim rate increase of 3.36% effective August 1, 2016.
� Manitoba Hydro expects to file its 2016/17 and 2017/18 GRA in early 2017.
• While Manitoba Hydro is the sole retail electricity supplier in Manitoba, under The Manitoba Hydro Amendment Act (the Act), other utilities may access the transmission system to reach customers in neighbouring provinces and states.
• The Act also explicitly allows Manitoba Hydro to build new generating capacity for export sales, to offer new energy- related services, to enter into strategic alliances and joint ven-tures, and to create subsidiaries.
• There are presently no plans to move to full retail competition in the Province.
• Manitoba retail customers currently enjoy rates that are among the lowest in North America as a result of Manitoba Hydro’s predominantly hydroelectric generation and efficient resource management.
Natural Gas Distribution • Manitoba Hydro distributes natural gas through its wholly
owned subsidiary, Centra Gas Manitoba Inc. (Centra Gas). In accordance with the rate-setting methodology for natu-ral gas, commodity rates are changed every quarter based on 12-month forward natural gas market prices.
� The commodity cost of gas is a pass-through with no markup to customers.
� Non-commodity costs, such as transportation and storage are also passed on.
• The PUB allows Centra Gas to target an annual profit of ap-proximately $3 million, which is fairly modest compared with Manitoba Hydro’s consolidated earnings.
• Centra Gas filed its 2015/16 Cost of Gas Application in June 2015, requesting, effective November 1, 2015, the approv-al of supplemental gas, transportation and distribution rates, including rate riders to dispose of balances in its non-Primary Gas deferral accounts.
� In October 2015, the PUB approved, on an interim basis, new rates for supplemental gas, transportation and distri-bution, as well as rate riders to dispose of the balance in the non-Primary Gas deferral accounts.
Manitoba Hydro 2017/18 & 2018/19 General Rate Application Apendix 4.4
7 of 40

Corporates: Utilities & Independent Power November 25, 2016
Rating Report | The Manitoba Hydro-Electric Board DBRS.COM 8
Watershed Storage Capacity
Manitoba Hydro draws water from five distinct watersheds: Nelson River, Winnipeg River, Saskatchewan River, Churchill River (including the Laurie River) and Burntwood River. This provides the Utility with some geographic diversification, especially during times of low hydrology. The main generation source is the Nelson River, which accounted for approximately 78% of power generated in F2016.
Source of Electrical Energy Generated and Imported
For the year ended March 31, 2016
Nelson River 78.32% Saskatchewan River 4.25%
Billion kWh generated 28.1 Billion kWh generated 1.5Limestone 25.26% Grand Rapids 4.25%
Kettle 24.04%
Long Spruce 20.08% Laurie River 0.10%Kelsey 6.62% Billion kWh generated 0.0Jenpeg 2.32% Laurie River #1 0.05%
Laurie River #2 0.05%
Winnipeg River 10.45%
Billion kWh generated 3.8 Burntwood River 4.10%Seven Sisters 3.21% Billion kWh generated 1.5Great Falls 2.31% Wuskwatim 4.10%
Pine Falls 1.75%
Pointe du Bois 0.80%
Slave Falls 1.15%
McArthur 1.23%
Thermal 0.16% Purchases (excl. wind) 0.24%
Billion kWh generated 0.1 Billion kWh imported 0.1Brandon 0.14%
Selkirk 0.02% Wind 2.38%
Billion kWh 0.9Source: Manitoba Hydro
Favourable characteristics inherent in Manitoba Hydro’s water-sheds include the following:• Cold temperatures reduce overall evaporation rates, as many
of the reservoirs are frozen over for up to five months of the year.
• A significant portion of the watersheds consists of rock, which has lower seepage rates and higher runoff than predominantly soil-covered watersheds.
• Lake Winnipeg, Cedar Lake and Southern Indian Lake serve as large storage reservoirs. The Utility’s water storage capacity is a competitive advantage in trading electricity (buying sur-plus U.S. power at low off-peak prices and selling its electricity during peak demand periods at higher prices).
In addition to its own generating stations in Manitoba, Manitoba Hydro purchases all electricity from two wind farms in south-ern Manitoba (St. Joseph and St. Leon). The installed capacity of these facilities is 258.5 MW. The Wuskwatim Generating Station is owned by the Wuskwatim Power Limited Partnership, in which Manitoba Hydro is the majority owner. Manitoba Hydro purchases all the electricity generated from the Wuskwatim Generating Station.
Manitoba Hydro 2017/18 & 2018/19 General Rate Application Apendix 4.4
8 of 40

Corporates: Utilities & Independent Power November 25, 2016
Rating Report | The Manitoba Hydro-Electric Board DBRS.COM 9
Manitoba Hydro's Generating Stations and CapabilitiesFor the year ended March 31, 2016
Power Station Location # of Units Net Capacity (MW)Hydroelectric
Great Falls Winnipeg River 6 129
Seven Sisters Winnipeg River 6 165
Pine Falls Winnipeg River 6 84
McArthur Falls Winnipeg River 8 56
Pointe du Bois Winnipeg River 16 75
Slave Falls Winnipeg River 8 68
Grand Rapids Saskatchewan River 4 479
Kelsey Nelson River 7 286
Kettle Nelson River 12 1,220
Jenpeg Nelson River 6 115
Long Spruce Nelson River 10 980
Limestone Nelson River 10 1,350
Laurie River (2) Laurie River 3 10
Wuskwatim Burntwood River 3 211
Total Hydroelectric Generation 105 5,228
Thermal
Brandon (coal: 93 MW, gas: 234 MW) 3 327
Selkirk (gas) 2 125
Total Thermal Generation 5 452
Isolated Diesel Capabilities
Brochet 3
Lac Brochet 2
Shamattawa 3
Tadoule Lake 2
Total Isolated Diesel Generation 10
Total Generation Capacity 5,690
Source: Manitoba Hydro
Generating Capacity
Manitoba Hydro 2017/18 & 2018/19 General Rate Application Apendix 4.4
9 of 40

Corporates: Utilities & Independent Power November 25, 2016
Rating Report | The Manitoba Hydro-Electric Board DBRS.COM 10
The Manitoba Hydro-Electric Board 1
Balance Sheet March 31 March 31
(CAD millions) 2016 2015 2014 2016 2015 2014
Assets Liabilities & EquityCash & equivalents 953 487 142 S.T. borrowings 0 0 0
Accounts receivable 372 427 520 Accounts payable 723 529 561
Inventories 117 99 81 Current portion L.T.D. 326 377 408
Prepaid expenses & other 43 54 0 Other current liab. 192 190 100
Total Current Assets 1,485 1,067 743 Total Current Liab. 1,241 1,096 1,069 Net fixed assets 17,208 15,222 13,627 Long-term debt (net sinking fund investments) 14,201 12,189 10,349
Goodwill & intangibles 301 290 281 Sinking fund investments 0 114 111
Investments & others 786 988 988 Other L.T. liab. 2,146 1,989 1,225
Shareholders' equity 2,192 2,179 2,885
Total Assets 19,780 17,567 15,639 Total Liab. & SE 19,780 17,567 15,639 1 2015 to 2016 based on IFRS; 2014 based on Canadian GAAP.
Balance Sheet &Liquidity & Capital Ratios
For the year ended March 31 1
2016 2015 2014 2013 2012Current ratio 1.20 0.97 0.70 0.48 0.65 Total debt in capital structure 86.9% 85.2% 78.9% 76.6% 75.8%Total debt in capital structure 2 83.0% 81.3% 79.4% 78.5% 77.9%Cash flow/Total debt 5.4% 5.3% 6.4% 6.1% 6.3%(Cash flow-dividends)/Capex 0.35 0.38 0.50 0.57 0.50 Dividend payout ratio 0.0% 0.0% 0.0% 0.0% 0.0%
Coverage Ratios (times)
EBIT gross interest coverage 0.91 1.07 0.96 0.89 0.80 EBITDA gross interest coverage 1.50 1.70 1.63 1.56 1.43 Fixed-charge coverage 0.91 1.07 0.96 0.89 0.80
Profitability RatiosPurchased power/Electricty revenues 6.5% 7.1% 8.6% 7.7% 9.3%Operating margin 30.3% 31.5% 30.9% 30.2% 28.4%Net margin 2.8% 7.3% 8.8% 4.9% 3.6%Return on equity 2 1.9% 5.0% 6.6% 3.5% 2.4%1 2015 to 2016 based on IFRS; 2012 to 2014 based on Canadian GAAP. 2 Adjusted for other comprehensive income.
Manitoba Hydro 2017/18 & 2018/19 General Rate Application Apendix 4.4
10 of 40
Corporates: Utilities & Independent Power November 25, 2016
Rating Report | The Manitoba Hydro-Electric Board DBRS.COM 11
Current 2015 2014 2013 2012 2011
Long-Term Obligations A (high) A (high) A (high) A (high) A (high) A (high)
Short-Term Obligations R-1 (middle) R-1 (middle) R-1 (middle) R-1 (middle) R-1 (middle) R-1 (middle)
Note: These Obligations are based on the status of the Manitoba Hydro-Electric Board as a Crown agent of the Province of Manitoba and the unconditional guarantee provided by the Province on Manitoba Hydro’s third-party debt, and thus reflect the Province’s debt ratings.
Related Research• DBRS Confirms Province of Manitoba at A (high) and R-1 (middle), September 12, 2016.
• Manitoba, Province of: Rating Report, September 12, 2016.
• Confirmed, September 12, 2016.
Rating History
Previous Action
Previous Report• Manitoba Hydro-Electric Board, The: Rating Report, November 26, 2015.
Short-Term Promissory Notes Programme• $500 million.
Notes:All figures are in Canadian dollars unless otherwise noted.
For the definition of Issuer Rating, please refer to Rating Definitions under Rating Policy on www.dbrs.com.
Generally, Issuer Ratings apply to all senior unsecured obligations of an applicable issuer, except when an issuer has a significant or unique level of secured debt.
© 2016, DBRS Limited, DBRS, Inc., DBRS Ratings Limited and DBRS Ratings México, Institución Calificadora de Valores S.A. de C.V. (collectively DBRS). All rights reserved. The information upon which DBRS ratings and reports are based is obtained by DBRS from sources DBRS believes to be reliable. DBRS does not audit the information it receives in connection with the rating process, and it does not and cannot independently verify that information in every instance. The extent of any factual investigation or independent verification depends on facts and circumstances. DBRS ratings, reports and any other information provided by DBRS are provided “as is” and without representation or warranty of any kind. DBRS hereby disclaims any representation or warranty, express or implied, as to the accuracy, timeliness, completeness, merchantability, fitness for any particular purpose or non-infringement of any of such information. In no event shall DBRS or its directors, officers, employees, independent contractors, agents and representatives (collectively, DBRS Representatives) be liable (1) for any inaccuracy, delay, loss of data, interruption in service, error or omission or for any damages resulting therefrom, or (2) for any direct, indirect, incidental, special, compensatory or consequential damages arising from any use of ratings and rating reports or arising from any error (negligent or otherwise) or other circumstance or contingency within or outside the control of DBRS or any DBRS Representative, in connection with or related to obtaining, collecting, compiling, analyzing, interpreting, communicating, publishing or delivering any such information. Ratings and other opinions issued by DBRS are, and must be construed solely as, statements of opinion and not statements of fact as to credit worthiness or recommendations to purchase, sell or hold any securities. A report providing a DBRS rating is neither a prospectus nor a substitute for the information assembled, verified and presented to investors by the issuer and its agents in connection with the sale of the securities. DBRS receives compensation for its rating activities from issuers, insurers, guarantors and/or underwriters of debt securities for assigning ratings and from subscribers to its website. DBRS is not responsible for the content or operation of third party websites accessed through hypertext or other computer links and DBRS shall have no liability to any person or entity for the use of such third party websites. This publication may not be reproduced, retransmitted or distributed in any form without the prior written consent of DBRS. ALL DBRS RATINGS ARE SUBJECT TO DISCLAIMERS AND CERTAIN LIMITATIONS. PLEASE READ THESE DISCLAIMERS AND LIMITATIONS AT http://www.dbrs.com/about/disclaimer. ADDITIONAL INFORMATION REGARDING DBRS RATINGS, INCLUDING DEFINITIONS, POLICIES AND METHODOLOGIES, ARE AVAILABLE ON http://www.dbrs.com/. The DBRS group of companies consists of DBRS, Inc. (Delaware, U.S.)(NRSRO, DRO affiliate); DBRS Limited (Ontario, Ca)(DRO, NRSRO affiliate); DBRS Ratings Limited (England and Wales)(CRA, DRO affiliate); and DBRS Ratings México, Institución Calificadora de Valores S.A. de C.V. (Mexico)(CRA, NRSRO affiliate, DRO affiliate). Please note that DBRS Ratings Limited is not an NRSRO and ratings assigned by it are non-NRSRO ratings. For more information on regulatory registrations, recognitions and approvals, please see: http://www.dbrs.com/research/225752/highlights.pdf.
Manitoba Hydro 2017/18 & 2018/19 General Rate Application Apendix 4.4
11 of 40
Public Finance: Provinces and Municipalities September 12, 2016
Rating Report
Province of Manitoba
Debt Rating Rating Action TrendIssuer Rating A (high) Confirmed Stable
Long-Term Debt* A (high) Confirmed Stable
Short-Term Debt* R-1 (middle) Confirmed Stable
* Includes guaranteed long-term and short-term debt obligations issued by the Manitoba-Hydro Electric Board.
Ratings
Rating UpdateDBRS Limited (DBRS) has confirmed the Issuer Rating and the Long-Term Debt and Short-Term Debt ratings of the Province of Manitoba (Manitoba or the Province) at A (high), A (high) and R-1 (middle), respectively. All trends are Stable. The Province’s credit profile continues to be supported by a stable, resilient and growing economy and a debt burden that remains commensurate with the ratings. Notwithstanding this stability, the Province’s op-erating results have failed to improve in recent years, and without a concerted effort to reduce operating deficits and slow debt accu-mulation, the flexibility within the existing ratings may be eroded.
Preliminary results for 2015–16 indicate that the deficit wid-ened significantly to $1.0 billion from a budgeted deficit of $422 million. On a DBRS-adjusted basis, which recognizes capi-tal expenditures as incurred as opposed to as amortized, this equates to a deficit of $2.0 billion, or 2.8% of gross domestic product (GDP). As a result, DBRS-adjusted debt is estimated to have risen to $27.6 billion, or 42.0% of GDP, as of March 31, 2016.
The economic outlook for 2016 remains largely similar to pre-vious years. The Province expects reasonably strong growth in both 2016 and 2017, though forecasts have weakened slight-ly since the time of the budget. The private sector consensus tracked by DBRS suggests growth of 2.2% and 2.1% in 2016 and 2017, respectively. Continued gains in manufacturing and export-oriented industries are expected to offset weakness in residential and non-residential investment.
Despite consistent economic growth in recent years, the Province has posted increasingly large operating deficits. The newly elect-ed PC Government tabled a budget within six weeks of election night. As such, the budget focuses on the current year and the expenditure plan is consistent with that of prior years. The bud-get projects a deficit of $911 million, or $1.75 billion on a DBRS-adjusted basis (2.6% of GDP). Initial indications from the new government suggest a reluctance to raise taxes or make sharp and immediate spending reductions. The focus appears to be on continuing to invest in strategic infrastructure and slowing ex-penditure growth without significantly affecting front-line ser-vices. With this, the government has indicated that it is unlikely to balance the budget until its second term in office (i.e., it could take up to eight years). DBRS estimates the debt burden will rise to $30.1 billion, or 44.1% of GDP, by the end of 2016–17 and ex-pects it could climb further in subsequent years, though the tra-jectory is uncertain in the absence of a more detailed multi-year fiscal plan.
A negative rating action is not expected in the near term, but could occur if operating results deteriorate significantly and the outlook for debt burden increases sharply. A positive rating ac-tion, while unlikely, would require a material improvement in operating results and a substantial reduction in the debt burden.
Manitoba is located in Central Canada and ranks fifth among Canadian provinces by population and sixth in terms of GDP. The Province is home to significant renewable energy resources, with almost all electricity generated from water.
Issuer Description
Financial InformationFor the year ended March 31
(all financial figures DBRS adjusted) 2016-17B 2015-16F 2014-15 2013-14 2012-13Debt/GDP 1 44.1% 42.0% 38.8% 37.3% 36.0%Surplus (deficit)/GDP (2.6%) (2.8%) (2.1%) (2.1%) (2.2%)Federal transfers/total revenue 27.0% 26.0% 25.9% 27.2% 29.2%Interest costs/total revenue 5.5% 5.4% 5.4% 5.4% 5.6%Real GDP growth rate 2 2.4% 2.2% 2.3% 2.4% 3.0%
1 Tax-supported debt + unfunded pension liabilities. 2 GDP on a calendar year basis as forecast in the provincial budget.B = Budget. F = Forecast.
Travis Shaw+1 416 597 7582 [email protected]
Paul LeBane+1 416 597 7478
Manitoba Hydro 2017/18 & 2018/19 General Rate Application Apendix 4.4
12 of 40

Public Finance: Provinces and Municipalities September 12, 2016
Rating Report | Province of Manitoba DBRS.COM 2
Rating Considerations
Strengths
1. Diversified and resilient economy Manitoba has one of the most resilient and diversified economies in the country. The Province has a mix of industries, including agriculture, mining, manufacturing, financial services and trans-portation, with no undue reliance on a particular industry. The Province has a relatively stable labour force characterized by low unemployment, and relatively strong population and labour force growth. The Province’s interprovincial and international exports are relatively diversified in both composition and desti-nation. With this broad diversification, the Province’s economy tends to post stable growth and exhibit lower volatility than the economies of most other provinces.
2. Prudent debt management Manitoba’s debt burden has risen sharply in recent years, reaching 42% of GDP at March 31, 2016. Notwithstanding the increases, the debt burden remains commensurate with the ratings, and the Province’s approach to debt management is prudent. The Province maintains a relatively smooth debt ma-turity profile, no unhedged foreign currency exposure and only a moderate level of floating-rate exposure. The Province also has good market access with well-established domestic and in-ternational borrowing programs.
3. Abundant low-cost hydroelectricity Manitoba benefits from an abundance of low-cost hydroelectric-ity. The Province has among the lowest rates in North America, which gives Manitoba a distinct advantage when competing for new business investment in some industries.
Challenges
1. Substantial deficitThe Province has a large deficit and few substantial revenue options available to it. As such, the Province will likely face significant challenges over the medium term to return to balance without affecting front-line services.
2. Reliance on federal transfers Federal transfers, including equalization, account for about one-quarter of provincial revenue. Outside of Atlantic Canada, Manitoba is the most reliant province on federal transfers, which exposes it to some risk of federal policy changes, though DBRS notes that material changes to the major transfer programs tend to be gradual and well communicated. Moreover, DBRS also notes that Manitoba’s share of the equalization program has fallen in recent years, which reflects an improvement in the Province’s fiscal capacity relative to the other provinces.
3. Below-average income and GDP per capita Manitoba boasts a well-diversified economy and a healthy labour market, though the Province continues to have lower average in-comes, which limits the ability of the Province to significantly increase own-source revenue. DBRS notes that the Province’s economy has grown moderately in recent years, and this in-cludes relatively strong growth in per-capital GDP.
Manitoba Hydro 2017/18 & 2018/19 General Rate Application Apendix 4.4
13 of 40
Public Finance: Provinces and Municipalities September 12, 2016
Rating Report | Province of Manitoba DBRS.COM 3
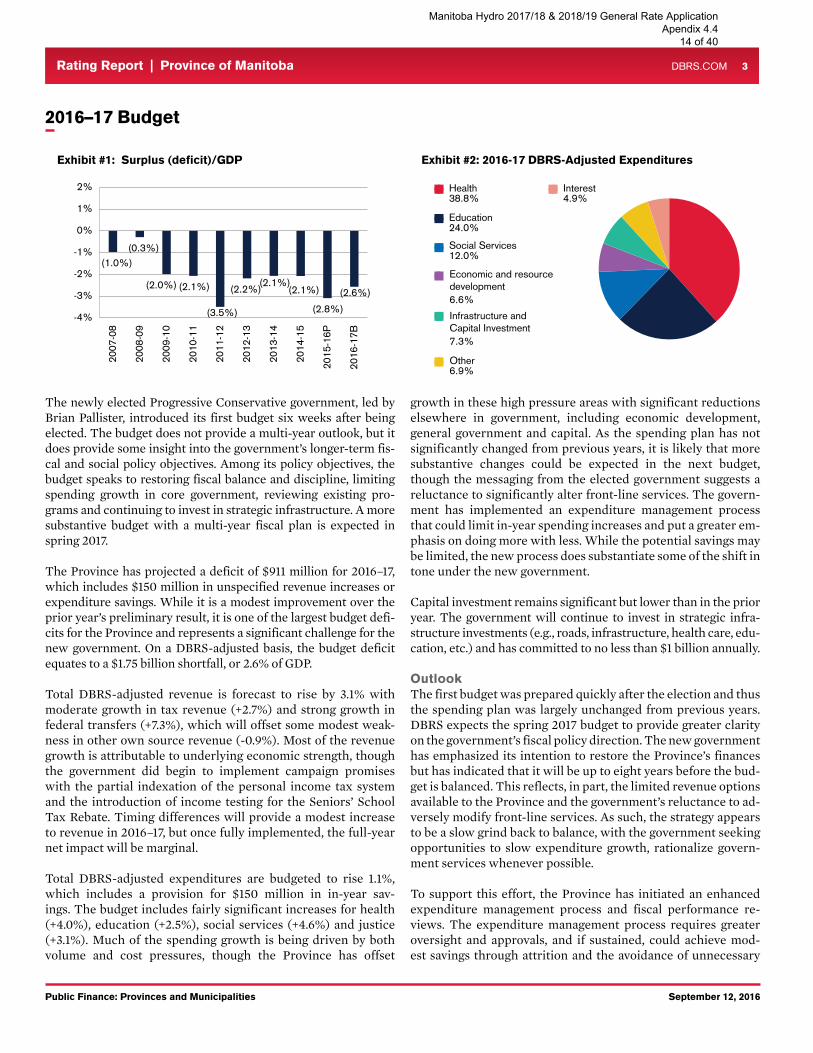
2016–17 Budget
The newly elected Progressive Conservative government, led by Brian Pallister, introduced its first budget six weeks after being elected. The budget does not provide a multi-year outlook, but it does provide some insight into the government’s longer-term fis-cal and social policy objectives. Among its policy objectives, the budget speaks to restoring fiscal balance and discipline, limiting spending growth in core government, reviewing existing pro-grams and continuing to invest in strategic infrastructure. A more substantive budget with a multi-year fiscal plan is expected in spring 2017.
The Province has projected a deficit of $911 million for 2016–17, which includes $150 million in unspecified revenue increases or expenditure savings. While it is a modest improvement over the prior year’s preliminary result, it is one of the largest budget defi-cits for the Province and represents a significant challenge for the new government. On a DBRS-adjusted basis, the budget deficit equates to a $1.75 billion shortfall, or 2.6% of GDP.
Total DBRS-adjusted revenue is forecast to rise by 3.1% with moderate growth in tax revenue (+2.7%) and strong growth in federal transfers (+7.3%), which will offset some modest weak-ness in other own source revenue (-0.9%). Most of the revenue growth is attributable to underlying economic strength, though the government did begin to implement campaign promises with the partial indexation of the personal income tax system and the introduction of income testing for the Seniors’ School Tax Rebate. Timing differences will provide a modest increase to revenue in 2016–17, but once fully implemented, the full-year net impact will be marginal.
Total DBRS-adjusted expenditures are budgeted to rise 1.1%, which includes a provision for $150 million in in-year sav-ings. The budget includes fairly significant increases for health (+4.0%), education (+2.5%), social services (+4.6%) and justice (+3.1%). Much of the spending growth is being driven by both volume and cost pressures, though the Province has offset
growth in these high pressure areas with significant reductions elsewhere in government, including economic development, general government and capital. As the spending plan has not significantly changed from previous years, it is likely that more substantive changes could be expected in the next budget, though the messaging from the elected government suggests a reluctance to significantly alter front-line services. The govern-ment has implemented an expenditure management process that could limit in-year spending increases and put a greater em-phasis on doing more with less. While the potential savings may be limited, the new process does substantiate some of the shift in tone under the new government.
Capital investment remains significant but lower than in the prior year. The government will continue to invest in strategic infra-structure investments (e.g., roads, infrastructure, health care, edu-cation, etc.) and has committed to no less than $1 billion annually. OutlookThe first budget was prepared quickly after the election and thus the spending plan was largely unchanged from previous years. DBRS expects the spring 2017 budget to provide greater clarity on the government’s fiscal policy direction. The new government has emphasized its intention to restore the Province’s finances but has indicated that it will be up to eight years before the bud-get is balanced. This reflects, in part, the limited revenue options available to the Province and the government’s reluctance to ad-versely modify front-line services. As such, the strategy appears to be a slow grind back to balance, with the government seeking opportunities to slow expenditure growth, rationalize govern-ment services whenever possible.
To support this effort, the Province has initiated an enhanced expenditure management process and fiscal performance re-views. The expenditure management process requires greater oversight and approvals, and if sustained, could achieve mod-est savings through attrition and the avoidance of unnecessary
Exhibit #1: Surplus (deficit)/GDP
Education24.0%
Social Services12.0%
Health38.8%
Exhibit #2: 2016-17 DBRS-Adjusted Expenditures
Interest4.9%
Infrastructure andCapital Investment7.3%
Other6.9%
Economic and resourcedevelopment6.6%
(1.0%)(0.3%)
(2.0%) (2.1%)
(3.5%)
(2.2%)(2.1%)(2.1%)
(2.8%)(2.6%)
-4%
-3%
-2%
-1%
0%
1%
2%
2007
-08
2008
-09
2009
-10
2010
-11
2011
-12
2012
-13
2013
-14
2014
-15
2015
-16P
2016
-17B
Manitoba Hydro 2017/18 & 2018/19 General Rate Application Apendix 4.4
14 of 40

Public Finance: Provinces and Municipalities September 12, 2016
Rating Report | Province of Manitoba DBRS.COM 4
expenses. The potentially more significant exercise appears to be the fiscal performance reviews, which are being conducted by a consultancy with the stated aim of improving the efficiency, efficacy and economy of government services. The challenge, however, is the constrained timeline required to complete thor-ough reviews, assess the findings, and implement the changes ahead of the next budget. While changes to tax systems or grants/transfers can be made relatively quickly, substantive changes to program areas generally require considerable lead time.
It is early in the new government’s mandate, and while initial indications suggest the government is prepared to begin the pro-cess of fiscal consolidation, the challenge is considerable and the
timeline is long. Without considerable upfront efforts to reduce near-term deficits, the Province’s credit profile is likely to dete-riorate further as a result of additional debt accumulation. While the Province’s credit profile does have flexibility to accommodate ongoing deficits and the resulting growth in the debt burden in the near term, that flexibility is not unlimited. Without clear and credible action to demonstrate the government’s resolve and to shift the outlook for debt growth, the credit rating could come under pressure over the medium term.
2016–17 Budget (CONTINUED)
2015–16 Preliminary Results
Preliminary results for 2015–16 indicate that the budget defi-cit deteriorated significantly to $1.0 billion from the planned $422 million deficit. On a DBRS-adjusted basis, this equates to a $2.0 billion shortfall, or 2.8% of GDP. Total revenue rose marginally over the prior year but missed budget expectations primarily because of weaker-than-expected growth in tax rev-enue. Federal transfers rose slightly year over year; increases in Canada Health and Social transfers offset declines in equal-ization. Manitoba’s equalization entitlement has been falling in recent years with the Province’s improving fiscal capacity. On a per capita basis, Manitoba’s entitlement has fallen to $1,344 from $1,591 over the last five years.
The deterioration in the operating result was largely driven by the significant increase in in-year spending. Budget projections suggested relatively little growth in DBRS-adjusted expendi-tures, but expenditures are projected to have been $700 million higher than planned, which contributed to relatively high year-over-year expenditure growth (+4.6%). The variance to budget was driven by health care and capital investment. Health-care spending was $162 million higher than planned as a result of price and volume pressures, while gross capital investment was about $144 million higher than planned. Other areas of govern-ment generally experienced more modest pressures or provided in-year savings.
Manitoba Hydro 2017/18 & 2018/19 General Rate Application Apendix 4.4
15 of 40

Public Finance: Provinces and Municipalities September 12, 2016
Rating Report | Province of Manitoba DBRS.COM 5
Debt Profile
The Province’s debt burden has continued to rise moderately with ongoing operating deficits and significant capital invest-ment. DBRS estimates the Province’s DBRS-adjusted debt burden, defined as tax-supported debt plus unfunded pension liabilities, to have risen by $2.8 billion in 2015–16 and reached 42.0% of GDP. This is about $1.5 billion, or 2.2% of GDP, higher than was anticipated at the time of DBRS’s last review. The in-crease in the debt burden reflects both growth in outstanding debt and a negative revision to GDP.
The Province maintains a prudent debt structure with no un-hedged foreign currency exposure and only moderate floating-rate exposure (18%) at March 31, 2016. The debt maturity profile remains relatively smooth with no substantial refinancing needs in any given year. Moreover, the Province has good market access with establish domestic and international borrowing programs.
The Province’s unfunded pension liabilities are considerable and have continued to rise in recent years. At March 31, 2016, the unfunded pension liabilities totalled $2.3 billion, or 3.6% of GDP. The civil service superannuation plan and the teachers’ pension plan account for the majority of the unfunded pension obligations. Contribution rates have increased in recent years, and indexing has been made conditional, though the unfunded liabilities have continued to rise in the absence of more substan-tial changes to plan design or funding.
The Province issues debt in its own name on behalf of the Manitoba Hydro, the provincial utility, and guarantees much of the utility’s existing legacy debt. Notwithstanding the taxpayer-backed guarantee, both Manitoba Hydro and the Government of Manitoba expect the cost of this debt to be recovered through electricity rates. Manitoba Hydro is currently undertaking a sig-nificant capital program to increase capacity and reliability of its generation and transmission base. This is leading to a significant increase in debt, and because rate increases are being phased in gradually, leverage and coverage ratios are deteriorating. While the utility’s financials are expected to deteriorate further over the medium term, leverage and coverage ratios will improve thereafter, and indications suggest that the rate increases will enable the utility to sustainably service its debt without direct subsidies from the Province. Moreover, the utility maintains considerable flexibility given its exceptionally low rates.
DBRS continues to classify Manitoba Hydro’s debt as self-sup-ported and excludes it from DBRS’ estimate of tax-supported debt. DBRS would consider reclassifying a portion of Manitoba Hydro’s debt as tax-supported if the outlook were such that the utility appears unable to service its debt with cash flow from op-erations for a sustained period of time.
OutlookIn 2016–17, DBRS-adjusted debt is expected to rise by $2.5 billion to $30.1 billion on account of the budgetary deficit, capital re-quirements and rising unfunded pension liabilities. With the increase, the debt burden will rise to 44.1% of GDP, its highest level since the mid-1990s. The new government has stated its intention to stabilize the debt burden. In the absence of a more detailed fiscal plan and the long timeline for returning to bal-ance, DBRS expects the debt burden to continue to rise over the medium term, though the trajectory and peak remain uncertain at this time.
The Province’s gross borrowing requirement for 2016–17 is es-timated to be $6.5 billion, of which the Province has already completed $2.4 billion. The Province typically targets 30% of its issuance outside of Canada, but has been borrowing more heav-ily in international markets this year.
Exhibit #3: DBRS-Adjusted Debt-to-GDP
28.9%28.4%
31.8%32.8%35.3% 36.0%
37.3%38.8%
42.0%44.1%
15%
20%
25%
30%
35%
40%
45%
2008
2009
2010
2011
2012
2013
2014
2015
2016
P
2017
B
Tax-supported debt Unfunded pension liabilities
Manitoba Hydro 2017/18 & 2018/19 General Rate Application Apendix 4.4
16 of 40
Public Finance: Provinces and Municipalities September 12, 2016
Rating Report | Province of Manitoba DBRS.COM 6
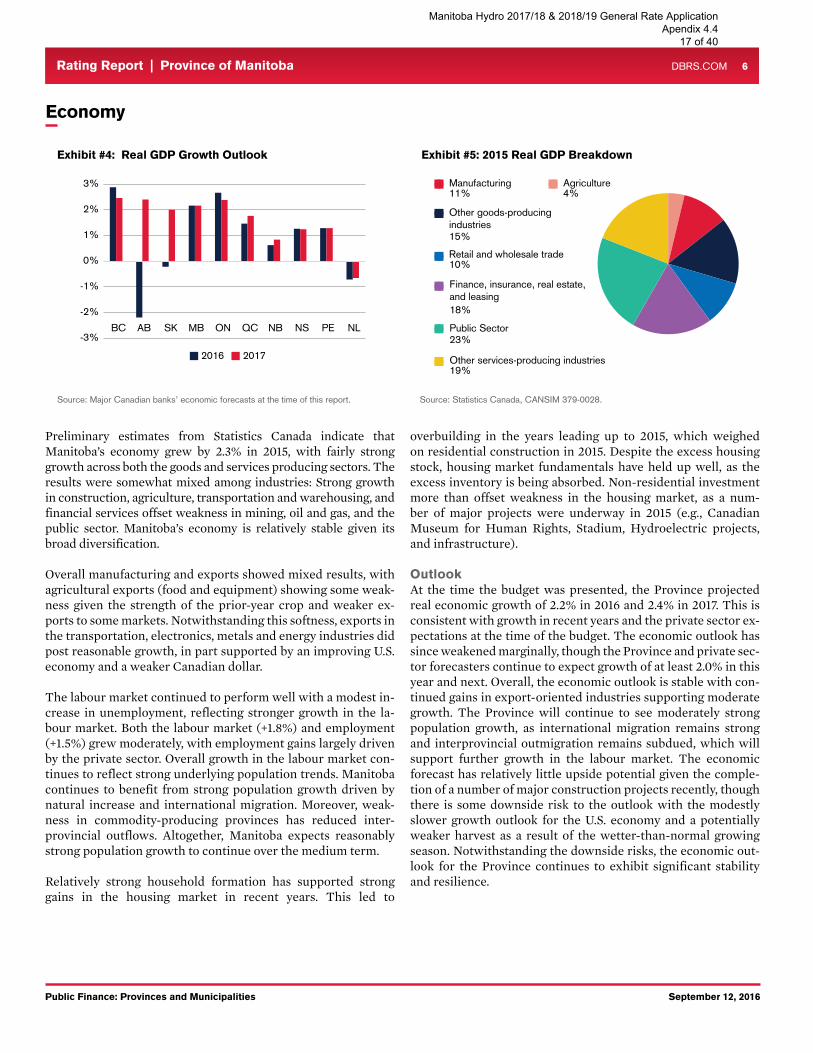
Economy
Preliminary estimates from Statistics Canada indicate that Manitoba’s economy grew by 2.3% in 2015, with fairly strong growth across both the goods and services producing sectors. The results were somewhat mixed among industries: Strong growth in construction, agriculture, transportation and warehousing, and financial services offset weakness in mining, oil and gas, and the public sector. Manitoba’s economy is relatively stable given its broad diversification.
Overall manufacturing and exports showed mixed results, with agricultural exports (food and equipment) showing some weak-ness given the strength of the prior-year crop and weaker ex-ports to some markets. Notwithstanding this softness, exports in the transportation, electronics, metals and energy industries did post reasonable growth, in part supported by an improving U.S. economy and a weaker Canadian dollar.
The labour market continued to perform well with a modest in-crease in unemployment, reflecting stronger growth in the la-bour market. Both the labour market (+1.8%) and employment (+1.5%) grew moderately, with employment gains largely driven by the private sector. Overall growth in the labour market con-tinues to reflect strong underlying population trends. Manitoba continues to benefit from strong population growth driven by natural increase and international migration. Moreover, weak-ness in commodity-producing provinces has reduced inter-provincial outflows. Altogether, Manitoba expects reasonably strong population growth to continue over the medium term.
Relatively strong household formation has supported strong gains in the housing market in recent years. This led to
overbuilding in the years leading up to 2015, which weighed on residential construction in 2015. Despite the excess housing stock, housing market fundamentals have held up well, as the excess inventory is being absorbed. Non-residential investment more than offset weakness in the housing market, as a num-ber of major projects were underway in 2015 (e.g., Canadian Museum for Human Rights, Stadium, Hydroelectric projects, and infrastructure).
OutlookAt the time the budget was presented, the Province projected real economic growth of 2.2% in 2016 and 2.4% in 2017. This is consistent with growth in recent years and the private sector ex-pectations at the time of the budget. The economic outlook has since weakened marginally, though the Province and private sec-tor forecasters continue to expect growth of at least 2.0% in this year and next. Overall, the economic outlook is stable with con-tinued gains in export-oriented industries supporting moderate growth. The Province will continue to see moderately strong population growth, as international migration remains strong and interprovincial outmigration remains subdued, which will support further growth in the labour market. The economic forecast has relatively little upside potential given the comple-tion of a number of major construction projects recently, though there is some downside risk to the outlook with the modestly slower growth outlook for the U.S. economy and a potentially weaker harvest as a result of the wetter-than-normal growing season. Notwithstanding the downside risks, the economic out-look for the Province continues to exhibit significant stability and resilience.
Exhibit #4: Real GDP Growth Outlook
Other goods-producingindustries15%
Retail and wholesale trade10%
Manufacturing11%
Exhibit #5: 2015 Real GDP Breakdown
Agriculture4%
Public Sector23%
Other services-producing industries19%
Finance, insurance, real estate,and leasing18%
Source: Major Canadian banks’ economic forecasts at the time of this report. Source: Statistics Canada, CANSIM 379-0028.
-3%
-2%
-1%
0%
1%
2%
3%
BC AB SK MB ON QC NB NS PE NL
2016 2017
Manitoba Hydro 2017/18 & 2018/19 General Rate Application Apendix 4.4
17 of 40
Public Finance: Provinces and Municipalities September 12, 2016
Rating Report | Province of Manitoba DBRS.COM 7
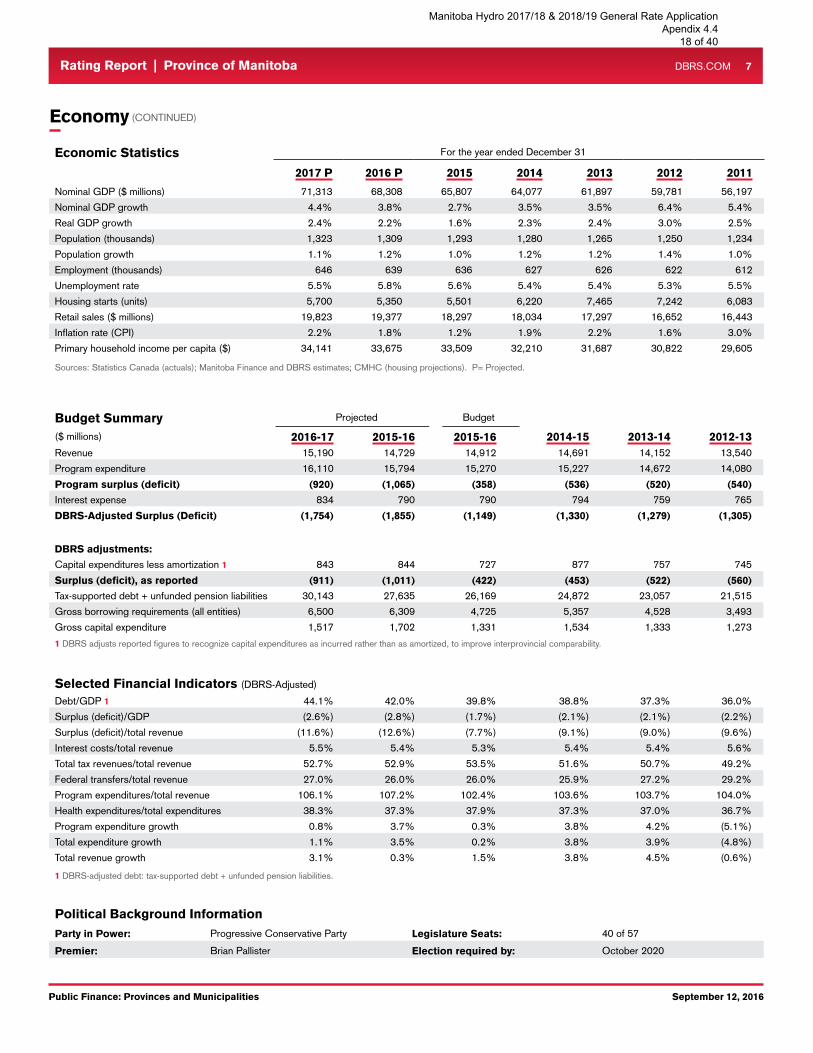
Economic Statistics For the year ended December 31
2017 P 2016 P 2015 2014 2013 2012 2011Nominal GDP ($ millions) 71,313 68,308 65,807 64,077 61,897 59,781 56,197 Nominal GDP growth 4.4% 3.8% 2.7% 3.5% 3.5% 6.4% 5.4%Real GDP growth 2.4% 2.2% 1.6% 2.3% 2.4% 3.0% 2.5%Population (thousands) 1,323 1,309 1,293 1,280 1,265 1,250 1,234 Population growth 1.1% 1.2% 1.0% 1.2% 1.2% 1.4% 1.0%Employment (thousands) 646 639 636 627 626 622 612 Unemployment rate 5.5% 5.8% 5.6% 5.4% 5.4% 5.3% 5.5%Housing starts (units) 5,700 5,350 5,501 6,220 7,465 7,242 6,083 Retail sales ($ millions) 19,823 19,377 18,297 18,034 17,297 16,652 16,443 Inflation rate (CPI) 2.2% 1.8% 1.2% 1.9% 2.2% 1.6% 3.0%Primary household income per capita ($) 34,141 33,675 33,509 32,210 31,687 30,822 29,605
Sources: Statistics Canada (actuals); Manitoba Finance and DBRS estimates; CMHC (housing projections). P= Projected.
Economy (CONTINUED)
Budget Summary Projected Budget
($ millions) 2016-17 2015-16 2015-16 2014-15 2013-14 2012-13Revenue 15,190 14,729 14,912 14,691 14,152 13,540 Program expenditure 16,110 15,794 15,270 15,227 14,672 14,080 Program surplus (deficit) (920) (1,065) (358) (536) (520) (540)Interest expense 834 790 790 794 759 765 DBRS-Adjusted Surplus (Deficit) (1,754) (1,855) (1,149) (1,330) (1,279) (1,305)
DBRS adjustments:Capital expenditures less amortization 1 843 844 727 877 757 745 Surplus (deficit), as reported (911) (1,011) (422) (453) (522) (560)Tax-supported debt + unfunded pension liabilities 30,143 27,635 26,169 24,872 23,057 21,515 Gross borrowing requirements (all entities) 6,500 6,309 4,725 5,357 4,528 3,493 Gross capital expenditure 1,517 1,702 1,331 1,534 1,333 1,273 1 DBRS adjusts reported figures to recognize capital expenditures as incurred rather than as amortized, to improve interprovincial comparability.
Selected Financial Indicators (DBRS-Adjusted)
Debt/GDP 1 44.1% 42.0% 39.8% 38.8% 37.3% 36.0%Surplus (deficit)/GDP (2.6%) (2.8%) (1.7%) (2.1%) (2.1%) (2.2%)Surplus (deficit)/total revenue (11.6%) (12.6%) (7.7%) (9.1%) (9.0%) (9.6%)Interest costs/total revenue 5.5% 5.4% 5.3% 5.4% 5.4% 5.6%Total tax revenues/total revenue 52.7% 52.9% 53.5% 51.6% 50.7% 49.2%Federal transfers/total revenue 27.0% 26.0% 26.0% 25.9% 27.2% 29.2%Program expenditures/total revenue 106.1% 107.2% 102.4% 103.6% 103.7% 104.0%Health expenditures/total expenditures 38.3% 37.3% 37.9% 37.3% 37.0% 36.7%Program expenditure growth 0.8% 3.7% 0.3% 3.8% 4.2% (5.1%)Total expenditure growth 1.1% 3.5% 0.2% 3.8% 3.9% (4.8%)Total revenue growth 3.1% 0.3% 1.5% 3.8% 4.5% (0.6%)
1 DBRS-adjusted debt: tax-supported debt + unfunded pension liabilities.
Political Background InformationParty in Power: Progressive Conservative Party Legislature Seats: 40 of 57
Premier: Brian Pallister Election required by: October 2020
Manitoba Hydro 2017/18 & 2018/19 General Rate Application Apendix 4.4
18 of 40

Public Finance: Provinces and Municipalities September 12, 2016
Rating Report | Province of Manitoba DBRS.COM 8
DBRS-Adjusted Statement of Operations Projected Budget
($ millions) 2016-17 2015-16 2015-16 2014-15 2013-14 2012-13RevenuePersonal income tax 3,339 3,261 3,262 3,117 2,978 2,846
Retail sales tax 2,328 2,261 2,292 2,205 2,028 1,767
Corporate taxes 1,123 1,093 1,220 1,105 1,024 965
Fuel taxes 331 327 346 335 329 332
Tobacco taxes 256 256 252 256 272 252
Education property tax 533 500 493 461 434 380
Other taxes 93 95 108 101 105 124
Total tax revenue 8,003 7,794 7,973 7,578 7,169 6,667 Manitoba Liquor and Lotteries Corporation 586 583 582 597 554 558
Manitoba Hydro 42 49 125 114 174 92
Natural resource levies 152 169 172 169 176 168
Fees, permits, licences & other 2,299 2,306 2,178 2,425 2,237 2,102
Total Own-Source Revenue 11,082 10,901 11,031 10,883 10,310 9,587 Equalization payments 1,736 1,738 1,738 1,750 1,799 1,872
Canada health & social transfer 1,786 1,697 1,698 1,621 1,524 1,487
Other federal transfers 586 393 445 438 519 594
Total Federal Transfers 4,108 3,828 3,881 3,809 3,842 3,953
DBRS-Adjusted Revenue 15,190 14,729 14,912 14,691 14,152 13,540
ExpendituresHealth 6,497 6,250 6,088 5,979.9 5,706 5,454
Education and training 4,061 3,962 3,983 3,638.5 3,562 3,339
Social services 2,036 1,946 1,891 1,119.6 1,074 1,035
Justice 603 585 581 532.7 534 500
Infrastructure and transportation 389 269 373 544.3 501 540
Economic and resource development 1,115 1,168 1,109 1,997 1,914 1,883
Other general government 716 770 668 538 624 584
Capital expenditures less amortization 1 843 844 727 877.0 757 745
Targeted in-year savings (150) - (150) - - -
DBRS-Adjusted Program Expenditures 16,110 15,794 15,270 15,227 14,672 14,080 Net interest expense 2 834 790 790 794 759 765
DBRS-Adjusted Expenditures 16,944 16,584 16,060 16,021 15,431 14,845
DBRS-Adjusted Surplus (Deficit) (1,754) (1,855) (1,149) (1,330) (1,279) (1,305)DBRS adjustments:
Capital expenditures less amortization 1 843 844 727 877 757 745
Surplus (deficit), as reported (911) (1,011) (422) (453) (522) (560)
1 DBRS adjusts reported figures to recognize capital expenditures as incurred rather than as amortized, to improve interprovincial comparability. 2 Interest expense is net of sinking funds.
Manitoba Hydro 2017/18 & 2018/19 General Rate Application Apendix 4.4
19 of 40
Public Finance: Provinces and Municipalities September 12, 2016
Rating Report | Province of Manitoba DBRS.COM 9
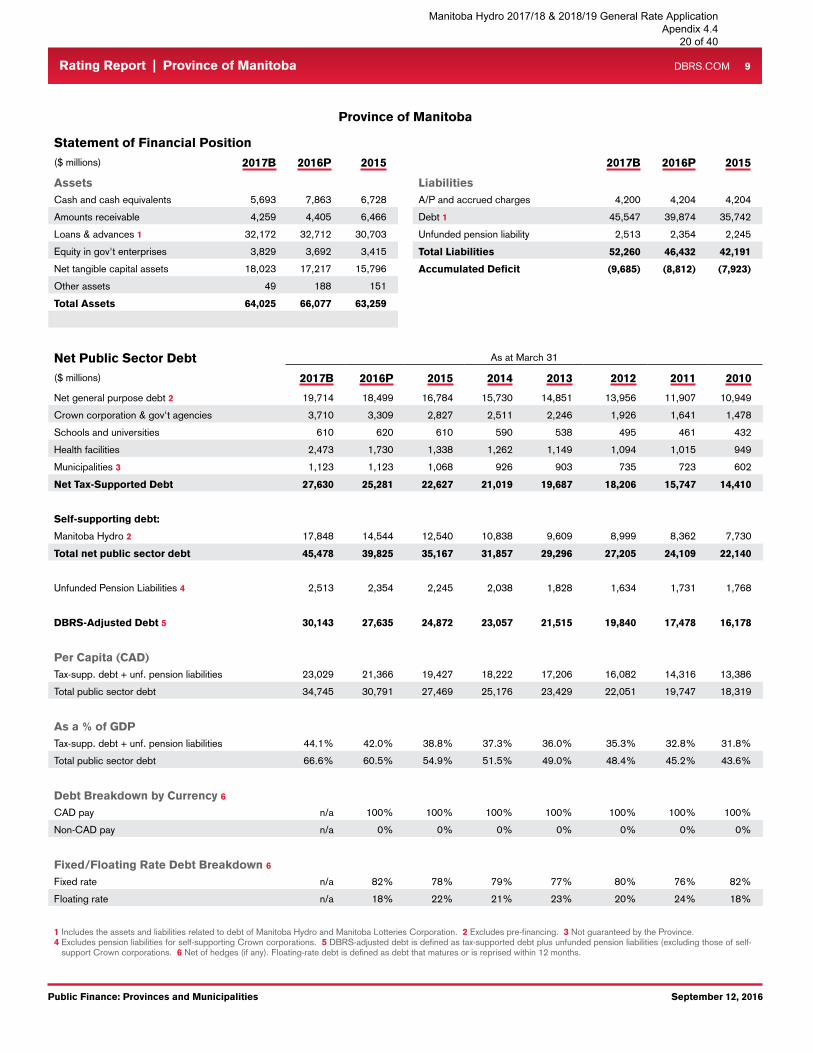
Province of Manitoba
Statement of Financial Position($ millions) 2017B 2016P 2015 2017B 2016P 2015
Assets LiabilitiesCash and cash equivalents 5,693 7,863 6,728 A/P and accrued charges 4,200 4,204 4,204
Amounts receivable 4,259 4,405 6,466 Debt 1 45,547 39,874 35,742
Loans & advances 1 32,172 32,712 30,703 Unfunded pension liability 2,513 2,354 2,245
Equity in gov't enterprises 3,829 3,692 3,415 Total Liabilities 52,260 46,432 42,191 Net tangible capital assets 18,023 17,217 15,796 Accumulated Deficit (9,685) (8,812) (7,923)Other assets 49 188 151
Total Assets 64,025 66,077 63,259
Net Public Sector Debt As at March 31
($ millions) 2017B 2016P 2015 2014 2013 2012 2011 2010Net general purpose debt 2 19,714 18,499 16,784 15,730 14,851 13,956 11,907 10,949
Crown corporation & gov't agencies 3,710 3,309 2,827 2,511 2,246 1,926 1,641 1,478
Schools and universities 610 620 610 590 538 495 461 432
Health facilities 2,473 1,730 1,338 1,262 1,149 1,094 1,015 949
Municipalities 3 1,123 1,123 1,068 926 903 735 723 602
Net Tax-Supported Debt 27,630 25,281 22,627 21,019 19,687 18,206 15,747 14,410
Self-supporting debt: Manitoba Hydro 2 17,848 14,544 12,540 10,838 9,609 8,999 8,362 7,730
Total net public sector debt 45,478 39,825 35,167 31,857 29,296 27,205 24,109 22,140
Unfunded Pension Liabilities 4 2,513 2,354 2,245 2,038 1,828 1,634 1,731 1,768
DBRS-Adjusted Debt 5 30,143 27,635 24,872 23,057 21,515 19,840 17,478 16,178
Per Capita (CAD)Tax-supp. debt + unf. pension liabilities 23,029 21,366 19,427 18,222 17,206 16,082 14,316 13,386
Total public sector debt 34,745 30,791 27,469 25,176 23,429 22,051 19,747 18,319
As a % of GDP Tax-supp. debt + unf. pension liabilities 44.1% 42.0% 38.8% 37.3% 36.0% 35.3% 32.8% 31.8%
Total public sector debt 66.6% 60.5% 54.9% 51.5% 49.0% 48.4% 45.2% 43.6%
Debt Breakdown by Currency 6CAD pay n/a 100% 100% 100% 100% 100% 100% 100%
Non-CAD pay n/a 0% 0% 0% 0% 0% 0% 0%
Fixed/Floating Rate Debt Breakdown 6Fixed rate n/a 82% 78% 79% 77% 80% 76% 82%
Floating rate n/a 18% 22% 21% 23% 20% 24% 18%
1 Includes the assets and liabilities related to debt of Manitoba Hydro and Manitoba Lotteries Corporation. 2 Excludes pre-financing. 3 Not guaranteed by the Province. 4 Excludes pension liabilities for self-supporting Crown corporations. 5 DBRS-adjusted debt is defined as tax-supported debt plus unfunded pension liabilities (excluding those of self-
support Crown corporations. 6 Net of hedges (if any). Floating-rate debt is defined as debt that matures or is reprised within 12 months.
Manitoba Hydro 2017/18 & 2018/19 General Rate Application Apendix 4.4
20 of 40

Public Finance: Provinces and Municipalities September 12, 2016
Rating Report | Province of Manitoba DBRS.COM 10
Unfunded Pension Liabilities (Tax-Supported)
($ millions) Valuation Date Mar. 31, 2016Civil service 1 Dec. 2015 2,813
Teachers 2 Jan. 2012 3,589
Other plans (incl. MLAs, judges, other) Various 1,912
Total liabilities 8,314Pension assets 5,960
Total Unfunded Pension Liabilities 2,3541 Civil service pension plan includes amounts for indexation and unamortized pension adjustment. 2 Teachers’ pension plan includes amount for indexation.
Gross Debt Maturity Schedule
($ millions) 2016-17 2017-18 2018-19 2019-20 2020-212021-22 to
2025-26 2026-27 + Total
Public Sector Debt ($ millions) 4,307 2,497 2,727 2,405 3,527 8,165 15,988 39,615
Public Sector Debt (%) 10.9% 6.3% 6.9% 6.1% 8.9% 20.6% 40.4% 100.0%
Manitoba Hydro 2017/18 & 2018/19 General Rate Application Apendix 4.4
21 of 40

Public Finance: Provinces and Municipalities September 12, 2016
Rating Report | Province of Manitoba DBRS.COM 11
Current 2014 2013 2012 2011 2010
Issuer Rating A (high) A (high) A (high) A (high) NR NR
Long-Term Debt A (high) A (high) A (high) A (high) A (high) A (high)
Short-Term Debt R-1 (middle) R-1 (middle) R-1 (middle) R-1 (middle) R-1 (middle) R-1 (middle)
Related Research• Rating Canadian Provincial Governments, May 25, 2016.
• DBRS Criteria: Guarantees and Other Forms of Support, February 9, 2016.
• Manitoba Hydro-Electric Board: Rating Report, August 17, 2015.
• Confirmed, August 17, 2015.
Rating History
Previous Action
Treasury Bill Limit
Previous Report
• $1.95 billion.
• Province of Manitoba: Rating Report, August 17, 2015.
Notes:All figures are in Canadian dollars unless otherwise noted.
For the definition of Issuer Rating, please refer to Rating Definitions under Rating Policy on www.dbrs.com.
Generally, Issuer Ratings apply to all senior unsecured obligations of an applicable issuer, except when an issuer has a significant or unique level of secured debt.
© 2016, DBRS Limited, DBRS, Inc. and DBRS Ratings Limited (collectively, DBRS). All rights reserved. The information upon which DBRS ratings and reports are based is obtained by DBRS from sources DBRS believes to be reliable. DBRS does not audit the information it receives in connection with the rating process, and it does not and cannot independently verify that information in every instance. The extent of any factual investigation or independent verification depends on facts and circumstances. DBRS ratings, reports and any other information provided by DBRS are provided “as is” and without representation or warranty of any kind. DBRS hereby disclaims any representation or warranty, express or implied, as to the accuracy, timeliness, completeness, merchantability, fitness for any particular purpose or non-infringement of any of such information. In no event shall DBRS or its directors, officers, employees, independent contractors, agents and representatives (collectively, DBRS Representatives) be liable (1) for any inaccuracy, delay, loss of data, interruption in service, error or omission or for any damages resulting therefrom, or (2) for any direct, indirect, incidental, special, compensatory or consequential damages arising from any use of ratings and rating reports or arising from any error (negligent or otherwise) or other circumstance or contingency within or outside the control of DBRS or any DBRS Representative, in connection with or related to obtaining, collecting, compiling, analyzing, interpreting, communicating, publishing or delivering any such information. Ratings and other opinions issued by DBRS are, and must be construed solely as, statements of opinion and not statements of fact as to credit worthiness or recommendations to purchase, sell or hold any securities. A report providing a DBRS rating is neither a prospectus nor a substitute for the information assembled, verified and presented to investors by the issuer and its agents in connection with the sale of the securities. DBRS receives compensation for its rating activities from issuers, insurers, guarantors and/or underwriters of debt securities for assigning ratings and from subscribers to its website. DBRS is not responsible for the content or operation of third party websites accessed through hypertext or other computer links and DBRS shall have no liability to any person or entity for the use of such third party websites. This publication may not be reproduced, retransmitted or distributed in any form without the prior written consent of DBRS. ALL DBRS RATINGS ARE SUBJECT TO DISCLAIMERS AND CERTAIN LIMITATIONS. PLEASE READ THESE DISCLAIMERS AND LIMITATIONS AT http://www.dbrs.com/about/disclaimer. ADDITIONAL INFORMATION REGARDING DBRS RATINGS, INCLUDING DEFINITIONS, POLICIES AND METHODOLOGIES, ARE AVAILABLE ON http://www.dbrs.com.
Manitoba Hydro 2017/18 & 2018/19 General Rate Application Apendix 4.4
22 of 40
Corporates: Utilities & Independent Power November 26, 2015
Rating Report
The Manitoba Hydro-Electric Board
Debt Rating Trend
Long-Term Obligations A (high) Stable
Short-Term Obligations R-1 (middle) Stable
Note: These Obligations are based on the status of the Manitoba Hydro-Electric Board as a Crown agent of the Province of Manitoba and the unconditional guarantee provided by the Province on Manitoba Hydro’s third-party debt, and thus reflect the Province’s debt ratings.
Ratings
Rating Update
DBRS Limited (DBRS) has updated its report on the Manitoba Hydro-Electric Board (Manitoba Hydro or the Utility). The rat-ings assigned to the Utility’s Long-Term Obligations and Short-Term Obligations are a flow-through of the ratings of the Prov-ince of Manitoba (the Province; rated A (high) and R-1 (middle) with Stable trends by DBRS). Pursuant to The Manitoba Hydro Act, the Province unconditionally guarantees almost all of Mani-toba Hydro’s outstanding third-party debt (please see the DBRS Criteria: Guarantees and Other Forms of Explicit Support method-ology for further details). The Province also provides most of the Utility’s financing through provincial advances (approximately 98% of total debt as at March 31, 2015).
In July 2015, the Public Utilities Board of Manitoba (the PUB) issued its decision on the Utility’s 2015–16 and 2016–17 General Rate Application (GRA). The PUB finalized the previously ap-proved interim rate increase of 2.75% effective May 1, 2014, and approved a 3.95% rate increase effective August 1, 2015. In its application, Manitoba Hydro noted that instead of applying for large rate increases when major projects, such as the Bipole III
Transmission Reliability Project (Bipole III), the Keeyask In-frastructure and Generating Station Projects (Keeyask Project) and the Manitoba-Minnesota Transmission Project (MMTP), are brought in service, it currently plans to apply annually for gradual and more moderate increases. However, this rate lag will lead to significant timing differences between the actual capital expenditures (capex) spent and recognition into rates, and will likely result in weaker earnings and cash flows going forward. As a result of the weaker earnings expected during this period of significant capex, the Utility has forecast substantial negative free cash flows for the medium-term. As such, the Utility’s key financial ratios are expected to remain pressured, with lever-age increasing from 81.0% at March 31, 2015, to a peak of around 88% in F2022, and above the target capital structure of 75% debt. DBRS notes that Manitoba Hydro’s key financial metrics could further weaken in the event of adverse drought conditions or po-tential cost overruns on major projects. DBRS expects the Utility to continue to finance any cash shortfalls through advances from the Province.
The Manitoba Hydro-Electric Board, a wholly owned Crown corporation of the Province of Manitoba, is a vertically integrated electric utility that provides generation, transmission and distribution of electricity to approximately 561,869 customers throughout Manitoba and natural gas service to approximately 274,817 customers via its subsidiary, Centra Gas Manitoba Inc. The Utility also exports electricity to more than 25 electric utilities through its participation in four wholesale markets in Canada and in the mid-western United States.
Issuer Description
Financial Information
The Manitoba Hydro-Electric Board
For the year ended March 31
(CAD millions where applicable) 2015 2014 2013 2012 2011
Total debt in capital structure 1 81.0% 79.4% 78.5% 77.9% 77.2%
Cash flow/Total debt 5.2% 6.4% 6.1% 6.3% 7.1%
EBIT gross interest coverage (times) 0.93 0.96 0.89 0.80 1.00
Net income before non-recurring items 114 178 92 61 150
Cash flow from operations 651 691 589 567 595
1 Adjusted for other comprehensive income.
Tom Li+1 416 597 7378
James Jung, CFA, FRM, CPA, CMA+1 416 597 7577
Manitoba Hydro 2017/18 & 2018/19 General Rate Application Apendix 4.4
23 of 40
Corporates: Utilities & Independent Power November 26, 2015
Rating Report | The Manitoba Hydro-Electric Board DBRS.COM 2
Rating Considerations
Major Projects (Under Construction and Planned)
Strengths
1. Debt is a direct obligation of the Province Manitoba Hydro is an agent of the Crown and its debt securities, except for $65 million of Manitoba Hydro-Electric Board Bonds (less than 1% of total debt at March 31, 2015), are held or guaran-teed by the Province; therefore, the ratings assigned to Manitoba Hydro’s obligations are a flow-through of the ratings assigned to the Province.
2. Low-cost hydro-based generation Low-cost hydroelectric-based generating capacity results in one of the lowest variable cost structures in North America, which has enabled Manitoba Hydro to provide electricity to its domes-tic customers at one of the lowest rates on the continent. This gives the Utility the flexibility to increase rates in the future, es-pecially in light of the substantially heightened capex require-ments.
3. Access to export markets Manitoba Hydro’s interconnections (approximately 43% of in-stalled capacity), with firm export transfer capability of 2,100 MW to the United States, 175 MW to Saskatchewan and 200 MW to Ontario, along with additional non-firm transfer capabil-ity, provide the Utility with access to favourable export markets. The interconnections also provide a secure supply of electricity for domestic customers during times of poor hydrology.
Challenges
1. Hydrology risk Given that approximately 92% of Manitoba Hydro’s installed generating capacity is hydroelectricity-based, earnings and cash flows are highly sensitive to hydrological conditions. The Utility is also exposed to significant price and volume risk because of its export commitments under the fixed price-to-volume contract, which may require the Utility to procure power supply from im-port markets if hydrological conditions are unfavourable.
2. High leverageThe Utility has forecast leverage (81.0% as at March 31, 2015) to increase to around 88% during this period of high capex. Ad-ditionally, due to the significant lag before electricity rates fully reflect the cost of the ongoing major projects, Manitoba Hydro has forecast weaker earnings, including two years of negative net income, and significant free cash flow deficits for the medium term in its 2015 Integrated Financial Forecast. This will result in further pressure on the Utility’s key financial metrics, which could be exacerbated in the event of an adverse circumstance (i.e., severe drought). DBRS notes that Manitoba Hydro has no mandatory dividend payment requirements, which provides some financial flexibility.
3. High level of planned capex The need to refurbish aging infrastructure, combined with the aggressive development of new hydro generation and transmis-sion facilities, will require Manitoba Hydro to continue to de-ploy significant capital into its electricity infrastructure over the medium term. The Utility has forecast capex over the next five years will average approximately $2.7 billion per year, which will pressure the already-high debt levels.
ProjectEstimated Cost
($ millions)Planned Construction
Start DateIn-Service
Target DateBipole III Transmission Reliability Project 4,700 2013–2014 2018
Keeyask Infrastructure and Generating Station Projects 6,500 2014 2019–2020
Manitoba-Minnesota Transmission Project 350 2015–2016 mid-2020
• Bipole III: This project involves the construction of a 500-ki-lovolt (kV) high voltage direct current transmission line, along with new converter stations. Construction began over winter 2013–2014 and the transmission line is expected to be in ser-vice for 2018.
• Keeyask Project: This project includes the development of a 695 MW generation station on the Nelson River. Construc-tion began in July 2014 with the first generator expected to be in service for 2019 and the remaining units to be in service by 2020.
• MMTP: This proposed project involves the construction of a 500 kV alternating current transmission line from Winnipeg to the Manitoba-Minnesota border, where it will interconnect with the Great Northern Transmission Line to be built by Min-nesota Power. The Province authorized Manitoba Hydro to proceed with the project in July 2014 and the Utility filed an Environmental Impact Statement in September 2015, which began the formal regulatory review process.
Manitoba Hydro 2017/18 & 2018/19 General Rate Application Apendix 4.4
24 of 40
Corporates: Utilities & Independent Power November 26, 2015
Rating Report | The Manitoba Hydro-Electric Board DBRS.COM 3
Earnings and Outlook
F2015 Summary• Earnings decreased in F2015 as the 2.75% increase in rates ef-
fective May 1, 2014, was insufficient to offset rising interest ex-pense from the higher debt load.
• Earnings were also negatively impacted by the warmer weath-er, which reduced consumption and natural gas revenues. In addition, a U.S. transmission line outage also affected extra-provincial electricity sales.
F2016 Outlook• Manitoba Hydro has forecast net income for F2016 at around
$31 million, with a 3.95% rate increase effective August 1, 2015, offset by increases in finance expense from the higher debt used to fund the ongoing significant capex.
• As a result of rising costs to finance the significant capex pro-gram, Manitoba Hydro has forecast weaker net income for the medium term in its 2015 Integrated Financial Forecast.
– Instead of applying for large rate increases as projects come in service, the Utility plans to apply for more mod-erate annual rate increases of 3.95% until F2029. As a re-sult, these rate increases are expected to be insufficient for Manitoba Hydro to recover costs related to major projects for the medium term.
For the year ended March 31
(CAD millions where applicable) 2015 2014 2013 2012 2011
Total electricity revenues 1,861 1,861 1,733 1,573 1,616
Net gas revenues 154 163 147 132 143
Total revenues 2,015 2,024 1,880 1,705 1,759
EBITDA 1,066 1,068 991 865 968
EBIT 630 626 568 484 575
Gross interest expense 680 654 636 603 573
Earning before taxes 103 156 79 61 150
Net income before non-recurring items 114 178 92 61 150
Reported net income 114 174 92 61 150
Return on equity 1 4.0% 6.6% 3.5% 2.4% 6.3%
1 Adjusted for other comprehensive income.
Manitoba Hydro 2017/18 & 2018/19 General Rate Application Apendix 4.4
25 of 40

Corporates: Utilities & Independent Power November 26, 2015
Rating Report | The Manitoba Hydro-Electric Board DBRS.COM 4
Financial Profile
F2015 Summary• The Utility’s key financial metrics continued to weaken in
F2015 due to (a) the large increase in debt to fund ongoing ca-pex and (b) lower earnings and cash flow for the year.
• Cash flow from operations decreased, largely due to higher in-terest payments for the year as a result of the higher debt load, and lower interest received on investments.
• Gross capex of $1.9 billion included (a) $609 million of mainte-nance capex, (b) $704 million for the Keeyask Project, (c) $365 million for Bipole III and (d) $132 million for the Pointe du Bois Spillway replacement.
• The significant cash flow deficit was funded largely through advances from the Province.
F2016 Outlook• Manitoba Hydro’s key financial metrics are expected to re-
main pressured during this period of high capex. The Utility has forecast its debt-to-capital ratio to rise to 88% in F2022, significantly higher than the long-term target capital structure of 75% debt. The debt-to-capital ratio is not expected to re-cover to the target capital structure until F2032.
• Manitoba Hydro has forecast gross capex of approximately $2.7 billion in F2016, including (a) $641 million of mainte-nance capex, (b) $819 million for the Keeyask Project and (c) $1.2 billion for Bipole III.
– The Utility has forecast capex to peak in F2017 at $3.5 bil-lion and in F2018 at $3.1 billion when Bipole III comes in service. Following the in-service of the Keeyask Project in 2019–2020, capex is expected to moderate to around $800 million a year.
• The high level of capex is expected to result in a negative free cash flow, which will likely be funded through advances from the Province. The increasing debt load will likely lead to fur-ther declines in Manitoba Hydro’s key financial metrics.
– However, with no mandatory dividend payment require-ments, this should provide the Utility with some financial flexibility.
For the year ended March 31
(CAD millions where applicable) 2015 2014 2013 2012 2011
Cash receipts from customers 2,379 2,176 2,015 1,998 2,029
Cash paid to suppliers and employees (1,222) (1,053) (981) (1,048) (1,043)
Interest paid (536) (502) (489) (418) (422)
Interest received 30 70 44 35 31
Cash flow from operations 651 691 589 567 595
Dividends paid 0 0 0 0 0
Capital expenditures (1,746) (1,394) (1,037) (1,124) (1,166)
Free cash flow (1,095) (703) (448) (557) (571)
Acquisitions & investments (113) (103) (98) (90) (88)
Net sinking fund withdrawals/(payments) (3) 206 22 (75) 527
Net debt change 1,556 707 565 673 192
Other 7 3 (59) 29 (164)
Change in cash 352 110 (18) (20) (104)
Total debt (net sinking fund investments) 12,566 10,757 9,633 9,010 8,365
Cash and equivalents 494 142 32 50 70
Total debt in capital structure 1 81.0% 79.4% 78.5% 77.9% 77.2%
Cash flow/Total debt 5.2% 6.4% 6.1% 6.3% 7.1%
EBIT gross interest coverage (times) 0.93 0.96 0.89 0.80 1.00
Dividend payout ratio 0.0% 0.0% 0.0% 0.0% 0.0%
1 Adjusted for other comprehensive income.
Manitoba Hydro 2017/18 & 2018/19 General Rate Application Apendix 4.4
26 of 40

Corporates: Utilities & Independent Power November 26, 2015
Rating Report | The Manitoba Hydro-Electric Board DBRS.COM 5
Long-Term Debt Maturities and Bank Lines
Regulation
Summary• The Province supports Manitoba Hydro by advancing funds
or guaranteeing the Utility’s long-term debt issuances. Long-term debt at March 31, 2015, consisted of the following:
– $12,485 million in advances from the Province (all of which have annual sinking fund requirements).
– $76 million of Manitoba Hydro Bonds.
– $157 million of Manitoba Hydro-Electric Board Bonds.
• Only $65 million of Manitoba Hydro-Electric Board Bonds, which were issued for mitigation projects, do not carry the provincial guarantee.
• Manitoba Hydro maintains a relatively smooth maturity pro-file with potential volatility from foreign currency debt, mostly mitigated through natural and cash flow hedges, and a moder-ate level of floating-rate debt (14% of total debt at March 31, 2015), which adds stability to debt servicing costs and mini-mizes interest rate risk.
• The Utility has bank credit facilities that provide for over-drafts and notes payable of up to $500 million denominated in Canadian and/or U.S. dollars. At March 31, 2015, there were no amounts outstanding. Manitoba Hydro issues short-term promissory notes in its own name for its short-term cash re-quirements and does not receive short-term funding from the Province. These short-term notes are guaranteed by the Prov-ince.
Manitoba Hydro is governed by The Manitoba Hydro Act and its electricity and natural gas rates are regulated by the PUB.
Electricity• Each year, Manitoba Hydro reviews its financial targets with
particular focus on its debt-to-equity target capital structure of 75% to 25%. If the Utility deems a rate adjustment is neces-sary to continue progress towards attainment of its financial targets, it submits a rate application to the PUB.
• The PUB reviews the rate adjustment application with the ob-jective of allowing Manitoba Hydro to recover its cost of ser-vice and achieve its long-term debt-to-equity target. The PUB does not have the mandate to pre-approve capex. The capex planning responsibility resides with Manitoba Hydro and the government of Manitoba.
• The Utility submitted an application for interim rates effec-tive April 1, 2014, in March 2014. On May 6, 2014, the PUB ap-proved a 2.75% increase in interim rates effective May 1, 2014.
• Manitoba Hydro submitted its 2015–16 & 2016–17 GRA in Jan-uary 2015, requesting 3.95% rate increases effective April 1, 2015, and April 1, 2016.
– The PUB advised the Utility that it would not set rates for 2016–17 as part of this application.
– On July 24, 2015, the PUB finalized the previously ap-proved interim rate increase of 2.75% effective May 1, 2014, and approved a 3.95% increase in rates effective August 1, 2015. In its decision, the PUB indicated that it would con-sider various options regarding a process to review rates effective for April 1, 2016.
Debt Profile (CAD millions) For the year ended March 31
% 2015 2014 2013
Advances from the Province 98.2% 12,485 10,683 9,775
Manitoba Hydro Bonds 0.6% 76 169 55
Manitoba Hydro-Electric Board Bonds* 1.2% 157 158 182
100.0% 12,718 11,010 10,012
Adjustments to carrying value of dual currency bonds 6 (12) (20)
Debt discounts and premiums 0 (96) 22
Transaction costs (44) (34) (29)
Total 12,680 10,868 9,985
* Includes $65 million of unguaranteed bonds at March 31, 2015.
Debt Maturities
Year 2016 2017 2018 2019 2020 Thereafter Total
(CAD millions) 377 311 331 987 340 10,372 12,718
% 3% 2% 3% 8% 3% 82% 100%
Manitoba Hydro 2017/18 & 2018/19 General Rate Application Apendix 4.4
27 of 40

Corporates: Utilities & Independent Power November 26, 2015
Rating Report | The Manitoba Hydro-Electric Board DBRS.COM 6
Regulation (CONTINUED)
Watershed Storage Capacity
– For the 2015 rate increase, the PUB directed 1.80% of the revenues associated with the rate increase to be applied to general revenues, while the remaining 2.15% be placed in a deferral account to mitigate rate increases when Bipole III comes in service. This was similar to the PUB’s direction for rate increases approved in 2013–14 and 2014–15, where a portion of the revenues was also allocated to the Bipole III deferral account.
• On November 18, 2015, the Utility submitted its Supplemen-tal Filing for Interim Rates effective April 1, 2016, requesting a 3.95% general rate increase.
• While Manitoba Hydro is the sole retail electricity supplier in Manitoba, under The Manitoba Hydro Amendment Act (the Act), other utilities may access the transmission system to reach customers in neighbouring provinces and states.
• The Act also explicitly allows Manitoba Hydro to build new generating capacity for export sales, to offer new energy-relat-ed services, to enter into strategic alliances and joint ventures, and to create subsidiaries.
• There are presently no plans to move to full retail competition in the Province.
• Manitoba retail customers currently enjoy rates that are among the lowest in North America as a result of Manitoba Hydro’s predominantly hydroelectric generation and efficient resource management.
Natural Gas Distribution • Manitoba Hydro distributes natural gas through its wholly
owned subsidiary, Centra Gas Manitoba Inc. (Centra Gas). In accordance with the rate-setting methodology for natural gas, commodity rates are changed every quarter based on 12-month forward natural gas market prices.
– The commodity cost of gas is a pass-through with no markup to customers.
– Non-commodity costs, such as transportation and storage are also passed on.
• The PUB allows Centra Gas to target an annual profit of ap-proximately $3 million, which is fairly modest compared with Manitoba Hydro’s consolidated earnings.
• Centra Gas filed its 2015–16 Cost of Gas Application in June 2015, requesting, effective November 1, 2015, the approval of supplemental gas, transportation and distribution rates, and for rate riders to disposal of balances in its deferral accounts.
Manitoba Hydro draws water from five distinct watersheds: Nel-son River, Winnipeg River, Saskatchewan River, Churchill River (including the Laurie River) and Burntwood River. This provides the Utility with some geographic diversification, especially dur-
ing times of low hydrology. The main generation source is the Nelson River, which accounted for approximately 76% of power generated in F2015.
Source Of Electrical Energy Generated And Imported For the year ended March 31, 2015
Nelson River 75.66% Saskatchewan River 6.45%
Billion kWh generated 27.4 Billion kWh generated 2.3
Limestone 24.89% Grand Rapids 6.45%
Kettle 23.66%
Long Spruce 19.90% Laurie River 0.16%
Kelsey 5.84% Billion kWh generated 0.1
Jenpeg 1.37% Laurie River #1 0.07%
Laurie River #2 0.08%
Winnipeg River 10.47%
Billion kWh generated 3.8 Burntwood River 3.79%
Seven Sisters 3.11% Billion kWh generated 1.4
Great Falls 2.58% Wuskwatim 3.79%
Pine Falls 1.66%
Pointe du Bois 0.84%
Slave Falls 1.27%
McArthur 1.00%
Thermal 0.19% Purchases (excl. wind) 0.60%
Billion kWh generated 0.1 Billion kWh imported 0.2
Brandon 0.17%
Selkirk 0.02% Wind 2.69%
Billion kWh imported 1.0Source: Manitoba Hydro
Manitoba Hydro 2017/18 & 2018/19 General Rate Application Apendix 4.4
28 of 40

Corporates: Utilities & Independent Power November 26, 2015
Rating Report | The Manitoba Hydro-Electric Board DBRS.COM 7
Watershed Storage Capacity (CONTINUED)
Generating Capacity
Favourable characteristics inherent in Manitoba Hydro’s water-sheds include the following:• Cold temperatures reduce overall evaporation rates, as much
of the water is frozen for up to five months of the year.
• A significant portion of the watersheds consists of rock, which has lower seepage rates and higher runoff than predominantly soil-covered watersheds.
• Lake Winnipeg, Cedar Lake and Southern Indian Lake serve as large storage reservoirs. The Utility’s water storage capacity is a competitive advantage in trading electricity (buying surplus U.S. power at low off-peak prices and selling its electricity dur-ing peak demand periods at higher prices).
In addition to its own generating stations in Manitoba, Manitoba Hydro purchases all electricity from two wind farms in south-ern Manitoba (St. Joseph and St. Leon). The installed capacity of these facilities is 258.5 MW. The Wuskwatim Generating Sta-tion is owned by the Wuskwatim Power Limited Partnership, in which Manitoba Hydro is the majority owner. Manitoba Hydro purchases all the electricity generated from the Wuskwatim Generating Station.
Manitoba Hydro’s Generating Stations and CapabilitiesFor the year ended March 31, 2015
Power Station Location # of Units Net Capacity (MW)
HydroelectricGreat Falls Winnipeg River 6 129
Seven Sisters Winnipeg River 6 165
Pine Falls Winnipeg River 6 87
McArthur Falls Winnipeg River 8 56
Pointe du Bois Winnipeg River 16 75
Slave Falls Winnipeg River 8 68
Grand Rapids Saskatchewan River 4 479
Kelsey Nelson River 7 287
Kettle Nelson River 12 1,220
Jenpeg Nelson River 6 122
Long Spruce Nelson River 10 980
Limestone Nelson River 10 1,350
Laurie River (2) Laurie River 3 10
Wuskwatim Burntwood River 3 211
Total Hydroelectric Generation 105 5,239
ThermalBrandon (coal: 93 MW, gas: 234 MW) 3 327
Selkirk (gas) 2 125
Total Thermal Generation 5 452
Isolated Diesel CapabilitiesBrochet 3
Lac Brochet 2
Shamattawa 3
Tadoule Lake 2
Total Isolated Diesel Generation 10
Total Generation Capacity 5,701
Source: Manitoba Hydro
Manitoba Hydro 2017/18 & 2018/19 General Rate Application Apendix 4.4
29 of 40

Corporates: Utilities & Independent Power November 26, 2015
Rating Report | The Manitoba Hydro-Electric Board DBRS.COM 8
The Manitoba Hydro-Electric Board
Mar. 31 Mar. 31
(CAD millions) 2015 2014 2013 2015 2014 2013
Assets Liabilities & EquityCash & equivalents 494 142 32 S.T. borrowings 0 0 0
Accounts receivable 470 520 421 Accounts payable 560 561 397
Inventories 99 81 93 Current portion L.T.D. 377 408 656
Prepaid expenses & other 0 0 4 Other current liab. 95 100 103
Total Current Assets 1,063 743 550 Total Current Liab. 1,032 1,069 1,156
Net fixed assets 15,250 13,627 12,508 Long-term debt (net sinking fund investments)
12,189 10,349 8,977
Goodwill & intangibles 293 281 276 Sinking fund investments 114 111 352
Investments & others 988 988 1,208 Other L.T. liab. 1,470 1,225 1,121
Shareholders' equity 2,789 2,885 2,936
Total Assets 17,594 15,639 14,542 Total Liab. & SE 17,594 15,639 14,542
For the year ended March 31
Balance Sheet & Liquidity & Capital Ratios 2015 2014 2013 2012 2011
Current ratio 1.03 0.70 0.48 0.65 1.22
Total debt in capital structure 81.8% 78.9% 76.6% 75.8% 74.6%
Total debt in capital structure 1 81.0% 79.4% 78.5% 77.9% 77.2%
Cash flow/Total debt 5.2% 6.4% 6.1% 6.3% 7.1%
(Cash flow-dividends)/Capex 0.37 0.50 0.57 0.50 0.51
Dividend payout ratio 0.0% 0.0% 0.0% 0.0% 0.0%
Coverage Ratios (times)
EBIT gross interest coverage 0.93 0.96 0.89 0.80 1.00
EBITDA gross interest coverage 1.57 1.63 1.56 1.43 1.69
Fixed-charge coverage 0.93 0.96 0.89 0.80 1.00
Profitability RatiosPurchased power/Electricty revenues 7.8% 8.6% 7.7% 9.3% 6.6%
Operating margin 31.3% 30.9% 30.2% 28.4% 32.7%
Net margin 5.7% 8.8% 4.9% 3.6% 8.5%
Return on equity 1 4.0% 6.6% 3.5% 2.4% 6.3%
1 Adjusted for other comprehensive income.
Manitoba Hydro 2017/18 & 2018/19 General Rate Application Apendix 4.4
30 of 40
Corporates: Utilities & Independent Power November 26, 2015
Rating Report | The Manitoba Hydro-Electric Board DBRS.COM 9
Current 2014 2013 2012 2011 2010
Long-Term Obligations A (high) A (high) A (high) A (high) A (high) A (high)
Short-Term Obligations R-1 (middle) R-1 (middle) R-1 (middle) R-1 (middle) R-1 (middle) R-1 (middle)
Note: These Obligations are based on the status of the Manitoba Hydro-Electric Board as a Crown agent of the Province of Manitoba and the unconditional guarantee provided by the Province on Manitoba Hydro’s third-party debt, and thus reflect the Province’s debt ratings.
Related Research
• DBRS Confirms Province of Manitoba at A (high) and R-1 (middle), August 17, 2015.
• Manitoba, Province of: Rating Report, August 17, 2015.
• Confirmed, August 17, 2015.
Rating History
Previous Action
Previous Report
• Manitoba Hydro-Electric Board, The: Rating Report, October 23, 2014.
Short-Term Promissory Notes Programme
• $500 million
Notes:All figures are in Canadian dollars unless otherwise noted.
For the definition of Issuer Rating, please refer to Rating Definitions under Rating Policy on www.dbrs.com.
Generally, Issuer Ratings apply to all senior unsecured obligations of an applicable issuer, except when an issuer has a significant or unique level of secured debt.
© 2015, DBRS Limited, DBRS, Inc. and DBRS Ratings Limited (collectively, DBRS). All rights reserved. The information upon which DBRS ratings and reports are based is obtained by DBRS from sources DBRS believes to be reliable. DBRS does not audit the information it receives in connection with the rating process, and it does not and cannot independently verify that information in every instance. The extent of any factual investigation or independent verification depends on facts and circumstances. DBRS ratings, reports and any other information provided by DBRS are provided “as is” and without representation or warranty of any kind. DBRS hereby disclaims any representation or warranty, express or implied, as to the accuracy, timeliness, completeness, merchantability, fitness for any particular purpose or non-infringement of any of such information. In no event shall DBRS or its directors, officers, employees, independent contractors, agents and representatives (collectively, DBRS Representatives) be liable (1) for any inaccuracy, delay, loss of data, interruption in service, error or omission or for any damages resulting therefrom, or (2) for any direct, indirect, incidental, special, compensatory or consequential damages arising from any use of ratings and rating reports or arising from any error (negligent or otherwise) or other circumstance or contingency within or outside the control of DBRS or any DBRS Representative, in connection with or related to obtaining, collecting, compiling, analyzing, interpreting, com-municating, publishing or delivering any such information. Ratings and other opinions issued by DBRS are, and must be construed solely as, statements of opinion and not statements of fact as to credit worthiness or recommendations to purchase, sell or hold any securities. A report providing a DBRS rating is neither a prospectus nor a substitute for the information assembled, verified and presented to investors by the issuer and its agents in connection with the sale of the securities. DBRS receives compensation for its rating activities from issuers, insurers, guarantors and/or underwriters of debt securities for assigning ratings and from subscribers to its website. DBRS is not responsible for the content or operation of third party websites accessed through hypertext or other computer links and DBRS shall have no liability to any person or entity for the use of such third party websites. This publication may not be reproduced, retransmitted or distributed in any form without the prior written consent of DBRS. ALL DBRS RATINGS ARE SUBJECT TO DISCLAIMERS AND CERTAIN LIMITATIONS. PLEASE READ THESE DISCLAIMERS AND LIMITATIONS AT http://www.dbrs.com/about/disclaimer. ADDITIONAL INFORMATION REGARDING DBRS RATINGS, INCLUDING DEFINITIONS, POLICIES AND METHODOLO-GIES, ARE AVAILABLE ON http://www.dbrs.com.
Manitoba Hydro 2017/18 & 2018/19 General Rate Application Apendix 4.4
31 of 40

Public Finance: Provinces and Municipalities August 17, 2015
Rating Report
Province of Manitoba
Debt Rating Rating Action Trend
Issuer Rating A (high) Confirmed Stable
Long-Term Debt * A (high) Confirmed Stable
Short-Term Debt * R-1 (middle) Confirmed Stable
* Includes guaranteed long- and short-term obligations issued by the Manitoba-Hydro Electric Board.
Ratings
Rating UpdateDBRS Limited (DBRS) has confirmed the Issuer Rating and Long-Term Debt ratings of the Province of Manitoba (the Prov-ince) at A (high), along with its Short-Term Debt rating at R-1 (middle), all with Stable trends. Weak fiscal discipline has led to further delays in the Province’s anticipated fiscal recovery time-line, with a return to balance not foreseen until 2018–19 for core government operations. Despite fiscal challenges, debt remains manageable for the current ratings and a well-diversified and resilient economy should keep Manitoba somewhat insulated from the economic challenges facing some of its more resource-dependent neighbours.
Based on preliminary results, the Province recorded a deficit of $424 million in 2014–15. On a DBRS-adjusted basis, after includ-ing capital expenditures as incurred rather than as amortized, this equates to a shortfall of $1.3 billion, or 2.0% of GDP, and was consistent with expectations. As a result, DBRS-adjusted debt is estimated to have grown by $1.3 billion, or 5.4%, as of March 31, 2015, pushing the debt-to-GDP ratio up to 38.2%, from 37.6% a year earlier. This positions Manitoba with the fourth-highest debt burden among Canadian provinces.
For 2015, the Province has assumed real GDP growth of 2.5%, which now appears somewhat optimistic in relation to the pri-vate sector consensus forecast tracked by DBRS of 2.2%. Regard-less, Manitoba is expected to be among the provincial growth leaders, given its well-diversified economy and only modest ex-
posure to the energy sector. While real growth has disappointed in both Canada and the United States in the first half of 2015, a strengthening U.S. economy and weaker Canadian dollar should be supportive of a transition to stronger export-led growth for Manitoba. In 2016, the current consensus points to real GDP growth of 2.5%, above the 2.3% budget assumption.
Despite a sound economic outlook, Manitoba’s fiscal outlook continues to disappoint with efforts to restore fiscal balance now further delayed. The 2015 budget points to a return to balance by 2018–19 for core government operations, which compares to an expected balance by 2016–17 on a summary budget basis includ-ed in last year’s plan. For 2015–16, a shortfall of $422 million is projected and equates to a DBRS-adjusted deficit of $1.1 billion. This represents 1.7% of GDP and is a wider-than-average fiscal gap relative to provincial peers. Over the medium term, debt growth is expected to slow to between 3% and 5% annually, as the Province continues to address the fiscal imbalance. Provided targets are adhered to, this points to the debt burden stabilizing around 40% of GDP by 2017−18, a modest deterioration from that envisioned last year but still considered manageable for the ex-isting ratings.
With a federal election scheduled for this fall, Manitoba’s next election – originally planned for October 2015 – is expected to be postponed until April 2016. Based on recent polls, a change in government is possible, with Progressive Conservatives well ahead of the governing New Democratic Party.
Manitoba is located in Central Canada and ranks fifth among Canadian provinces by population and sixth in terms of GDP. The Province is home to significant renewable energy resources, with almost all electricity generated from water.
Issuer Description
Financial HighlightsFor the year ended March 31
(all financial figures DBRS adjusted) 2015-16B 2014-15P 2013-14 2012-13 2011-12Debt */GDP 39.6% 38.2% 37.6% 36.4% 35.6%
Surplus (deficit)/GDP (1.7%) (2.0%) (2.1%) (2.2%) (3.5%)
Federal transfers/total revenue 26.0% 26.6% 27.2% 29.2% 31.8%
Interest costs/total revenue 5.3% 5.3% 5.4% 5.6% 5.5%
Real GDP growth rate 2.5% 2.4% 2.2% 3.3% 2.1%
* DBRS-defined: tax-supported debt + unfunded pension liabilities. B = Budget.Source: Province of Manitoba, Statistics Canada, and DBRS calculations.
Travis Shaw+1 416 597 7582 [email protected]
Scott Cherry+1 416 597 7343
Manitoba Hydro 2017/18 & 2018/19 General Rate Application Apendix 4.4
32 of 40

Public Finance: Provinces and Municipalities August 17, 2015
Rating Report | Province of Manitoba DBRS.COM 2
Rating Considerations
Strengths
1. Diversified and resilient economy Manitoba has one of the most resilient and well-diversified economies in the country. This strength was evident during the 2009 downturn, when the Province experienced only a very mild recession. The economy boasts a well-balanced mix of indus-tries, including agriculture and mining, manufacturing, financial services and transportation, and has one of the lowest unemploy-ment rates in Canada. In addition, the composition of Manitoba’s exports also tends to be more diverse than that of other prov-inces. As a result of these factors, the provincial economy shows less volatility than its manufacturing- and resource-dependent neighbours.
2. Manageable debt and sound debt management practices As of March 31, 2015, Manitoba’s debt burden stood at 38.2% of GDP, and, although it has been creeping up since 2009–10, it is comparable to levels seen in the late 1990s and remains manage-able for the current ratings. The Province maintains a relatively smooth debt maturity profile, with no unhedged foreign cur-rency debt (excluding Manitoba Hydro) and a moderate level of floating-rate debt, which adds stability to debt-servicing require-ments.
3. Abundant low-cost hydroelectricity Manitoba benefits from an abundance of low-cost hydroelec-tricity, resulting in some of the lowest electricity rates in North America. This gives the Province a distinct advantage when competing for new business investment. Furthermore, construc-tion began on the Keeyask generating station (695 MW for $6.5 billion) in July 2014 with an anticipated in-service date of 2019. Potential development of the Conawapa site (1,485 MW), has prudently been postponed due to energy conservation efforts and increasing supplies of low-cost energy from shale gas and renewable alternatives such as wind and solar. In this environ-ment, it is becoming more difficult to secure additional export contracts sufficient to advance the development of Conawapa.
Challenges
1. Delayed fiscal recovery Manitoba has further delayed its fiscal recovery target with a return to balance not anticipated until 2018–19. Furthermore, this target is based on core government operations only, not the consolidated entity, which may mean a somewhat longer string of deficits on a consolidated basis. This now marks one of the longest fiscal recovery plans among all provinces, despite having experienced only a very mild recession in 2009.
2. Renewal of public sector collective agreementsAdherence to fiscal targets will be dependent on the successful renewal of a number of collective agreements, including those with teachers and civil servants, which may be challenging in an environment of gradually improving economic conditions.
3. High reliance on federal transfers Despite its relatively resilient economy, Manitoba receives ap-proximately 27% of its revenues by way of federal transfers, including roughly 12% from equalization, leaving it exposed to changes in federal transfer programs. This represents the high-est reliance on federal revenues outside of Atlantic Canada.
4. Below-average income and GDP per capita Manitoba boasts a well-diversified economy and healthy labour market; however, it continues to exhibit below-average wealth. The Province recorded primary household income per capita of $31,396 in 2013, below the national average of $35,189 (the latest year for which information is available). Manitoba also generates below-average GDP per capita, suggesting that productivity and high value-added sectors may be lagging.
Manitoba Hydro 2017/18 & 2018/19 General Rate Application Apendix 4.4
33 of 40

Public Finance: Provinces and Municipalities August 17, 2015
Rating Report | Province of Manitoba DBRS.COM 3
2015-16 Budget
Manitoba’s fiscal outlook continues to disappoint, with efforts to restore balance now further delayed. Based on last year’s plan, a balanced position was projected by 2016–17, on a consolidated basis. However, in the 2015 budget, fiscal balance is not anticipat-ed until 2018–19 and is based on forecasts for core government operations (excluding government business enterprises, health authorities, school divisions, etc.). For 2015–16, a shortfall of $422 million is projected and equates to a DBRS-adjusted deficit of $1.1 billion (after including capital expenditures as incurred rather than as amortized). This represents 1.7% of GDP and is a wider-than-average fiscal gap relative to provincial peers.
Total DBRS-adjusted revenues are forecast to grow by just 1.3% in 2015–16, based on assumed nominal GDP growth of 3.8% for calendar 2015. The 2015 budget was light on revenue measures, with the most notable change being an increase to the small busi-ness income tax threshold. Starting January 1, 2016, the thresh-old at which the zero percent corporate income tax (CIT) rate applies will increase to $450,000 from $425,000. Despite this modest relief, CIT receipts are projected to grow by 6.6%. Per-sonal income tax (PIT) collections are forecast to rise by 4.8%, followed by 3.9% growth for retail sales taxes. Meanwhile, most other revenue sources are projected to see only modest growth or even slight declines. Of note, federal transfers are estimated to fall by almost 1.0%, as increases in health and social transfers will not be sufficient to offset lower equalization and other transfer payments.
Based on budget projections, total DBRS-adjusted spending is forecast to rise by just 0.4% in 2015–16, an ambitious target when compared with average expenditure growth of 3.3% over the past five years. The government has emphasized its desire to protect core services and these areas will continue to be the pri-
mary drivers of expenditure growth. Health care expenditures are projected to rise by 3.2%, although efforts made to reduce the number of health authorities to five from eleven, direct pa-tients to lower-cost forms of care and move to generic drugs have helped to slow the rate of growth. A new four-year agreement with doctors will help to provide cost certainty and also aims to find a further $50 million in efficiency savings over the term. Social services spending is budgeted to grow by 2.6%, driven by funding for 900 new child care spaces, while education will see an increase of 2.1%, due to continued efforts to reduce class sizes and increased operating funding for colleges and universities. Achieving these targets will be dependent on the government’s ability to secure further collective agreements within the as-sumed budget envelopes. In particular, agreements have yet to be reached with civil servants and teachers. Gross capital spend-ing is budgeted to decline by almost 5% but remains in line with the historical five-year average. Interest charges, net of sinking fund earnings, are projected to rise by 1.2%, although given the persistence of low interest rates, there is likely to be savings in this area.
OutlookOver the medium term, the budget forecast points to a return to balance by 2018–19, although DBRS notes that these projec-tions are now based on core government operations only and not the consolidated entity. As a result, DBRS anticipates that on a consolidated basis, deficits may persist somewhat longer, but nonetheless, the fiscal gap is expected to close gradually. The government remains averse to raising taxes and as such, any bud-get pressures that arise due to weaker-than-planned economic performance or cost escalation are likely to necessitate further expenditure reductions. To achieve this, would require greater fiscal discipline than has been achieved so far.
DBRS-Adjusted Surplus (Deficit)-to-GDP 2015-16 DBRS-Adjusted Expenditures (Total: $16.1 billion)
Health37.9%
Agriculture12.4%
Education23.6%
Social services7.2%
Infra. & transp.2.7%
Other11.3%
Interest4.9%
(1.7%)(2.0%)(2.1%)(2.2%)
(3.5%)
(2.1%)(2.0%)
(0.3%)(1.0%)
(5.0%)
(4.0%)
(3.0%)
(2.0%)
(1.0%)
0.0%
1.0%
2.0%
2015
-16B
2014
-15P
2013
-14
2012
-13
2011
-12
2010
-11
2009
-10
2008
-09
2007
-08
Manitoba Hydro 2017/18 & 2018/19 General Rate Application Apendix 4.4
34 of 40

Public Finance: Provinces and Municipalities August 17, 2015
Rating Report | Province of Manitoba DBRS.COM 4
2014-15 Preliminary Results
Debt Profile
Based on preliminary results, the Province recorded a deficit of $424 million in 2014–15. On a DBRS-adjusted basis, this equates to a shortfall of $1.3 billion, or 2.0% of GDP, and was consistent with expectations. Total revenues advanced by 4.0% year over year, and exceeded budget expectations largely due to higher than anticipated federal disaster assistance funding related to prior year flooding. Federal transfers grew by 1.8% as rising health and social transfers, along with other conditional federal transfers, were more than sufficient to offset lower equalization payments, which declined for the fifth straight year. Own-source revenues grew at a faster pace, driven by an 8.8% increase in sales tax collections reflecting the full-year impact of the 1.0% rate increase implemented in 2013. In addition, CIT and PIT re-ceipts advanced by 10.9% and 4.5%, respectively.
Total DBRS-adjusted expenditures are estimated to have grown by 3.5% in 2014–15. Similar to revenues, spending growth ex-ceeded expectations, driven by overspending in health care and higher than anticipated flood costs. Health care expenditures advanced by 3.4%, driven by volume pressures, although this is below the historical five-year average and demonstrates that the Province continues to make progress in this area despite missing budget targets. Education and social services also experienced growth of 4.1% and 4.4%, respectively, although this was partly offset by reductions in agricultural and economic development programs. Gross capital spending fell short of budget expecta-tions, but remained consistent with the prior year’s level. Inter-est charges grew by 3.0%, and too were below expectations due to the low interest rate environment.
DBRS-Adjusted Debt-to-GDP
39.4%38.1%37.6%36.4%35.6%
33.0%31.9%
28.6%29.2%
20%
25%
30%
35%
40%
45%
50%
2015
-16B
2014
-15P
2013
-14
2012
-13
2011
-12
2010
-11
2009
-10
2008
-09
2007
-08
Steady deficits are continuing to boost provincial debt. DBRS-adjusted debt, defined as tax-supported debt plus unfunded pen-sion liabilities, is estimated to have grown by $1.3 billion, or 5.4%, to reach $24.3 billion as of March 31, 2015. This somewhat ex-ceeded expectations, but faster than anticipated growth in nomi-nal GDP resulted in the debt-to-GDP ratio rising only modestly to 38.2%, from 37.6% a year earlier. This positions Manitoba with the fourth-highest debt burden among Canadian provinces.
In 2014–15, the Province completed total borrowing of $5.4 bil-lion, primarily sourced through domestic markets, while one U.S. dollar deal was also transacted. DBRS’s practice is to net pre-financing against debt, which amounted to $235 million for tax-supported obligations and $170 million for Manitoba Hydro in response to strong investor demand and an ongoing low-rate environment. Debt management practices remain prudent as the Province reported no unhedged foreign currency exposure and only moderate floating rate debt (22% of total debt) as of March 31, 2015. Furthermore, the Province aims for a smooth maturi-ty profile and tries to limit maturing debt to no more than $2.0
billion in any fiscal year. This adds stability to borrowing costs, which accounted for only 5.3% of total revenues in 2014–15.
Sizable and growing unfunded pension liabilities continue to pressure DBRS-adjusted debt metrics. At March 31, 2015, un-funded pension liabilities were estimated at $2.3 billion, up 10.9% from the previous year. The civil service superannuation plan and teachers’ pension plan account for majority of unfund-ed pension obligations. DBRS notes that contribution rates have been increasing annually since 2012 for both plans and index-ing is limited to two-thirds of the national CPI, conditional upon one-half of the increase being funded within pension assets. The government periodically borrows to fund cash contributions to the plans in an effort to reduce unfunded liabilities, although no substantive changes have been made to plan design recently.
OutlookFor 2015–16, DBRS-adjusted debt is projected to rise by $1.9 bil-lion, or 7.7%, and reflects ongoing deficits, capital spending in ex-cess of amortization and rising unfunded pension liabilities. This is expected to push the debt-to-GDP ratio up to 39.6%, a level not seen since the late 1990s. Gross borrowing requirements are forecast at $4.7 billion and will be used to fund: refinancing needs ($2.0 billion); crown corporations ($2.0 billion), namely Manito-ba Hydro; the fiscal shortfall and capital investment ($600 mil-lion). In addition, $100 million will be used to reduce unfunded pension obligations. At the time of writing, approximately $1.5 billion, or 30% of borrowing needs, had been fulfilled.
Over the medium term, debt growth is expected to slow to be-tween 3% and 5% annually, as the Province continues to address the fiscal imbalance. Provided targets are adhered to, this points to the debt burden stabilizing around 40% of GDP, a modest de-terioration from that envisioned last year but still considered manageable for the existing ratings.
Manitoba Hydro 2017/18 & 2018/19 General Rate Application Apendix 4.4
35 of 40

Public Finance: Provinces and Municipalities August 17, 2015
Rating Report | Province of Manitoba DBRS.COM 5
Economy
The Province estimates real GDP to have grown by 2.4% in 2014, in line with the national average and somewhat above their 2014 budget assumption. However, based on preliminary estimates from Statistics Canada, real GDP is estimated to have grown by just 1.1% (GDP by industry). The Province attributes the differ-ence to initially weak capital expenditure performance, which has subsequently been revised higher, although not yet reflected in Statistics Canada’s GDP estimates, suggesting that upward revisions are likely later this fall. During the year, crop produc-tion was down from record levels achieved in 2013, but remained above the ten-year historical average. Meanwhile, crude oil pro-duction, which had been a key contributor to growth in recent years, is estimated to have slowed in 2014 as a result of the down-turn in oil prices throughout the course of the year and lack of new discoveries. Driven by new developments in the utility sec-tor, non-residential construction investment experienced solid growth, more than offsetting weakness in residential invest-ment, which shrank year over year. In particular, housing starts declined by almost 17% due to a combination of lower construc-tion of both single- and multi-family residences, although this was partially offset by renovation spending. Despite the decline, housing starts remained well above the historical ten-year av-erage, supported by solid population growth. Manitoba has en-joyed relative success through the provincial nominee program, which has contributed to strong international migration in re-cent years and outweighed interprovincial outmigration. In turn, this helped to boost retail trade by a sound 4.3%. Employment growth was positive, albeit modest, during the year, with gains in full-time positions more than offsetting declines in part-time jobs. By sector, performance was mixed as health care, education and wholesale trade all saw healthy employment gains while business services, culture and recreation, and professional ser-vices experienced job losses. The unemployment rate remained unchanged at 5.4% in 2014 and represents the third-lowest rate among provinces.
OutlookFor 2015, the Province has assumed real GDP growth of 2.5%, which now appears somewhat optimistic in relation to the pri-vate sector consensus tracked by DBRS of 2.2%. Regardless, Manitoba is expected to be among the provincial growth leaders, given its well-diversified economy and only modest exposure to the energy sector. According to Statistics Canada’s July 2015 sur-vey of capital repair and expenditure intentions, non-residential construction, machinery and equipment investment is forecast to rise by 4.5% in 2015, well above the national average, which is expected to experience a decline. Population growth is projected to remain strong, likely buoyed by lower interprovincial outmi-gration to the more resource-intensive provinces. This should support the housing market, although a moderation is expected with starts forecast to decline by 3.5%, according to CMHC’s second-quarter outlook. Both the labour force and employment are expected to see continued growth, helping to hold the un-employment rate steady. As of July 2015, the unemployment rate stood at 5.6%, slightly weaker than budget assumptions. Retail trade performance has also been soft, up only slightly year over year, as of May 2015.
While real growth has disappointed in both Canada and the Unit-ed States in the first half of 2015, a strengthening U.S. economy and weaker Canadian dollar should be supportive of a transition to stronger export-led growth for Manitoba. In 2016, Manitoba is again expected to be among the provincial growth leaders as the current private sector consensus points to real GDP growth of 2.5%, above the 2.3% budget assumption. Slower than antici-pated growth in the United States, or China, Manitoba’s second-largest international export market, and weather and commod-ity prices volatility are viewed as key risks to the outlook over the medium term.
Real GDP Growth Outlooks* 2014 Real GDP Breakdown**
-2%
-1%
0%
1%
2%
3%
4%
5%
BC AB SK MB ON QC NB NS PE NL
2015 2016
*Based on major Canadian banks' forecasts at the time of this report. **Statistics Canada, CANSIM 379-0028. Figures may not add due to rounding.
Manuf. & Construction 18.5%Ag. & Mining5.8%Transpo. & Warehouse 5.8%Wholesale & Retail 11.4%
Other services27.3%Utilities2.4%Pub. admin.8.6%Finance, Insurance, Real Estate 18.3%
Manitoba Hydro 2017/18 & 2018/19 General Rate Application Apendix 4.4
36 of 40

Public Finance: Provinces and Municipalities August 17, 2015
Rating Report | Province of Manitoba DBRS.COM 6
Economic Statistics
For the year ended April 30
2016P 2015P 2014 2013 2012 2011 2010
Nominal GDP ($ millions) 69,178 66,136 63,715 61,323 59,126 55,758 52,896
Nominal GDP growth 4.6% 3.8% 3.9% 3.7% 6.0% 5.4% 4.5%
Real GDP growth 2.3% 2.5% 2.4% 2.2% 3.3% 2.1% 2.6%
Population (thousands) 1,316 1,299 1,282 1,265 1,250 1,234 1,221
Population growth 1.3% 1.3% 1.3% 1.2% 1.4% 1.0% 1.0%
Employment (thousands) 641 634 627 626 622 612 609
Unemployment rate 5.4% 5.4% 5.4% 5.4% 5.3% 5.5% 5.4%
Housing starts (units) 5,900 6,000 6,220 7,465 7,242 6,083 5,888
Retail sales ($ millions) 18,861 18,221 18,034 17,297 16,652 16,443 15,770
Inflation rate (CPI) 2.3% 0.9% 1.9% 2.2% 1.6% 3.0% 0.8%
Household income per capita ($) 30,337 32,488 31,704 31,396 30,579 29,314 28,260
Sources: Statistics Canada (actuals); Manitoba Finance and DBRS estimates; CMHC (housing projections). P= Projected. n.a. = not available.
Province of Manitoba
Budget Projected BudgetBudget Summary * ($ millions) 2015-16 2014-15 2014-15 2013-14 2012-13 2011-12Revenue 14,912 14,720 14,561 14,152 13,540 13,621
Program expenditure 15,270 15,214 15,088 14,694 14,097 14,839
Program surplus (deficit) (358) (494) (527) (542) (557) (1,218)
Interest expense 791 781 803 759 765 748
DBRS-Adjusted Surplus (Deficit) (1,149) (1,275) (1,330) (1,301) (1,322) (1,966)
DBRS adjustments:
Capital expenditures less amortization 727 851 973 779 762 965
Other non-recurring items, incl. assets sales - - - - - -
Surplus (deficit), as reported (422) (424) (357) (522) (560) (1,001)
Tax-supported debt + unfunded pension 26,169 24,308 24,142 23,057 21,515 19,840
Gross borrowing requirements (all entities) 4,725 5,357 4,766 4,528 3,493 5,424
Gross capital expenditure 1,331 1,396 1,553 1,333 1,273 1,441
* DBRS adjusts reported figures to exclude certain non-recurring items (e.g. asset sales). DBRS also recognizes capital expenditures as incurred, rather than as amortized, to improve inter-provincial comparability.
Selected Financial Indicators (DBRS-Adjusted)
Debt */GDP 39.6% 38.2% 38.6% 37.6% 36.4% 35.6%
Surplus (deficit)/GDP (1.7%) (2.0%) (2.1%) (2.1%) (2.2%) (3.5%)
Surplus (deficit)/total revenue (7.7%) (8.7%) (9.1%) (9.2%) (9.8%) (14.4%)
Interest costs/total revenue 5.3% 5.3% 5.5% 5.4% 5.6% 5.5%
Total tax revenues/total revenue 53.5% 52.0% 54.0% 50.7% 49.2% 47.6%
Federal transfers/total revenue 26.0% 26.6% 26.0% 27.2% 29.2% 31.8%
Program expenditures/total revenue 102.4% 103.4% 103.6% 103.8% 104.1% 108.9%
Health expenditures/total expenditures 37.9% 36.9% 36.4% 36.9% 36.7% 34.2%
Program expenditure growth 0.4% 3.5% 2.7% 4.2% (5.0%) 9.4%
Total expenditure growth 0.4% 3.5% 2.8% 4.0% (4.7%) 9.2%
Total revenue growth 1.3% 4.0% 2.9% 4.5% (0.6%) 3.4%
* DBRS-defined: tax-supported debt + unfunded pension liabilities.
Manitoba Hydro 2017/18 & 2018/19 General Rate Application Apendix 4.4
37 of 40

Public Finance: Provinces and Municipalities August 17, 2015
Rating Report | Province of Manitoba DBRS.COM 7
Background Political Information
Party in power: New Democratic Party Legislature seats: 37 of 57
Premier: Greg Selinger Election to be held by: October 2015 *
* If a federal election is held within two weeks of this date, the provincial election will be postponed until April 2016.
Province of Manitoba
Budget Projected Budget
Revenue ($ millions) 2015-16 2014-15 2014-15 2013-14 2012-13 2011-12Personal income tax 3,262 3,113 3,102 2,978 2,846 2,697
Retail sales tax 2,292 2,207 2,207 2,028 1,767 1,658
Corporate taxes 1,210 1,135 1,096 1,024 965 919
Gasoline & motive fuel tax 346 340 340 329 332 269
Tobacco taxes 252 267 286 272 252 249
Education property tax 1 493 475 701 434 380 554
Energy, mining, and other taxes 118 114 131 105 124 142
Total tax revenue 7,973 7,651 7,864 7,169 6,667 6,488
Lottery income 2 582 601 575 554 298 338
Liquor control commission 2 - - - - 261 254
Manitoba Hydro 125 120 62 174 92 61
Natural resource levies 173 170 178 176 168 187
Fees, permits, licences, & other 2,178 2,267 2,089 2,237 2,102 1,961
Total Own-Source Revenue 11,030 10,809 10,768 10,310 9,587 9,289
Equalization payments 1,738 1,750 1,750 1,799 1,872 1,942
Canada health & social transfer 1,698 1,623 1,610 1,524 1,487 1,417
Other federal transfers 445 539 433 519 594 973
Total Federal Transfers 3,882 3,912 3,793 3,842 3,953 4,332
DBRS-Adjusted Revenue 14,912 14,720 14,561 14,152 13,540 13,621
Expenditures ($ millions)
Health 6,088 5,900 5,791 5,706 5,454 5,328
Education and training 3,789 3,709 3,895 3,562 3,339 3,389
Social services 1,151 1,121 1,115 1,074 1,035 1,013
Justice 539 535 542 534 500 460
Infrastructure and transportation 433 534 500 501 540 525
Agriculture, economic, & resource dev. 1,994 1,818 1,977 1,914 1,883 2,209
Other general government 700 784 444 624 584 950
Capital expenditures less amortization 3 727 851 973 779 762 965
Other (150) (38) (150) - - -
DBRS-Adjusted Program Expenditures 15,270 15,214 15,088 14,694 14,097 14,839
Net interest expense 4 791 781 803 759 765 748
DBRS-Adjusted Expenditures 16,061 15,995 15,891 15,453 14,862 15,587
DBRS-Adjusted Surplus (Deficit) (1,149) (1,275) (1,330) (1,301) (1,322) (1,966)
DBRS adjustments:
Capital expenditures less amortization 3 727 851 973 779 762 965
Non-recurring revenue (expenditure) - - - - - -
Surplus (deficit), as reported (422) (424) (357) (522) (560) (1,001)
1 Starting in 2012-13 , education property tax is now reported net of tax credits. As a result, figures are not directly comparable with prior years. 2 In 2013-14, the Manitoba Lotteries Commission was merged with the Manitoba Liquor Control Commission. 3 This adjustment converts capital expenditures to a pay-as-you-go basis. 4 Interest expense is net of sinking fund earnings.
Manitoba Hydro 2017/18 & 2018/19 General Rate Application Apendix 4.4
38 of 40

Public Finance: Provinces and Municipalities August 17, 2015
Rating Report | Province of Manitoba DBRS.COM 8
Province of Manitoba
Balance Sheet (Consolidated Statement)
($ millions) As at March 31 As at March 31
Financial Assets 2014 2013 2012 Liabilities 2014 2013 2012 Cash and cash equivalents 1,802 1,522 1,579 A/P and accrued charges 4,043 3,862 3,936
Amounts receivable 1,548 1,661 1,647 Debt 1 32,662 30,602 28,742
Loans & advances 1 11,828 10,871 10,050 Unamortized for. exch. fluc. (33) (39) (44)
Equity in gov't enterprises 3,820 3,766 3,617 Unfunded pension liability 2,038 1,828 1,634
Net tangible capital assets 10,599 9,842 9,097 Other liabilities - - -
Other assets 2,488 2,655 2,934 Total Liabilities 38,710 36,253 34,268
Total Financial Assets 32,085 30,317 28,924 Accumulated Deficit (6,625) (5,936) (5,344)
Total Liabilities 32,085 30,317 28,924
Net Public Sector Debt * As at March 31
($ millions) 2016B 2015P 2014 2013 2012 2011 2010 2009 Net general purpose debt 2 17,560 16,318 15,730 14,851 13,956 11,907 10,949 9,739
Crown corporation & gov't agencies 3,034 2,655 2,511 2,246 1,926 1,641 1,478 1,341
Schools and universities 710 671 590 538 495 461 432 384
Health facilities 1,535 1,477 1,262 1,149 1,094 1,015 949 831
Municipalities 3 926 926 926 903 735 723 602 544
Net Tax-Supported Debt 23,765 22,047 21,019 19,687 18,206 15,747 14,410 12,839
Self-supporting debt:
Manitoba Hydro 2 14,171 12,418 10,838 9,609 8,999 8,362 7,730 7,499
Total net public sector debt 37,936 34,465 31,857 29,296 27,205 24,109 22,140 20,338
Unfunded Pension Liabilities 4 2,404 2,261 2,038 1,828 1,634 1,731 1,768 1,991
Per Capita (CAD) 4
Tax-supp. debt + unf. pension liabilities 20,150 18,960 18,221 17,205 16,082 14,316 13,386 12,382
Total public sector debt 29,211 26,883 25,175 23,427 22,051 19,747 18,319 16,980
As a % of GDP 4
Tax-supp. debt + unf. pension liabilities 39.6% 38.2% 37.6% 36.4% 35.6% 33.0% 31.9% 28.6%
Total public sector debt 57.4% 54.1% 51.9% 49.5% 48.8% 45.6% 43.7% 39.2%
Debt Breakdown by Currency 5
Cdn$ pay n/a 100% 100% 100% 100% 100% 100% 100%
Non-CAD pay n/a 0% 0% 0% 0% 0% 0% 0%
Fixed/Floating Rate Debt Breakdown 5
Fixed rate n/a 78% 79% 77% 80% 76% 82% 80%
Floating rate n/a 22% 21% 23% 20% 24% 18% 20%
Unfunded Pension Liabilities (Tax-Supported) Valuation Date Mar. 31, 2015 Gross Debt Maturity Profile($ millions) Public Sector Debt
Civil service 6 Dec. 2012 2,603 ($ millions) %
Teachers 6 Jan. 2012 3,323 2015-16 3,840 10.8%
Other plans (includes MLAs, judges, other) Various 1,835 2016-17 2,680 7.5%
2017-18 2,526 7.1%
Total liabilities: 7,761 2018-19 2,736 7.7%
Less pension assets: 5,500 2019-20 2,509 7.1%
Total Unfunded Pension Liabilities: 2,261 2020-21 to 2024-25 7,089 20.0%
2025-26+ 14,148 39.8%
Total 35,528 100%
* Net of sinking fund and Debt Retirement Fund assets. B = budget; P = projected; n/a = not applicable.1 Includes asset and liability items related to debt of The Manitoba Hydro-Electric Board and Manitoba Lotteries Corporation. 2 Excludes pre-financing of $235 million in 2014-15P for general purpose debt and $170 million for Manitoba Hydro. 3 Not guaranteed by the Province. DBRS estimate for 2015P; 2016B. 4 Excludes pension liabilities of self-supporting Crown corporations. 5 Net of hedges (if any). Floating rate debt is defined as debt that matures or is repriced within 12 months. 6 Civil Service includes amounts for indexation and unamortized pension adjustment; Teachers includes amount for indexation.
Manitoba Hydro 2017/18 & 2018/19 General Rate Application Apendix 4.4
39 of 40

Public Finance: Provinces and Municipalities August 17, 2015
Rating Report | Province of Manitoba DBRS.COM 9
Current 2014 2013 2012 2011 2010
Issuer Rating A (high) A (high) A (high) A (high) NR NR
Long-Term Debt A (high) A (high) A (high) A (high) A (high) A (high)
Short-Term Debt R-1 (middle) R-1 (middle) R-1 (middle) R-1 (middle) R-1 (middle) R-1 (middle)
Related Research
• Rating Canadian Provincial Governments, June 9, 2015.
• DBRS Criteria: Guarantees and Other Forms of Explicit Support, February 23, 2015.
• Manitoba Hydro-Electric Board, The, October 23, 2014.
• Confirmed, October 17, 2014.
Rating History
Previous Action
Previous Report
• Manitoba, Province of, Rating Report, October 17, 2014.
Treasury Bill Limit
• $1.95 billion.
Notes:All figures are in Canadian dollars unless otherwise noted.
For the definition of Issuer Rating, please refer to Rating Definitions under Rating Policy on www.dbrs.com.
Generally, Issuer Ratings apply to all senior unsecured obligations of an applicable issuer, except when an issuer has a significant or unique level of secured debt.
© 2015, DBRS Limited, DBRS, Inc. and DBRS Ratings Limited (collectively, DBRS). All rights reserved. The information upon which DBRS ratings and reports are based is obtained by DBRS from sources DBRS believes to be reliable. DBRS does not audit the information it receives in connection with the rating process, and it does not and cannot independently verify that information in every instance. The extent of any factual investigation or independent verification depends on facts and circumstances. DBRS ratings, reports and any other information provided by DBRS are provided “as is” and without representation or warranty of any kind. DBRS hereby disclaims any representation or warranty, express or implied, as to the accuracy, timeliness, completeness, merchantability, fitness for any particular purpose or non-infringement of any of such information. In no event shall DBRS or its directors, officers, employees, independent contractors, agents and representatives (collectively, DBRS Representatives) be liable (1) for any inaccuracy, delay, loss of data, interruption in service, error or omission or for any damages resulting therefrom, or (2) for any direct, indirect, incidental, special, compensatory or consequential damages arising from any use of ratings and rating reports or arising from any error (negligent or otherwise) or other circumstance or contingency within or outside the control of DBRS or any DBRS Representative, in connection with or related to obtaining, collecting, compiling, analyzing, interpreting, com-municating, publishing or delivering any such information. Ratings and other opinions issued by DBRS are, and must be construed solely as, statements of opinion and not statements of fact as to credit worthiness or recommendations to purchase, sell or hold any securities. A report providing a DBRS rating is neither a prospectus nor a substitute for the information assembled, verified and presented to investors by the issuer and its agents in connection with the sale of the securities. DBRS receives compensation for its rating activities from issuers, insurers, guarantors and/or underwriters of debt securities for assigning ratings and from subscribers to its website. DBRS is not responsible for the content or operation of third party websites accessed through hypertext or other computer links and DBRS shall have no liability to any person or entity for the use of such third party websites. This publication may not be reproduced, retransmitted or distributed in any form without the prior written consent of DBRS. ALL DBRS RATINGS ARE SUBJECT TO DISCLAIMERS AND CERTAIN LIMITATIONS. PLEASE READ THESE DISCLAIMERS AND LIMITATIONS AT http://www.dbrs.com/about/disclaimer. ADDITIONAL INFORMATION REGARDING DBRS RATINGS, INCLUDING DEFINITIONS, POLICIES AND METHODOLOGIES, ARE AVAILABLE ON http://www.dbrs.com.
Manitoba Hydro 2017/18 & 2018/19 General Rate Application Apendix 4.4
40 of 40