manitoba annual tick-borne disease report 2015 · manitoba annual tick-borne disease report 2015...
TRANSCRIPT
Manitoba Annual
Tick-Borne Disease
Report
2015
January 1, 2008 to December 31, 2015
Communicable Disease Control
Public Health Branch
Public Health and Primary Health Care Division
Manitoba Health, Seniors and Active Living
Released: November 2016 (revised December 2017)

Page 1 of 40
TABLE OF CONTENTS
Abbreviations .................................................................................................................... 4
Acknowledgments ........................................................................................................... 5
Executive Summary ......................................................................................................... 6
What to Expect in This Report ........................................................................................ 7
Blacklegged Ticks, Surveillance and Tick-Borne Diseases .................................... 8 Blacklegged tick biology .........................................................................................................8 Passive Surveillance.................................................................................................................9 Active Surveillance ................................................................................................................. 10 Reportable Tick-Borne Diseases .......................................................................................... 11
Anaplasmosis ................................................................................................................................. 11 Babesiosis ....................................................................................................................................... 11 Lyme Disease ................................................................................................................................. 11
Introduction ..................................................................................................................... 12
Key Elements in Tick Surveillance Maps ................................................................. 14
Tick Surveillance ........................................................................................................... 15 Passive Surveillance, 2008-2015 ........................................................................................... 15 Passive Surveillance, 2015 .................................................................................................... 17
Anaplasma phagocytophilum ..................................................................................................... 18 Babesia microti .............................................................................................................................. 20 Borrelia burgdorferi ...................................................................................................................... 21
Active Surveillance, 2010-2013 ............................................................................................. 23 Active Surveillance, 2015 ....................................................................................................... 25
Tick-Borne Diseases in Humans ................................................................................. 27 Anaplasmosis .......................................................................................................................... 27 Babesiosis ................................................................................................................................ 27 Lyme disease ........................................................................................................................... 27
Discussion ....................................................................................................................... 36
Appendix A (Provincial Surveillance Case Definitions – Anaplasmosis) ............ 38
Appendix B (Provincial Surveillance Case Definitions – Babesiosis) .................. 39
Appendix C (National Surveillance Case Definitions – Lyme Disease) ............... 40
Page 2 of 40
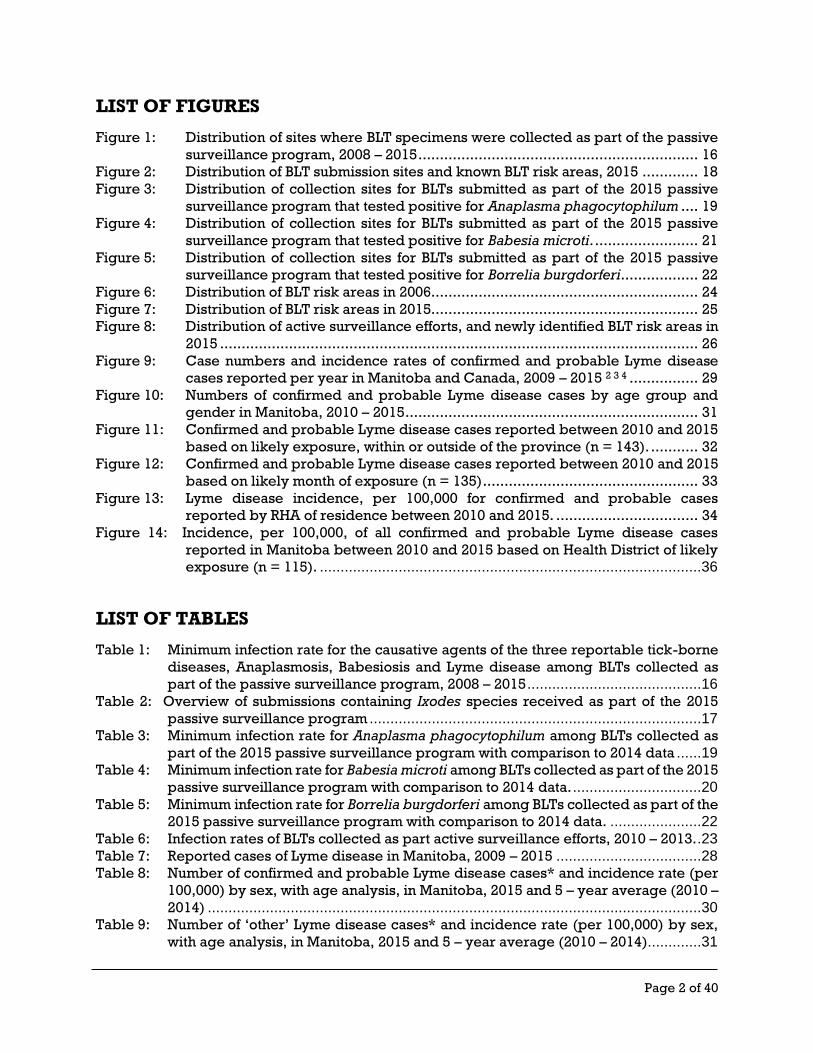
LIST OF FIGURES
Figure 1: Distribution of sites where BLT specimens were collected as part of the passive
surveillance program, 2008 – 2015 ................................................................. 16 Figure 2: Distribution of BLT submission sites and known BLT risk areas, 2015 ............. 18 Figure 3: Distribution of collection sites for BLTs submitted as part of the 2015 passive
surveillance program that tested positive for Anaplasma phagocytophilum .... 19 Figure 4: Distribution of collection sites for BLTs submitted as part of the 2015 passive
surveillance program that tested positive for Babesia microti. ........................ 21 Figure 5: Distribution of collection sites for BLTs submitted as part of the 2015 passive
surveillance program that tested positive for Borrelia burgdorferi .................. 22 Figure 6: Distribution of BLT risk areas in 2006.............................................................. 24 Figure 7: Distribution of BLT risk areas in 2015.............................................................. 25 Figure 8: Distribution of active surveillance efforts, and newly identified BLT risk areas in
2015 ............................................................................................................... 26 Figure 9: Case numbers and incidence rates of confirmed and probable Lyme disease
cases reported per year in Manitoba and Canada, 2009 – 2015 2 3 4 ................ 29 Figure 10: Numbers of confirmed and probable Lyme disease cases by age group and
gender in Manitoba, 2010 – 2015 .................................................................... 31 Figure 11: Confirmed and probable Lyme disease cases reported between 2010 and 2015
based on likely exposure, within or outside of the province (n = 143). ........... 32 Figure 12: Confirmed and probable Lyme disease cases reported between 2010 and 2015
based on likely month of exposure (n = 135) .................................................. 33 Figure 13: Lyme disease incidence, per 100,000 for confirmed and probable cases
reported by RHA of residence between 2010 and 2015. ................................. 34 Figure 14: Incidence, per 100,000, of all confirmed and probable Lyme disease cases
reported in Manitoba between 2010 and 2015 based on Health District of likely
exposure (n = 115). ............................................................................................36
LIST OF TABLES
Table 1: Minimum infection rate for the causative agents of the three reportable tick-borne
diseases, Anaplasmosis, Babesiosis and Lyme disease among BLTs collected as
part of the passive surveillance program, 2008 – 2015 ..........................................16 Table 2: Overview of submissions containing Ixodes species received as part of the 2015
passive surveillance program ................................................................................17 Table 3: Minimum infection rate for Anaplasma phagocytophilum among BLTs collected as
part of the 2015 passive surveillance program with comparison to 2014 data ......19 Table 4: Minimum infection rate for Babesia microti among BLTs collected as part of the 2015
passive surveillance program with comparison to 2014 data. ...............................20 Table 5: Minimum infection rate for Borrelia burgdorferi among BLTs collected as part of the
2015 passive surveillance program with comparison to 2014 data. ......................22 Table 6: Infection rates of BLTs collected as part active surveillance efforts, 2010 – 2013. .23 Table 7: Reported cases of Lyme disease in Manitoba, 2009 – 2015 ...................................28 Table 8: Number of confirmed and probable Lyme disease cases* and incidence rate (per
100,000) by sex, with age analysis, in Manitoba, 2015 and 5 – year average (2010 –
2014) .......................................................................................................................30 Table 9: Number of ‘other’ Lyme disease cases* and incidence rate (per 100,000) by sex,
with age analysis, in Manitoba, 2015 and 5 – year average (2010 – 2014).............31

Page 3 of 40
Table 10: Lyme disease incidence, per 100,000 for confirmed and probable cases reported
by RHA of residence between 2010 and 2015...................................................... 35
Page 4 of 40
Abbreviations BLT Blacklegged tick (Ixodes scapularis)
MHSAL Manitoba Health, Seniors and Active Living
NNDSS National Notifiable Disease Surveillance System
PHAC the Public Health Agency of Canada
RHA Regional Health Authority
Regional Health Authorities
Winnipeg RHA Winnipeg Regional Health Authority1
Southern Health – Santé Sud Southern Health – Santé Sud
Interlake-Eastern RHA Interlake-Eastern Regional Health Authority
Prairie Mountain Health Prairie Mountain Health
Northern RHA Northern Regional Health Authority
1 Note that reference to the Winnipeg RHA in this report does not include the community of Churchill.
Rather reference to the Winnipeg RHA in this report refers only to the City of Winnipeg and the Rural
Municipalities of East and West St Paul.

Page 5 of 40
Acknowledgments The Manitoba Annual Tick-Borne Disease Report (2015) is the result of the efforts of dedicated
individuals throughout the province of Manitoba, including health care providers, laboratory
personnel, central and regional public health employees (i.e. Medical Officers of Health,
public health nurses, seasonal field surveillance staff), external stakeholders (i.e. the Public
Health Agency of Canada (PHAC) staff) and members of the public who have submitted
blacklegged tick specimens.
The historical passive surveillance program (2008 – 2015) was a collaborative effort between
Manitoba Health, Seniors and Active Living (MHSAL), PHAC and researchers and students at
the University of Manitoba.
Citation
Government of Manitoba, Manitoba Health, Seniors and Active Living, Public Health and
Primary Health Care Division, Public Health Branch, Communicable Disease Control (2015).
Manitoba Annual Tick-Borne Disease Report 2015.
Let us know what you think. We appreciate your feedback! If you would like to comment on
any aspect of this new report please send an email to: [email protected]. Include ‘TBD report’
in the subject heading.

Page 6 of 40
Executive Summary The public health impact posed by tick-borne diseases such as Anaplasmosis,
Babesiosis, and most notably Lyme disease, continues to increase in Manitoba. This increase
has been largely attributed to the continued range expansion of the vector, the blacklegged
tick (Ixodes scapularis). This rapid expansion has allowed for the establishment of populations
in areas once thought inhospitable for blacklegged ticks (BLT).
Since the identification of the first BLT risk area in 2006, the number and distribution of
said risk areas has steadily increased. Risk areas now extend from the Ontario border to the
Brandon area and from the United States of America (USA) border to the southern edge of
Interlake-Eastern Regional Health Authority (RHA). The minimum infection rates (MIR) for
Anaplasma phagocytophilum the causative agent of Anaplasmosis continues to exceed 5.0%,
whereas the MIR for Borrelia burgdorferi, the causative agent of Lyme disease, continues to
hover around 20.0% based on passive surveillance data.
The impact of tick-borne diseases on humans, in particular the impact of Lyme disease,
has also steadily risen over the previous seven years. The number of confirmed and probable
Lyme disease cases (as per PHAC’s National surveillance case definitions), reported annually
in Manitoba increased significantly, from 5 in 2009 to 37 in 2014 and 29 in 2015. Of all the
confirmed and probable Lyme disease cases reported to MHSAL since Lyme disease became
nationally reportable in 2009, nearly two-thirds were reported between 2013 and 2015.
Further, in 2009 approximately 40.0% of all confirmed and probable Lyme disease cases had
likely exposure outside of Manitoba; by 2015 this number has dropped to approximately
13.0%. Southern Health – Santé Sud, an area with a long history of established BLT populations,
had the highest incidence rates for Lyme disease based on both region of residence and likely
exposure location.
MHSAL continues to monitor the distribution and infection rates of BLTs to identify new
risk areas and develop and refine guidance and communications for both health care
professionals and the public. In addition, MHSAL continues to monitor BLT populations for
evidence of emerging pathogens of public health concern.
Page 7 of 40
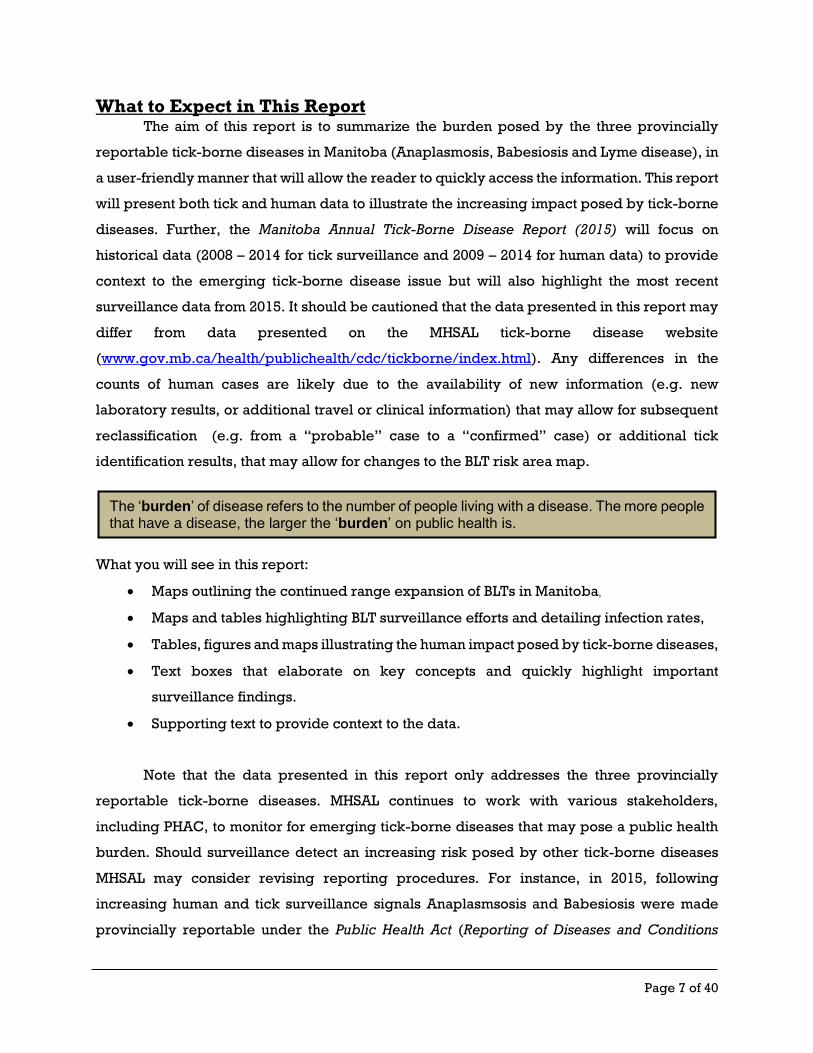
What to Expect in This Report The aim of this report is to summarize the burden posed by the three provincially
reportable tick-borne diseases in Manitoba (Anaplasmosis, Babesiosis and Lyme disease), in
a user-friendly manner that will allow the reader to quickly access the information. This report
will present both tick and human data to illustrate the increasing impact posed by tick-borne
diseases. Further, the Manitoba Annual Tick-Borne Disease Report (2015) will focus on
historical data (2008 – 2014 for tick surveillance and 2009 – 2014 for human data) to provide
context to the emerging tick-borne disease issue but will also highlight the most recent
surveillance data from 2015. It should be cautioned that the data presented in this report may
differ from data presented on the MHSAL tick-borne disease website
(www.gov.mb.ca/health/publichealth/cdc/tickborne/index.html). Any differences in the
counts of human cases are likely due to the availability of new information (e.g. new
laboratory results, or additional travel or clinical information) that may allow for subsequent
reclassification (e.g. from a “probable” case to a “confirmed” case) or additional tick
identification results, that may allow for changes to the BLT risk area map.
What you will see in this report:
Maps outlining the continued range expansion of BLTs in Manitoba,
Maps and tables highlighting BLT surveillance efforts and detailing infection rates,
Tables, figures and maps illustrating the human impact posed by tick-borne diseases,
Text boxes that elaborate on key concepts and quickly highlight important
surveillance findings.
Supporting text to provide context to the data.
Note that the data presented in this report only addresses the three provincially
reportable tick-borne diseases. MHSAL continues to work with various stakeholders,
including PHAC, to monitor for emerging tick-borne diseases that may pose a public health
burden. Should surveillance detect an increasing risk posed by other tick-borne diseases
MHSAL may consider revising reporting procedures. For instance, in 2015, following
increasing human and tick surveillance signals Anaplasmsosis and Babesiosis were made
provincially reportable under the Public Health Act (Reporting of Diseases and Conditions
The ‘burden’ of disease refers to the number of people living with a disease. The more people that have a disease, the larger the ‘burden’ on public health is.

Page 8 of 40
Regulation – Schedule B http://web2.gov.mb.ca/laws/regs/current/_pdf-
regs.php?reg=37/2009).
Blacklegged Ticks, Surveillance and Tick-Borne Diseases
Blacklegged tick biology BLTs are parasitic animals which are related to spiders. BLTs cannot jump or fly.
Instead, they seek hosts by climbing on vegetation such as grasses or shrubs and waiting for
a host to rub against them. When this occurs, they climb onto the host’s body and eventually
attempt to attach and feed.
BLTs feed by attaching their mouth parts to the skin of an animal (including humans)
and drinking blood very slowly over a period of days. A tick bite is generally painless. As
ticks feed, their bodies expand to accommodate the blood meal. This is called engorgement.
If a BLT is infected with a tick-borne disease causing agent, it can pass this infection along to
its host during feeding.
Tick-borne diseases naturally circulate
between BLTs and wild animals. Animals such as
rodents, small mammals and white-tailed deer are
the reservoirs (the source) of the tick-borne disease
causing agents and the BLT is the vector (the
vehicle) which moves the disease agents between
animals. Most wild animals do not become ill from
these agents, nor can you become infected with tick-
borne diseases by consuming meat or handling the
pelt from a wild animal. However, there is a risk for
these ticks to transfer to you when handling the
animal. Humans and some domestic animals are
accidental hosts and may become ill when they are
fed upon by an infected BLT and exposed to the
disease causing agent.
BLTs exist in three life stages: larva, nymph and adult. The life cycle of BLTs takes at
least three years to complete and each stage usually survives for up to one year. Blood is
Even if you are bitten by a BLT, it
does not mean that it will transmit
a disease to you. First, not all BLTs
are infected with disease causing
agents. Second, only nymph and
adult stages can transmit infection
(larvae need to acquire the disease
agent(s) when feeding). And third,
BLTs need time to prepare their
bodies to significantly expand with
blood and often do not start to feed
for the first 24 hours after attaching
themselves to a host. Because of
this, BLTs typically need to be
attached to a host for at least 24
hours in order to transmit the
disease causing agents of
Anaplasmosis, Babesiosis and Lyme disease. This is why performing a
tick check is so important.

Page 9 of 40
required by the tick to move to the next stage. Unfed larvae and nymphs are light in color and
very difficult to see.
Passive Surveillance
The passive BLT surveillance program was formally launched in Manitoba in 1996 and
continued until 2002, when stable submission numbers coupled with low and consistent
infection rates led to its termination. The program was renewed in 2008 following an
investigation into a cluster of human cases with common exposure history which identified the
first established BLT population in the extreme southeast corner of the province in 2006. Since
the renewal in 2008, the program has been a collaborative effort between MHSAL, the
University of Manitoba and PHAC. As of the fall of 2015 the program is now a sole collaboration
between MHSAL and PHAC.
Data from the passive surveillance program provide invaluable information regarding
the potential distribution of BLTs and their associated pathogens. Blacklegged tick specimens
are submitted by health care providers, veterinarians and members of the public on a
voluntary basis throughout the year, with a targeted fall advertising campaign. Suitable
specimens are tested for Anaplasma phagocytophilum, Babesia microti (the causative agent of
Babesiosis) and Borrelia burgdorferi to determine and compare infection rates. Moreover data
such as locations with multiple submissions and/or locations from which more than one
specimen was submitted, are used to guide and prioritize the active surveillance program.
Sites warranting active surveillance correspond to areas where the passive program has
identified clusters and/ or high numbers of BLT submissions and/ or infection rates.
Passive surveillance is when health care providers, veterinarians, or members of the
public send ticks to MHSAL, in order for the species to be identified. Suitable specimens
are then tested for tick-borne diseases. Results of the passive surveillance program are
used to identify locations for active surveillance.
For information on how to submit ticks to the passive surveillance program, please visit
www.gov.mb.ca/health/publichealth/cdc/tickborne/about.html.
Testing for additional tick-borne pathogens such as Borrelia miyamotoi and Borrelia
mayonii is also conducted. However, as these pathogens are currently not reportable in
Manitoba, the results are not considered in this report. MHSAL continues to work with
PHAC to monitor the impact of these and other emerging pathogens of public health importance.

Page 10 of 40
Active Surveillance
Active surveillance is a vital component of the overall BLT surveillance program for
two reasons. Firstly, it is required to demonstrate evidence of a reproducing (established)
population of BLTs which is defined as an area where all life stages are found over repeated
visits. Secondly, it is used to demonstrate evidence of the circulation of tick-borne pathogens
within both BLTs and within the surveyed environment. The combination of this evidence
allows an area to be classified as having an established BLT population.
Identifying BLT risk areas is critical for risk assessment, risk communication and is
valuable for the classification of human cases. The risk of encountering BLTs, and any
associated pathogens, is greater in regions where BLT populations are known to be
established. MHSAL recommends that visitors and residents of BLT risk areas adopt personal
protective measures to minimize their risk of tick-borne disease transmission (for more
information see the tick-borne disease website:
www.gov.mb.ca/health/publichealth/cdc/tickborne/prevention.html). Further, MHSAL encourages
physicians to consider tick-borne diseases in their differential diagnosis when seeing patients
with compatible clinical symptoms and travel history to, or residence within, a risk area or
region with suitable BLT habitat.
Criteria for identifying a blacklegged tick risk area
A region will be classified as a risk area when active surveillance, conducted over 2km,
detects a minimum of one BLT provided that the surveillance efforts were triggered by
one of the following:
1) It represents an extension of a previously identified BLT risk area, OR
2) Positive passive surveillance results (i.e. multiple submissions and/ or multiple specimens in a submission), OR
3) A cluster of human cases with likely exposure within the area, OR
4) The area is in close proximity, and has suitable habitat to support establishment, of
a known BLT risk area.
Active surveillance is when MHSAL staff go out into the field to find BLTs in the environment. Active surveillance is necessary to identify risk areas.

Page 11 of 40
Reportable Tick-Borne Diseases While the signs and symptoms of each tick-borne disease may vary, they each share
two common features; the vector (BLTs) and prevention measures. The key prevention
measure to reduce the risk of transmission is to minimize the risk of exposure to BLTs. Thus,
the adoption of frequent tick-checks and other prevention measures can greatly reduce the
probability of disease transmission when traveling or residing within BLT risk areas, or
regions with suitable habitat. For more prevention information see the MHSAL tick borne-
disease website.
Anaplasmosis
Anaplasmosis, formerly known as Human Granculocytic Anaplasmosis, is caused by
the bacteria Anaplasma phagocytophilum. The most common route of transmission is via the
bite of an infected blacklegged tick. Common symptoms include fever, plus one or more of
the following: chills, headache, muscle aches and joint pain. While most cases of
Anaplasmosis are mild and self-limiting, older individuals and those with compromised
immune systems can develop severe illness that often requires hospitalization. Antibiotic
treatment is started based on a physician’s suspicion of infection with most symptoms.
Treatment is typically successful, with symptoms resolving within 30 days of onset, although
resolution may be slightly longer for those with more severe illness.
Babesiosis
Babesiosis is an infection caused by a parasite most commonly transmitted via the bite
of an infected blacklegged tick, though transmission through blood and other transfusion
products is also possible. There are a number of Babesia species worldwide however the most
common species in North America and Manitoba is Babesia microti. Common symptoms of
Babesiosis are often mild, non-specific and flu-like. Symptoms may start with the gradual
onset of fatigue and discomfort, followed by one or more of the following: chills, sweats,
anorexia, headache, weakness, nausea, non-productive cough and joint pain. The risk of
severe illness is greater among older individuals and those with underlying medical
conditions. Babesiosis can be successfully treated with anti-parasitic drugs with most
symptoms resolving within 1 – 2 weeks.
Lyme Disease
Lyme disease can be caused by one of three species of tick-borne bacterium. In
Manitoba, as in North America, locally acquired cases are associated with Borrelia

Page 12 of 40
burgdorferi, which can be transmitted via the bite of an infected blacklegged tick2. Common
symptoms of Lyme disease include a red-expanding rash (Erythema migrans), headache,
fever, fatigue and chills. If left untreated Lyme disease infection can cause joint, heart and
nervous system complications. Physicians are encouraged to treat based on clinical
symptoms, and the disease can be treated successfully with antibiotics, particularly when
diagnosed early.
Introduction
Tick-borne diseases are recognized as some of the most common vector-borne
diseases in North America, and the impact of these diseases, particularly Lyme disease,
continues to expand in both Canada and Manitoba. In Manitoba there are three principle tick-
borne diseases of public health concern; Anaplasmosis, Babesiosis and Lyme disease. Lyme
disease became provincially reportable in 1999 and nationally reportable in 2009. With
increasing infection rates among BLT collected via surveillance programs, Anaplasmosis and
Babesiosis were made provincially reportable beginning January 1, 2015. This report details
activity associated with the three provincially reportable tick-borne diseases, among both
humans and BLTs, between January 1, 2008 and December 31, 2015.
The Communicable Disease Control (CDC) unit of MHSAL routinely monitors both
human and tick surveillance data in an effort to assess and communicate changes associated
with tick-borne disease transmission risk. The risk of exposure to BLTs, and potentially any
associated pathogens, is significantly greater in risk areas where surveillance has
demonstrated that they are established. These BLT risk areas are identified through passive
surveillance data and human case clusters, and subsequently confirmed via active tick
surveillance. MHSAL reviews BLT surveillance and human data annually to identify new risk
2 Note that the western blacklegged tick (Ixodes pacificus) can also transmit Borrelia burgdorferi,
however its range is limited to the Pacific Coast of North America.
In Manitoba, there are several species of ticks, but this report focuses on Ixodes
scapularis, which is responsible for spreading tick-borne diseases to humans. This tick
is more commonly known as the deer tick or the blacklegged tick. Other tick species,
such as the more common wood tick (Dermacentor variabilis), are not effective vectors
of disease causing agents of human importance in Manitoba.
Page 13 of 40
areas, assess risk and refine risk messaging and guidance for both health care professionals
and the general public.
Methods
Lyme disease data was reported for the period January 1, 2009 to December 31, 2015.
Lyme disease data focused primarily on cases that met the confirmed and probable National
surveillance case definitions (see Appendix C). In some instances cases classified as ‘other’
(not meeting the National surveillance case definitions) were included to further illustrate
trends. Throughout the report, confirmed and probable Lyme disease cases for 2015 were
compared with the data since 2009, when the National surveillance case definition came into
effect.
Anaplasmosis and Babesiosis became provincially reportable on January 1, 2015.
Consequently, cases of Anaplasmosis and Babesiosis meeting provincial surveillance case
definitions (see Appendix A and B) were reported for the period between January 1, 2015 and
December 31, 2015.
Incidence rates were calculated using the MHSAL population files
(www.gov.mb.ca/health/population/index.html) which provide the mid-year population
count as of June 1 of the year in question. All rates are crude incidence rates calculated as the
number of cases (numerator) divided by the population of the group specified (denominator)
and multiplied by 100,000 to produce the number of reported cases per 100,000 persons. That
is, the number of cases per 100,000 individuals in that population. For example, the 2015 Lyme
disease incidence rate for residents of Southern Health – Santé Sud was calculated with a
numerator of the number of Lyme disease cases (meeting National surveillance case
definitions), and a denominator of the total population in that RHA as of June of that year. The
average incidence rates were calculated with a numerator of the average number of Lyme
disease cases from the specified RHA from 2010 to 2014, and a denominator of the average
population of the RHA specified, from 2010 to 2014.
When comparing incidence rates, and especially when comparing case counts
between RHAs, it is important to keep in mind that the differing population counts between
regions can contribute to an incidence rate that looks conspicuously large even when there
are only a few cases, or an incidence rate that appears small even when there are many cases.
For example, Northern Health Region may experience large changes in incidence when there
are small changes in the case count, due to its small population; the opposite goes for the
Winnipeg RHA.

Page 14 of 40
Key Elements in Tick Surveillance Maps
Health regions, Manitoba lakes and
reference cities symbology will not be
listed in the legends going forward. Please use this map as a reference.
All maps use the same projection, scale and base map data.
Maps display areas of interest: Prairie
Mountain Health, Southern Health –
Santé Sud, Winnipeg and Interlake
Eastern RHA health regions.
Manitoba is divided into 5 Health
Regions. Tick surveillance occurs
primarily in southern Manitoba.
This densely populated region is
associated with the majority of tick
submissions and most tick-borne
disease cases.

Page 15 of 40
Tick Surveillance
Passive Surveillance, 2008-2015
Between 2008 and 2015, BLT submissions were received from locations across much
of Manitoba (Figure 1). Most submissions have been received from the southern portion of the
province, an area that corresponds to higher population densities, and geographic proximity
to Minnesota where BLTs have been well established since the early 1980s. Specimens
collected from northern areas are thought to be associated with migratory birds, and
therefore not suggestive of establishment given the unsuitable habitat and climate.
The number of BLT submissions received as part of the passive surveillance program
has steadily increased (Table 1). In 2009 the program received 122 submissions, whereas by
2013 and 2014 there were more than 400 submissions received annually. Coupled with
increased submission rates, is an increase in BLT infection rates, particularly for Anaplasma
phagocytophilum and Borrelia burgdorferi, over this time period. Moreover, since 2013 the
MIR for B. burgdorferi has hovered near and/ or exceeded 20%, while the MIR for A.
phagocytophilum has exceeded 5.0% (Table 1). Testing for Babesia microti only started in
2013, and infection rates remain relatively low, hovering between 0.8 and 1.7% (Table 1).
Highlights
Since 2008 the number of BLT submissions and infection rates have increased.
The most common tick-borne pathogens are Borrelia burgdorferi the agent of Lyme
disease, and Anaplasma phagocytophilum, the agent of Anaplasmosis.
By 2015 the minimum infection rates (MIR) for the agents of Anaplasmosis and Lyme
disease were 6.2% and 19.1% respectively.
In 2015 most infected BLTs were collected from locations within or in close proximity to
previously identified risk areas.
A BLT specimen refers to a single tick. A submission refers to one or more tick specimens that are submitted at once by one individual.

Page 16 of 40
Figure 1: Distribution of sites where BLT specimens were collected as part of the passive
surveillance program, 2008 – 2015
Table 1: Minimum infection rate for the causative agents of the three reportable tick-borne
diseases, Anaplasmosis, Babesiosis and Lyme disease among BLTs collected as part of the
passive surveillance program, 2008 – 2015
2008 2009 2010 2011 2012 2013 2014 2015
# Tested 151 122 324 310 220 434 417 486
% A.
phagocytophilum
positive
3.3% 4.9% 6.2% 3.1% 3.3% 7.4% 5.8% 6.2%
% B. microti
positive N/A N/A N/A N/A N/A 1.2% 1.7% 0.8%
% B. burgdorferi
positive 16.3% 12.3% 11.4% 16.3% 10.5% 21.0% 24.7% 19.1%
Page 17 of 40
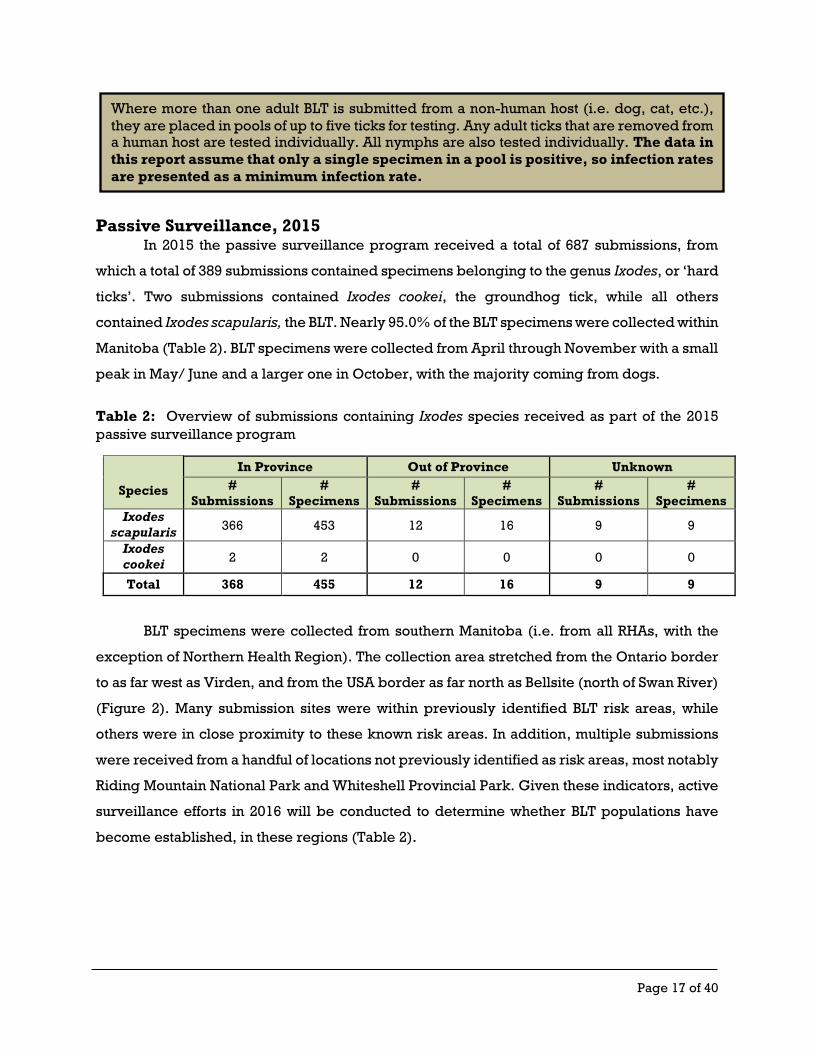
Passive Surveillance, 2015 In 2015 the passive surveillance program received a total of 687 submissions, from
which a total of 389 submissions contained specimens belonging to the genus Ixodes, or ‘hard
ticks’. Two submissions contained Ixodes cookei, the groundhog tick, while all others
contained Ixodes scapularis, the BLT. Nearly 95.0% of the BLT specimens were collected within
Manitoba (Table 2). BLT specimens were collected from April through November with a small
peak in May/ June and a larger one in October, with the majority coming from dogs.
Table 2: Overview of submissions containing Ixodes species received as part of the 2015
passive surveillance program
Species
In Province Out of Province Unknown
#
Submissions
#
Specimens
#
Submissions
#
Specimens
#
Submissions
#
Specimens
Ixodes
scapularis 366 453 12 16 9 9
Ixodes
cookei 2 2 0 0 0 0
Total 368 455 12 16 9 9
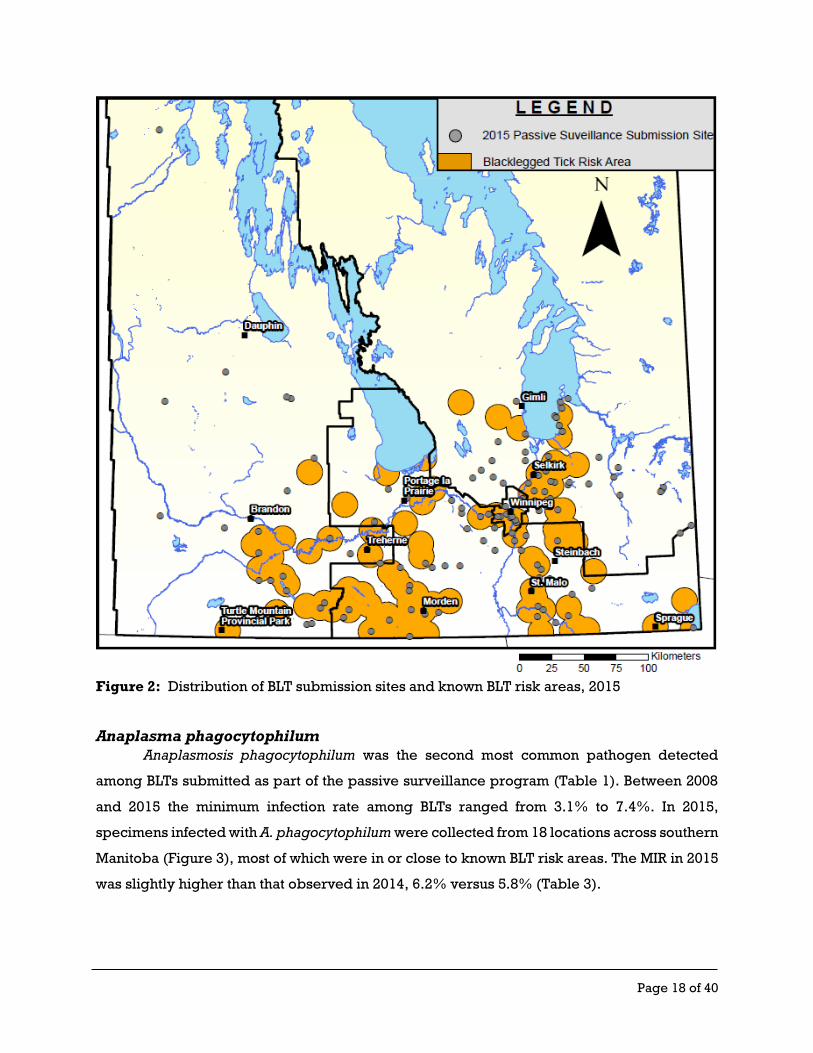
BLT specimens were collected from southern Manitoba (i.e. from all RHAs, with the
exception of Northern Health Region). The collection area stretched from the Ontario border
to as far west as Virden, and from the USA border as far north as Bellsite (north of Swan River)
(Figure 2). Many submission sites were within previously identified BLT risk areas, while
others were in close proximity to these known risk areas. In addition, multiple submissions
were received from a handful of locations not previously identified as risk areas, most notably
Riding Mountain National Park and Whiteshell Provincial Park. Given these indicators, active
surveillance efforts in 2016 will be conducted to determine whether BLT populations have
become established, in these regions (Table 2).
Where more than one adult BLT is submitted from a non-human host (i.e. dog, cat, etc.),
they are placed in pools of up to five ticks for testing. Any adult ticks that are removed from a human host are tested individually. All nymphs are also tested individually. The data in
this report assume that only a single specimen in a pool is positive, so infection rates
are presented as a minimum infection rate.
Page 18 of 40
Figure 2: Distribution of BLT submission sites and known BLT risk areas, 2015
Anaplasma phagocytophilum
Anaplasmosis phagocytophilum was the second most common pathogen detected
among BLTs submitted as part of the passive surveillance program (Table 1). Between 2008
and 2015 the minimum infection rate among BLTs ranged from 3.1% to 7.4%. In 2015,
specimens infected with A. phagocytophilum were collected from 18 locations across southern
Manitoba (Figure 3), most of which were in or close to known BLT risk areas. The MIR in 2015
was slightly higher than that observed in 2014, 6.2% versus 5.8% (Table 3).

Page 19 of 40
Figure 3: Distribution of collection sites for BLTs submitted as part of the 2015 passive
surveillance program that tested positive for Anaplasma phagocytophilum
Table 3: Minimum infection rate for Anaplasma phagocytophilum among BLTs collected as
part of the 2015 passive surveillance program with comparison to 2014 data
Negative Positive % Positive (2015) % Positive (2014)
Adults 444 30 6.4% 5.7%
Nymphs 12 0 0.0% 9.1%
Total 456 30 6.2% 5.8%
Adult male BLTs will attach to a host, but do not take a blood meal, so they cannot transmit disease to humans or other hosts.

Page 20 of 40
Babesia microti
Babesia microti, the causative agent of Babesiosis, was the least common pathogen
detected among BLTs submitted as part of the passive surveillance program (Table 1). Testing
for this pathogen only began in 2013 and since then MIRs have remained relatively low,
ranging between 0.8% and 1.7%. In 2015, specimens infected with B. microti were collected
from 4 sites, all of which were in previously identified BLT risk areas (Figure 4). In comparison
with 2014 minimum infection rates increased among adult males and nymphs, albeit with low
overall numbers, while they decreased among adult females (Table 4).
Table 4: Minimum infection rate for Babesia microti among BLTs collected as part of the 2015
passive surveillance program with comparison to 2014 data.
Negative Positive % Positive (2015) % Positive (2014)
Adults 471 3 0.6% 1.7%
Nymphs 11 1 8.3% 0.0%
Total 482 4 0.8% 1.7%

Page 21 of 40
Figure 4: Distribution of collection sites for BLTs submitted as part of the 2015 passive
surveillance program that tested positive for Babesia microti.
Borrelia burgdorferi
Borrelia burgdorferi was the most common tick-borne pathogen detected among BLTs
collected in Manitoba. Between 2008 and 2015 the minimum infection rate ranged between
10.5% and 24.7% (Table 1). Moreover, since 2013 the MIR has hovered around, and/ or
exceeded 20.0%. In 2015, specimens infected with B. burgdorferi were collected from 60
locations across southern Manitoba (Figure 5), the majority of which were in or clos to known
BLT risk areas. The MIR in 2015, 19.1%, was less than that observed in 2014, 24.7% (Table 5).

Page 22 of 40
Figure 5: Distribution of collection sites for BLTs submitted as part of the 2015 passive
surveillance program that tested positive for Borrelia burgdorferi
Table 5: Minimum infection rate for Borrelia burgdorferi among BLTs collected as part of the
2015 passive surveillance program with comparison to 2014 data.
Negative Positive % Positive (2015) % Positive (2014)
Adults 387 87 18.4% 25.2%
Nymphs 6 6 50.0% 9.1%
Total 393 93 19.1% 24.7%
Page 23 of 40
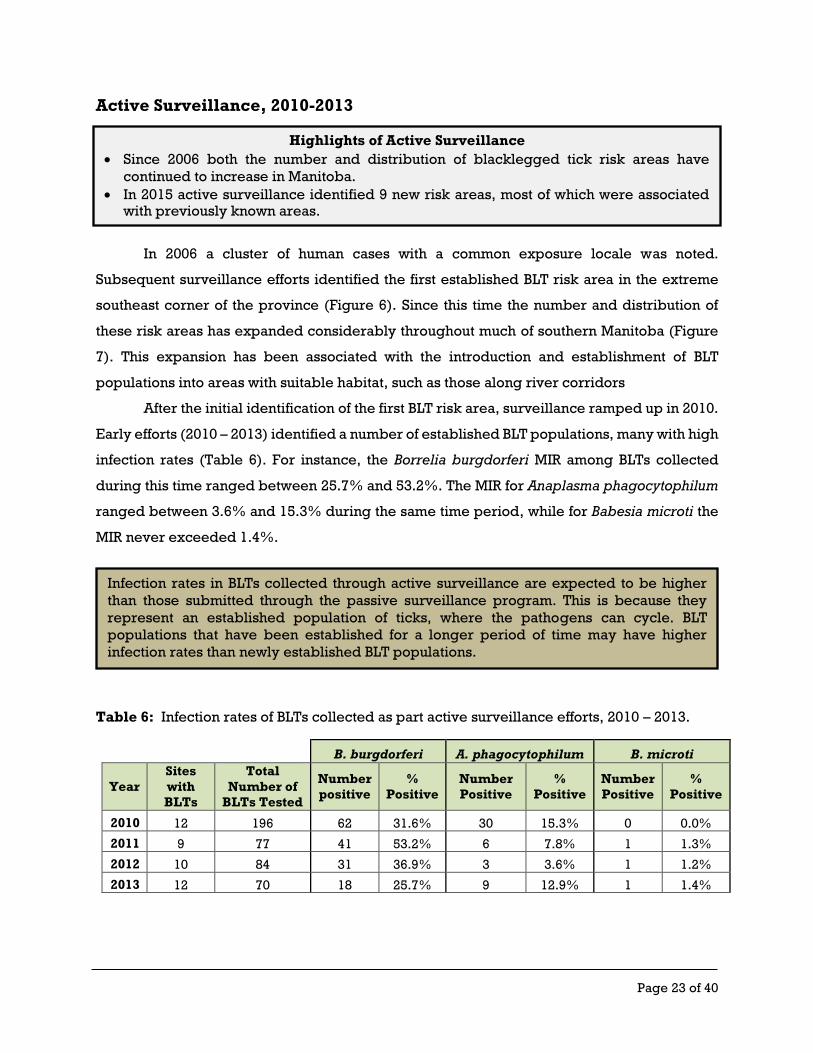
Active Surveillance, 2010-2013
In 2006 a cluster of human cases with a common exposure locale was noted.
Subsequent surveillance efforts identified the first established BLT risk area in the extreme
southeast corner of the province (Figure 6). Since this time the number and distribution of
these risk areas has expanded considerably throughout much of southern Manitoba (Figure
7). This expansion has been associated with the introduction and establishment of BLT
populations into areas with suitable habitat, such as those along river corridors
After the initial identification of the first BLT risk area, surveillance ramped up in 2010.
Early efforts (2010 – 2013) identified a number of established BLT populations, many with high
infection rates (Table 6). For instance, the Borrelia burgdorferi MIR among BLTs collected
during this time ranged between 25.7% and 53.2%. The MIR for Anaplasma phagocytophilum
ranged between 3.6% and 15.3% during the same time period, while for Babesia microti the
MIR never exceeded 1.4%.
Table 6: Infection rates of BLTs collected as part active surveillance efforts, 2010 – 2013.
B. burgdorferi A. phagocytophilum B. microti
Year
Sites
with
BLTs
Total
Number of
BLTs Tested
Number
positive
%
Positive
Number
Positive
%
Positive
Number
Positive
%
Positive
2010 12 196 62 31.6% 30 15.3% 0 0.0%
2011 9 77 41 53.2% 6 7.8% 1 1.3%
2012 10 84 31 36.9% 3 3.6% 1 1.2%
2013 12 70 18 25.7% 9 12.9% 1 1.4%
Highlights of Active Surveillance
Since 2006 both the number and distribution of blacklegged tick risk areas have
continued to increase in Manitoba.
In 2015 active surveillance identified 9 new risk areas, most of which were associated with previously known areas.
Infection rates in BLTs collected through active surveillance are expected to be higher
than those submitted through the passive surveillance program. This is because they
represent an established population of ticks, where the pathogens can cycle. BLT
populations that have been established for a longer period of time may have higher
infection rates than newly established BLT populations.

Page 24 of 40
Figure 6: Distribution of BLT risk areas in 2006

Page 25 of 40
Figure 7: Distribution of BLT risk areas in 2015
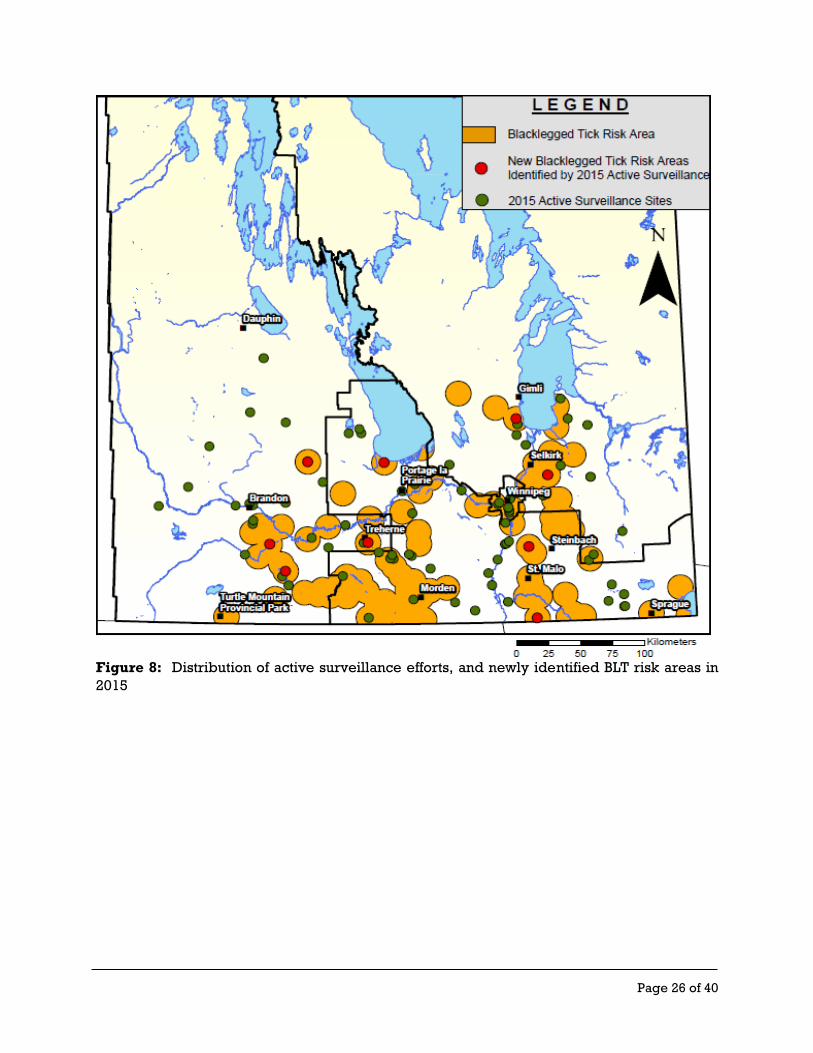
Active Surveillance, 2015 In 2015, active surveillance was conducted at a total of 87 sites spread across much of
southern Manitoba (Figure 8). Nine new BLT risk areas were identified in 2015, most of which
represent natural extensions of previously known risk areas. Within these sites a total of 41
BLTs were collected and infection rate status is pending.
Page 26 of 40
Figure 8: Distribution of active surveillance efforts, and newly identified BLT risk areas in
2015

Page 27 of 40
Tick-Borne Diseases in Humans
Anaplasmosis On January 1, 2015 Anaplasmosis became provincially reportable. The decision to
make it reportable reflected both increasing infection rates among BLT populations and the
identification of the first locally acquired human case in Manitoba in 2013.
In 2015 four Anaplasmosis cases were reported to MHSAL. Two of the cases met the
provincial surveillance case definition for confirmed cases, while two were classified as
probable (see Appendix A for the provincial surveillance case definitions). There was an even
split between male and female cases, and the age range was 31 to 60. Cases resided in the
Interlake-Eastern (n = 2), Southern (n = 1) and Winnipeg Health Region (n = 1). All had likely
exposure within Canada, and three had likely exposure within the province. The exposure
locations in the province correspond to well-known BLT risk areas situated in eastern and
southern Manitoba.
Babesiosis On January 1, 2015 Babesiosis became provincially reportable (see Appendix B for
provincial surveillance case definitions). The decision to make it reportable reflected the
continued detection of this pathogen in locally acquired BLT specimens, and the identification
of the first locally acquired human case in Manitoba in 2013. Note that the 2013 cases was also
the first Babesiosis case with local acquisition in Canada.
In 2015 there were no cases of Babesiosis reported to MHSAL.
Lyme disease
Lyme disease was initially made provincially reportable in 1999. Between 1999 and
2007, MHSAL received a total of 19 clinical and/or laboratory reports of Lyme disease. In 2008
Lyme disease Highlights
Incidence rates (per 100,000) for confirmed and probable cases have increased significantly since 2009.
The highest incidence rates, based on region of residence, for confirmed and probable cases are in the Southern Health – Santé Sud RHA (7.21 per 100,000 in 2015). o Health Districts with the highest incidence rates for confirmed and probable cases
correspond to areas with longer history of established BLT populations.
Approximately 9 out of 10 confirmed and probable cases reported since 2013 had likely exposure within Manitoba.
The majority of confirmed and probable cases were males.
More than half of confirmed and probable cases were 40 years of age or older.

Page 28 of 40
a total of 26 reports were received for cases meeting the provincial case definitions for
confirmed, probable or suspected cases. In 2009, PHAC, in consultation with provinces and
territories developed National surveillance case definitions (see Appendix C). The National
surveillance case definitions were developed to ensure that case data reporting,
interpretation and analysis are consistent across the country. Further, these definitions
included standard data elements to capture laboratory, clinical and environmental (i.e.
exposure to a region with an established BLT population and evidence of pathogen
circulation) data to analyze changes in case incidence rates and risk across the country.
Between 2009 and 2015 MHSAL reported 148 confirmed and probable Lyme disease
cases (Table 7) to PHAC through the NNDSS. Manitoba has also reported, at the provincial
level, 51 ‘other’ cases in this time period. Cases classified as ‘other’ are those which do not
meet the strict National case definition. For instance, ‘other’ cases typically have supporting
clinical or laboratory evidence, which may raise the suspicion of Lyme disease, but when
considered independently do not meet the National standards.
Table 7: Reported cases of Lyme disease in Manitoba, 2009 – 2015
Case
Classification 2015 2014 2013 2012 2011 2010 2009 Total
Confirmed Case * 11 22 16 9 8 7 1 74
Probable Case * 18 15 14 11 6 6 4 74
Other Case ** 8 11 8 11 2 5 6 51
Total Reported *** 37 48 38 31 16 18 11 199
* National surveillance case definitions are available at:
www.phac-aspc.gc.ca/publicat/ccdr-rmtc/09vol35/35s2/Lyme-eng.php
** Cases listed as ‘other’ are reported by either physician or lab but fail to meet the classification criteria for
‘confirmed’ or ‘probable’
*** Total cases reported and classified as of September 15, 2016.
In 2009 a total of 144 confirmed and probable Lyme disease cases were reported in
Canada through the NNDSS, most of which were from four provinces; Manitoba, Nova Scotia,
Ontario and Quebec. Since then the number of confirmed and probable cases reported, as
well as the incidence rate (per 100,000) has steadily increased (Figure 9), with 522 reported
in 2014 and 917 reported in 2015. The situation in Manitoba mirrors the National trend with a
marked increase in both the incidence rate per 100,000 and the number of confirmed and
probable cases reported between 2009 (n = 5) and 2015 (n = 29) (Figure 9). Despite the
similar trends, Manitoba’s case numbers represent a fraction of the total reported nationally.

Page 29 of 40
In 2009 Manitoba accounted for approximately 3.5% of the total confirmed and probable
cases, while in 2015 Manitoba’s cases accounted for approximately 3.2% of the total reported.
Figure 9: Case numbers and incidence rates of confirmed and probable Lyme disease cases
reported per year in Manitoba and Canada, 2009 – 2015 3 4 5
The number and incidence rate of confirmed and probable Lyme disease cases
reported in Manitoba declined from a high of 37 and 2.83 in 2014 to 29 and 2.20 in 2015 (Table
8). However, when compared against the five-year average total case count (22.8) and
incidence rate (1.80) the 2015 data were higher. The differences in case count and incidence
rate were associated with the marked increase in confirmed and probable Lyme disease
cases reported among males. In 2015 there were 21 cases of Lyme disease reported among
males with an incidence rate of 3.20, compared to the five year average of 13.2 cases and
3 Ogden, N. H., Koffi, J. K., Lindsay, L. R., et al. Surveillance for Lyme disease in Canada, 2009 – 2012.
CCDR. 2015, 41 (6): 132-145. 4 Surveillance of Lyme disease. http://healthycanadians.gc.ca/diseases-conditions-maladies-
affections/disease-maladie/lyme/surveillance-eng.php (accessed October 5, 2016) 5 National Lyme disease surveillance in Canada 2013: Web Report.
http://www.healthycanadians.gc.ca/publications/diseases-conditions-maladies-affections/lyme-
surveillance-2013/index-eng.php (accessed October 5, 2016)
0
0.5
1
1.5
2
2.5
3
0
100
200
300
400
500
600
700
800
900
1000
2009 2010 2011 2012 2013 2014 2015
Inc
ide
nc
e R
ate
(p
er
10
0,0
00
)
Re
po
rte
d L
ym
e d
ise
as
e c
as
es
MB Cases CAN Cases MB Incidence CAN Incidence

Page 30 of 40
incidence or 2.10. Among females there was a slight decline in the incidence rate (1.20
compared to 1.49) and case count (8 compared to 9.6) when 2015 data was compared with the
five year average. Though lower in overall number (n = 51), similar trends were observed for
those Lyme disease cases reported provincially as ‘other’ (Table 9).
In terms of populations most impacted by Lyme disease, the 2015 incidence rate
among males is much higher than in females, 3.20 compared to 1.20 (Table 8). The trend is
similar for the five-year average, 2.10 compared to 1.49. In 2015 males accounted for 72.0%
of the reported confirmed and probable Lyme disease cases. Moreover, the breakdown of
male and female Lyme disease cases reported between 2010 and 2015 was 87 and 56
respectively (Figure 10).
The historical age range of confirmed, probable and ‘other’ cases ranged from 3 to 85
(Tables 8 and 9). The average age of confirmed and probable Lyme disease cases in 2015 was
46.4, which was slightly higher than the five year average of 38.4 (Table 8). However, the
median was similar for 2015 compared to the five year average. Nearly three-quarters of the
confirmed and probable Lyme disease cases (n = 95) reported in Manitoba occurred in
individuals thirty years of age or older (Figure 10). In addition, more than half of the Lyme
disease cases (n = 77) reported to MHSAL since 2010 occurred in individuals forty years of
age or older.
Table 8: Number of confirmed and probable Lyme disease cases* and incidence rate (per
100,000) by sex, with age analysis, in Manitoba, 2015 and 5 – year average (2010 – 2014)
2015 2010 - 2014 Average
Case Count Incidence Case Count Incidence
Total 29 2.20 22.8 1.80
Female 8 1.20 9.6 1.49
Male 21 3.20 13.2 2.10
Age Analysis (in years) Age Analysis (in years)
Average 46.4 38.4
Median 42.0 44.0
St. Dev. 19.7 22.3
Min. Age 8 3.0
Max. Age 79 84.0
* As per the National surveillance case definitions (http://www.phac-aspc.gc.ca/publicat/ccdr-
rmtc/09vol35/35s2/Lyme-eng.php. Accessed September 8, 2016)

Page 31 of 40
Table 9: Number of ‘other’ Lyme disease cases* and incidence rate (per 100,000) by sex,
with age analysis, in Manitoba, 2015 and 5 – year average (2010 – 2014)
2015 2010 - 2014 Average
Case Count Incidence Case Count Incidence
Total 8 0.61 7.4 0.58
Female 2 0.15 2.8 0.22
Male 6 0.45 4.6 0.36
Age Analysis (in years) Age Analysis (in years)
Average 46.4 46.5
Median 57.0 46.0
St. Dev. 22.3 21.9
Min. Age 9 3
Max. Age 67 85
* Note that Manitoba records ‘other’ Lyme disease cases where the data is suggestive of infection, but is not
sufficient, more often incomplete, to meet the more stringent requirements of the National surveillance case
definition.
Figure 10: Numbers of confirmed and probable Lyme disease cases by age group and
gender in Manitoba, 2010 – 2015
In 2009, approximately 40.0% of the confirmed and probable Lyme disease cases
reported to MHSAL had likely acquisition outside of Manitoba. By 2013 this had dropped to
0 5 10 15 20 25 30 35 40 45 50
< 1
1 to 4
5 to 9
10 to 14
15 to 19
20 to 24
25 to 29
30 to 39
40 to 59
Over 60
Female Male

Page 32 of 40
13.3% and the numbers reported remained relatively stable, while the number and
proportion of cases with likely exposure history within the province have steadily increased
(Figure 11). The increasing trend in local acquisition aligns with that observed nationally
where the percentage of cases likely acquired in Canada rose from 65.0% in 2009 to nearly
90.0% in 20136. This increase in locally acquired cases also corresponds to the continued
expansion and establishment of BLT populations (Figures 6 and 7). Among those cases with
acquisition outside of Manitoba most were associated with travel to endemic areas within the
Midwest and Northeast USA, while some were related to travel to Europe.
Figure 11: Confirmed and probable Lyme disease cases reported between 2010 and 2015
based on likely exposure, within or outside of the province (n = 143).
Seasonally, the highest risk period, based on likely month of exposure7, falls between
May and July (Figure 12). For confirmed and probable cases with available data, nearly 80.0%
(n = 107) reported likely exposure between May and July. The late spring/ early summer
exposure period corresponds to the peak activity period of BLT nymphs. Compared to adults,
these nymphs are smaller and much harder to see a factor that may account for the
observation that only 28.0% (n = 40) of individuals with confirmed or probable Lyme disease
6 National Lyme disease surveillance in Canada 2013: Web Report.
http://www.healthycanadians.gc.ca/publications/diseases-conditions-maladies-affections/lyme-
surveillance-2013/index-eng.php (accessed October 5, 2016) 7 Month of exposure was determined by subtracting 30 days from the earliest epi-date (i.e. symptom
onset, specimen collection date, lab reporting date, etc) to account for the maximum incubation period.
0
5
10
15
20
25
30
35
2010 2011 2012 2013 2014 2015
Re
po
rte
d L
ym
e d
ise
as
e c
as
es
Outside of Manitoba Within Manitoba
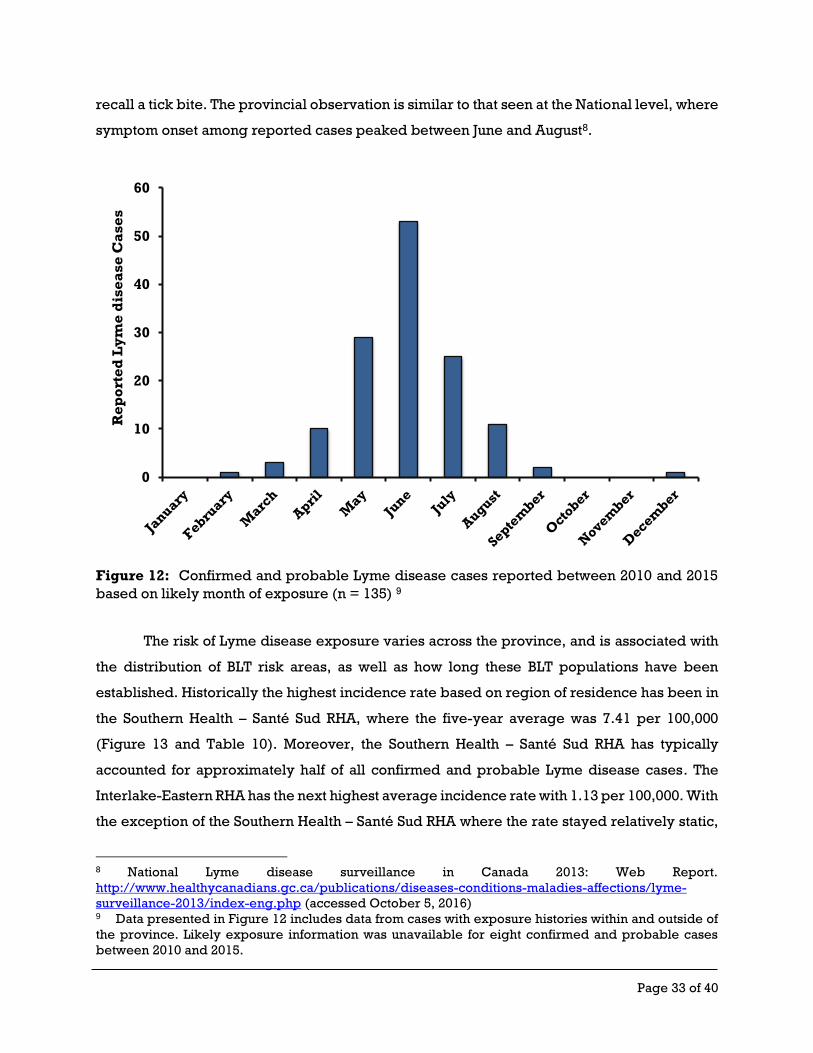
Page 33 of 40
recall a tick bite. The provincial observation is similar to that seen at the National level, where
symptom onset among reported cases peaked between June and August8.
Figure 12: Confirmed and probable Lyme disease cases reported between 2010 and 2015
based on likely month of exposure (n = 135) 9
The risk of Lyme disease exposure varies across the province, and is associated with
the distribution of BLT risk areas, as well as how long these BLT populations have been
established. Historically the highest incidence rate based on region of residence has been in
the Southern Health – Santé Sud RHA, where the five-year average was 7.41 per 100,000
(Figure 13 and Table 10). Moreover, the Southern Health – Santé Sud RHA has typically
accounted for approximately half of all confirmed and probable Lyme disease cases. The
Interlake-Eastern RHA has the next highest average incidence rate with 1.13 per 100,000. With
the exception of the Southern Health – Santé Sud RHA where the rate stayed relatively static,
8 National Lyme disease surveillance in Canada 2013: Web Report.
http://www.healthycanadians.gc.ca/publications/diseases-conditions-maladies-affections/lyme-
surveillance-2013/index-eng.php (accessed October 5, 2016) 9 Data presented in Figure 12 includes data from cases with exposure histories within and outside of
the province. Likely exposure information was unavailable for eight confirmed and probable cases
between 2010 and 2015.
0
10
20
30
40
50
60
Re
po
rte
d L
ym
e d
ise
as
e C
as
es

Page 34 of 40
the incidence rates, based on region of residence, increased in all three other southern RHAs
in 201510. The rates and case numbers are strongly associated with the distribution and length
of establishment of BLT populations. In other words the rates and risk are higher in the
Southern Health – Santé Sud, given the higher number of BLT risk areas and the longer history
of BLT population establishment in this region.
Figure 13: Lyme disease incidence, per 100,000 for confirmed and probable cases reported
by RHA of residence between 2010 and 2015.
10 Data for the Northern Health Region reflects the area of residence for an individual with likely
exposure having occurred in southern Manitoba. Given the non-suitable habitat and cooler
temperatures is unlikely that blacklegged tick populations would become established in this RHA.
0.00
1.00
2.00
3.00
4.00
5.00
6.00
7.00
8.00
0
5
10
15
20
25
30
35
Inc
ide
nc
e R
ate
pe
r 1
00
,00
0
Re
po
rte
d L
ym
e d
ise
as
e c
as
es
2015 Count 10-14 Avg. Count 2015 Incidence 10-14 Avg. Incidence

Page 35 of 40
Table 10: Lyme disease incidence, per 100,000 for confirmed and probable cases, reported
by RHA of residence between 2010 and 2015.
When the incidence rates (per 100,000) are examined based on likely exposure
location at the health district11 level two distinct observations are apparent (Figure 14). First,
with one exception, all health districts with a minimum of one confirmed or probable Lyme
disease case contain a BLT risk area. Second, health districts with the highest incidence rates
based on likely exposure locations (i.e. greater than 24.99) correspond to regions with a
lengthy history of BLT establishment. The map highlights the greater exposure risk in health
districts within the Southern Health – Santé Sud, which is unsurprising given that the first BLT
risk areas were identified within this RHA (Figure 6).
11 Health Districts are groupings of populations with approximately 10,000 to allow for analysis to be
conducted at a smaller scale than possible when using the larger Regional Health Authority or Health
Zone level.
Manitoba Winnipeg
Southern
Health –
Santé Sud
Interlake-
Eastern RHA
Prairie
Mountain
Health
Northern
Health
Region
2015 Count 29 10 14 3 2 0
2010-14 Avg.
Count 22.6 6.6 13.6 1.4 1 0.2
2015
Incidence 2.20 1.33 7.21 2.36 1.19 0
2010-14 Avg.
Incidence 1.80 0.91 7.41 1.13 0.60 0.27

Page 36 of 40
Figure 14: Incidence, per 100,000, of all confirmed and probable Lyme disease cases
reported in Manitoba between 2010 and 2015 based on Health District of likely exposure (n =
115).
Discussion Although initially detected in Manitoba in 1989, the numbers and infection rates of BLTs
remained relatively low and stable for a number of years. It wasn’t until 2006, following the
investigation into a cluster of human cases with a common exposure, that the first established
population of BLTs was identified in the extreme southeast corner of the province. Since the
identification of this first BLT risk area a number of observations can be noted:
The number and distribution of BLT risk areas has steadily increased in the province.

Page 37 of 40
The MIR among BLTs for agents of tick-borne diseases has steadily increased. Since
2013, the MIR for B. burgdorferi has hovered around and/ or exceeded 20.0%, while
the MIR for A. phagocytophilum has exceed 5.0%.
Anaplasmosis and Babesiosis were made provincially reportable in 2015, in response
to increased infection rates in BLTs and evidence of human infections.
The numbers of Lyme disease cases meeting PHAC’s National surveillance definitions
for confirmed and probable cases increased from 5 in 2009, to 29 in 2015.
The highest incidence of Lyme disease cases, based on both area of residence and are
of likely exposure, is found in the Southern Health – Santé Sud RHA.
There is an association between length of BLT establishment and increased infection
rates among BLTs and potential exposure among human cases.
In Manitoba, as in Canada, the impact posed by tick-borne diseases continues to
increase. MHSAL continues to survey the expansion of BLT risk areas and monitor infection
rates to guide critical risk communication messaging aimed at both the public and health care
professionals. Further, MHSAL continues to monitor BLT specimens for emerging pathogens
(i.e. Borrelia miyamotoi and Borrelia mayonii) of potential human health importance to guide
further messaging and intervention efforts.

Page 38 of 40
Appendix A (Provincial Surveillance Case Definitions –
Anaplasmosis)
Provincial surveillance case definitions for confirmed and probable Anaplasmosis cases:
Confirmed Anaplasmosis case:
A clinically compatible12 case that is laboratory confirmed13.
Probable Anaplasmosis case:
A clinically compatible case with non-confirmatory laboratory results14.
12 Clinical evidence includes, fever plus one or more of the following: headache, myalgia, anemia,
leukopenia, thrombocytopenia or any elevation of hepatic transaminase concentrations. 13 Laboratory confirmation requires one of:
a. Serological evidence of a four-fold change in IgG specific antibody titre by indirect IFA assay
between paired serum specimens (one taken during the first week of illness and a second 2 – 4
weeks later), OR by specific nucleic acid amplification test of blood specimen during acute phase of illness, OR
b. Detection of Anaplasma phagocytophilum DNA in a clinical specimen via amplification of a
specific target by polymerase chain reaction (PCR) assay, OR
c. Demonstration of anaplasmal antigen in a biopsy/ autopsy sample by immunohistochemical methods, OR
d. Isolation of A. phagocytophilum from a clinical specimen in cell culture. 14 Non Confirmatory laboratory results include:
a. Identification of morulae in the cytoplasm of neutrophils or eosinophils by microscopic examination, OR
b. Single A. phagocytophilum IgG antibody titre of 128 or greater plus A. phagocytophilum IgM
antibody titre of 20 or greater.

Page 39 of 40
Appendix B (Provincial Surveillance Case Definitions – Babesiosis)
Provincial surveillance case definitions for confirmed and probable Babesiosis cases:
Confirmed Babesiosis case:
Has confirmatory laboratory15 results AND meets at least one of the objective or
subjective clinical evidence criteria16, regardless of mode of transmission.
Probable Babesiosis case:
Has supportive laboratory17 results and meets at least one of the objective clinical
evidence criteria; OR
A case that is in a blood donor or recipient epidemiologically linked to a confirmed or
probable Babesiosis case, AND
Has confirmatory laboratory evidence but does not meet any objective or
subjective clinical evidence criteria.
15 Confirmatory laboratory evidence includes one of the following:
Identification of intraerythrocytic Babesia organisms by light microscopy in a Giemsa, Wright or Wright-Giemsa stained blood smear; OR
Detection of Babesia species DNA in a whole blood specimen by PCR; OR
Isolation of B. microti organisms from a whole blood specimen by animal inoculation. 16 Objective clinical evidence includes one or more of fever, anemia or thrombocytopenia. Subjective
clinical evidence includes one or more of chills, sweats, headache, myalgia or arthralgia. 17 Supportive laboratory evidence includes demonstration of Babesia species by IFA with specific IgG
antibody titre greater than or equal to 1:256.

Page 40 of 40
Appendix C (National Surveillance Case Definitions – Lyme
Disease)
National surveillance case definitions for confirmed and probable Lyme disease18:
Confirmed Lyme disease case:
1) Clinical evidence of illness with laboratory information:
Isolation of Borrelia burgdorferi from an appropriate clinical specimen, OR
Detection of B. burgdorferi DNA by PCR
2) Clinical evidence of illness with a history of residence, or visit to, an endemic area
and with laboratory evidence of infection:
Positive serological test using the two-tiered ELISA and Western Blot criteria
Probable Lyme disease case:
1) Clinical evidence of illness without a history of residence, or visit to, an endemic
area and with laboratory evidence of infection:
Positive serological test using the two-tier ELISA and Western Blot criteria
2) Clinician-observed Erythema migrans without laboratory evidence but with
history of residence in, or visit to, an endemic area.
18 Note that the surveillance case definitions are currently being revised. For more detailed information
please see PHAC’s ‘Case definitions for communicable diseases under national surveillance – 2009’ at
http://www.phac-aspc.gc.ca/publicat/ccdr-rmtc/09vol35/35s2/index-eng.php