manipulating splicing by inducing terminal intron...
TRANSCRIPT
Manipulating Splicing by Inducing
Terminal Intron Retention
Bachelor of Forensics (Forensic Biology and Toxicology)
Bachelor of Science (Molecular Biology and Biomedical Science)
School of Veterinary and Life Sciences
Murdoch University, Western Australia
Supervisors:
Professor Steve Wilton
Professor Sue Fletcher
Division of Research and Development, Centre for Comparative
Genomics
This thesis is submitted for Honours degree in Molecular Biology at
Murdoch University, Western Australia.
November, 2015
Peilin Wang
(31397183)

Declaration
I declare this thesis is my own account of my research and contains as its main content
work which has not been previously submitted for a degree at any tertiary education
institution.
Peilin Wang
November, 2015
iii
Abstract
Regulation of gene expression can occur at the pre-mRNA level by alternative splicing.
As a type of alternative splicing, intron retention received attention only in recent years.
Specifically, there are few reports on endogenous terminal intron retention event in
different gene transcripts and only one report of antisense oligonucleotide induced
retention of the terminal intron in SMN transcripts. So far, there is no report of induced
terminal intron retention other gene transcripts. Terminal intron retention is proposed to
be inducible in human gene transcripts using antisense oligonucleotides, with an effect
on expression at the mRNA and/or protein levels. Five gene transcripts, LMNA, LMNC,
ITGA4, SOD1, and DMD, were selected and for each transcript, the terminal intron/exon
splice site and exon-internal sequences of the last exon were targeted for antisense
oligonucleotide annealing. It was found that terminal intron retention is inducible in
LMNC and ITGA4 transcripts, and possibly LMNA transcripts. Inclusion of the terminal
intron decreases full-length LMNC and ITGA4 mRNA expression whereas its effect on
protein expression is undetermined. Using the PMO chemistry resulted in a reduced
effect on terminal intron retention compared to when 2’-OMeAOs were used. In
addition, in both LMNC and ITGA4 transcripts, terminal intron retention led to
approximately 3% to 13% decrease in full-length mRNA expression. Changing
transfection parameters such as antisense oligonucleotide concentrations, transfection
reagent, and transfection duration can also influence transfection outcome. Possible
features that may predict terminal intron retention, including but not limited to, splicing
motifs, intron length and splice site strengths, were compared between transcripts with
and without retained terminal intron. However, no specific features for retention of the
terminal intron were observed. Overall, this project shows that terminal intron retention
is inducible in human gene transcripts other than SMN transcripts, but not in all gene
transcripts examined.

iv
Table of Contents
Front Page i
Declaration ii
Abstract iii
Table of Contents iv-viii
Acknowledgements ix
Abbreviations x
List of Figures xi-xiii
List of Tables xiv
1. Introduction 1-4
1.1 Mechanism and Regulation of Pre-mRNA Splicing 4
1.1.1 Mechanism of Splicing 4-5
1.1.2 Regulation of Splicing 6
1.2 Alternative Splicing 7
1.2.1 Common Types of Alternative Splicing 7-11
1.2.2 Alternative Splicing and Gene Expression 12
1.2.2.1 Negative Regulation 12-14
1.2.2.2 Positive Regulation: BCL-X 14-15
1.2.2.3 Indirect Regulation: Homer 15-16
1.2.3 Alternative Splicing and Neuronal Development 17-18
1.3 Using Antisense Oligonucleotides (AOs) to Manipulate Splicing 19-20
1.3.1 Antisense Oligonucleotide-Induced Splice Switching 20
1.3.1.1 Exon Retention and Exon Skipping 20
(i) Exon Retention 20-22
(ii) Exon Skipping 22-27
v
1.4 Rising Alternative Splicing Event: Intron Retention 27
1.4.1 Intron Retention 27-28
1.4.1.1 Intron Retention and Gene Expression 28
(i) Nuclear Retention and Degradation 28-29
(ii) Intron Retention and Nonsense-Mediated mRNA Decay
(NMD)
29-30
1.4.1.2 Cytoplasmic Intron-Retaining Transcripts (CIRTs) 30-31
1.4.1.3 Nuclear Intron-Retaining Transcripts 31-32
1.4.2 Pseudo-exon Activation 32-35
1.5 Why Study Terminal Intron Retention in Human Gene Transcripts? 35-38
1.6 Aims 38
2. Materials 39
2.1 2’-OMeAO Purification, Primers, PMOs and Leash Annealing 39
2.2 Cell Culture and Passaging 39-40
2.3 Transfection 41
2.4 Cell Harvest and RNA Extraction 42
2.5 RT-PCR, cDNA Synthesis, Long-range PCR 42-43
2.6 Gel Electrophoresis and Gel Visualisation 43
2.7 Product Isolation and DNA Sequencing 44
2.8 Semi-quantitative Analysis 44
vi
3. Methods 45
3.1 Antisense Oligonucleotide (AO) Design and Synthesis 45
3.2 AO Nomenclature 45-46
3.3 Purification of AOs 47
3.4 PCR Primer Design and Reconstitution 47-48
3.5 Cell Resurrection and Propagation 48-49
3.6 Cell Passage 49-50
3.7 Cell Transfection 50
3.7.1 2’-O-Methyl-Antisense Oligonucleotides (2’-OMeAOs) 50
3.7.1.1 Lipofectin® as Vehicle 50-51
3.7.1.2 Lipofectamine® 2000 as Vehicle 51-52
3.7.1.3 Lipofectamine® 3000 as Vehicle 52-53
3.7.2 Phosphorodiamidate Morpholino Oligomers (PMOs) 53-54
3.8 RNA Analysis 54
3.8.1 Total RNA Extraction 54
3.8.2 One-step RT-PCR 55
3.8.3 Two-step RT-PCR 55-56
3.9 Gel Electrophoresis and Product Analysis 56
3.9.1 Product Isolation and DNA Sequencing 56-57
3.9.2 Semi-quantitative Analysis 58
vii
4. Results 59
4.1 SMN-AOs Induced Terminal Intron Retention 59-62
4.2 Effects of Oligonucleotides on Transcript Splicing Patterns 62
4.2.1 Treatment of Normal Human Fibroblasts with LMNA-targeting
2’-OMeAOs
62-67
4.2.2 Treatment of Normal Human Fibroblasts with LMNC-targeting
2’-OMeAOs
67-70
4.2.2.1 Treatment of Normal Human Fibroblasts with LMNC-
targeting PMOs
71-72
4.2.3 Treatment of Normal Human Fibroblasts with ITGA4-targeting
2’-OMeAOs
73-75
4.2.3.1 Treatment of Normal Human Fibroblasts with ITGA4-
targeting PMOs
76-77
4.2.4 Treatment of Normal Human Fibroblasts with SOD1-targeting
2’-OMeAOs
77-80
4.2.5 Treatment of Normal Human Fibroblasts and Primary Myoblasts
with DMD-targeting 2’-OMeAOs
81-85
4.3 Evaluation of Different Transfection Reagents in Primary Human
Myoblasts and Normal Human Fibroblasts
86-89
5. Discussion 90
5.1 General Discussion 90
5.1.1 Primary Experiments on SMN Transcripts 90-91
5.1.2 Principle Findings 91-93
5.1.2.1 AO Concentration and Chemistry 94
5.1.2.2 Transfection Reagent 95
5.1.2.3 Transfection Duration 95-96
5.2 Possible Mechanism/Features of (Terminal) Intron Retention 96-100
5.3 Limitations 101-102
5.4 Future Directions and Implications 103
viii
5.4.1 Western Analysis 103
5.4.2 Experimental Modifications 103-105
5.4.3 Implications 105
6. Conclusion 106
References 107-120
Appendix 121
A. Recipes 121-122
B. Comparison of ITGA4 transcripts with retained terminal intron in L3K
transfection
123
C. Splicing Motif Analyses 124-130
D. Splice Site Scores 131
E. ESE and ESS Densities of Terminal Introns 132

ix
Acknowledgements
Hard. Challenging. This is what those who have gone through honours would say about
honours year. Indeed it was a challenging year, but it did not turn out to be as bad as I
had expected it to be. All thanks to the help and support from the people around me.
The first people to thank are of course my parents, for supporting me both financially
and psychologically. Without my beloved parents, I would not be able to study at
Murdoch for five years. Next, I want to thank my siblings (Peizhi, Peidi, Zhiheng) and
best friends (Rui Yin, Zhiying, Zhilin, Wen Rou) in Singapore for their moral support.
Though we did not talk much throughout the year when I was away from home, I know
very well that they are always there to encourage me whenever I feel stressed up. I also
want to thank my niece and nephew who cheered me up with their cute and funny acts
on the weekends through Skype.
The next group of people to thank is the Molecular Therapy Laboratory team at the
Centre for Comparative Genomics – Abbie, Loren, Iantha, May, Kristine, Kane, Niall,
Bao, and Russell. They had given me lots of help and great tips for my experiments. I
want to especially thank Loren for showing me the ropes to everything that I need to
know. Without her help, I would not be able to start and progress in my lab work.
I also want to express my thanks to Munik and Wing. Because we were going through
honours year together and worked at the same laboratory, we were able to understand
the problems each other faced and encourage each other. It was great to have someone
who understands what you are going through, to whine to about my failed experiments
and problems encountered.
Last but not least, I want to thank my supervisors, Professor Steve Wilton and Professor
Sue Fletcher. Nothing could express my gratitude to them for accepting me as their
honours student, and for their guidance, encouragement, and for editing my writings
despite their busy schedules and heavy workload.
Overall, honours year is indeed hard and challenging, but it was also worthy and
fulfilling.

x
Abbreviations
2’-OMeAO 2’-O-methyl modified antisense oligonucleotide on a
phosphorothioate backbone
AO Antisense oligonucleotide
CEE Chick embryo extract
DMEM Dulbecco's Modified Eagle Medium
dNTPs Deoxyribonucleoside triphosphates
EDTA Ethylenediaminetetraacetic acid
FBS Foetal bovine serum
HS Horse serum
L2K Lipofectamine® 2000 transfection reagent
L3K Lipofectamine® 3000 transfection reagent
MgCl2 Magnesium chloride
Opti-MEM Serum-free medium
PBS Phosphate buffered saline
PMO Phosphorodiamidate morpholino oligomer
rcf Relative centrifugal force
TAE Tris base, acetic acid and EDTA buffer
xi
List of Figures
Figure Title Page
Figure 1.1 Gene expression in a eukaryotic cell 1
Figure 1.2 Gene expression can be controlled at several levels 2
Figure 1.3 Pre-mRNA splicing in eukaryotic cells 5
Figure 1.4 Main models of alternative splicing 10-11
Figure 1.5 Alternative splicing and nonsense-mediated mRNA decay 14
Figure 1.6 Homer1 isoforms 16
Figure 1.7 Schematic representation of β -neurexin and neuroligin-1
transcripts that code for synaptic surface proteins
18
Figure 1.8 Schematic diagram showing the comparison of a complete
retention and partial retention of an intron
33
Figure 4.1 Schematic diagram of partial pre-mRNA showing AO
annealing sites and the location of RT-PCR primers used
60
Figure 4.2 SMN RT-PCR products amplified from normal human
fibroblasts transfected with SMN_8A(+57+81) and
SMN_8A(-10+15), using SMN primer set 5512a+5513a
61
Figure 4.3 RT-PCR of RNA extracted from normal human fibroblasts
treated with AO cocktails designed to induce terminal intron
retention in SMN transcripts
62
Figure 4.4 RT-PCR evaluating transfection of normal human fibroblasts
with the four LMNA-targeting 2’-OMeAOs designed to induce
terminal intron retention
64
Figure 4.5 Chromatogram of the 687bp LMNA RT-PCR product
amplified from RNA extracted from normal human fibroblasts
transfected with LMNA-targeting 2’-OMeAOs
64
Figure 4.6 RT-PCR evaluating transfection of normal human fibroblasts
with the four LMNA-targeting 2’-OMeAOs designed to induce
terminal intron retention
66
xii
Figure 4.7 Ratios of full-length LMNA transcripts in normal human
fibroblasts after transfection with LMNA-targeting 2’-
OMeAOs
67
Figure 4.8 RT-PCR evaluating the transfection of normal human
fibroblasts with the four 2’-OMeAOs targeting LMNC
transcripts designed to induce terminal intron retention
68
Figure 4.9 Chromatograms of LMNC RT-PCR products 69
Figure 4.10 Chromatogram of the ~300bp SMN RT-PCR product
amplified from RNA extracted from normal human fibroblasts
transfected with LMNC_H10A(+66+90)
69
Figure 4.11 Semi-quantitative analysis of terminal intron retention
induced in LMNC transcripts
70
Figure 4.12 RT-PCR showing transfection with PMOs designed to induce
retention of the LMNC terminal intron
72
Figure 4.13 RT-PCR evaluating the transfection of normal human
fibroblasts with the four 2’-OMeAOs targeting ITGA4
transcripts designed to induce terminal intron retention
74
Figure 4.14 Chromatograms of ITGA4 RT-PCR products 75
Figure 4.15 Semi-quantitative analysis of terminal intron retention
induced in ITGA4 transcripts
75
Figure 4.16 RT-PCR showing transfection with PMOs designed to induce
retention of the ITGA4 terminal intron
76
Figure 4.17 Proportions of ITGA4 transcripts with retained terminal intron
when different AO chemistries were used
77
Figure 4.18 RT-PCR of RNA extracted from normal human fibroblasts
transfected with SOD1-targeting 2’-OMeAOs
78
Figure 4.19 Chromatogram of the 300bp SOD1 RT-PCR product
amplified from RNA extracted from normal human fibroblasts
transfected with SOD1-targeting AOs
79
xiii
Figure 4.20 RT-PCR of RNA extracted from normal human fibroblasts
transfected with second generation of SOD1-targeting 2’-
OMeAOs
80
Figure 4.21 RT-PCR of RNA extracted from normal human fibroblasts
transfected with DMD-targeting 2’-OMeAOs
82
Figure 4.22 RT-PCR of RNA extracted from primary human myoblasts
transfected with DMD-targeting 2’-OMeAOs
83
Figure 4.23 Fibroblast and myoblast DMD RT-PCR products and
chromatograms of the amplified DMD RT-PCR products
85
Figure 4.24 RT-PCR of RNA extracted from myoblasts transfected with
DMD- and SMN-targeting 2’-OMeAOs
86
Figure 4.25 Repeat of LMNA and ITGA4 experiments using
Lipofectamine® 3000 (L3K) transfection reagent
88-89
Figure 4.26 Ratios of full-length LMNA and ITGA4 transcripts in normal
human fibroblasts after 24h and 48h transfections using
Lipofectamine® 3000 (L3K) transfection reagent
89
xiv
List of Tables
Table Title Page
Table 1.1 Four main models of alternative splicing events and resultant
gene transcripts
8-9
Table 1.2 Genes with alternatively spliced transcripts that trigger RUST 13
Table 2.1 2’-OMeAO Purification, Primers, PMOs and Leash Annealing 39
Table 2.2 Cell Culture and Passaging 39-40
Table 2.3 Transfection 41
Table 2.4 Cell Harvest and RNA Extraction 42
Table 2.5 RT-PCR, cDNA synthesis, Long-range PCR 42-43
Table 2.6 Gel Electrophoresis and Gel Visualisation 43
Table 2.7 Product Isolation and DNA Sequencing 44
Table 2.8 Semi-quantitative Analysis 44
Table 3.1 Sequences of 2'-OMeAOs used in the project 46
Table 3.2 Sequences of primers used in the project 48
Table 3.3 Sequences of PMOs and leashes used in PMO lipoplex
transfections
54
Table 3.4 RT-PCR cycling conditions for different gene transcripts 55
Chapter 1: Introduction
1
1. Introduction
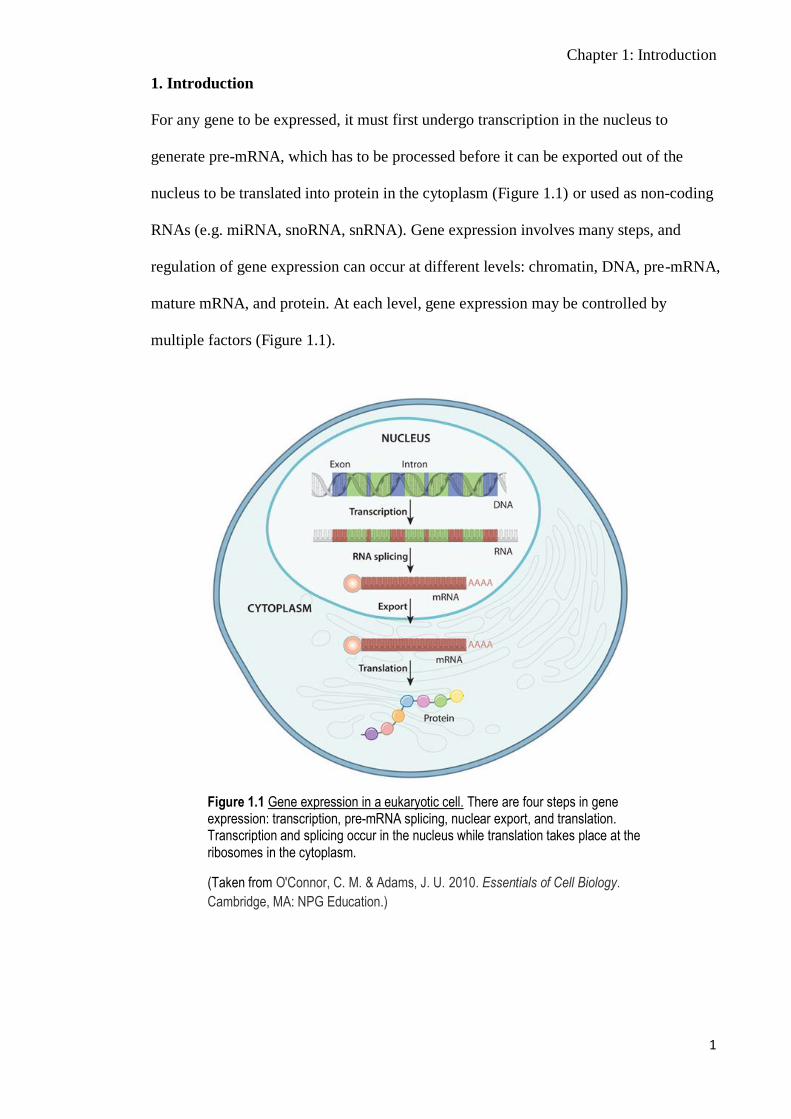
For any gene to be expressed, it must first undergo transcription in the nucleus to
generate pre-mRNA, which has to be processed before it can be exported out of the
nucleus to be translated into protein in the cytoplasm (Figure 1.1) or used as non-coding
RNAs (e.g. miRNA, snoRNA, snRNA). Gene expression involves many steps, and
regulation of gene expression can occur at different levels: chromatin, DNA, pre-mRNA,
mature mRNA, and protein. At each level, gene expression may be controlled by
multiple factors (Figure 1.1).
Figure 1.1 Gene expression in a eukaryotic cell. There are four steps in gene expression: transcription, pre-mRNA splicing, nuclear export, and translation. Transcription and splicing occur in the nucleus while translation takes place at the ribosomes in the cytoplasm.
(Taken from O'Connor, C. M. & Adams, J. U. 2010. Essentials of Cell Biology.
Cambridge, MA: NPG Education.)
Chapter 1: Introduction
2
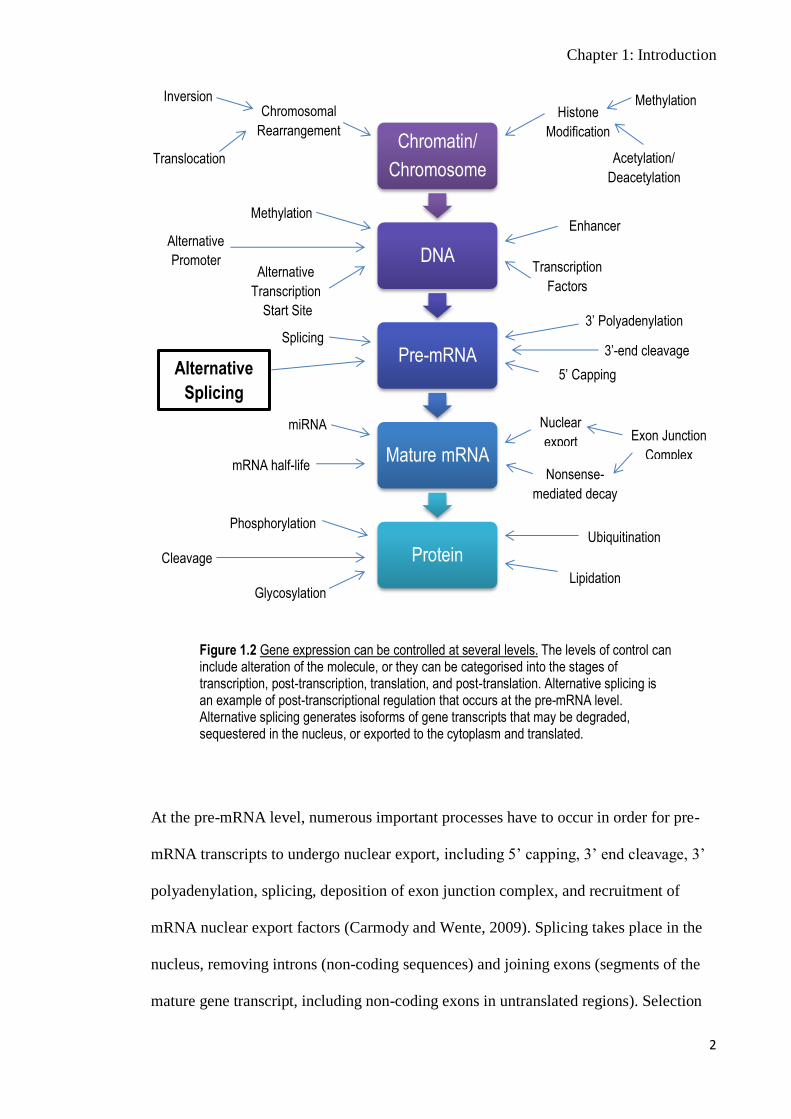
At the pre-mRNA level, numerous important processes have to occur in order for pre-
mRNA transcripts to undergo nuclear export, including 5’ capping, 3’ end cleavage, 3’
polyadenylation, splicing, deposition of exon junction complex, and recruitment of
mRNA nuclear export factors (Carmody and Wente, 2009). Splicing takes place in the
nucleus, removing introns (non-coding sequences) and joining exons (segments of the
mature gene transcript, including non-coding exons in untranslated regions). Selection
Figure 1.2 Gene expression can be controlled at several levels. The levels of control can include alteration of the molecule, or they can be categorised into the stages of transcription, post-transcription, translation, and post-translation. Alternative splicing is an example of post-transcriptional regulation that occurs at the pre-mRNA level. Alternative splicing generates isoforms of gene transcripts that may be degraded, sequestered in the nucleus, or exported to the cytoplasm and translated.
Chromatin/
Chromosome
DNA
Pre-mRNA
Mature mRNA
Protein
Histone
Modification
Acetylation/
Deacetylation
Chromosomal
Rearrangement
Inversion
Translocation
Methylation
Alternative
Promoter
Enhancer
Methylation
Transcription
Factors Alternative
Transcription
Start Site
Splicing
Alternative
Splicing
3’ Polyadenylation
5’ Capping
miRNA
mRNA half-life
Phosphorylation
Glycosylation
Ubiquitination
Lipidation
Cleavage
Nuclear
export Exon Junction
Complex
Nonsense-
mediated decay
3’-end cleavage

Chapter 1: Introduction
3
of specific exons by the splicing machinery may be regulated in a tissue or
developmentally specific manner to generate alternative transcripts (Boise et. al., 1993;
Unsworth et. al., 1999; Zheng et. al., 2012; Yap et. al., 2012; Wong et. al., 2013),
contributing to transcriptomic and hence, proteomic diversity. Such a mechanism
whereby diversity arises from a finite number of genes is termed alternative splicing
(Graveley, 2001; Brett et. al., 2002).
Alternative splicing can have a wide array of effects, particularly in regulating
neuronally-expressed genes (Li et. al., 2007) and hence, has a role in ensuring normal
physiological and developmental processes in neuronal cells (Zheng and Black, 2013;
Gamazon and Stranger, 2014). Alternative splicing is also involved in stem cell renewal
and differentiation, organ formation, and immune system development (Gamazon and
Stranger, 2014). Alternative splicing is an important and fundamental mechanism in
eukaryotes, and aberrant splicing can disrupt gene expression, leading to human disease
(for reviews, see Cáceres and Kornblihtt, 2002; Faustino and Cooper, 2003; Garcia-
Blanco et. al., 2004; Licatalosi and Darnell, 2006). Nevertheless, alternative splicing
may also be harnessed as a strategy for therapeutic intervention.
Aberrant splicing occurs due to gene mutation(s), producing abnormal gene transcripts,
and may be altered by using antisense oligonucleotides, which are short nucleotide
sequences complementary to the target sequence (Dominski and Kole, 1993; Van
Deutekom et. al., 2001; Castellanos et. al., 2013; Osman et. al., 2014; Staropoli et. al.,
2015; Palhais et. al., 2015). These studies demonstrated that antisense oligonucleotides
can reduce the impact of some mutations by manipulating exon selection in aberrantly
spliced gene transcripts.
Chapter 1: Introduction
4
This review will briefly discuss the mechanism and regulation of splicing, followed by
examination of the role of both constitutive and alternative splicing in regulating gene
expression. The application of antisense oligonucleotides to induce splice switching in a
number of disease-related gene transcripts will be discussed, and the review will
conclude with examination of terminal intron retention, which is the focus of this
project.
1.1 Mechanism and Regulation of Pre-mRNA Splicing
1.1.1 Mechanism of Splicing
Pre-mRNA splicing results in the generation of a mature mRNA that is then transported
across the nuclear membrane to the cytoplasm, where protein-encoding transcripts may
be then translated into proteins and non-coding transcripts perform other functions.
Splicing is facilitated by a ribonucleoprotein complex called the spliceosome that is
composed of five small nuclear ribonucleoproteins (snRNPs) and an array of non-
snRNP auxiliary factors (Will and Luhrmann, 2011). The five snRNPs, U1, U2, U4, U5,
and U6, are made up of a snRNA and associated proteins (Will and Luhrmann, 2011).
Briefly, the snRNPs and auxiliary factors are recruited to the intron sequentially to form
the spliceosome, which then excises the intron as a lariat, and joins the flanking exons
(Figure 1.3). The assembly of the spliceosome requires four features within the intron
that the snRNPs and auxiliary factors recognise and bind: 5’ splice site (5’-ss), branch
point (BP), polypyrimidine tract (PPT), and 3’ splice site (3’-ss) (Figure 1.3), and 145
other RNAs and proteins (Gygi et. al., 2002).
Chapter 1: Introduction
5
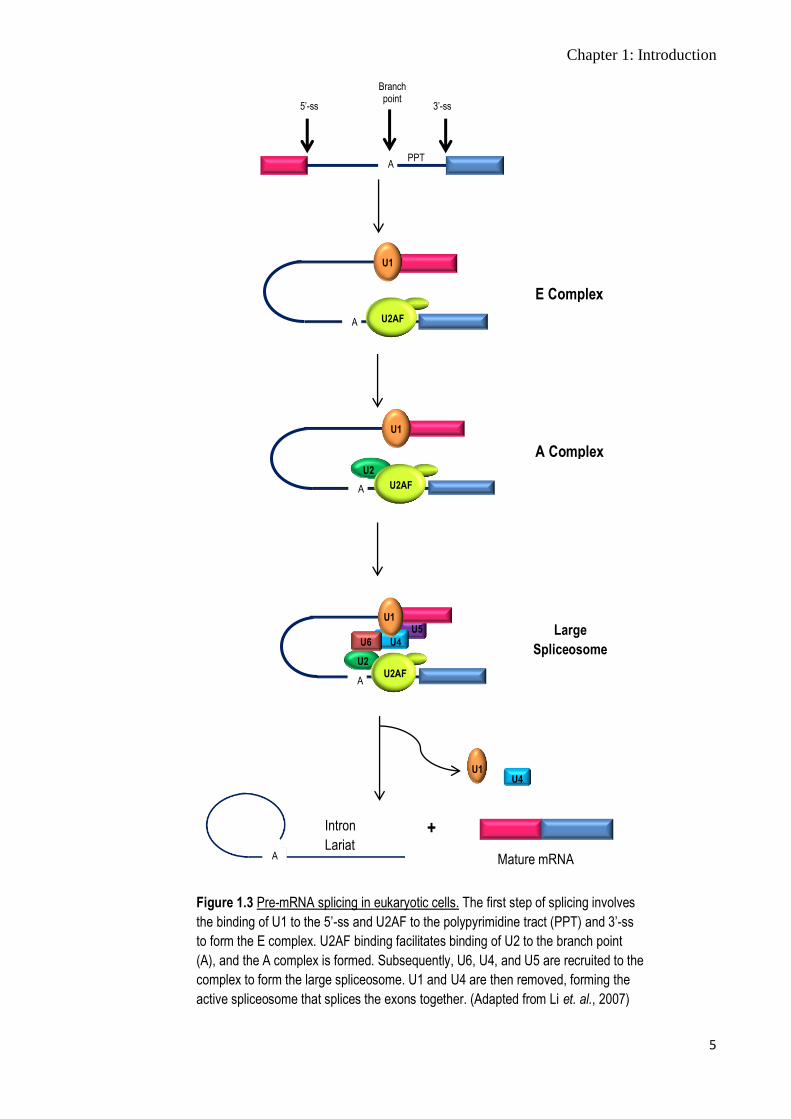
Figure 1.3 Pre-mRNA splicing in eukaryotic cells. The first step of splicing involves
the binding of U1 to the 5’-ss and U2AF to the polypyrimidine tract (PPT) and 3’-ss
to form the E complex. U2AF binding facilitates binding of U2 to the branch point
(A), and the A complex is formed. Subsequently, U6, U4, and U5 are recruited to the
complex to form the large spliceosome. U1 and U4 are then removed, forming the
active spliceosome that splices the exons together. (Adapted from Li et. al., 2007)
A
U1
U2AF
U2
A
U1
U2AF
Intron
Lariat Mature mRNA
E Complex
Large
Spliceosome
A Complex
U1 U4
+
A
U1
U2 U2AF
U6 U4
U5
5’-ss 3’-ss
A PPT
Branch point
A
Chapter 1: Introduction
6
1.1.2 Regulation of Splicing
Splicing is regulated by highly coordinated cis- and trans-acting elements. In addition to
the 5’-ss, 3’-ss, BP and PPT, cis-acting elements include exonic splicing enhancers
(ESEs), exonic splicing silencers (ESSs), intronic splicing enhancers (ISEs) and intronic
splicing silencers (ISSs) (Will and Luhrmann, 2011). These cis-acting elements are
found within the pre-mRNA and exert their effects on the transcript by interacting with
trans-acting elements. Additionally, the relative distance between cis-acting elements,
as well as RNA secondary structure that may mask or bring cis-acting elements closer,
can also dictate the splicing process (Coelho and Smith, 2014). Trans-acting elements
can be RNA binding proteins (RBP) that recognise and bind to the cis-acting sequence
elements, or non-coding RNAs such as microRNAs (miRNAs) (Boutz et. al., 2007a;
Kalsotra et. al., 2010) and small nucleolar RNAs (snoRNAs) (Kishore and Stamm, 2006)
that bind to the pre-mRNA transcript or a RBP. Two extensively studied RBP families
are the SR proteins and the heterogeneous nuclear ribonucleoproteins (hnRNP). SR
proteins typically enhance splicing (Manley and Tacke, 1996; Shepard and Hertel, 2009)
while hnRNPs typically have negative effects on splicing (Krecic and Swanson, 1999).
In addition to the cis- and trans-acting elements, splicing can be affected by the rate of
transcription, implying that splicing can be regulated by chromatin modifications (Luco
and Misteli, 2011) (Figure 1.2).

Chapter 1: Introduction
7
1.2 Alternative Splicing
1.2.1 Common Types of Alternative Splicing
Constitutive splicing is typically defined as the removal of introns and ligation of exons
in a pre-mRNA, such that the mature mRNA consists of all exons and no introns.
Alternative splicing differs from constitutive splicing in that the former alters the
mature transcript either by excluding an exon, including a mutually exclusive exon,
retaining an intron, altering the length of the constitutive exons, or in other ways that
resulted in a mature mRNA isoform that is different from that formed by constitutive
splicing. Alternative splicing is a common mechanism in eukaryotes that complicates
the definition of an exon and intron, where an exon may become an intron if skipped in
one particular transcript (Figure 1.4A), while intronic sequence could be regarded as
part of an exon if included in the mature mRNA (Figure 1.4B, C (right diagram), D
(right diagram)). Through high throughput deep sequencing, it was discovered that gene
transcripts from 92-95% of human multi-exon genes undergo alternative splicing (Pan
et. al., 2008; Wang et. al., 2008). Alternative splicing occurs when alternative splice
site(s) are recognised and used by the snRNPs to direct the spliceosome to process the
pre-mRNA in a different way. Four main models of alternative splicing – exon skipping,
intron retention, alternative 5’-ss, and alternative 3’-ss– are observed in the eukaryotic
transcriptome (Table 1.1, Figure 1.4).
Chapter 1: Introduction
8
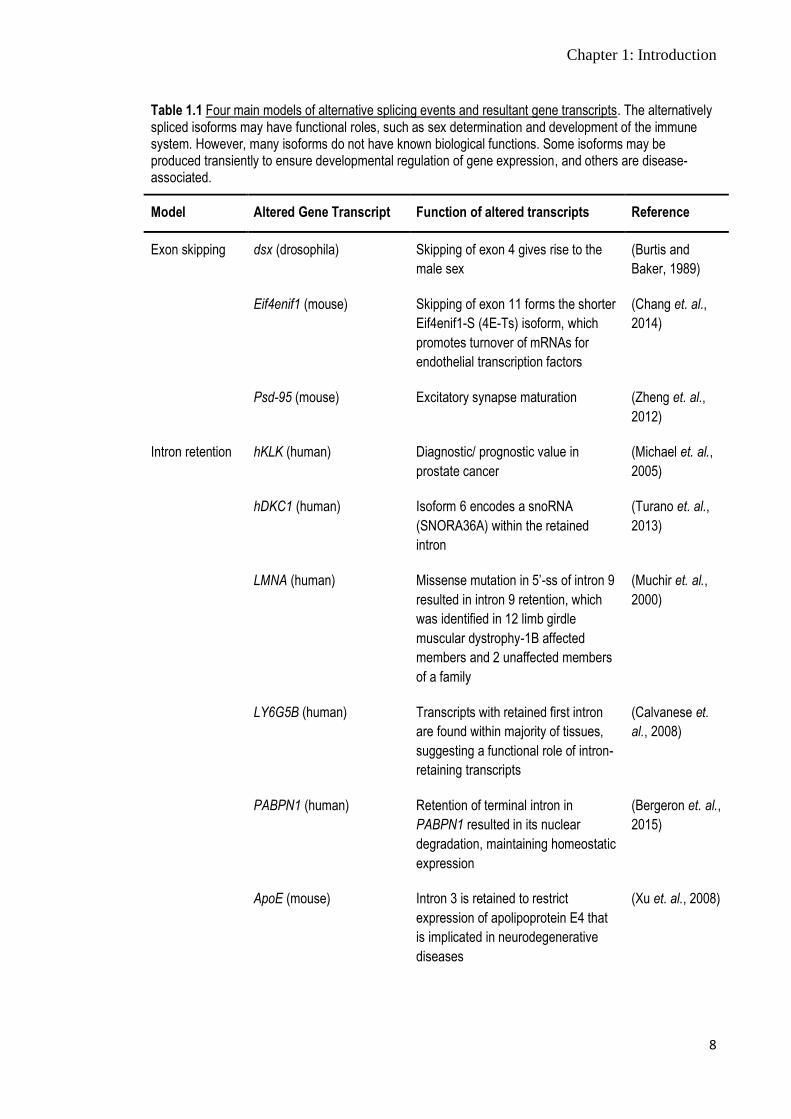
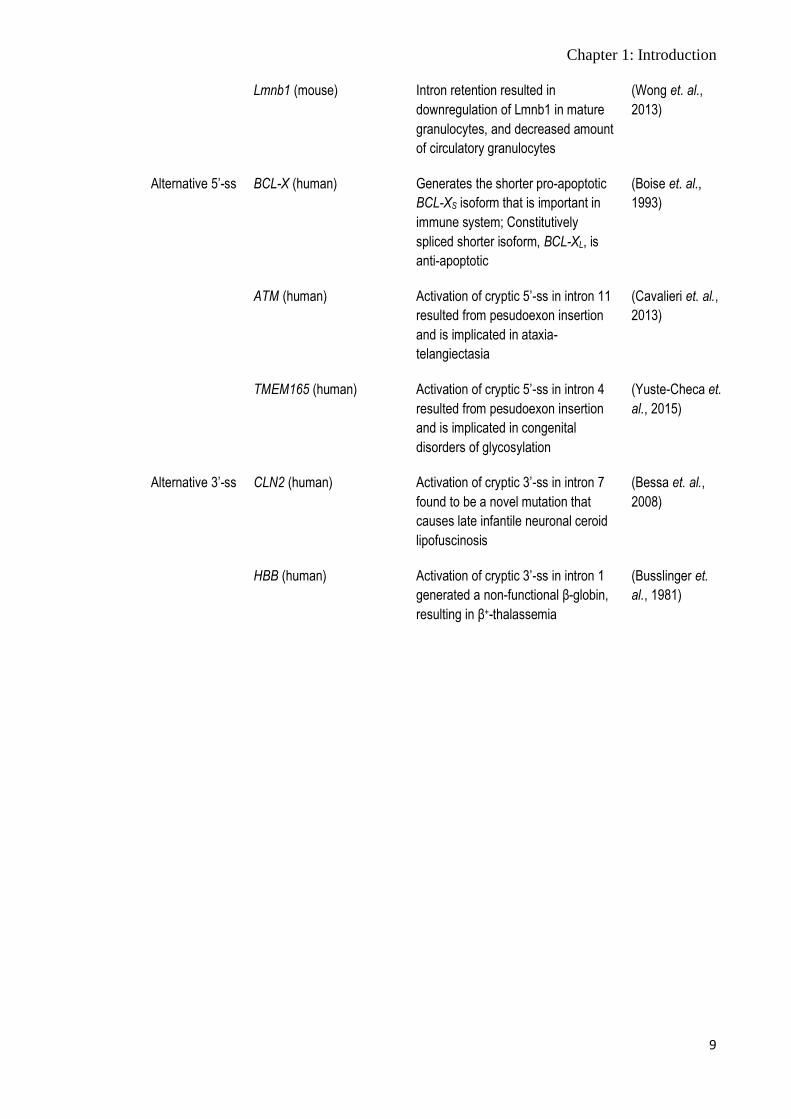
Table 1.1 Four main models of alternative splicing events and resultant gene transcripts. The alternatively spliced isoforms may have functional roles, such as sex determination and development of the immune system. However, many isoforms do not have known biological functions. Some isoforms may be produced transiently to ensure developmental regulation of gene expression, and others are disease-associated.
Model Altered Gene Transcript Function of altered transcripts Reference
Exon skipping dsx (drosophila) Skipping of exon 4 gives rise to the
male sex
(Burtis and
Baker, 1989)
Eif4enif1 (mouse) Skipping of exon 11 forms the shorter
Eif4enif1-S (4E-Ts) isoform, which
promotes turnover of mRNAs for
endothelial transcription factors
(Chang et. al.,
2014)
Psd-95 (mouse) Excitatory synapse maturation (Zheng et. al.,
2012)
Intron retention hKLK (human) Diagnostic/ prognostic value in
prostate cancer
(Michael et. al.,
2005)
hDKC1 (human) Isoform 6 encodes a snoRNA
(SNORA36A) within the retained
intron
(Turano et. al.,
2013)
LMNA (human) Missense mutation in 5’-ss of intron 9
resulted in intron 9 retention, which
was identified in 12 limb girdle
muscular dystrophy-1B affected
members and 2 unaffected members
of a family
(Muchir et. al.,
2000)
LY6G5B (human) Transcripts with retained first intron
are found within majority of tissues,
suggesting a functional role of intron-
retaining transcripts
(Calvanese et.
al., 2008)
PABPN1 (human) Retention of terminal intron in
PABPN1 resulted in its nuclear
degradation, maintaining homeostatic
expression
(Bergeron et. al.,
2015)
ApoE (mouse) Intron 3 is retained to restrict
expression of apolipoprotein E4 that
is implicated in neurodegenerative
diseases
(Xu et. al., 2008)
Chapter 1: Introduction
9
Lmnb1 (mouse) Intron retention resulted in
downregulation of Lmnb1 in mature
granulocytes, and decreased amount
of circulatory granulocytes
(Wong et. al.,
2013)
Alternative 5’-ss BCL-X (human) Generates the shorter pro-apoptotic
BCL-XS isoform that is important in
immune system; Constitutively
spliced shorter isoform, BCL-XL, is
anti-apoptotic
(Boise et. al.,
1993)
ATM (human) Activation of cryptic 5’-ss in intron 11
resulted from pesudoexon insertion
and is implicated in ataxia-
telangiectasia
(Cavalieri et. al.,
2013)
TMEM165 (human) Activation of cryptic 5’-ss in intron 4
resulted from pesudoexon insertion
and is implicated in congenital
disorders of glycosylation
(Yuste-Checa et.
al., 2015)
Alternative 3’-ss CLN2 (human) Activation of cryptic 3’-ss in intron 7
found to be a novel mutation that
causes late infantile neuronal ceroid
lipofuscinosis
(Bessa et. al.,
2008)
HBB (human) Activation of cryptic 3’-ss in intron 1
generated a non-functional β-globin,
resulting in β+-thalassemia
(Busslinger et.
al., 1981)
Chapter 1: Introduction
10
A) Exon Skipping B) Intron Retention
C) Alternative 5’-ss
Alternative 5’-ss
Shorter blue exon
Alternative 5’-ss
Elongated blue exon
Alternative 3’-ss D) Alternative 3’-ss
Shorter
yellow exon
Alternative 3’-ss
Elongated yellow exon
Chapter 1: Introduction
11
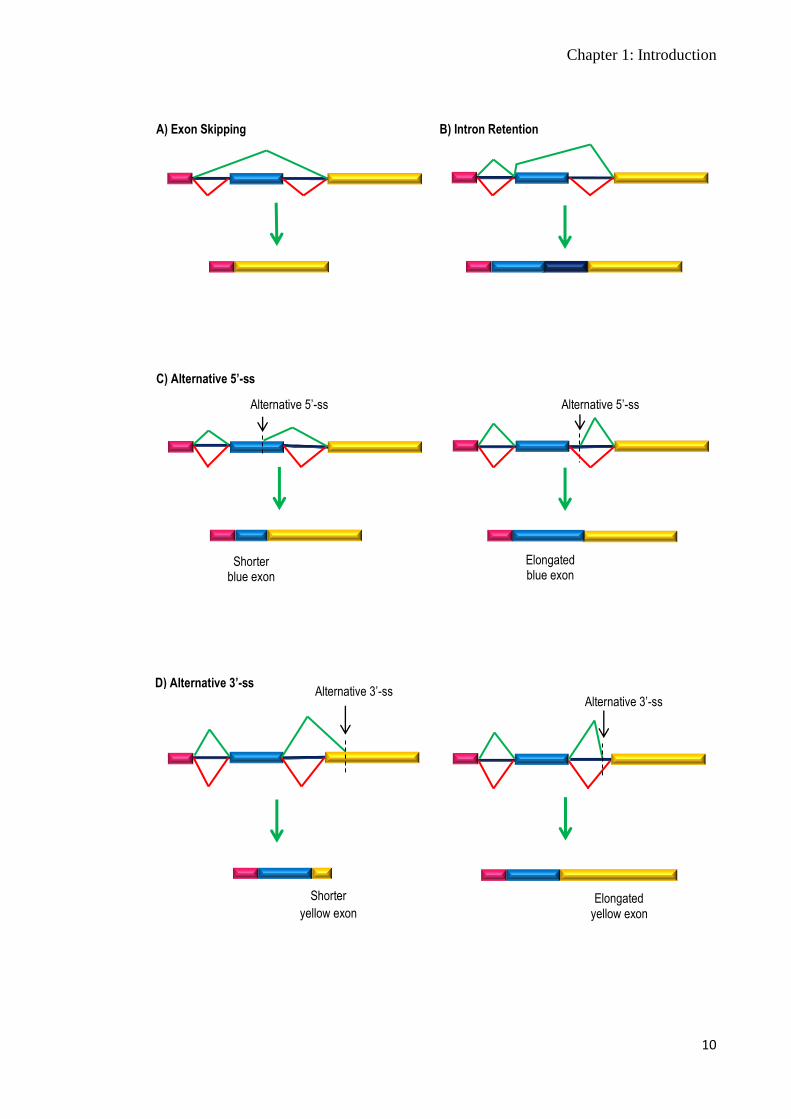
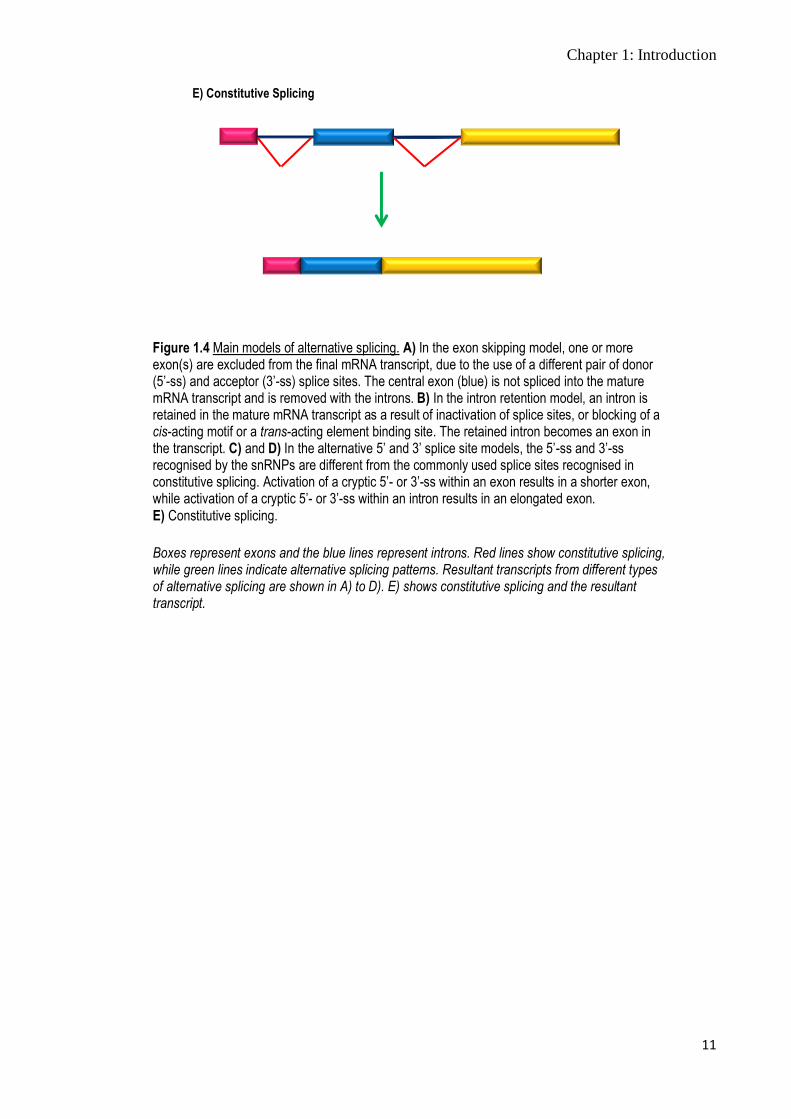
Figure 1.4 Main models of alternative splicing. A) In the exon skipping model, one or more exon(s) are excluded from the final mRNA transcript, due to the use of a different pair of donor (5’-ss) and acceptor (3’-ss) splice sites. The central exon (blue) is not spliced into the mature mRNA transcript and is removed with the introns. B) In the intron retention model, an intron is retained in the mature mRNA transcript as a result of inactivation of splice sites, or blocking of a cis-acting motif or a trans-acting element binding site. The retained intron becomes an exon in the transcript. C) and D) In the alternative 5’ and 3’ splice site models, the 5’-ss and 3’-ss recognised by the snRNPs are different from the commonly used splice sites recognised in constitutive splicing. Activation of a cryptic 5’- or 3’-ss within an exon results in a shorter exon, while activation of a cryptic 5’- or 3’-ss within an intron results in an elongated exon. E) Constitutive splicing.
Boxes represent exons and the blue lines represent introns. Red lines show constitutive splicing, while green lines indicate alternative splicing patterns. Resultant transcripts from different types of alternative splicing are shown in A) to D). E) shows constitutive splicing and the resultant transcript.
E) Constitutive Splicing
Chapter 1: Introduction
12
1.2.2 Alternative Splicing and Gene Expression
1.2.2.1 Negative Regulation
Splicing controls gene expression at several levels, from isoform production to nuclear
export. Similarly, alternative splicing may turn gene expression on or off, and there are
several mechanisms by which gene expression may be modulated by alternative splicing,
one of which is via the nonsense-mediated decay (NMD) pathway.
NMD is a degradation mechanism that removes mRNA transcripts carrying premature
termination codons (PTC). The process where alternative splicing introduces a PTC that
triggers NMD, is referred to as ‘regulated unproductive splicing and translation (RUST)
(Lareau et. al., 2007), and the expression of several genes under the control of RUST is
shown in Table 1.2. The spliceosome deposits an exon junction complex (EJC)
approximately 20 to 24 bases upstream of the splice junction on the pre-mRNA. Where
a premature termination codon (PTC) is located more than 50 nucleotides upstream of
the last EJC, via either insertion of an alternative exon or an intron with a stop codon, or
disruption of the reading frame, NMD will be triggered (Lewis et. al., 2003; Lareau et.
al., 2007) (Figure 1.5). However, there are exceptions to this model, as not all
transcripts with PTC that fulfil the 50-nucleotide rule elicit NMD (Lareau et. al., 2007),
with one example being the human Dyskeratosis congenita 1 (hDKC1) transcript
(Turano et. al., 2013). Furthermore, productive splicing can also be coupled to NMD, as
seen in the case of SC35 (SRSF2) auto-regulation (Stévenin et. al., 2001).
Overexpression of SC35 results in alternative splicing of its transcripts, generating 7
isoforms, one of which is a 1.7kb transcript with an additional exon. This isoform
retains full coding capacity, but is degraded by NMD because the stop codon is situated
209 bases upstream from the last EJC (Stévenin et. al., 2001). Nevertheless, auto-
Chapter 1: Introduction
13
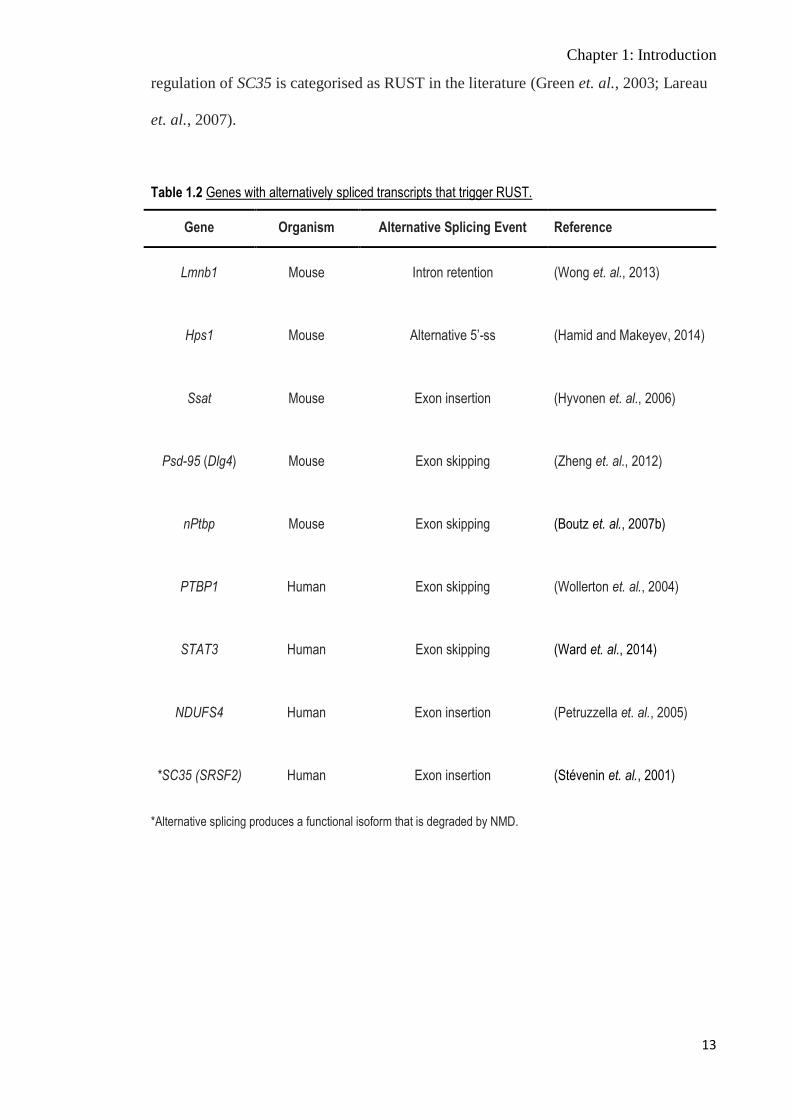
regulation of SC35 is categorised as RUST in the literature (Green et. al., 2003; Lareau
et. al., 2007).
Table 1.2 Genes with alternatively spliced transcripts that trigger RUST.
Gene Organism Alternative Splicing Event Reference
Lmnb1 Mouse Intron retention (Wong et. al., 2013)
Hps1 Mouse Alternative 5’-ss (Hamid and Makeyev, 2014)
Ssat Mouse Exon insertion (Hyvonen et. al., 2006)
Psd-95 (Dlg4) Mouse Exon skipping (Zheng et. al., 2012)
nPtbp Mouse Exon skipping (Boutz et. al., 2007b)
PTBP1 Human Exon skipping (Wollerton et. al., 2004)
STAT3 Human Exon skipping (Ward et. al., 2014)
NDUFS4 Human Exon insertion (Petruzzella et. al., 2005)
*SC35 (SRSF2) Human Exon insertion (Stévenin et. al., 2001)
*Alternative splicing produces a functional isoform that is degraded by NMD.
Chapter 1: Introduction
14
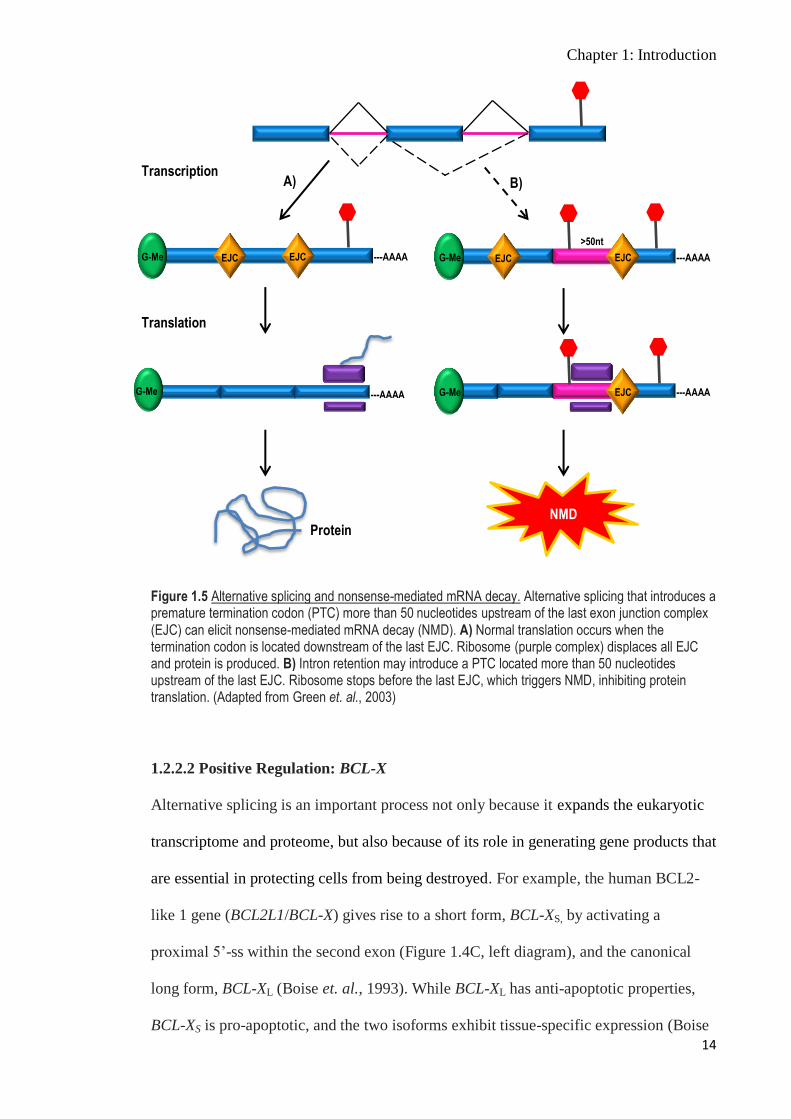
Figure 1.5 Alternative splicing and nonsense-mediated mRNA decay. Alternative splicing that introduces a premature termination codon (PTC) more than 50 nucleotides upstream of the last exon junction complex (EJC) can elicit nonsense-mediated mRNA decay (NMD). A) Normal translation occurs when the termination codon is located downstream of the last EJC. Ribosome (purple complex) displaces all EJC and protein is produced. B) Intron retention may introduce a PTC located more than 50 nucleotides upstream of the last EJC. Ribosome stops before the last EJC, which triggers NMD, inhibiting protein translation. (Adapted from Green et. al., 2003)
1.2.2.2 Positive Regulation: BCL-X
Alternative splicing is an important process not only because it expands the eukaryotic
transcriptome and proteome, but also because of its role in generating gene products that
are essential in protecting cells from being destroyed. For example, the human BCL2-
like 1 gene (BCL2L1/BCL-X) gives rise to a short form, BCL-XS, by activating a
proximal 5’-ss within the second exon (Figure 1.4C, left diagram), and the canonical
long form, BCL-XL (Boise et. al., 1993). While BCL-XL has anti-apoptotic properties,
BCL-XS is pro-apoptotic, and the two isoforms exhibit tissue-specific expression (Boise
---AAAA G-Me
EJC EJC ---AAAA G-Me
NMD
A) B)
EJC EJC ---AAAA G-Me
>50nt
EJC ---AAAA G-Me
Transcription
Translation
Protein
Chapter 1: Introduction
15
et. al., 1993). In the human brain, BCL-XL is the only expressed form (Boise et. al.,
1993), an important feature necessary to ensure long-term survival of brain cells. In the
lymphoid system where high levels of BCL-X mRNA are also observed, the BCL-XS is
the predominant form in immature double positive thymocytes that form T-cells (Boise
et. al., 1993). Double positive thymocytes are immature T cells that express both CD4+
and CD8+ glycoproteins on the cell surface, while a mature T cell will express only
either CD4+ or CD8
+ glycoprotein. Expression of the BCL-XS form allows for deletion
of thymocytes that recognise and will hence attack cells within our body to cause
autoimmune diseases. BCL-XS is also predominantly expressed in activated T-cells in
response to foreign antigens (Boise et. al., 1993). Boise et. al. (1993) postulated that
induced expression of BCL-XS in activated T-cells plays a role in promoting
amplification of T-cells in an immune response. While expression of BCL-XS increases
the susceptibility of T-cells to apoptosis, anti-apoptotic BCL-2 was found to be up-
regulated during immune response. This suggests that BCL-2 expression far exceeds the
expression of BCL-XS in activated T-cells, preventing apoptosis and accumulation of T-
cells in an immune response (Boise et. al., 1993). From this example of alternative
splicing of BCL-X, we can see the importance of the balance of alternative splicing in
generating gene products that are essential for proper development and functioning of
our immune system.
1.2.2.3 Indirect Regulation: Homer 1
Alternative splicing may also regulate gene expression indirectly. Rather than through
alternative splicing of a particular gene (target) transcript, the splicing pattern of another
transcript that codes for a regulatory protein (i.e. regulation cascade) of the target
transcript is altered. Such alternative splicing-mediated indirect gene regulation is seen
in the regulation of the gonadotropin hormones, follicle-stimulating hormone (FSH) and

Chapter 1: Introduction
16
Figure1. 6 Homer1 isoforms. Alternative splicing of the longer isoforms, Homer1b and Homer1c, generates the short isoform, Homer1a. (Taken from Wang et. al., 2014)
Exon
Intron
luteinising hormone (LH) by Homer1 isoforms in mouse LβT2 cells (Wang et. al.,
2014). FSH and LH regulate menstrual cycle and ovulation, hence controlled regulation
of genes that code for these hormones is important, and is mediated by alternative
splicing and processing of Homer1. Alternative splicing of Homer1 is controlled by the
release of gonadotrophin-releasing hormone (GnRH) that induces the splicing of the
longer mouse Homer1b/c to generate the shorter Homer1a (Figure 1.6). All three
isoforms (Homer1a, 1b, and 1c) can alter expression of the FSH and LH beta-subunits
(FSHβ, LHβ) (Wang et. al., 2014). Homer1b and Homer1c suppress FSHβ expression
and to a lesser extent, LHβ expression, while Homer1a enhances FSHβ expression
(Wang et. al., 2014). This study shows that alternative splicing can produce different
isoforms that have opposing regulatory effects on another gene, demonstrating an
additional level of gene regulation via alternative splicing.

Chapter 1: Introduction
17
1.2.3 Alternative Splicing and Neuronal Development
Alternative splicing is particularly important in neuronal development and has pivotal
roles in: i) development of nervous tissues (neurogenesis), ii) synapse formation and
maturation (synaptogenesis), and iii) neuronal migration (Norris and Calarco, 2012).
For example, polypyrimidine tract binding proteins 1 and 2 (PTBP1 and PTBP2/nPTBP)
are hnRNPs that play a role in regulating synaptogenesis. They regulate the expression
of postsynaptic density protein 95 (Psd-95) that is involved in the maturation of
excitatory synapses (Zheng et. al., 2012). As such, Psd-95 expression is enhanced
during late neuronal development, and this is facilitated by PTBP1 and PTBP2
expression. Expression of PTBP1 and PTBP2 represses Psd-95 expression, by inducing
exon 18 skipping in mouse Psd-95 and introducing a PTC that elicits NMD (Zheng et.
al., 2012). PTBP1 is highly expressed in neuronal progenitor cells and this prevents
unnecessary expression of Psd-95 in non-neuronal cells. While PTBP2 is expressed in
neuronal cells, it is down-regulated in late neuronal differentiation, allowing Psd-95
expression and neuron maturation (Zheng et. al., 2012).
Vertebrate and neural-specific Ser/Arg repeat-related protein of 100 kDa
(nSR100/SRRM4) is an SR-related protein that can cause inclusion of a 6-nucleotide
micro-exon in mouse Unc13b/Munc13, a gene that is involved in formation of neurites
(Quesnel-Vallieres et. al., 2015). Exclusion of this micro-exon in wild-type neurons
resulted in shorter neurites than in unaltered wild-type neurons (Quesnel-Vallieres et. al.,
2015). Conversely, inclusion of the 6-nucleotide micro-exon in mutant cells lacking
nSR100 expression restored neurite lengths to levels observed in wild-types (Quesnel-
Vallieres et. al., 2015). Another example that illustrates the importance of alternative
splicing in neuronal development is the synaptic surface proteins, neuroligin-1 and β-
neurexin. Neuroligin-1 and β-neurexin can be alternatively spliced to form isoforms that

Chapter 1: Introduction
18
will determine if the synapse is excitatory or inhibitory (Ichtchenko et. al., 1995; Chih
et. al., 2006; Li et. al., 2007). Neuroligin-1 can undergo insertion of different exons at
sites A and/or B (Figure 1.7) (Chih et. al., 2006), while β-neurexin can be alternatively
spliced at two sites, S4 and S5, where a different exon is inserted depending on the site
(Figure 1.7). Neuroligin-1 with an exon insertion at B specifically binds to the β-
neurexin lacking an alternative exon at S4 (Ichtchenko et. al., 1995; Chih et. al., 2006),
forming an excitatory glutamatergic synapse (Chih et. al., 2006; Li et. al., 2007). In
contrast, β-neurexin with an insertion at S4 was found to drive formation of inhibitory
GABAergic synapse (Chih et. al., 2006).
Altogether, the above examples clearly illustrate some of the important roles of
alternative splicing in regulating gene expression and neuronal development.
Figure 1.7 Schematic representation of β -neurexin and neuroligin-1 transcripts that code for synaptic surface proteins. Both β -neurexin and neuroligin-1 have two alternative splicing sites where an exon can be inserted. (Taken from Li et. al., 2007)

Chapter 1: Introduction
19
1.3 Using Antisense Oligonucleotides (AO) to Manipulate Splicing
Mutations of cis-acting elements involved in regulating splicing can lead to abnormal
splicing, where an abnormal mRNA transcript and/or protein are produced. Aberrant
splicing has been associated with numerous human diseases, including cancers
(Goodison et. al., 1998; Le Hir et. al., 2002; Lokody, 2014), β-thalassemia (Busslinger
et. al., 1981), frontotemporal dementia and parkinsonism (FTDP) (Hutton et. al., 1998),
and rare diseases such as amyotrophic lateral sclerosis (Xiao et. al., 2008) and
neurofibromatosis type 1 (Pros et. al., 2009). The neurofibromin 1 (NF1) gene transcript
is particularly prone to splicing errors that can cause neurofibromatosis (Xu et. al.,
2014). Through genetic screening, Xu and colleagues (2014) found that aberrant
splicing accounted for approximately 25% of mutations in NF1 gene transcripts. In
addition, according to the Human Gene Mutation (HGMD Professional Release 2015.1),
aberrant splicing accounts for approximately 9% of all known human disease causing
mutations.
Since an altered splicing pattern can lead to disease, correcting the splicing pattern is
one possible therapeutic intervention for many such cases and could be achieved by
using antisense oligonucleotides (AOs). Steric blocking AOs may alter splicing patterns
through various mechanisms. AOs may be designed to alter splicing by blocking motifs
that interact with trans-acting splicing regulatory elements, such as the ESEs (Dominov
et. al., 2014; Palhais et. al., 2015), or by blocking cis-acting splice sites (Pros et. al.,
2009; Sanaker et. al., 2012; Yuste-Checa et. al., 2015), polypyrimidine tract (PPT), or
branch point (BP). Though theoretically, blocking of PPT or BP by using AOs may alter
the splicing pattern, no studies have yet demonstrated this mechanism to our knowledge.
AOs may also be used to induce splice-switching modifications in splicing regulatory
Chapter 1: Introduction
20
proteins, to inhibit formation of undesired transcripts or to enhance formation of desired
transcripts.
1.3.1 Antisense Oligonucleotide-Induced Splice Switching
A number of splice switching AOs have been explored as potential therapies for rare
diseases, such as spinal muscular atrophy (SMA) (Osman et. al., 2014), Duchenne
muscular dystrophy (DMD) (Aartsma-Rus et. al., 2003), neurofibromatosis (Pros et. al.,
2009; Castellanos et. al., 2013), Hutchinson-Gilford progeria syndrome (Osorio et. al.,
2011), Huntington’s disease (Evers et. al., 2014) and Pompe’s disease (Clayton et. al.,
2015). Many of these are only proof-of-concept studies, but some AOs have
successfully progressed through early stage clinical studies and are entering phase II and
III trials. Examples of these include the antisense drug, ISIS-SMNRx that causes exon 7
retention in the survival motor neuron 2 (SMN2) gene transcripts that is linked to SMA
(https://clinicaltrials.gov), as well as eteplirsen that can induce exon 51 skipping in the
dystrophin (DMD) gene transcript associated with DMD (https://clinicaltrials.gov).
1.3.1.1 Exon Retention and Exon Skipping
Exon retention and exon skipping are two types of alternative splicing shown to be
inducible in various gene transcripts (in vitro and in vivo), and are of particular interest
in the treatment of rare diseases.
(i) Exon Retention
Spinal muscular atrophy (SMA) is a common human recessive disease that is the most
prevailing cause of infant deaths and it is primarily caused by homozygous loss of
SMN1 on chromosome 5. Expression of SMN2 that encodes an identical protein to
SMN1should reduce the severity of SMA, however, approximately 80% of SMN2 is
Chapter 1: Introduction
21
inappropriately spliced, due to a C to T transition in SMN2 exon 7. This transition
decreases the strength of exon 7 3’-ss and simultaneously abrogates an exonic enhancer
and creates an exonic silencer motif, thereby promoting skipping of exon 7 from the
mature mRNA (Lim and Hertel, 2001). This means that a full length protein is not
produced in sufficient amounts for normal neuronal cell survival. Higher expression of
full length SMN2 transcripts is associated with better disease prognosis and so, SMN2
transcripts are a possible therapeutic target. Several antisense approaches that use AOs
to modulate splicing to retain SMN2 exon 7 have been developed over the past 15 years.
These approaches include targeting different regions on the gene transcript (Lim and
Hertel, 2001; Sivanesan et. al., 2013), using different AO chemistries (Mitrpant et. al.,
2013; Zhou et. al., 2013), using bifunctional AOs (Dickson et. al., 2008; Osman et. al.,
2012), and AOs that are attached to small nuclear RNA (snRNA) (Madocsai et. al.,
2005; Baughan et. al., 2009), and combinations of the above (Baughan et. al., 2009).
The intronic splicing silencer N1 (ISS-N1) is a 15bp sequence between nucleotides 10
and 24 of SMN2 intron 7 that has an inhibitory effect on the recognition of the 5’-ss of
exon 7, thereby promoting its exclusion from the mature SMN2 mRNA transcript (Singh
et. al., 2006). By masking ISS-N1 with appropriate AOs, exon 7 recognition by the
splicing machinery is enhanced and is thus retained in the mature transcript. ISS-N1-
targeting AOs explored thus far by different groups have varied in length, backbone,
and ribose sugar chemistry. Most of these AOs have a length of 18 to 25 bases
(Williams et. al., 2009; Hua et. al., 2010; Porensky et. al., 2012; Zhou et. al., 2013), but
interestingly, an 8 base AO (3UP8i) that covers the first five nucleotides of ISS-N1 (and
3 nucleotides upstream), has been reported to be effective in restoring exon 7 splicing
(Singh et. al., 2006; Keil et. al., 2014). However, Keil et. al. (2014) attributed the
stimulatory effect of 3UP8i to its blocking of the formation of an inhibitory hairpin via a
Chapter 1: Introduction
22
long distance interaction (LDI) that inhibits exon 7 splicing, rather than directly
blocking the ISS-N1 motif (Keil et. al., 2014). This inhibitory RNA structure, termed
internal stem through LDI-1 (ISTL1), was identified as part of another ISS region,
designated ISS-N2 (Singh et. al., 2013), another potential target region- in SMN2 for
splice modification. In a recent study, exon 7 incorporation in the mature mRNA was
achieved in vitro using an AO directed to ISS-N2 (Singh et. al., 2015).
Regardless of the AO design used, all studies investigating the effects of ISS-N1-
targeting AOs so far have shown that targeting this region can effectively alter the
SMN2 splicing pattern and induce exon 7 retention (Williams et. al., 2009; Hua et. al.,
2010; Passini et. al., 2011; Zhou et. al., 2013). Furthermore, these studies all
demonstrated increased SMN protein levels as well as improved phenotypes in muscle
function and body weight in transgenic mouse models with different SMA severities.
Nonetheless, how well the different types of AO work may vary, as the effect of AO-
modulated splicing is multi-factorial, and uptake of the AO in the CNS is a crucial step
in SMA therapy (Williams et. al., 2009; Passini et. al., 2011). AO efficacy may be
influenced by the combination of the different lengths, backbones, chemistries,
concentrations and administration method, as suggested by the differences in results of
in vitro and/or in vivo studies where comparative analysis was conducted (Hua et. al.,
2010; Mitrpant et. al., 2013; Zhou et. al., 2013; Osman et. al., 2014).
(ii) Exon skipping
One disease with unequivocal evidence for alternative splicing as a therapy is AO-
mediated exon skipping in Duchenne Muscular Dystrophy (DMD). This is an X-linked
a muscle wasting condition caused by mutations in the dystrophin gene (DMD) that
Chapter 1: Introduction
23
ablate or greatly reduce functional protein expression. Exon skipping can restore the
open reading frame in a number of mutated isoforms, generating functional protein.
Different research groups had induced skipping of different dystrophin exons in mouse
models and human cells (Mann et. al., 2001; Van Deutekom et. al., 2001; Aartsma-Rus
et. al., 2003; Aartsma-Rus et. al., 2007; Greer et. al., 2014), including, but not limited to,
the skipping of exon 51 (Aartsma-Rus et. al., 2003; Arechavala-Gomeza et. al., 2007),
and exons 45 to 55 (van Vliet et. al., 2008; Echigoya et. al., 2015). Notably, AO-
mediated skipping of all DMD exons, except the first and last, has been demonstrated to
be possible (Wilton et. al., 2007). Efficacy of exon 51 skipping is clearly illustrated by
the eteplirsen phase IIb clinical trial, with increased dystrophin-positive fibres,
significant improvement in 6 minute-walk distance (6MWD), compared to placebo
controls, and no reported adverse reactions (Mendell et. al., 2013). In contrast, a
drisapersen phase II clinical trial demonstrated no efficacy, with statistically
insignificant results in primary and secondary endpoints, which include 6MWD and
dystrophin quantitation, and adverse events (injection-site reactions, proteinuria,
haematuria) were reported (Voit et. al., 2014). Furthermore, a drisapersen phase III
clinical trial failed to meet the primary endpoint and was terminated recently (Lu et. al.,
2014). Although these trials were similar in principle and target, the drisapersen AO
chemistry (2’-O-methyl-phosphorothioate; 2’-OMeP) meant that the drug could only be
administrated at much lower concentrations due to toxicity, and was unable to induce
clinically significant dystrophin expression (Lu et. al., 2014; Voit et. al., 2014).
Conversely, eteplirsen is a phosphorodiamidate morpholino oligomer (PMO) and could
be safely administered at a dose 5 to 8 times higher than drisapersen (Mendell et. al.,
2013; Lu et. al., 2014; Voit et. al., 2014).

Chapter 1: Introduction
24
Multi-exon skipping of exons 45 to 55, the DMD mutation hotspot region in mdx52
mouse, using a vivo- phosphorodiamidate morpholino oligomer (vPMO) cocktail, has
recently been reported (Echigoya et. al., 2015). Interestingly, skipping of this region
was found to be insignificant in a previous in vitro study conducted using patient and
control cell cultures (van Vliet et. al., 2008). Possible reasons for the discrepancies in
results are differences in chemistry of AOs used, different AO sequences, different type
of studies, and different species employed. The mdx52 mouse model used is possibly
not the best model of human DMD. The model exhibits a milder form of muscular
dystrophy, and it does not present all dystrophic pathology observed in typical DMD
patients (Araki et. al., 1997; Willmann et. al., 2009). In addition, there is no supporting
data on the mdx52 model showing progressive dystrophinopathy development
(Willmann et. al., 2009). Furthermore, Echigoya et. al. (2015) set the end-point of their
study to 6 months, but muscle weakness is only observed in 18 month old mdx52 mice
(Willmann et. al., 2009). Hence, the promising results presented may not reflect the
actual outcome of the vPMO-mediated splice-switching and highlights the limitations in
working with animal models.
AO-mediated exon skipping has been applied to other disease-related gene transcript,
such as titin (TTN) (Gramlich et. al., 2015), microtubule-associated protein tau (MAPT)
(Sud et. al., 2014), mouse muscle glycogen synthase 1 (Gys1) (Clayton et. al., 2015),
and huntingtin (HTT) (Evers et. al., 2014). Frameshift mutations in the TTN gene can
result in titin-based dilated cardiomyopathy. An AO that masks the ESE motifs in TTN
exon 326 causes skipping of the target exon and results in increased TTN mRNA
transcripts and proteins, and phenotypic improvements (Gramlich et. al., 2015). MAPT
codes for tau proteins, which in excessive amounts can form aggregates and cause
tauopathies such as Alzheimer’s disease and frontotemporal lobar dementia-tau type
Chapter 1: Introduction
25
(Sud et. al., 2014). The most potent anti-tau AO reported to date targeted the 5’-ss of
exon 5, inducing skipping of exon 5 (Sud et. al., 2014). The loss of MAPT exon 5
disrupts the open reading frame (ORF), generating a premature termination codon,
which subsequently caused a reduction via NMD in tau mRNA and protein levels (Sud
et. al., 2014).
Unlike the more widely reported AO-mediated splice switching strategies, AO-
mediated exon skipping of Gys1 and HTT indirectly alleviates disease conditions.
Pompe’s disease results from an accumulation of lysosomal glycogen, due to mutations
in acid alpha glucosidase (GAA), an enzyme responsible for breaking glycogen down
into glucose (Clayton et. al., 2015). Rather than altering the splicing of the mutated
GAA transcripts, AOs were designed against Gys1 as part of a substrate reduction
approach (Clayton et. al., 2015). One of the AOs induced exon 6 skipping in the Gys1
gene transcript that encodes glycogen synthase, an enzyme that synthesises glycogen.
Suppressing this enzyme should block the accumulation of glycogen, thereby mitigating
the loss of function GAA enzyme, and alleviating disease symptoms (Clayton et. al.,
2015).
In the case of HTT, a gene mutated in familial Huntington’s disease patients, the goal is
not to reduce expression of mutant HTT, but to change the protein structure (Evers et.
al., 2014). An AO designed to target an ESE within HTT exon 12 induced a 135bp
partial skipping of this exon in patient-derived fibroblasts (Evers et. al., 2014). The AO
was postulated to function by causing activation of a cryptic 5’-ss that results in deletion
of caspase 3- and 6- cleavage sites found within HTT exon 12 (Evers et. al., 2014).
Cleavage of mutant HTT protein at caspase 3- and particularly, at caspase 6- cleavage
sites, produces shorter mutant HTT proteins that are implicated in enhanced cell toxicity.
Chapter 1: Introduction
26
By deleting the caspase cleavage sites, shorter mutant HTT proteins are not produced
and therefore do not aggregate to cause disease progression (Evers et. al., 2014). The
authors also demonstrated in vivo deletion of the cleavage sites in mice, which involved
injection of an AO cocktail that induced skipping of Htt exons 12 and 13, as the cryptic
5’-ss implicated in partial skipping of human HTT exon 12 is not present in mouse
(Evers et. al., 2014). Through in vitro and in vivo studies, Evers and colleagues (2014)
provided solid evidence that AO-mediated exon skipping is inducible in huntingtin gene
transcripts.
Splice switching examples above that were demonstrated in vivo (Hua et. al., 2010;
Osman et. al., 2012; Zhou et. al., 2013; Mitrpant et. al., 2013; Evers et. al., 2014) make
the development of these splice-switching AOs significant and valuable. Nonetheless,
the usefulness of mouse models as in vivo systems is debatable, as they may not
accurately reflect human conditions, as in the case of dystrophin-deficient mouse and
canine models (Willmann et. al., 2009). Disease phenotypes may differ between mdx
mouse models and human patients, where it is less severe in the mouse model (Manning
and O’Malley, 2015). Disease progression timescale may also differ considerably
(Manning and O’Malley, 2015). Furthermore, AO treatments may give positive results
in the animal models, but when used on human subjects, the results may be different. A
gene sequence may differ between human and animal models, which can lead to
different splicing patterns and different non-coding RNAs, and metabolic differences
may be another obstacle. However, in vivo studies using animal models are essential in
establishing reliability and feasibility of the interventions, and in understanding disease
pathobiology in many cases. Therefore, while these proof-of-concept studies require
further testing on human cells and/or patients, these, and the successful clinical trials to
Chapter 1: Introduction
27
date provide strong evidence for the feasibility of using AOs to modulate splicing
patterns of a wide range of gene transcripts.
1.4. Rising Alternative Splicing Event: Intron Retention
Of the various alternative splicing events, complete exon skipping is the most common,
accounting for 40% of alternative splicing events in humans and mice, and intron
retention is the least common at 3% (Sugnet et. al., 2004). Most studies on AO-
mediated splicing modification focus on exon skipping, but the first study on AO-
mediated splice switching actually explored the use of AOs targeting intronic sequences
of β-globin gene transcripts to promote the use of canonical splice sites in thalassemia
(Dominski and Kole, 1993). There have been few studies on intron retention in human
gene transcripts, with minimal focus on inducing intron retention using AOs, since
intron retention as an endogenous mechanism of gene expression regulation has only
been observed in recent years. Nevertheless, there are some situations where terminal
intron retention may be of therapeutic benefit. Relatively unexplored, it will be
intriguing to determine if intron retention is a generally widespread phenomenon,
whether it may be consistently induced by AOs, and to explore the effect(s) on gene
expression. This section will discuss why it is worthwhile to look into intron retention
and pseudo-exon activation, a type of intron retention.
1.4.1 Intron retention
Intron retention is recognised as a rare alternative splicing event in humans, accounting
for 3% of all alternative splicing events in humans and mice (Sugnet et. al., 2004).
However, intron retention in human gene expression may not be as rare as initially
thought, especially as better methods for detecting intron retention are developed, such
as IRFinder (Wong et. al., 2013), and IRcall and IRclassifier (Bai et. al., 2015). Of note,
Chapter 1: Introduction
28
the IRcall and IRclassifier algorithms were used to analyse plant mRNA (Arabidopsis
thaliana), which means that future studies using human gene transcripts are required to
test the efficacies of IRcall and IRclassifier in detecting intron retention in humans.
Nevertheless, intron retention is common in some, and possibly most, human gene
transcripts and has been found to be a common splicing event in the human Kallikrein
(hKLK) gene family (Michael et. al., 2005), and in human Dyskeratosis congenita 1
(hDKC1) (Turano et. al., 2013). Retention of intron 3 was found to occur in 6 out of 15
isoforms of hKLK (Michael et. al., 2005). While for hDCK1, there are 5 intron-retaining
isoforms. (Turano et. al., 2013).
1.4.1.1 Intron Retention and Gene Expression
Intron retention may potentially function as an additional on/off switch in gene
expression by: i) promoting nuclear retention and degradation (nuclear quality control),
ii) channelling the mRNA into the NMD pathway (cytoplasmic quality control), or by
iii) producing small (non-coding) regulatory RNAs (section 5.1.2).
(i) Nuclear Retention and Degradation
Pre-mRNAs not spliced completely are typically retained in the nucleus and targeted for
degradation by the nuclear exosomes or Rat1p/Xrn2, a 5′–3′ exonuclease (Egecioglu
and Chanfreau, 2011). For example, (terminal) intron retention within the human
poly(A)-binding protein nuclear 1 (PABPN1) transcripts prevents nuclear export and
promotes degradation of the unspliced transcripts by nuclear exosomes (Bergeron et. al.,
2015). Similarly, (terminal) intron retention within mouse Stxb1, Vamp2, Sv2a, and
Kif5a that code for presynaptic proteins, retained the incompletely spliced transcripts
within the nucleus (Yap et. al., 2012). These intron-retaining transcripts are then

Chapter 1: Introduction
29
eliminated by nuclear exosomes, in the presence of certain nuclear RNA surveillance
components (Yap et. al., 2012).
Notably, not all unspliced pre-mRNAs retained in the nucleus are degraded. They may
be sequestered in the nucleus until activated in response to a particular stimulus. One
example of this is the mouse apolipoprotein E4 (ApoE), a gene constitutively
transcribed but incompletely spliced, retaining intron 3 (ApoE-I3) (Xu et. al., 2008). By
examining the nuclear and cytosolic fractions of Neuro-2a cells, more than 98% of
ApoE-I3 transcripts were found to be present in the nucleus, while approximately 60%
of the intron-less ApoE transcripts were found in the cytosol (Xu et. al., 2008). This
finding was further supported by western-blotting assay. Expression of ApoE is
regulated by retention/splicing of intron 3. Retention of ApoE intron 3 causes the ApoE
transcripts to remain within the nucleus and hence, ApoE is not translated and expressed
in the cytoplasm (Xu et. al., 2008). Conversely, splicing of intron 3 resulted in ApoE
expression, suggesting that intron retention has a functional role in ApoE expression.
(ii) Intron Retention and Nonsense-mediated mRNA Decay
Some intron-retaining transcripts may escape nuclear degradation and get exported to
the cytoplasm, where they may be degraded by NMD. In their study, Wong et. al. (2013)
demonstrated that intron retention has a role in normal granulocyte differentiation via
the NMD pathway. Using an algorithm (IRFinder) and heatmap analysis, Wong et. al.
(2013) found that intron retention was common in granulocytes, accounting for 12.8%
of alternatively spliced isoforms. The intron-retaining transcripts were exported from
the nucleus to the cytoplasm, but were not translated into proteins, suggesting that the
intron retention was coupled with NMD (IR-NMD) (Wong et. al., 2013). By inhibiting
the NMD pathway, mRNA expression increased and conversely, protein expression
Chapter 1: Introduction
30
decreased when intron retention levels were high (Wong et. al., 2013). This study shows
that intron retention can lead to NMD, thereby resulting in decreased gene expression at
the mRNA and protein levels. IR-NMD of the granulocyte genes has been found to be
essential in the formation of normal granulocytes. Lmnb1 is one of the intron-retaining
genes present in mouse granulocytes and expression of intron-less Lmnb1 at later stages
of granulopoiesis resulted in decreased amounts of granulocytes in the peripheral blood,
suggesting an inhibition of granulocyte formation (Wong et. al., 2013). Expression of
intron-less Lmnb1 also resulted in an altered nuclear shape and increased nuclear
volume, but had no effect on cell function (Wong et. al., 2013). Nonetheless, the
authors noted that the altered morphology may affect the efficiency of granulocyte
differentiation or distribution (Wong et. al., 2013). Collectively, Wong et. al. (2013)
showed that IR-NMD has regulatory and functional importance in granulopoiesis,
where intron-retaining Lmnb1 ensures proper granulocyte formation. While the study
was conducted using mouse granulocytes, the authors showed that intron retention in
mouse granulocytes is conserved in human granulocytes, providing evidence of the role
intron retention plays in regulating gene expression in humans, indirectly.
1.4.1.2 Cytoplasmic Intron-retaining Transcripts (CIRTs)
Interestingly, intron retention does not always lead to decreased mRNA and protein
expressions. This is contrary to what would have been expected, as normally, only
intron-less mature mRNAs are exported to the cytoplasm and translated into proteins.
Incompletely spliced mRNAs are usually degraded within the nucleus, or if exported,
are degraded by NMD. However, some intron-retaining mRNAs have been found to be
able to pass through the nuclear envelope and escape cytoplasmic NMD (Calvanese et.
al., 2008; Bell et. al., 2008; Wong et. al., 2013). Such transcripts are termed
“cytoplasmic intron-retaining transcripts” (CIRTs) (Buckley et. al., 2014). Some CIRTs
Chapter 1: Introduction
31
may have biological roles, such as proinsulin and rat Kcnma1 that codes for the α-
subunit of the big potassium channel (BKCa). Proinsulin isoforms with retained intron 1
appeared to have a role in early cardiogenesis in chickens (Mansilla et. al., 2005), while
Kcnma1 with retained intron 16 helps to maintain excitability of the hippocampal
neurons (Bell et. al., 2008), but the mechanism of the functional relationship was not
mentioned in either study. Khaladkar et. al. (2013) found a high prevalence of CIRTs in
rat and mouse dendritic gene transcripts, approximately 44% and 60%, respectively. Of
these CIRTs, Khaladkar’s group performed gene ontology analysis on transcripts with
at least one retained intron that is greater than 265bp, and it was shown that these CIRTs
are greatly involved in neuronal development, cell projection organisation, and protein
localisation (Khaladkar et. al., 2013). Furthermore, some CIRTs code for non-coding
RNAs (ncRNAs) such as snRNAs, miRNAs and snoRNAs, contributing to another
layer of gene regulation (Mollet et. al., 2010; Turano et. al., 2013; Khaladkar et. al.,
2013).
1.4.1.3 Nuclear Intron-retaining Transcripts
Intron-retaining gene transcripts within the nucleus that are not degraded may have
functional roles. ApoE-I3 aforementioned is an example. Another example is the intron-
retaining isoform (Id3a) of the gene transcript coding for rat helix-loop-helix
transcription factor (Id3). Id3a functions as a negative feedback on Id3 (Forrest et. al.,
2004). Id3a has retained intron 1, within which is a stop codon, and hence it encodes a
truncated protein (Forrest et. al., 2004). Expression of Id3 is induced during vascular
injury, and it promotes smooth muscle cell (SMC) proliferation, as a form of repair
mechanism (Forrest et. al., 2004). However, Id3 levels gradually drop and Id3a levels
increase as days after injury pass (Forrest et. al., 2004). It was discovered that the Id3a
isoform decreases the levels of Id3 by inhibiting its transcription, and so, Id3a functions
Chapter 1: Introduction
32
as an important negative feedback, inhibiting further SMC proliferation that can lead to
vascular lesion (Forrest et. al., 2004). Although the exact mechanism of the negative
feedback is unknown, this example illustrates the role of intron retention in maintaining
homeostasis.
As shown above, intron retention potentially has diverse roles in regulating gene
expression via multiple pathways. It is thus interesting to investigate artificially induced
intron retention in a selection of gene transcripts, and ascertain what effect(s) it may
have on gene expression at the mRNA and protein levels. Should down-regulation occur
for one particular gene transcript, intron retention may be developed as a mechanism in
treatment of disease associated with over expression of that gene. Should up-regulation
occur, intron retention may be used to treat diseases arising from low levels of protein
expression. In addition, upregulating intron retention may also be applied to create
animal models for in vivo evaluation.
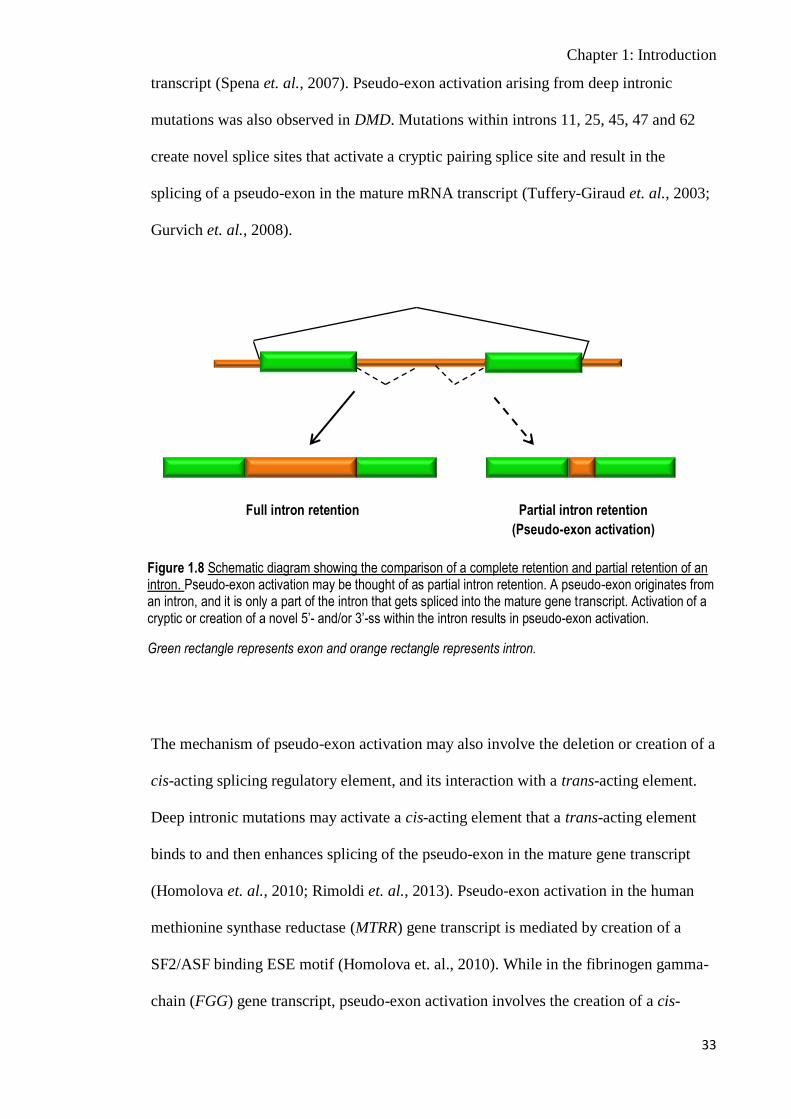
1.4.2 Pseudo-exon Activation
A pseudo-exon is part of an intronic sequence that is retained in the mature mRNA
transcript and spliced with the exons (Figure 1.8). Therefore, pseudo-exon activations
may be considered as a subset of intron retention. Pseudo-exons typically arise from
deep intronic mutations that result in the activation of cryptic acceptor (3’) and/or donor
(5’) splice sites (ss) (Spena et. al., 2007; Sanaker et. al., 2012; Dominov et. al., 2014;
Yuste-Checa et. al., 2015). For example, an intronic point mutation in the fibrinogen
gamma chain (FGG) gene increases the strength of a cryptic 5’-ss within the intron
(Spena et. al., 2007). This activated cryptic 5’-ss then cooperates with the downstream
canonical 3’-ss, while a normally silenced 3’-ss within the intron recognises the
upstream canonical 5’-ss and cause the splicing of a pseudo-exon in the mature mRNA
Chapter 1: Introduction
33
transcript (Spena et. al., 2007). Pseudo-exon activation arising from deep intronic
mutations was also observed in DMD. Mutations within introns 11, 25, 45, 47 and 62
create novel splice sites that activate a cryptic pairing splice site and result in the
splicing of a pseudo-exon in the mature mRNA transcript (Tuffery-Giraud et. al., 2003;
Gurvich et. al., 2008).
The mechanism of pseudo-exon activation may also involve the deletion or creation of a
cis-acting splicing regulatory element, and its interaction with a trans-acting element.
Deep intronic mutations may activate a cis-acting element that a trans-acting element
binds to and then enhances splicing of the pseudo-exon in the mature gene transcript
(Homolova et. al., 2010; Rimoldi et. al., 2013). Pseudo-exon activation in the human
methionine synthase reductase (MTRR) gene transcript is mediated by creation of a
SF2/ASF binding ESE motif (Homolova et. al., 2010). While in the fibrinogen gamma-
chain (FGG) gene transcript, pseudo-exon activation involves the creation of a cis-
Figure 1.8 Schematic diagram showing the comparison of a complete retention and partial retention of an intron. Pseudo-exon activation may be thought of as partial intron retention. A pseudo-exon originates from an intron, and it is only a part of the intron that gets spliced into the mature gene transcript. Activation of a cryptic or creation of a novel 5’- and/or 3’-ss within the intron results in pseudo-exon activation.
Green rectangle represents exon and orange rectangle represents intron.
Full intron retention Partial intron retention
(Pseudo-exon activation)
Chapter 1: Introduction
34
acting 3 G-run motif recognised by the trans-acting hnRNP F splicing factor (Rimoldi
et. al., 2013). Noticeably, hnRNPs are typically associated with inhibiting splicing by
binding to ESSs, but in FGG pseudo-exon, hnRNP F binds to an ESE (3 G-run motif)
and activates pseudo-exon inclusion. Nonetheless, in the absence of the 25bp region that
consists of the 3 G-run motif, hnRNP F binds to two other G-run motifs within the
pseudo-exon that function as ESSs, and inhibits pseudo-exon activation (Rimoldi et. al.,
2013). Another possible mechanism of pseudo-exon activation is via deletion of ESS
motifs downstream of the pseudo-exon (Greer et. al., 2015). Other rare pseudo-exon
activation mechanisms include genomic rearrangements, genomic inversions, and loss
of upstream 5’-ss or downstream 3’-ss (Dhir and Buratti, 2010). Examples of genomic
rearrangement and inversion that resulted in pseudo-exon activation are documented in
the DMD gene (Cagliani et. al., 2004; Madden et. al., 2009; Khelifi et. al., 2011) and
they are speculated to cause pseudo-exon activation by narrowing the distance between
splice sites (Dhir and Buratti, 2010), creating novel splice sites (Khelifi et. al., 2011),
deleting intronic splicing enhancers (ISE) (Khelifi et. al., 2011), or by creating exonic
splicing enhancers (ESE) within the pseudo-exon (Madden et. al., 2009). To summarise,
pseudo-exon activation may involve activation of cryptic splice sites, creation of novel
splice sites, deletion or creation of a cis-acting regulatory sequence, or complex
interactions between cis- and trans- acting splicing regulatory elements, suggesting
possible, yet challenging manipulations of pseudo-exon inclusion from different
directions.
Many studies have explored pseudo-exon skipping to remove those sequences that
cause disease (Sanaker et. al., 2012; Blazquez et. al., 2013; Dominov et. al., 2014;
Yuste-Checa et. al., 2015). On the other hand, activation of pseudo-exons is an area that
has not been investigated in detail. This could be because pseudo-exons are often
Chapter 1: Introduction
35
associated with diseases (Spena et. al., 2007; Kollberg et. al., 2009; Cavalieri et. al.,
2013; Flanagan et. al., 2013). Typically, an out-of-frame pseudo-exon results in a
premature termination codon (PTC) (Kollberg et. al., 2009; Sanaker et. al., 2012;
Dominov et. al., 2014) that may induce elimination of the transcript by NMD (Dominov
et. al., 2014). This suggests the possibility of deliberately activating pseudo-exons to
down-regulate gene expression linked to disease, such as dominant conditions and
cancers. Pseudo-exon activation may also be applied to create a model system for
studying of diseases. Therefore, pseudo-exon activation produced by AOs designed to
block silencers, is a new area worthy of investigation.
With the limited knowledge on intron retention and pseudo- exon activation, it calls for
studies into these alternative splicing events in different gene transcripts and
examination of the effects of such events within each specific gene transcript. This will
not only contribute to an expansion of knowledge, but may also lay the groundworks for
future development of therapies and/or animal models.
1.5 Why Study Terminal Intron Retention in Human Gene Transcripts?
We now know that intron retention is not as rare as initially thought. It is a common
event in some human gene families (Michael et. al., 2005; Turano et. al., 2013). Intron
retention may determine the spatial and temporal expression of a gene, and it has also
been implicated in the production of small regulatory (non-coding) RNAs, showing the
importance of intron retention in gene regulation (Hube and Francastel, 2015). Despite
an increasing focus on intron retention, terminal intron retention has yet to be studied in
depth. Of the studies that established the importance of intron retention in ensuring
biological functions, they mostly involve internal, and not terminal, introns.
Chapter 1: Introduction
36
So far, endogenous terminal intron retention has been reported in SC35 splicing
regulatory protein (Stévenin et. al., 2001), gene transcripts from some genes (Stxb1,
Vamp2, Sv2a, Kif5) that code for the presynaptic proteins in mouse neuroblastoma cell
lines (Yap et. al., 2012), as well as in human PABPN1 transcripts (Bergeron et. al.,
2015). Overexpression of SC35 proteins in HeLa cells triggers alternative splicing of
the SC35 gene transcripts, producing multiple isoforms, including two with retained
terminal intron (Stévenin et. al., 2001). Other isoforms have an exon cassette included.
The various isoforms have full coding capacity, but result in down-regulation of SC35
expression by lowering mRNA stability. Nonetheless, isoforms with retained terminal
introns are less abundant than those with exon inclusion (Stévenin et. al., 2001). A more
robust example of terminal intron retention is seen in the presynaptic protein coding
gene transcripts. Terminal intron retention in Stxb1, Vamp2, Sv2a, Kif5a is controlled by
Ptbp1 expression, where splicing of the terminal 3’-intron is repressed in the presence
of Ptbp1 proteins (Yap et. al., 2012). Ptbp1 proteins bind to its complementary
polypyrimidine sequence within the last intron of Stxb1 transcripts, inhibiting splicing
of the terminal intron (Yap et. al., 2012). Akin to SC35 gene transcripts, PABPN1 gene
transcripts are also auto-regulated (Bergeron et. al., 2015). Two isoforms are transcribed
from PABPN1, the spliced and terminal intron-retaining forms, with the latter making
up a fifth of the PABPN1 transcripts (Bergeron et. al., 2015). The ratio of the spliced to
incompletely spliced forms decreases as the amount of PABPN1 proteins increases,
suggesting that PABPN1 represses its expression by interfering with splicing (Bergeron
et. al., 2015). It was found that the PABPN1 binds specifically to an A-rich region that
is approximately 70 bases downstream of the 3’-ss of the terminal intron. This prevents
the binding of the splicing regulatory protein, SRSF 10, to the transcript, thereby
interfering with splicing of the terminal intron (Bergeron et. al., 2015).

Chapter 1: Introduction
37
Until now, induced terminal intron retention has only been reported in SMN2 (Lim and
Hertel, 2001; Price, unpublished data). There are two known studies where induced
retention of the terminal intron 7 of SMN2 has been discovered unintentionally in an
attempt to induce exon inclusion using AO (Lim and Hertel, 2001; Price, unpublished
data). In one of the studies, retention of SMN2 intron 7 was induced by an AO designed
to anneal at the 3’-ss junction of the terminal exon, but not by AOs designed to bind to
the branch point sequence or the polypyrimidine tract (Lim and Hertel, 2001). While the
study by Lim and Hertel (2001) showed promising exon 7 inclusion results, all
experiments were carried out at the mRNA level and hence, the effect of exon 7
inclusion together with intron 7 retention is unknown at the protein level. An increase in
full-length mRNA expression may indicate a consequential increase in SMN2 protein
levels, but surprisingly, in the other study, it was shown that a down-regulation of
expression at the protein level occurred at high levels of full-length mRNA expression
(Price, unpublished data). The discovery was made while trying to retain exon 7 using
an AO designed to anneal to a region within the terminal exon. Retention of the last
intron in the SMN2 gene lengthens the 3’ untranslated region (3’ UTR) but does not
alter the protein coding region. The last intron was found to contain binding sites for
two motifs, the BRD box and K box, which are known to affect translation in other gene
transcripts and could be repressing full-length SMN expression (Price, unpublished
data). Overall, these studies show that terminal intron retention could be induced using
AOs, but the effects on gene expression at both the mRNA and protein levels are
unpredictable. Therefore, terminal intron retention has to be examined on a gene-by-
gene basis.
For another very simple reason, terminal intron was chosen as the focus of current
project because all gene transcripts that undergo splicing will have a terminal intron.
Chapter 1: Introduction
38
There are many other introns that could be examined: the first, the largest or the
smallest in a transcript. However, since the number of internal introns varies between
different gene transcripts, and it is not possible to study all internal introns, the terminal
intron was selected for this project. Furthermore, induced terminal intron retention has
already been demonstrated in the SMN2 gene transcript at our laboratory. Our
laboratory has considerable experience in various aspects of exon skipping and retention,
but very little on intron retention. This is why the focus of this project will be on using
AO strategies to include the terminal intron in different mature gene transcripts, and
evaluate the effects, if any, on gene expression. The targeted transcripts are LMNA/C,
ITGA4, SOD1 and DMD. These genes were selected for study because of the experience
with working with these genes at the laboratory and because these genes are associated
with serious disease. If terminal intron retention is demonstrated to have potentially
beneficial effects on gene expression, the project could be a proof-of-concept study for
the use of terminal intron retention for therapeutic intervention.
1.6 Aims
To conclude, most studies on intron retention involve internal introns, not terminal
introns and induced terminal intron retention in humans has not been studied in depth.
Furthermore, it is apparent that to date, AO-induced terminal intron retention has only
been observed for SMN2. Therefore, the aims of the project are to i) investigate if
terminal intron retention can be induced in human gene transcripts (in vivo) by AO
targeting of LMNA/C, ITGA4, SOD1, and DMD, ii) study the effects of terminal intron
retention on gene expression at the mRNA and protein levels, and iii) find out if
different AO chemistries (2’-O-methyl AO on a phosphorothioate backbone and
phosphorodiamidate morpholino) will have similar, enhanced, or reduced effect on
terminal intron retention.

Chapter 2: Materials
39
2. Materials
2.1 2’-OMeAO Purification, Primers, PMOs and Leash Annealing
Material/Reagent Supplier
2’-OMeAOs TriLink BioTechnologies,
San Diego, California
PMOs Gene Tools, Philomath,
Oregon
PMO DNA leashes GeneWorks, Adelaide,
Australia
Primers GeneWorks, Adelaide,
Australia
Illustra NAP-10 Columns prepacked with
Sephadex G-25 DNA Grade
GE Healthcare Life Sciences,
Sydney, Australia
Molecular grade water Sigma-Aldrich, Sydney,
Australia
ND-1000 Spectrophotometer NanoDrop Technologies,
Wilmington, Delaware
2.2 Cell Culture and Passaging
Material/Reagent Supplier
Normal human fibroblasts &
Primary human myoblasts
Donated with informed
consent
Phosphate buffered saline Prepared in-house; chemicals
from Sigma-Aldrich
Horse serum Gibco® Thermo Fisher
Scientific, Melbourne,
Australia
Foetal bovine serum Gibco® Thermo Fisher
Scientific, Melbourne,
Australia
Chapter 2: Materials
40
Dulbecco's modified eagle medium
(High glucose, pyruvate)
Gibco® Thermo Fisher
Scientific, Melbourne,
Australia
Ham’s F-10 medium Gibco® Thermo Fisher
Scientific, Melbourne,
Australia
Chick embryo extract US Biological Life Sciences,
Salem, Massachusetts
Matrigel In Vitro Technologies,
Melbourne, Australia
Poly-D-lysine Sigma-Aldrich, Sydney,
Australia
Trypsin Ambion® Thermo Fisher
Scientific, Melbourne,
Australia
Trypan blue Sigma-Aldrich, Sydney,
Australia
NuncTM
15ml/50ml conical sterile
polypropylene centrifuge tubes
Thermo Fisher Scientific,
Melbourne, Australia
NuncTM
SpheraTM
T75/T175 flasks Thermo Fisher Scientific,
Melbourne Australia
NuncTM
cell-culture treated 24-well plates Thermo Fisher Scientific,
Melbourne, Australia
Cell counting chamber Hawksley, Sussex, UK
Eclipse TS100 microscope Nikon Australia, Sydney,
Australia
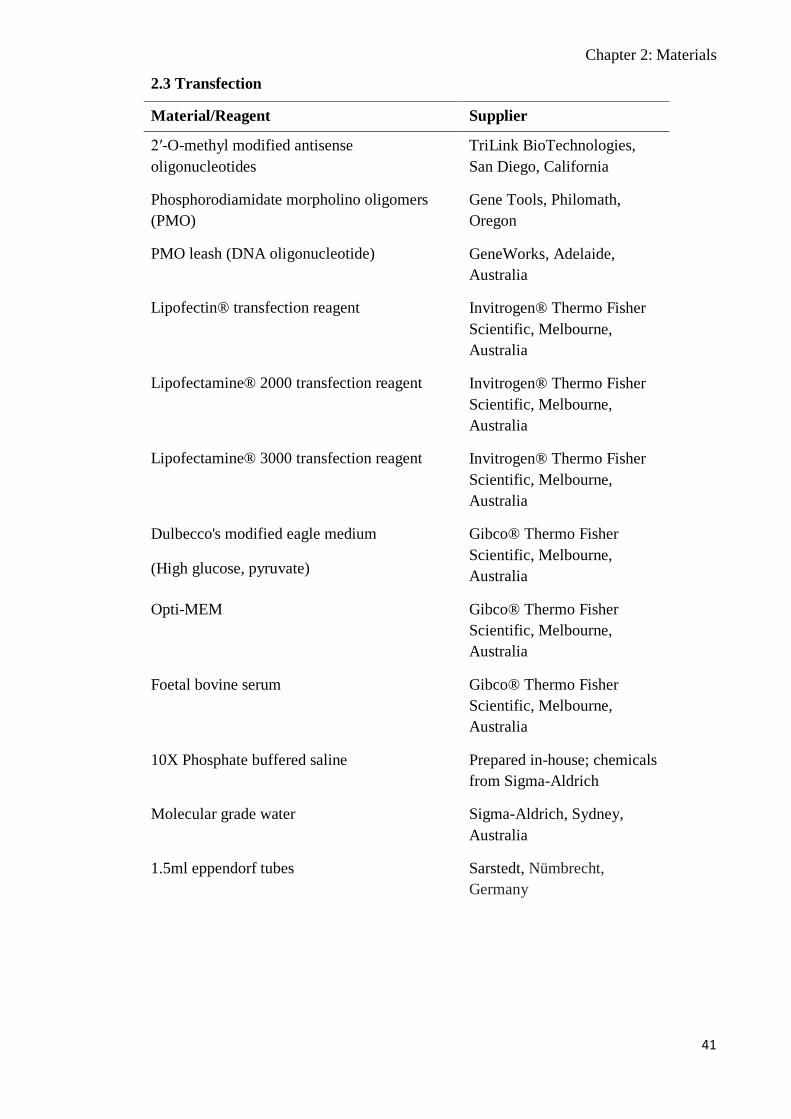
Chapter 2: Materials
41
2.3 Transfection
Material/Reagent Supplier
2′-O-methyl modified antisense
oligonucleotides
TriLink BioTechnologies,
San Diego, California
Phosphorodiamidate morpholino oligomers
(PMO)
Gene Tools, Philomath,
Oregon
PMO leash (DNA oligonucleotide) GeneWorks, Adelaide,
Australia
Lipofectin® transfection reagent Invitrogen® Thermo Fisher
Scientific, Melbourne,
Australia
Lipofectamine® 2000 transfection reagent Invitrogen® Thermo Fisher
Scientific, Melbourne,
Australia
Lipofectamine® 3000 transfection reagent Invitrogen® Thermo Fisher
Scientific, Melbourne,
Australia
Dulbecco's modified eagle medium
(High glucose, pyruvate)
Gibco® Thermo Fisher
Scientific, Melbourne,
Australia
Opti-MEM Gibco® Thermo Fisher
Scientific, Melbourne,
Australia
Foetal bovine serum Gibco® Thermo Fisher
Scientific, Melbourne,
Australia
10X Phosphate buffered saline Prepared in-house; chemicals
from Sigma-Aldrich
Molecular grade water Sigma-Aldrich, Sydney,
Australia
1.5ml eppendorf tubes Sarstedt, Nümbrecht,
Germany
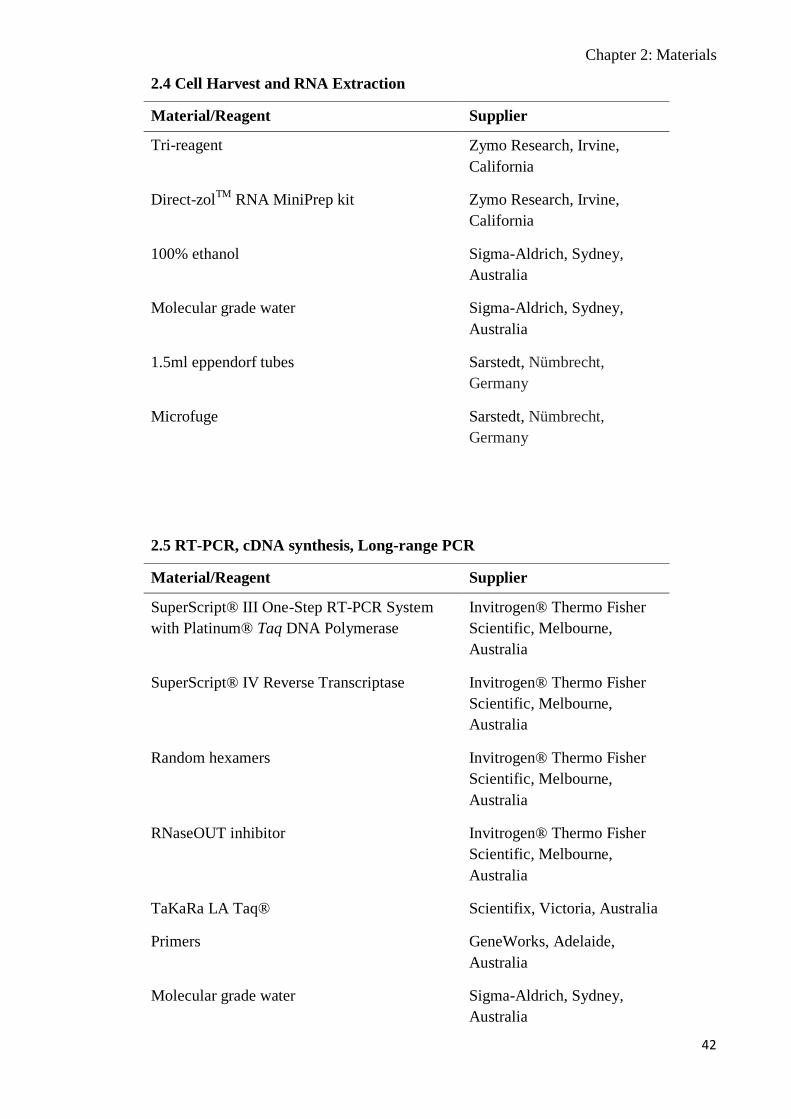
Chapter 2: Materials
42
2.4 Cell Harvest and RNA Extraction
Material/Reagent Supplier
Tri-reagent Zymo Research, Irvine,
California
Direct-zolTM
RNA MiniPrep kit Zymo Research, Irvine,
California
100% ethanol Sigma-Aldrich, Sydney,
Australia
Molecular grade water Sigma-Aldrich, Sydney,
Australia
1.5ml eppendorf tubes Sarstedt, Nümbrecht,
Germany
Microfuge Sarstedt, Nümbrecht,
Germany
2.5 RT-PCR, cDNA synthesis, Long-range PCR
Material/Reagent Supplier
SuperScript® III One-Step RT-PCR System
with Platinum® Taq DNA Polymerase
Invitrogen® Thermo Fisher
Scientific, Melbourne,
Australia
SuperScript® IV Reverse Transcriptase Invitrogen® Thermo Fisher
Scientific, Melbourne,
Australia
Random hexamers Invitrogen® Thermo Fisher
Scientific, Melbourne,
Australia
RNaseOUT inhibitor Invitrogen® Thermo Fisher
Scientific, Melbourne,
Australia
TaKaRa LA Taq® Scientifix, Victoria, Australia
Primers GeneWorks, Adelaide,
Australia
Molecular grade water Sigma-Aldrich, Sydney,
Australia
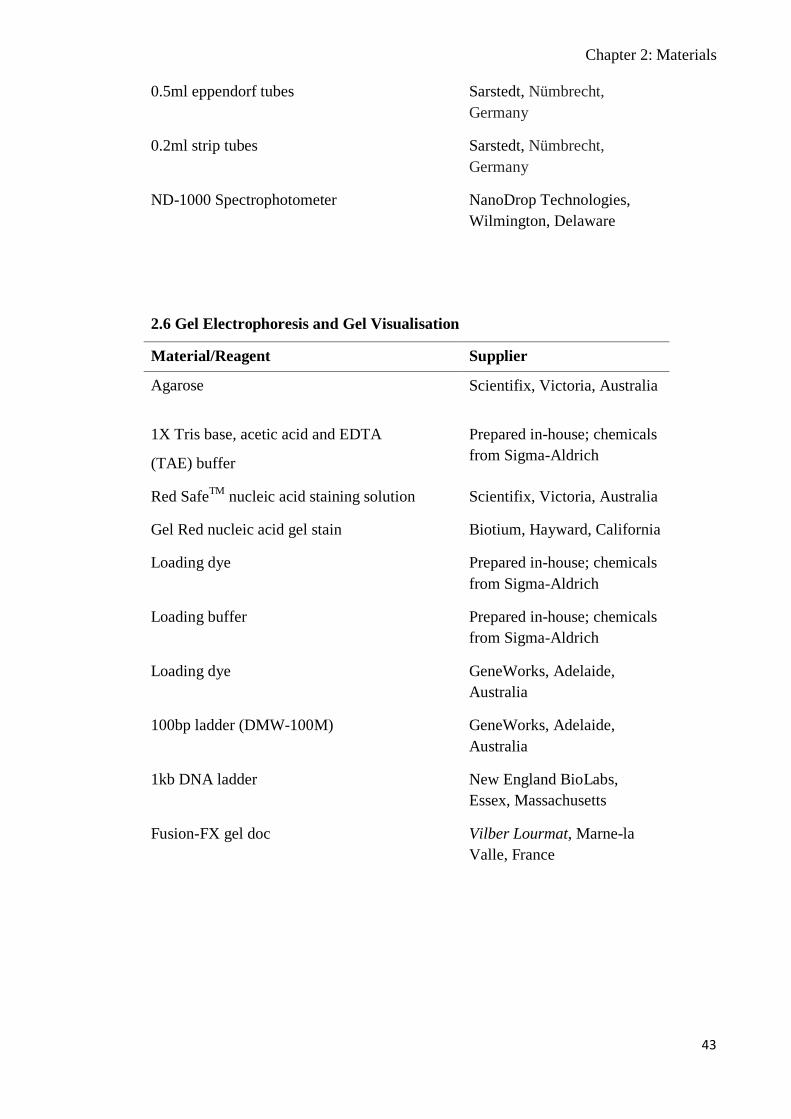
Chapter 2: Materials
43
0.5ml eppendorf tubes Sarstedt, Nümbrecht,
Germany
0.2ml strip tubes Sarstedt, Nümbrecht,
Germany
ND-1000 Spectrophotometer NanoDrop Technologies,
Wilmington, Delaware
2.6 Gel Electrophoresis and Gel Visualisation
Material/Reagent Supplier
Agarose Scientifix, Victoria, Australia
1X Tris base, acetic acid and EDTA
(TAE) buffer
Prepared in-house; chemicals
from Sigma-Aldrich
Red SafeTM
nucleic acid staining solution Scientifix, Victoria, Australia
Gel Red nucleic acid gel stain Biotium, Hayward, California
Loading dye Prepared in-house; chemicals
from Sigma-Aldrich
Loading buffer Prepared in-house; chemicals
from Sigma-Aldrich
Loading dye GeneWorks, Adelaide,
Australia
100bp ladder (DMW-100M) GeneWorks, Adelaide,
Australia
1kb DNA ladder New England BioLabs,
Essex, Massachusetts
Fusion-FX gel doc
Vilber Lourmat, Marne-la
Valle, France

Chapter 2: Materials
44
2.7 Product Isolation and DNA Sequencing
Material/Reagent Supplier
AmpliTaq Gold® DNA Polymerase with
GeneAmp® 10X PCR Gold Buffer
Thermo Fisher Scientific,
Melbourne, Australia
Diffinity RapidTip® Diffinity Genomics,
Henrietta, New York
Agarose Scientifix, Victoria, Australia
50X Tris base, acetic acid and EDTA
(TAE) buffer
Prepared in-house; chemicals
from Sigma-Aldrich
Ethidium bromide stain Prepared in-house; chemicals
from Sigma-Aldrich
Transilluminator Fotodyne Incorporated,
Hartland, Wisconsin
Macherey-Nagel NucleoSpin®
Gel & PCR Clean-up kit
Scientifix, Victoria, Australia
Scalpel
Molecular grade water Sigma-Aldrich, Sydney,
Australia
Primers GeneWorks, Adelaide,
Australia
2.8 Semi-quantitative Analysis
Material/Reagent Supplier
BIO1D software Vilber Lourmat, Marne-la
Valle, France
Chemismart 3000 Gel Doc Vilber Lourmat, Marne-la
Valle, France
Excel Microsoft
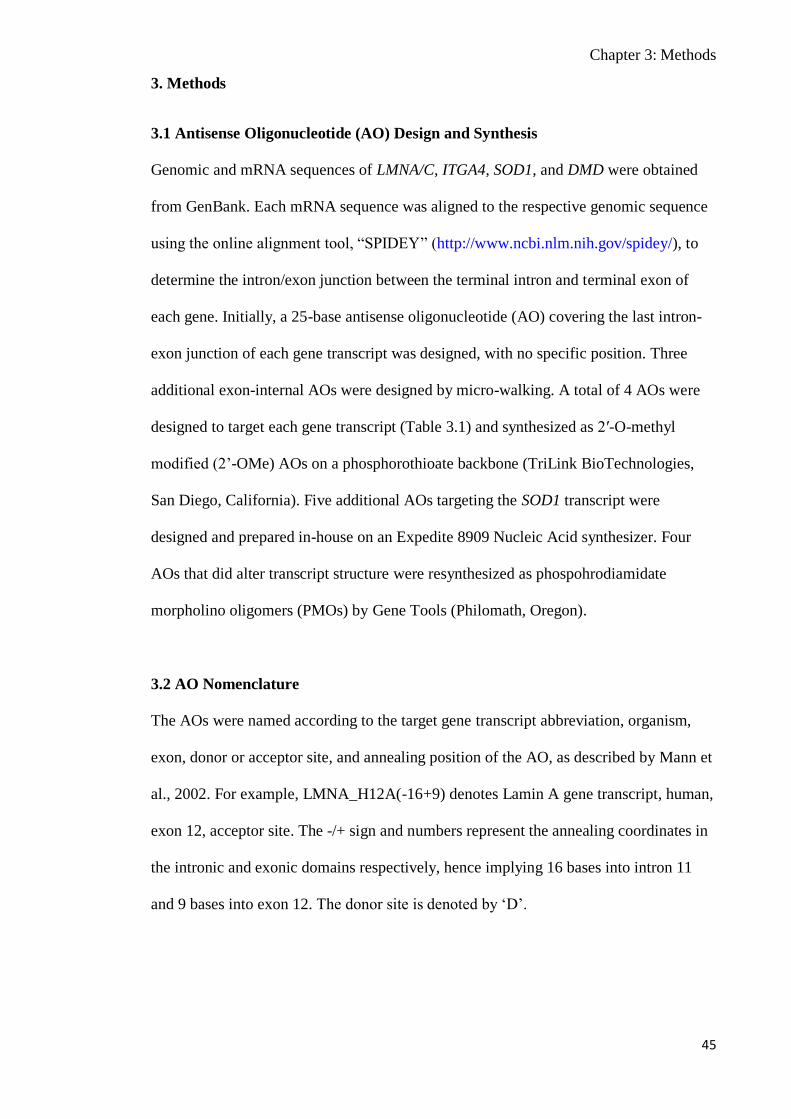
Chapter 3: Methods
45
3. Methods
3.1 Antisense Oligonucleotide (AO) Design and Synthesis
Genomic and mRNA sequences of LMNA/C, ITGA4, SOD1, and DMD were obtained
from GenBank. Each mRNA sequence was aligned to the respective genomic sequence
using the online alignment tool, “SPIDEY” (http://www.ncbi.nlm.nih.gov/spidey/), to
determine the intron/exon junction between the terminal intron and terminal exon of
each gene. Initially, a 25-base antisense oligonucleotide (AO) covering the last intron-
exon junction of each gene transcript was designed, with no specific position. Three
additional exon-internal AOs were designed by micro-walking. A total of 4 AOs were
designed to target each gene transcript (Table 3.1) and synthesized as 2′-O-methyl
modified (2’-OMe) AOs on a phosphorothioate backbone (TriLink BioTechnologies,
San Diego, California). Five additional AOs targeting the SOD1 transcript were
designed and prepared in-house on an Expedite 8909 Nucleic Acid synthesizer. Four
AOs that did alter transcript structure were resynthesized as phospohrodiamidate
morpholino oligomers (PMOs) by Gene Tools (Philomath, Oregon).
3.2 AO Nomenclature
The AOs were named according to the target gene transcript abbreviation, organism,
exon, donor or acceptor site, and annealing position of the AO, as described by Mann et
al., 2002. For example, LMNA_H12A(-16+9) denotes Lamin A gene transcript, human,
exon 12, acceptor site. The -/+ sign and numbers represent the annealing coordinates in
the intronic and exonic domains respectively, hence implying 16 bases into intron 11
and 9 bases into exon 12. The donor site is denoted by ‘D’.

Chapter 3: Methods
46
Table 3.1 Sequences of 2'-OMeAOs used in the project. All AOs target either the terminal splice site or terminal exon.
Name Sequence (5' to 3')
LMNA _H12A(-16+9) CUGGGGGCUCUAAGAGAGAAAACAG
LMNA_H12A(+10+34) UCCCAGAUUACAUGAUGCUGCAGUU
LMNA_H12A(+35+59) UCCACCCCCACCCCUGCCUGGCAGG
LMNA_H12A(+60+84) UGAGGUGAGGAGGACGCAGGAAGCC
LMNC_H10A(-10+15)1 GCGCAUGGCCACUUCCUGGUGGGGA
LMNC_H10A(+16+40)1 # CCACAGUCACUGAGCGCACCAGCUU
LMNC_H10A(+41+65)1 # CCAUCCUCAUCCUCGUCGUCCUCAA
LMNC_H10A(+66+90)1 GUGGUGGUGAUGGAGCAGGUCAUCU
ITGA4_H28A(-6+19) # GUCUUUUAAAGAAGCCAGCCUGAAA
ITGA4_H28A(+20+44) # UCUUCUUGUAGGAUAGAUUUGUAUU
ITGA4_H28A(+45+69) AUAACUCCAACUGUCUCUUCUGUUU
ITGA4_H28A(+70+94) AAUCAUCAUUGCUUUUACUGUUGAU
DMD_H79A(-9+16) CUUCCUACAUUGUGUCCUGGAAAAC
DMD_H79A(+17+41) CAAAUCAUCUGCCAUGUGGAAAAGA
DMD_H79A(+42+66) AUACUAAGGACUCCAUCGCUCUGCC
DMD_H79A(+67+91) GCUCCUUCUUCAUCUGUCAUGACUG
SOD1_H5A(-5+20) UCAUCUGCUUUUUCAUGGACCUGUA
SOD1_H5A(+21+45) UUCUUCAUUUCCACCUUUGCCCAAG
SOD1_H5A(+46+70) UUCCAGCGUUUCCUGUCUUUGUACU
SOD1_H5A(+71+95) CCAAUUACACCACAAGCCAAACGAC
SOD1_H5A(+14+38)* UUUCCACCUUUGCCCAAGUCAUCUG
SOD1_H5A(+18+42)* UUCAUUUCCACCUUUGCCCAAGUCA
SOD1_H5A(+24+48)* ACUUUCUUCAUUUCCACCUUUGCCC
SOD1_H4D(+99-5)* CUUACCACCAGUGUGCGGCCAAUGA
SOD1_H4D(+108-14)* UUAUGAAAACUUACCACCAGUGUGC
SMN_H8A(-10+15) CUAUGCCAGCAUUUCCUGCAAAUGA
SMN_H8A(+57+81) CUUCUAUAACGCUUCACAUUCCAGA 1AO sequences are also present within LMNA transcripts #Resynthesized as PMOs
*Synthesized using Expedite 8909 Nucleic Acid synthesizer
Chapter 3: Methods
47
3.3 Purification of AOs
The 2’-OMeAOs were purified by desalting. To desalt, the powdered 2’-OMeAOs were
first dissolved in 1ml molecular grade water (Sigma-Aldrich, Sydney, Australia) and
then flushed through Illustra NAP-10 Columns prepacked with Sephadex G-25, DNA
Grade (GE Healthcare Life Sciences, Sydney, Australia). The AOs were eluted in water
and the concentrations determined using ND-1000 Spectrophotometer (NanoDrop
Technologies, Wilmington, Delaware).
3.4 PCR Primer Design and Reconstitution
Forward and reverse primers for each gene transcript were designed using PrimerBlast
(http://www.ncbi.nlm.nih.gov/tools/primer-blast/). The primers were synthesized by
GeneWorks (Adelaide, Australia) and the sequences are shown in Table 3.2. The
primers were first dissolved in molecular grade water (Sigma-Aldrich, Sydney,
Australia) and the concentrations determined using ND-1000 Spectrophotometer
(NanoDrop Technologies, Wilmington, Delaware). Primers were then diluted and
dispensed into 50ng/µl aliquots.
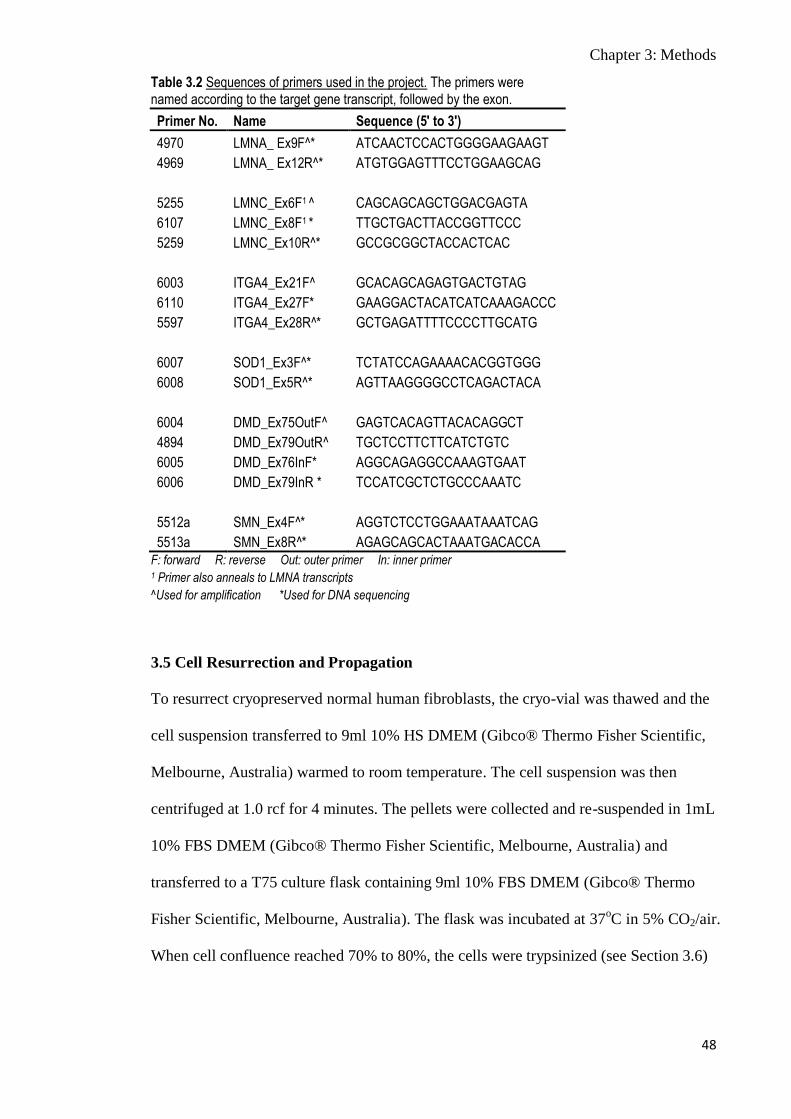
Chapter 3: Methods
48
Table 3.2 Sequences of primers used in the project. The primers were named according to the target gene transcript, followed by the exon.
Primer No. Name Sequence (5' to 3')
4970 LMNA_ Ex9F^* ATCAACTCCACTGGGGAAGAAGT
4969 LMNA_ Ex12R^* ATGTGGAGTTTCCTGGAAGCAG
5255 LMNC_Ex6F1 ^ CAGCAGCAGCTGGACGAGTA
6107 LMNC_Ex8F1 * TTGCTGACTTACCGGTTCCC
5259 LMNC_Ex10R^* GCCGCGGCTACCACTCAC
6003 ITGA4_Ex21F^ GCACAGCAGAGTGACTGTAG
6110 ITGA4_Ex27F* GAAGGACTACATCATCAAAGACCC
5597 ITGA4_Ex28R^* GCTGAGATTTTCCCCTTGCATG
6007 SOD1_Ex3F^* TCTATCCAGAAAACACGGTGGG
6008 SOD1_Ex5R^* AGTTAAGGGGCCTCAGACTACA
6004 DMD_Ex75OutF^ GAGTCACAGTTACACAGGCT
4894 DMD_Ex79OutR^ TGCTCCTTCTTCATCTGTC
6005 DMD_Ex76InF* AGGCAGAGGCCAAAGTGAAT
6006 DMD_Ex79InR * TCCATCGCTCTGCCCAAATC
5512a SMN_Ex4F^* AGGTCTCCTGGAAATAAATCAG
5513a SMN_Ex8R^* AGAGCAGCACTAAATGACACCA
F: forward R: reverse Out: outer primer In: inner primer 1 Primer also anneals to LMNA transcripts
^Used for amplification *Used for DNA sequencing
3.5 Cell Resurrection and Propagation
To resurrect cryopreserved normal human fibroblasts, the cryo-vial was thawed and the
cell suspension transferred to 9ml 10% HS DMEM (Gibco® Thermo Fisher Scientific,
Melbourne, Australia) warmed to room temperature. The cell suspension was then
centrifuged at 1.0 rcf for 4 minutes. The pellets were collected and re-suspended in 1mL
10% FBS DMEM (Gibco® Thermo Fisher Scientific, Melbourne, Australia) and
transferred to a T75 culture flask containing 9ml 10% FBS DMEM (Gibco® Thermo
Fisher Scientific, Melbourne, Australia). The flask was incubated at 37oC in 5% CO2/air.
When cell confluence reached 70% to 80%, the cells were trypsinized (see Section 3.6)
Chapter 3: Methods
49
and transferred to a T175 flask in 20mL 10% FBS DMEM (Gibco® Thermo Fisher
Scientific, Melbourne, Australia) for further propagation.
As the full length DMD isoform is expressed in muscle cells, experiments on retaining
terminal intron in DMD transcripts were also conducted in primary human myoblasts.
Using both fibroblasts and myoblasts also allowed comparative analysis of splice-
switching in different cell types. Muscle samples were provided by Royal Perth
Hospital and primary human myoblasts were prepared as described by Rando and Blau
(prepared by Kane Greer). The purified myoblasts were allowed to propagate in 20%
FBS Ham’s F10 (Gibco® Thermo Fisher Scientific, Melbourne, Australia)
supplemented with 0.5% chick embryo extract (US Biological Life Sciences, Salem,
Massachusetts).
3.6 Cell Passage
When the fibroblasts reached 70-80% confluence, they were seeded into 24-well plates
for subsequent transfection. Cell culture media was aspirated from the culture flask and
approximately 10ml phosphate buffered saline (PBS) was used to wash the flask and
was aspirated. Six ml 1X trypsin in PBS was then added to the flask and incubated at
37oC for approximately 1 minute. Following incubation, the flasks were checked under
the microscope to ensure that the cells were dislodged from the flask surface. The
trypsin was inactivated by the immediate addition of 14ml 10% HS DMEM (Gibco®
Thermo Fisher Scientific, Melbourne, Australia). The cells were transferred to a
centrifuge tube and centrifuged at 1.0 rcf for 4 minutes. The supernatant was aspirated
and cell pellets were re-suspended in 1ml 10% FBS DMEM (Gibco® Thermo Fisher
Scientific, Melbourne, Australia). To determine the volume of cells required for
distribution into 24 well plates, the cells were counted after dilution (1:10) in 0.4%
Chapter 3: Methods
50
trypan blue solution (Sigma-Aldrich, Sydney, Australia). Each well was seeded with
15,000 fibroblasts in 500µl 10% FBS DMEM media (Gibco® Thermo Fisher Scientific,
Melbourne, Australia). The plates were then incubated at 37oC in 5% CO2/air for one
day before transfection.
Prior to seeding primary myoblasts into 24-well plates for transfection, the plates were
treated with 200µl 50mg/ml poly-D-lysine (Sigma-Aldrich, Sydney, Australia) for one
hour at room temperature. The poly-D-lysine solution was then aspirated and replaced
with 200µl of MatrigelTM
(In Vitro Technologies, Melbourne, Australia) and incubated
at 37oC for one hour. The myoblasts were harvested from the flasks by trypsinzation as
above, and then re-suspended in 1ml 5% HS DMEM (Gibco® Thermo Fisher Scientific,
Melbourne, Australia) and counted as above. A total of 2.75x10⁴ cells in 500µl 5% HS
DMEM (Gibco® Thermo Fisher Scientific, Melbourne, Australia) was seeded into each
well and the plates were then incubated at 37oC in 5% CO2/air for 3 days before
transfection.
3.7 Cell Transfection
3.7.1 2’-O-methyl-antisense Oligonucleotides (2’-OMeAOs)
3.7.1.1 Lipofectin® as vehicle
The 24-well plates were examined under the microscope to check cell quality and when
the cells reached a confluence of 50% to 60%, they were transfected with the AOs. To
enhance cellular uptake of the AO, the LMNA/C, ITGA4 and SOD1 2’-OMeAOs were
conjugated with Lipofectin® transfection reagent (Invitrogen® Thermo Fisher
Scientific, Melbourne, Australia) to form a cationic lipoplex at a previously optimized
ratio of 1:2 2’-OMeAO:Lipofectin® (w/v) (Mann et. al., 2001). The 2’-OMeAO was
prepared at a final concentration of 400nM in 1ml 1% FBS DMEM (Gibco® Thermo
Chapter 3: Methods
51
Fisher Scientific, Melbourne, Australia). Firstly, Lipofectin® was diluted in DMEM
(Gibco® Thermo Fisher Scientific, Melbourne, Australia) to a total volume of 200µl
and incubated at room temperature for 10 minutes. After incubation, 2’-OMeAO was
added and this was followed by 20 minutes incubation at room temperature. A serial
dilution of the AO:lipoplex was prepared to yield AO concentrations at 200nM, 100nM,
and 50nM for each AO. Transfection with the positive control 2’-OMeAO was only
carried out at 100nM. The lipoplex mixture was diluted to 1ml with 1% FBS DMEM
(Gibco® Thermo Fisher Scientific, Melbourne, Australia). The media was then
aspirated from the cells in 24-well plates and each concentration of lipoplex mixture
was added to 2 wells, 500µl per well. The cells were incubated for 48 hours, at 37oC in
an incubator supplying 5% CO2/air.
3.7.1.2 Lipofectamine® 2000 as vehicle
Transfection of myoblasts with DMD transcript targeting 2’-OMeAOs was done using
Lipofectamine® 2000 transfection reagent (L2K; Invitrogen® Thermo Fisher Scientific,
Melbourne, Australia), at a 1:1, 2’-OMeAO:L2K (w/v) ratio. As for transfection using
Lipofectin®, the amount of 2’-OMeAO used in myoblast transfection was calculated to
yield a final concentration of 400nM in 1ml serum free media. Firstly, L2K and
2’OMeAO were separately diluted in Opti-MEM (Gibco® Thermo Fisher Scientific,
Melbourne, Australia), in a final volume of 100µl, and incubated at room temperature
for 5 minutes. Following the incubation, the diluted L2K and 2’-OMeAO were mixed
and incubated at room temperature for 20 minutes. Transfection mixtures with AO
concentrations of 200nM, 100nM, and 50nM for each 2’-OMeAO were prepared by
serial dilution whereas the positive control 2’-OMeAO was only transfected at 100nM.
Media was aspirated from the 24-well plates, and each transfection mix were added to
Chapter 3: Methods
52
duplicate wells, 500µl per well. The plates were then incubated for 24 hours at 37oC in
an incubator supplying 5% CO2/air.
3.7.1.3 Lipofectamine® 3000 as vehicle
As a comparative analysis, transfection using Lipofectamine® 3000 (L3K; Invitrogen®
Thermo Fisher Scientific, Melbourne, Australia) was initially carried out for two target
gene transcripts showed positive induced terminal intron retention. Firstly, each of the
2’-OMeAOs was diluted in 50µl of DMEM (Gibco® Thermo Fisher Scientific,
Melbourne, Australia). Except for the positive control 2’-OMeAO, the amount of 2’-
OMeAO used was calculated to give a final concentration of 400nM in 1ml media. As
above, serial dilutions of the test AOs were prepared to yield 2’-OMeAO lipolexes at
200nM, 100nM, and 50nM whereas the positive control 2’-OMeAO was used at 100nM.
Next, 3µl of L3K diluted in DMEM (Gibco® Thermo Fisher Scientific, Melbourne,
Australia) to a volume of 25µl, was added to each of the diluted 2’-OMeAOs and
incubated for 5 minutes at room temperature. Following incubation, 1% FBS DMEM
(Gibco® Thermo Fisher Scientific, Melbourne, Australia) was added to a final total
volume of 1ml. Finally, the media was aspirated from the 24-well plates, and each
concentration of transfection mixtures was added to duplicate wells, 500µl per well and
the cells were incubated for 48 hours at 37oC in an incubator supplying 5% CO2/air.
Due to a high level of cell death at the higher concentrations of 2’-OMeAO (50-200nM),
transfection using L3K was subsequently carried out at lower concentrations (50nM,
25nM, 12.5nM) and at two time points (24h and 48h). Each of the 2’-OMeAOs,
including the positive control 2’-OMeAO, was diluted in 50µl of DMEM (Gibco®
Thermo Fisher Scientific, Melbourne, Australia) to a final concentration of 100nM in
1ml media. The 50nM, 25nM, and 12.5nM 2’-OMeAOs were prepared by serial
Chapter 3: Methods
53
dilution, whereas the positive control 2’-OMeAO was diluted to 50nM and 25nM
concentrations. As above, the diluted L3K was added to the diluted 2’-OMeAOs that
were then diluted to 1ml with 1% FBS DMEM (Gibco® Thermo Fisher Scientific,
Melbourne, Australia), and added to the cells. The cells were then incubated for 24 and
48 hours at 37oC in an incubator supplying 5% CO2/air.
3.7.2 Phosphorodiamidate Morpholino Oligomers (PMOs)
The PMOs and a scrambled sequence control (5'-CCT CTT ACC TCA GTT ACA ATT
TAT A 3') purchased from Gene Tools (Philomath, Oregon) were reconstituted using
molecular grade water (Sigma-Aldrich, Sydney, Australia), to prepare a 1000µM stock
solution. The PMOs were first tested in naked transfection to assess transfection
efficiency and determine if enhanced transfection would be required. A day prior to
transfection, cells were seeded into 24-well plates (see Section 3.6). On the day of
transfection, the media was aspirated from the wells and 500µl 1% FBS DMEM
(Gibco® Thermo Fisher Scientific, Melbourne, Australia) was added to each well. For
naked transfection, a 400µM PMO working stock was prepared and added to duplicate
wells at three concentrations (20µM, 10µM and 5µM) for each PMO. The cells were
incubated over 7 days, and each well was topped up with 100µl of 20% FBS DMEM
(Gibco® Thermo Fisher Scientific, Melbourne, Australia) on day 4.
PMOs were also transfected by annealing to a DNA leash and forming a complex with
Lipofectin® transfection reagent (Thermo Fisher Scientific, Melbourne, Australia).
Complementary leashes were designed for each PMO (Table 3.3) and were synthesized
as DNA sequences by GeneWorks (Adelaide, Australia). A working stock of 50µM of
PMO-leash mix was prepared by mixing 50µM PMO, 50µM leash, and 4 X PBS
(diluted from 10 X PBS) in a final volume of 25µl. The PMO and leash were annealed

Chapter 3: Methods
54
using a gradient protocol: 95oC for 10min, 85
oC for 1min, 75
oC for 1min, 65
oC for 5min,
55oC for 1min, 45
oC for 1min, 35
oC for 5min, 25
oC for 1min, 15
oC for 1min. The PMO-
leash was then used to form a complex with Lipofectin® at a 1:2 ratio
(leash:Lipofectin®, w/w). Transfection was carried out in the same way as for 2’-
OMeAOs (see Section 3.7.1.1), except that the amount of PMO-leash complex was
prepared at a final concentration of 800nM in 1ml media, and then diluted as before to
yield transfection mixtures with PMO-leash concentrations of at 400nM, 200nM, and
100nM. Lipoplex/PMO transfection was carried out for 72 hours at 37oC in an incubator
supplied with 5% CO2/air.
Table 3.3 Sequences of PMOs and leashes used in PMO lipoplex transfections.
Name PMO sequence (5’ to 3’) Leash sequence (5' to 3')
LMNC_H10A(+16+40) CCACAGTCACTGAGCGCACCAGCTT AAGCTGGTGCGCTCAGTGACTGTGG
LMNC_H10A(+41+65) CCATCCTCATCCTCGTCGTCCTCAA TTGAGGACGACGAGGATGAGGATGG
ITGA4_H28A(-6+19) GTCTTTTAAAGAAGCCAGCCTGAAA TTTCAGGCTGGCTTCTTTAAAAGAC
ITGA4_H28A(+20+44) TCTTCTTGTAGGATAGATTTGTATT AATACAAATCTATCCTACAAGAAGA
SMN_H8A(-10+15) CTATGCCAGCATTTCCTGCAAATGA TCATTTGCAGGAAATGCTGGCATAG
Scrambled control CCTCTTACCTCAGTTACAATTTATA TATAAATTGTAACTGAGGTAAGAGG
3.8 RNA Analysis
3.8.1 Total RNA Extraction
Following transfection, total RNA was isolated using Tri-reagent (Zymo Research,
Irvine, California) and purified using Direct-zolTM
RNA MiniPrep kit (Zymo Research,
Irvine, California; protocol ver 1.1.0). Slight changes made to the manufacturer’s
protocol include centrifuging at 12 000rcf for all steps, using 800µl RNA prewash and
centrifuging for 2 minutes in the prewash step, and using 30µl molecular grade water
(Sigma-Aldrich, Sydney, Australia) for elution. cDNAs were then synthesized and
amplified using either one-step or two-step RT-PCR, as indicated below.
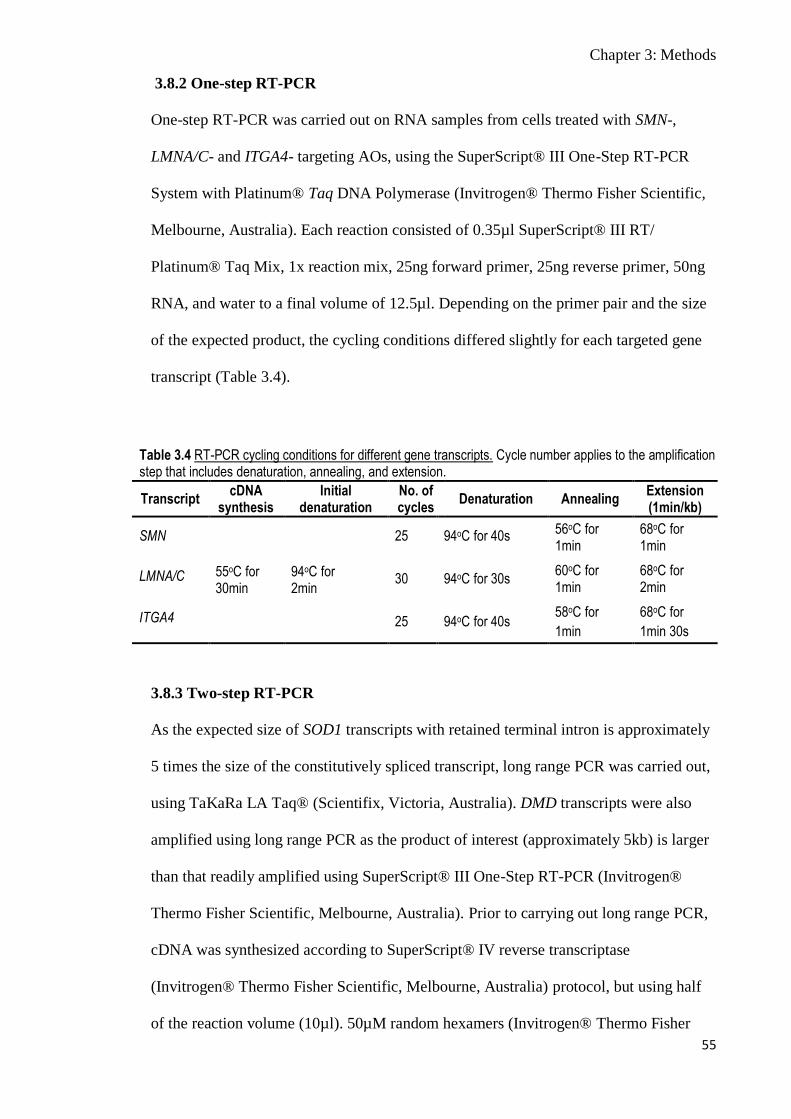
Chapter 3: Methods
55
3.8.2 One-step RT-PCR
One-step RT-PCR was carried out on RNA samples from cells treated with SMN-,
LMNA/C- and ITGA4- targeting AOs, using the SuperScript® III One-Step RT-PCR
System with Platinum® Taq DNA Polymerase (Invitrogen® Thermo Fisher Scientific,
Melbourne, Australia). Each reaction consisted of 0.35µl SuperScript® III RT/
Platinum® Taq Mix, 1x reaction mix, 25ng forward primer, 25ng reverse primer, 50ng
RNA, and water to a final volume of 12.5µl. Depending on the primer pair and the size
of the expected product, the cycling conditions differed slightly for each targeted gene
transcript (Table 3.4).
Table 3.4 RT-PCR cycling conditions for different gene transcripts. Cycle number applies to the amplification step that includes denaturation, annealing, and extension.
Transcript cDNA
synthesis Initial
denaturation No. of cycles
Denaturation Annealing Extension (1min/kb)
SMN
55oC for 30min
94oC for 2min
25 94oC for 40s 56oC for 1min
68oC for 1min
LMNA/C 30 94oC for 30s 60oC for 1min
68oC for 2min
ITGA4 25 94oC for 40s 58oC for
1min
68oC for
1min 30s
3.8.3 Two-step RT-PCR
As the expected size of SOD1 transcripts with retained terminal intron is approximately
5 times the size of the constitutively spliced transcript, long range PCR was carried out,
using TaKaRa LA Taq® (Scientifix, Victoria, Australia). DMD transcripts were also
amplified using long range PCR as the product of interest (approximately 5kb) is larger
than that readily amplified using SuperScript® III One-Step RT-PCR (Invitrogen®
Thermo Fisher Scientific, Melbourne, Australia). Prior to carrying out long range PCR,
cDNA was synthesized according to SuperScript® IV reverse transcriptase
(Invitrogen® Thermo Fisher Scientific, Melbourne, Australia) protocol, but using half
of the reaction volume (10µl). 50µM random hexamers (Invitrogen® Thermo Fisher
Chapter 3: Methods
56
Scientific, Melbourne, Australia) was used as the primer, and 5µl of RNA sample with
the lowest concentration in each experiment was set as the amount of template RNA to
use for each reaction, where approximately 100ng of RNA from fibroblasts and 200ng
of RNA from myoblasts were used.
The synthesized cDNAs were then used in TaKaRa LA Taq® long range PCR. Each
12.5µl PCR reaction contained 1X LA buffer (Mg2+
plus), 0.625U LA Taq DNA
polymerase, 5nmol dNTP mixture, 12.5ng forward primer, 12.5ng reverse primer, 1µl
cDNA, and water. Long range PCR was programmed with initial denaturation at 94oC
for 1min, followed by 35 cycles of denaturation at 94oC for 30s, annealing at 58
oC for
30s, and extension at 72oC, 1min/kb. The extension time for amplification of SOD1 and
DMD transcripts was 2 and 6 minutes, respectively.
3.9 Gel Electrophoresis and Product Analysis
Except for DMD amplicons, all PCR products were fractionated on 2% agarose gel with
1x TAE gels at 100V. Amplified DMD cDNA were fractionated on 1% agarose gel with
1x TAE gel at 60V. All gel images were captured using the Vilber Lourmat Fusion-FX
gel documentation system (Marne-la Valle, France).
3.9.1 Product Isolation and DNA Sequencing
Amplification products of interest were re-fractionated on 2% agarose gel with 1x TAE
buffer and stained with ethidium bromide. The gel was visualised using a
transilluminator and bands were either stabbed using a P200 tip, or excised with a
scalpel. Generally, bands with sizes corresponding to those of intron-less transcripts
were stabbed, while bands of larger sizes were excised. Following stabbing, the P200
Chapter 3: Methods
57
tip was inoculated into a reaction mix that consisted of 1x GeneAmp® PCR Gold
Buffer (Thermo Fisher Scientific, Melbourne, Australia), 0.25µmol dNTPs, 5µmol
MgCl2, 37.5ng forward and reverse primers each, 1U AmpliTaq gold (Thermo Fisher
Scientific, Melbourne, Australia), and water (50µl in total). The cycling conditions were:
initial denaturation at 94oC for 6min, followed by 30 cycles of denaturation at 94
oC for
30s, annealing at 5oC less than the original annealing temperature, for 1min, and
extension at 72oC for 2min, followed by holding at 25
oC. The reamplified products were
re-examined on agarose gels to check that the bands of interest were amplified, before
being purified using Diffinity RapidTip® (Diffinity Genomics, Henrietta, New York) as
described by the manufacturer. For samples with multiple PCR products, a clean DNA
could not be isolated from the larger bands using band stab method. Therefore, DNA
from PCR products with sizes greater than the smallest sized band were extracted and
purified for DNA sequencing using the band excision method. Agarose gel stained with
ethidium bromide was visualised using a transilluminator and bands of interest were
excised using a scalpel. DNA was extracted and purified using Macherey-Nagel
NucleoSpin® Gel & PCR Clean-up kit (Scientifix, Victoria, Australia), according to the
manufacturer’s protocol.
Purified DNA was prepared for sequencing by the Australian Genome Research Facility
Ltd (AGRF) in 12µl sequencing reaction. Each sequencing reaction consisting of
approximately 19.2pmol forward or reverse primer, purified DNA in the amount
recommended by AGRF (www.agrf.org.au) and water.

Chapter 3: Methods
58
3.9.2 Semi-quantitative Analysis
Optical densities (ODs) of RT-PCR products were determined using the Vilber Lourmat
Fusion-FX gel documentation system (Marne-la Valle, France) and BIO1D software
(Vilber Lourmat, Marne-la Valle, France). The data were then presented in graphs
prepared using Excel (Microsoft). The proportions of terminal intron-retaining and full-
length transcripts were generated by the following formula:
𝑂𝐷𝑇𝐼𝑅/𝐹𝐿/𝑈𝑛𝑖𝑑𝑒𝑛𝑡𝑖𝑓𝑖𝑒𝑑
𝑂𝐷𝑡𝑜𝑡𝑎𝑙
The ratios of full-length transcripts were generated by using the following formula:
ODFL target transcript (treated OR untreated)× ODFL 𝑆𝑀𝑁 (treated OR untreated)
ODFL 𝑆𝑀𝑁 (untreated)⁄
ODFL target transcript (untreated)
Statistical analyses were done using R statistical software (downloaded online).

Chapter 4: Results
59
4. Results
4.1 SMN-AOs Induced Terminal Intron Retention
As proof-of-concept that terminal intron retention is inducible, and can alter expression
of a human gene transcript using antisense oligonucleotides (AO), two 2’-O-methyl
antisense oligonucleotides (2’-OMeAOs) on a phosphorothioate backbone known to
induce terminal intron retention in human SMN gene transcripts (Price, personal
communication) were evaluated for use as a positive control. One of the AOs targets the
last acceptor splice site (SMN_H8A(-10+15)), while the other targets a region within
the terminal SMN exon (SMN_H8A(+57+81)). Normal human fibroblasts were
transfected with both AOs as cationic lipoplexes at 200nM, 100nM, and 50nM. RNA
extracted from the transfected fibroblasts was then amplified via RT-PCR using SMN
primer pair (5512a+5513a) (Figure 4.1A). SMN RT-PCR products without the terminal
intron (intron 7) are 404bp, while those with retained intron 7 are 848bp. The 848bp
products are present in greater abundance in treated samples than in the untreated,
confirming that both AOs were able to induce terminal intron retention in SMN
transcripts at all concentrations tested (Figure 4.2). Since terminal intron retention is
inducible at all three concentrations tested, the middle AO concentration (100nM) was
chosen as the concentration of the positive control 2’-OMeAO for subsequent
transfections.
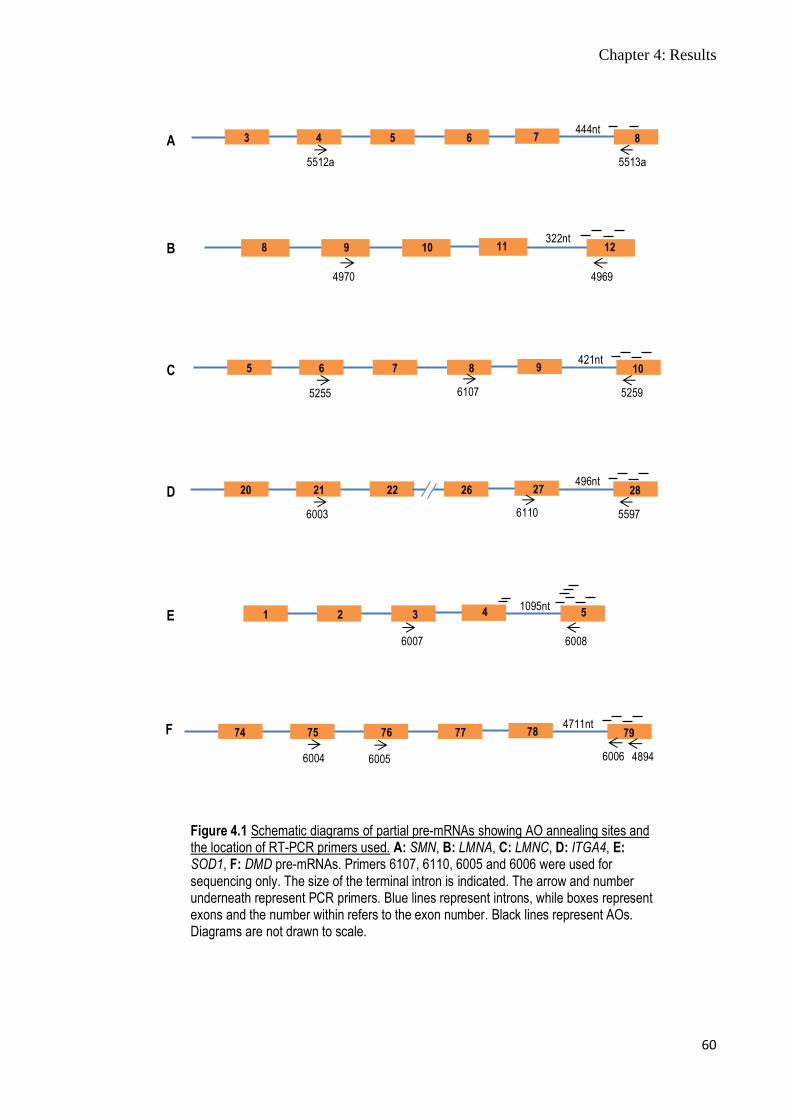
Chapter 4: Results
60
8 7 6 5 4 444nt
3
5512a 5513a
Figure 4.1 Schematic diagrams of partial pre-mRNAs showing AO annealing sites and the location of RT-PCR primers used. A: SMN, B: LMNA, C: LMNC, D: ITGA4, E: SOD1, F: DMD pre-mRNAs. Primers 6107, 6110, 6005 and 6006 were used for sequencing only. The size of the terminal intron is indicated. The arrow and number underneath represent PCR primers. Blue lines represent introns, while boxes represent exons and the number within refers to the exon number. Black lines represent AOs. Diagrams are not drawn to scale.
322nt 12 11 10 9 8
4970 4969
10 9 8 7 6 421nt
5
5255 5259 6107
28 27 26 22 21 496nt
20
6003 5597 6110
1095nt 5 4 3 2 1
6007 6008
79 78 77 76 75 4711nt
74
6004 4894 6005 6006
A
B
F
E
D
C

Chapter 4: Results
61
Figure 4.2 SMN RT-PCR products amplified from normal human fibroblasts transfected with SMN_8A(+57+81) and SMN_8A(-10+15), using SMN primer pair (5512a+5513a). -ve: PCR negative control
UT: untreated TIR: transcripts with terminal intron retained FL: full-length transcripts (terminal intron excised)
100b
p la
dder
100b
p la
dder
200n
M
100n
M
50nM
200n
M
100n
M
50nM
SMN TIR
(848bp)
SMN FL (404bp)
-ve
It was speculated that transfection with an AO cocktail composed of an AO blocking
the donor splice site and an AO that causes intron retention, could enhance the intron
retention effect. Transfection was carried out using two SMN-targeting AO cocktail,
consisting of the AO that targets the donor splice site of the terminal intron
(SMN_H7D(+17-13)) and a terminal intron retention inducing AO, SMN_H8A(+57+81)
or SMN_H8A(-10+15). RT-PCR analysis shows that the addition of SMN_H7D(+17-13)
does not have a synergistic effect on terminal intron retention (Figure 4.3). In fact, there
was a decrease in the amount of mRNA transcripts with retained terminal intron
compared to when SMN_H8A(+57+81) or SMN_H8A(-10+15) was used alone (Figure
4.2). As SMN_H7D(+17-13) can induce SMN exon 7 skipping, there was also an
expected increase in transcripts missing SMN exon 7 (Figure 4.3).
UT
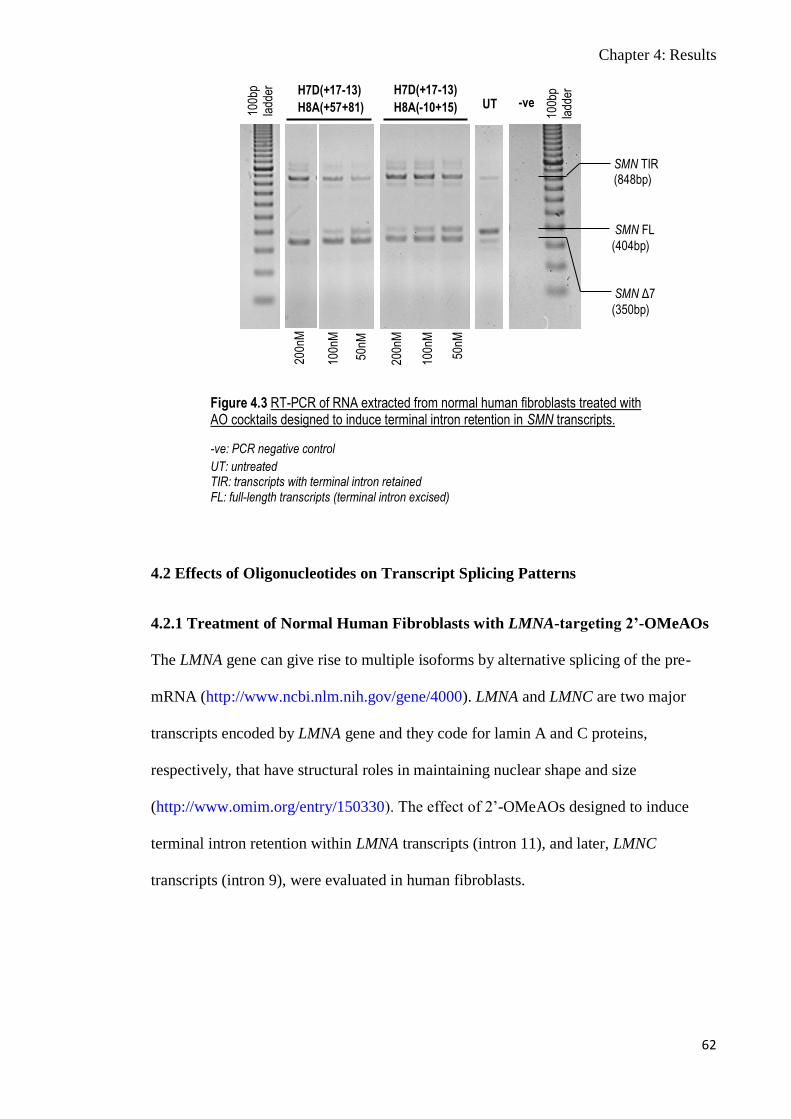
Chapter 4: Results
62
100b
p la
dder
200n
M
100n
M
50nM
200n
M
100n
M
50nM
Figure 4.3 RT-PCR of RNA extracted from normal human fibroblasts treated with AO cocktails designed to induce terminal intron retention in SMN transcripts.
-ve: PCR negative control
UT: untreated TIR: transcripts with terminal intron retained FL: full-length transcripts (terminal intron excised)
H7D(+17-13)
H8A(+57+81)
H7D(+17-13)
H8A(-10+15)
SMN TIR (848bp)
SMN FL
(404bp)
SMN Δ7
(350bp)
UT
100b
p la
dder
-ve
4.2 Effects of Oligonucleotides on Transcript Splicing Patterns
4.2.1 Treatment of Normal Human Fibroblasts with LMNA-targeting 2’-OMeAOs
The LMNA gene can give rise to multiple isoforms by alternative splicing of the pre-
mRNA (http://www.ncbi.nlm.nih.gov/gene/4000). LMNA and LMNC are two major
transcripts encoded by LMNA gene and they code for lamin A and C proteins,
respectively, that have structural roles in maintaining nuclear shape and size
(http://www.omim.org/entry/150330). The effect of 2’-OMeAOs designed to induce
terminal intron retention within LMNA transcripts (intron 11), and later, LMNC
transcripts (intron 9), were evaluated in human fibroblasts.
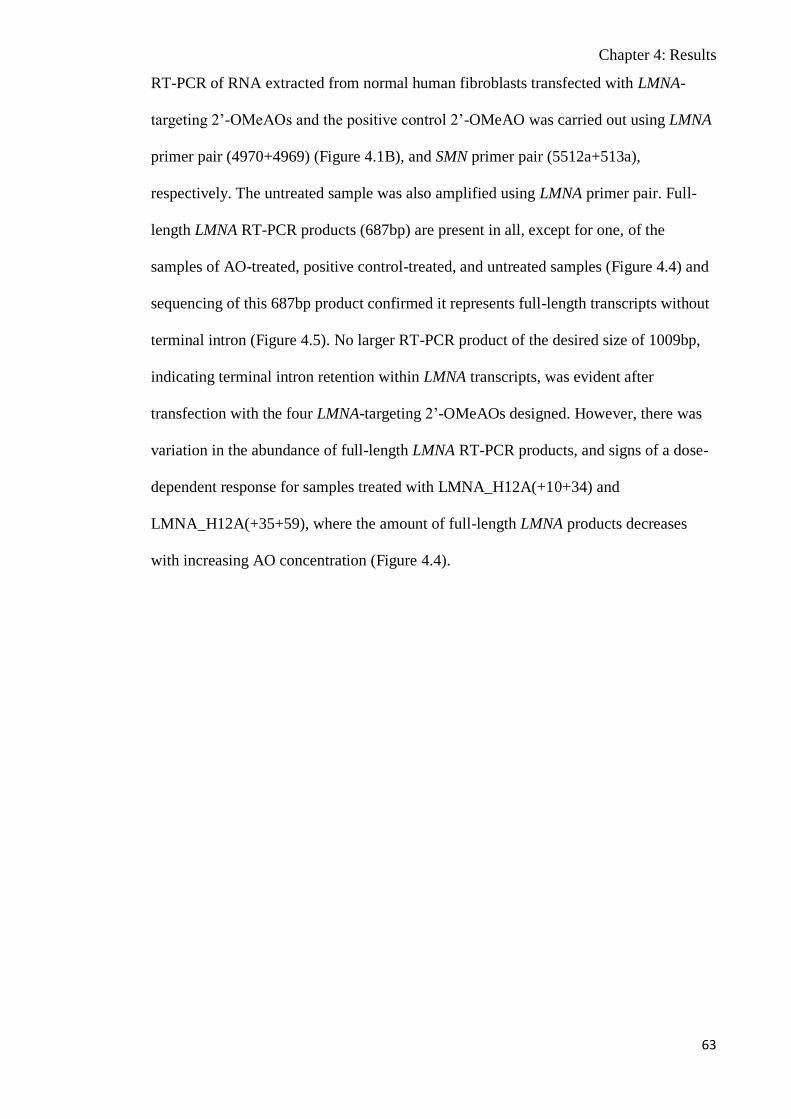
Chapter 4: Results
63
RT-PCR of RNA extracted from normal human fibroblasts transfected with LMNA-
targeting 2’-OMeAOs and the positive control 2’-OMeAO was carried out using LMNA
primer pair (4970+4969) (Figure 4.1B), and SMN primer pair (5512a+513a),
respectively. The untreated sample was also amplified using LMNA primer pair. Full-
length LMNA RT-PCR products (687bp) are present in all, except for one, of the
samples of AO-treated, positive control-treated, and untreated samples (Figure 4.4) and
sequencing of this 687bp product confirmed it represents full-length transcripts without
terminal intron (Figure 4.5). No larger RT-PCR product of the desired size of 1009bp,
indicating terminal intron retention within LMNA transcripts, was evident after
transfection with the four LMNA-targeting 2’-OMeAOs designed. However, there was
variation in the abundance of full-length LMNA RT-PCR products, and signs of a dose-
dependent response for samples treated with LMNA_H12A(+10+34) and
LMNA_H12A(+35+59), where the amount of full-length LMNA products decreases
with increasing AO concentration (Figure 4.4).
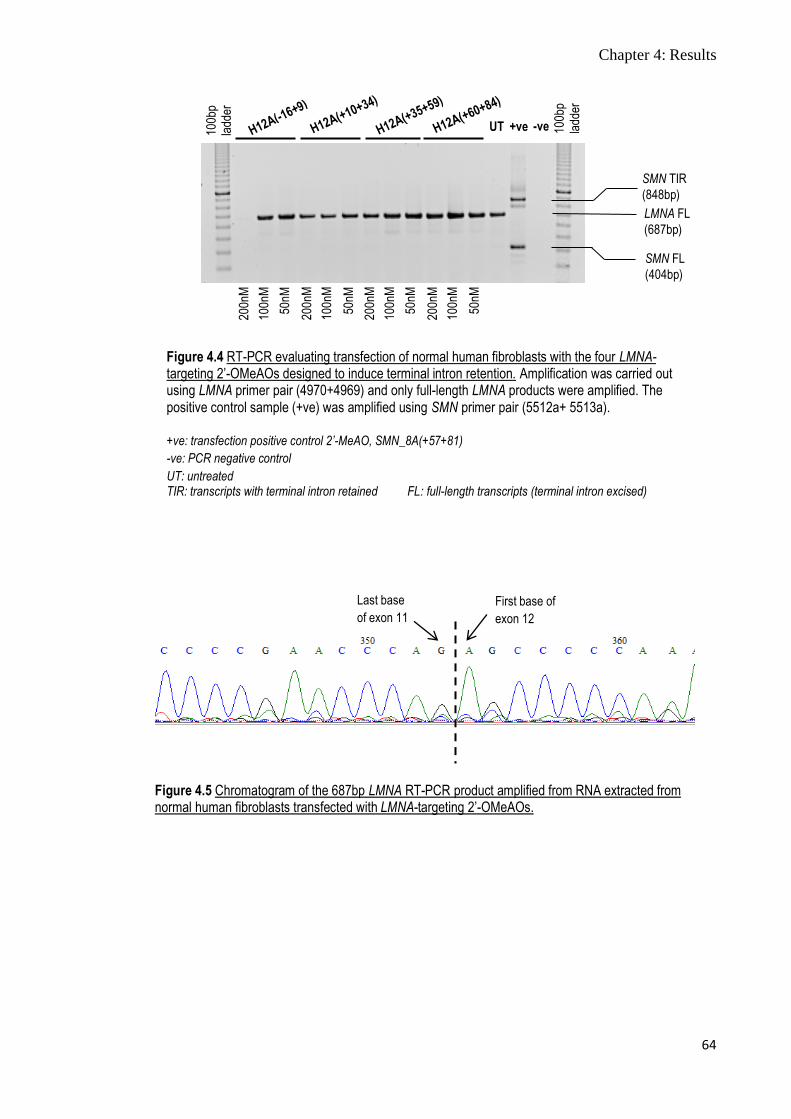
Chapter 4: Results
64
Last base
of exon 11
First base of
exon 12
Figure 4.5 Chromatogram of the 687bp LMNA RT-PCR product amplified from RNA extracted from normal human fibroblasts transfected with LMNA-targeting 2’-OMeAOs.
100b
p la
dder
100b
p la
dder
200n
M
100n
M
50nM
200n
M
100n
M
50nM
200n
M
100n
M
50nM
200n
M
100n
M
50nM
Figure 4.4 RT-PCR evaluating transfection of normal human fibroblasts with the four LMNA-targeting 2’-OMeAOs designed to induce terminal intron retention. Amplification was carried out using LMNA primer pair (4970+4969) and only full-length LMNA products were amplified. The positive control sample (+ve) was amplified using SMN primer pair (5512a+ 5513a).
+ve: transfection positive control 2’-MeAO, SMN_8A(+57+81)
-ve: PCR negative control
UT: untreated TIR: transcripts with terminal intron retained FL: full-length transcripts (terminal intron excised)
LMNA FL
(687bp)
UT +ve -ve
SMN TIR
(848bp)
SMN FL
(404bp)
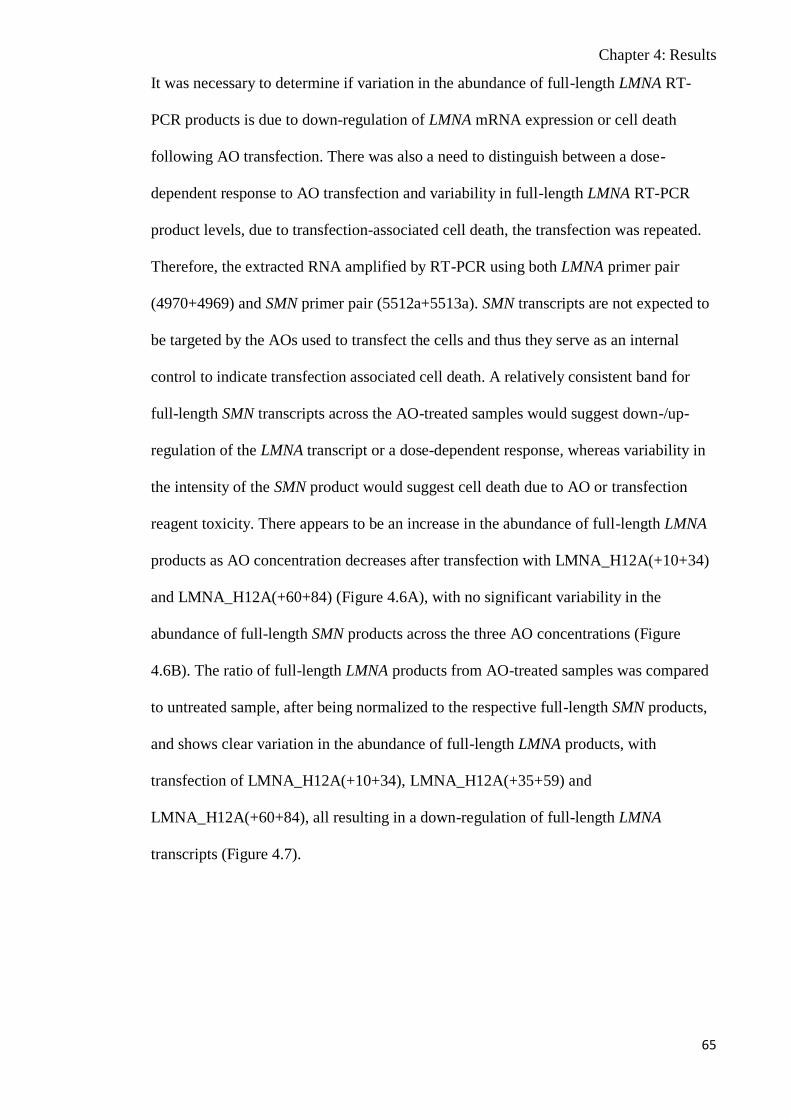
Chapter 4: Results
65
It was necessary to determine if variation in the abundance of full-length LMNA RT-
PCR products is due to down-regulation of LMNA mRNA expression or cell death
following AO transfection. There was also a need to distinguish between a dose-
dependent response to AO transfection and variability in full-length LMNA RT-PCR
product levels, due to transfection-associated cell death, the transfection was repeated.
Therefore, the extracted RNA amplified by RT-PCR using both LMNA primer pair
(4970+4969) and SMN primer pair (5512a+5513a). SMN transcripts are not expected to
be targeted by the AOs used to transfect the cells and thus they serve as an internal
control to indicate transfection associated cell death. A relatively consistent band for
full-length SMN transcripts across the AO-treated samples would suggest down-/up-
regulation of the LMNA transcript or a dose-dependent response, whereas variability in
the intensity of the SMN product would suggest cell death due to AO or transfection
reagent toxicity. There appears to be an increase in the abundance of full-length LMNA
products as AO concentration decreases after transfection with LMNA_H12A(+10+34)
and LMNA_H12A(+60+84) (Figure 4.6A), with no significant variability in the
abundance of full-length SMN products across the three AO concentrations (Figure
4.6B). The ratio of full-length LMNA products from AO-treated samples was compared
to untreated sample, after being normalized to the respective full-length SMN products,
and shows clear variation in the abundance of full-length LMNA products, with
transfection of LMNA_H12A(+10+34), LMNA_H12A(+35+59) and
LMNA_H12A(+60+84), all resulting in a down-regulation of full-length LMNA
transcripts (Figure 4.7).
Chapter 4: Results
66
100b
p la
dder
100b
p la
dder
200n
M
100n
M
50nM
200n
M
100n
M
50nM
200n
M
100n
M
50nM
200n
M
100n
M
50nM
SMN TIR
(848bp)
SMN FL (404bp)
LMNA FL (687bp)
Figure 4.6 RT-PCR evaluating transfection of normal human fibroblasts with the four LMNA-targeting 2’-OMeAOs designed to induce terminal intron retention. A: RT-PCR using LMNA primer pair (4970+4969). B: RT-PCR using SMN primer pair (5512a+5513a).
+ve: transfection positive control 2’-MeAO, SMN_8A(+57+81)
-ve: PCR negative control
UT: untreated TIR: transcripts with terminal intron retained FL: full-length transcripts (terminal intron excised)
UT +ve -ve
A
B
The RT-PCR shows a greater abundance of SMN transcripts with retained terminal
intron (848bp) for the positive control than for the untreated sample, indicating
acceptable transfection efficiency (Figure 4.6B). Interestingly, while transfection of
LMNA-targeting AOs did not cause a change in the splicing pattern of LMNA transcripts,
the AOs did appear to have influence the SMN splicing pattern. Specifically,
LMNA_H12A(+10+34), LMNA_H12A(+35+59) and LMNA_H12A(+60+84) resulted
in additional ~500bp SMN products (Figure 4.6B).

Chapter 4: Results
67
Figure 4.7 Ratios of full-length LMNA transcripts in normal human fibroblasts after transfection with LMNA-targeting 2’-OMeAOs. The ratios were determined as specified in Section 3.9.2. The ratio was undetermined for 200nM LMNA_H12A(-16+9) as no full-length SMN products were detected. UT: untreated
0
0.2
0.4
0.6
0.8
1
200nM 100nM 50nM 200nM 100nM 50nM 200nM 100nM 50nM 200nM 100nM 50nM
LMNA_H12A(-16+9) LMNA_H12A(+10+34) LMNA_H12A(+35+59) LMNA_H12A(+60+84) UT
Rat
io
4.2.2 Treatment of Normal Human Fibroblasts with LMNC-targeting 2’-OMeAOs
While intron 9 of the LMNA gene is not the terminal intron of the gene, it is referred to
as the “terminal intron” of LMNC transcripts, where transcription terminates within
LMNA exon 10. Like the LMNA experiment, RT-PCR amplification of LMNC
transcripts, after transfection with AOs designed to induce LMNC terminal intron
retention, were conducted in two sets, using the LMNC primer pair (5255+5259) (Figure
4.1C) and the SMN primer pair (5512a+5513a). A 660bp RT-PCR product is observed
in all samples amplified using LMNC primers (Figure 4.8A). Sequencing shows that this
product represents full-length LMNC transcripts without retained terminal intron (Figure
4.9A). Transfection with LMNC_H10A(+16+40), LMNC_H10A(+41+65) and
LMNC_H10A(+66+90) resulted in partial retention of the terminal intron in LMNC
transcripts (Figure 4.8A), confirmed by DNA sequencing (Figure 4.9B). Where LMNC
products with retained terminal intron (1081bp) were amplified, there was also a smaller
product (~1000bp) that could not be identified despite numerous attempts at DNA
sequencing. Additionally, LMNC-targeting 2’-OMeAOs that induced terminal intron

Chapter 4: Results
68
SMN Δ5
(308bp)
100b
p la
dder
100b
p la
dder
200n
M
100n
M
50nM
200n
M
100n
M
50nM
200n
M
100n
M
50nM
200n
M
100n
M
50nM
LMNC TIR (1081bp)
Unidentified product (~1000bp)
LMNC FL
(660bp)
UT +ve -ve
Figure 4.8 RT-PCR evaluating the transfection of normal human fibroblasts with the four 2’-OMeAOs targeting LMNC transcripts designed to induce terminal intron retention. A: RT-PCR using LMNC primer pair (5255+5259). B: RT-PCR using SMN primer pair (5512a+5513a).
+ve: transfection positive control 2’-MeAO, SMN_8A(+57+81)
-ve: PCR negative control
UT: untreated TIR: transcripts with terminal intron retained FL: full-length transcripts (terminal intron excised)
SMN TIR
(848bp)
SMN FL
(404bp)
A
B
retention also altered the SMN splicing pattern, resulting in a 500bp RT-PCR product
(Figure 4.8B) and interestingly, DNA sequencing shows that LMNC_H10A(+66+90)
causes skipping of SMN exon 5 (Figure 4.10).
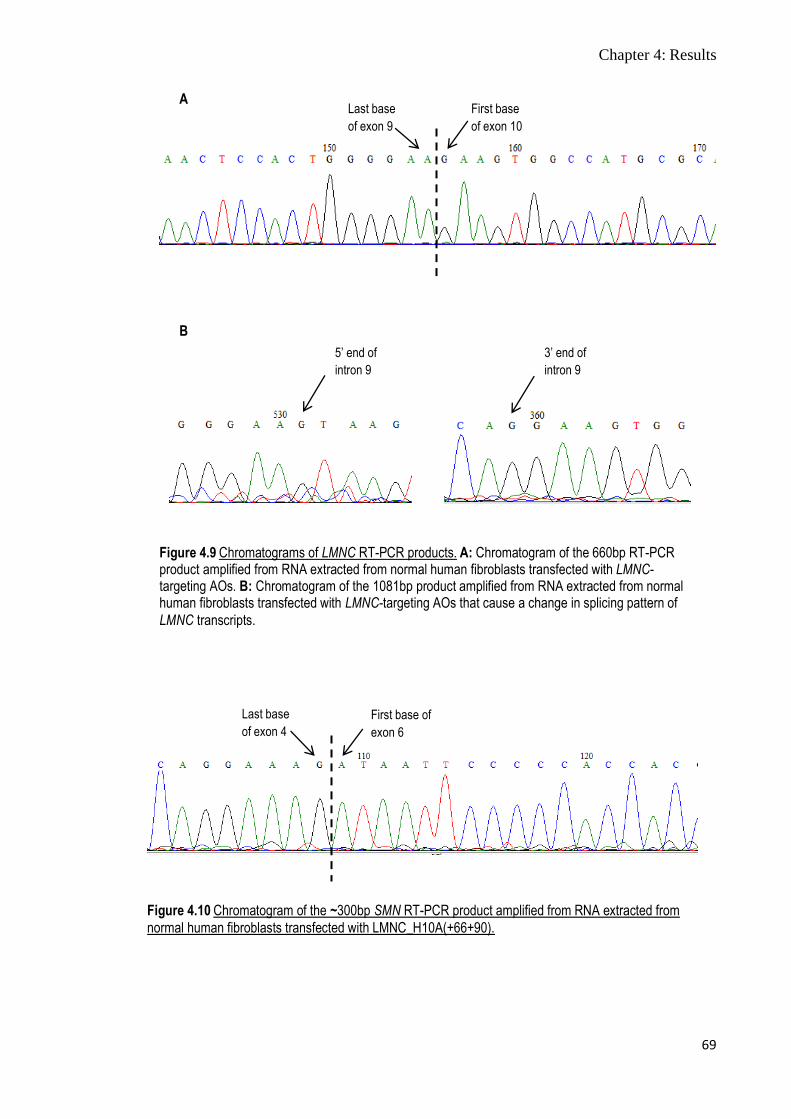
Chapter 4: Results
69
Figure 4.9 Chromatograms of LMNC RT-PCR products. A: Chromatogram of the 660bp RT-PCR product amplified from RNA extracted from normal human fibroblasts transfected with LMNC-targeting AOs. B: Chromatogram of the 1081bp product amplified from RNA extracted from normal human fibroblasts transfected with LMNC-targeting AOs that cause a change in splicing pattern of
LMNC transcripts.
Last base
of exon 9
First base
of exon 10
5’ end of
intron 9
3’ end of
intron 9
A
B
Last base
of exon 4
First base of
exon 6
Figure 4.10 Chromatogram of the ~300bp SMN RT-PCR product amplified from RNA extracted from
normal human fibroblasts transfected with LMNC_H10A(+66+90).

Chapter 4: Results
70
Figure 4.11 Semi-quantitative analysis of terminal intron retention induced in LMNC transcripts. Although the proportions of transcripts with retained terminal intron are low, they are significantly different from transcripts derived from the untreated cells. Error bar is included for samples with terminal intron retention and sample size n=2. ^Results are from a single experiment. * p-value <0.001 UT: untreated
TIR: transcripts with terminal intron retained FL: full-length transcripts (terminal intron excised)
0
0.2
0.4
0.6
0.8
1
200nM 100nM 50nM 200nM 100nM 50nM 200nM 100nM 50nM 200nM 100nM 50nM
LMNC_H10A(-10+15) LMNC_H10A(+16+40) LMNC_H10A(+41+65)LMNC_H10A(+66+90)^ UT
Pro
po
rtio
n
TIR
Unidentified
FL
* * * * *
* * * *
Terminal intron retention induced by LMNC_H10A(+66+90) was sporadic, detected
only on a single occasion. Densitometry shows that transfection with LMNC-targeting
2’-OMeAOs decreased full-length mRNA expression by 3% to 13%, and
LMNC_H10A(+16+40) and LMNC_H10A(+41+65) have dose-dependent effects on
terminal intron retention, where the proportion of transcripts with retained terminal
intron increases as AO concentration increases (Figure 4.11).
Chapter 4: Results
71
4.2.2.1 Treatment of Normal Human Fibroblasts with LMNC-targeting PMOs
Following confirmation of terminal intron retention in LMNC transcripts induced by
LMNC-targeting 2’-OMeAOs, the two most promising sequences that induced terminal
intron retention, LMNC_H10A(+16+40) and LMNC_H10A(+41+65), were
resynthesized as phosphorodiamidate morpholinos (PMOs) for comparison between
different AO chemistries and to determine if the more stable PMO chemistry could
induce a stronger effect. The PMOs were tested at 400nM, 200nM, and 100nM, while
the highest concentration of 2’-OMeAOs tested was 200nM. PMOs are less efficiently
taken up by cells in vitro and were thus tested at the higher concentration range of
100nM to 400nM, previously optimized for SMN targeting (Price, personal
communication). Using PMOs, terminal intron retention was weaker than that induced
by the 2’-OMeAOs, and retention was only observed at the higher concentrations.
LMNC_H10A(+16+40) PMO induced terminal intron retention at 400nM and 200nM,
while LMNC_H10A(+41+65) PMO induced terminal intron retention at 400nM (Figure
4.12A).

Chapter 4: Results
72
Scrambled
control UT -ve 100b
p la
dder
100b
p la
dder
Figure 4.12 RT-PCR showing transfection with PMOs designed to induce retention of the LMNC terminal intron. A: RT-PCR using LMNC primer pair (5255+5259). B: RT-PCR using SMN primer pair (5512a+5513a).
-ve: PCR negative control
UT: untreated TIR: transcripts with terminal intron retained FL: full-length transcripts (terminal intron excised)
400n
M
200n
M
100n
M
400n
M
200n
M
100n
M
400n
M
200n
M
100n
M
LMNC TIR (1081bp)
Unknown product (~1000bp)
LMNC FL (660bp)
SMN TIR
(848bp)
SMN FL
(404bp)
A
B
Chapter 4: Results
73
4.2.3 Treatment of Normal Human Fibroblasts with ITGA4-targeting 2’-OMeAOs
The ITGA4 gene comprises of 28 exons and codes for ITGA4 protein that belongs to the
integrin alpha chain family of proteins. ITGA4 proteins are ubiquitously expressed
adhesion molecules that have a role in cell signaling
(http://www.omim.org/entry/192975), and ITGA4 down-regulation using antisense
strategy is being investigated as a potential therapy for multiple sclerosis (Thander,
personal communication). Four 2’-OMeAOs were designed to retain the ITGA4
terminal intron (intron 27) and their effects were investigated.
To distinguish between a dose-dependent response to AO transfection and variability in
transcript levels due to transfection-associated cell death, the extracted RNA samples
were amplified by RT-PCR using ITGA4 primer pair (6003+5597) (Figure 4.1D) and
SMN primer pair (5512a+5513a). 2’-OMeAOs, ITGA4_H28A(-6+19),
ITGA4_H28A(+20+44) and ITGA4_H28A(+45+69) induced some degree of terminal
intron retention, as suggested by the presence of 1472bp bands (Figure 4.13A).
Sequencing of the 1472bp RT-PCR product confirmed retention of the ITGA4 terminal
intron and sequencing of the smaller band (976bp) confirmed that it represents full-
length, intron-less ITGA4 transcripts (Figure 4.14). Densitometry on the gel images
shows that ITGA4-targeting 2’-OMeAOs decreased full-length mRNA expression by 7%
to 13% (Figure 4.15).
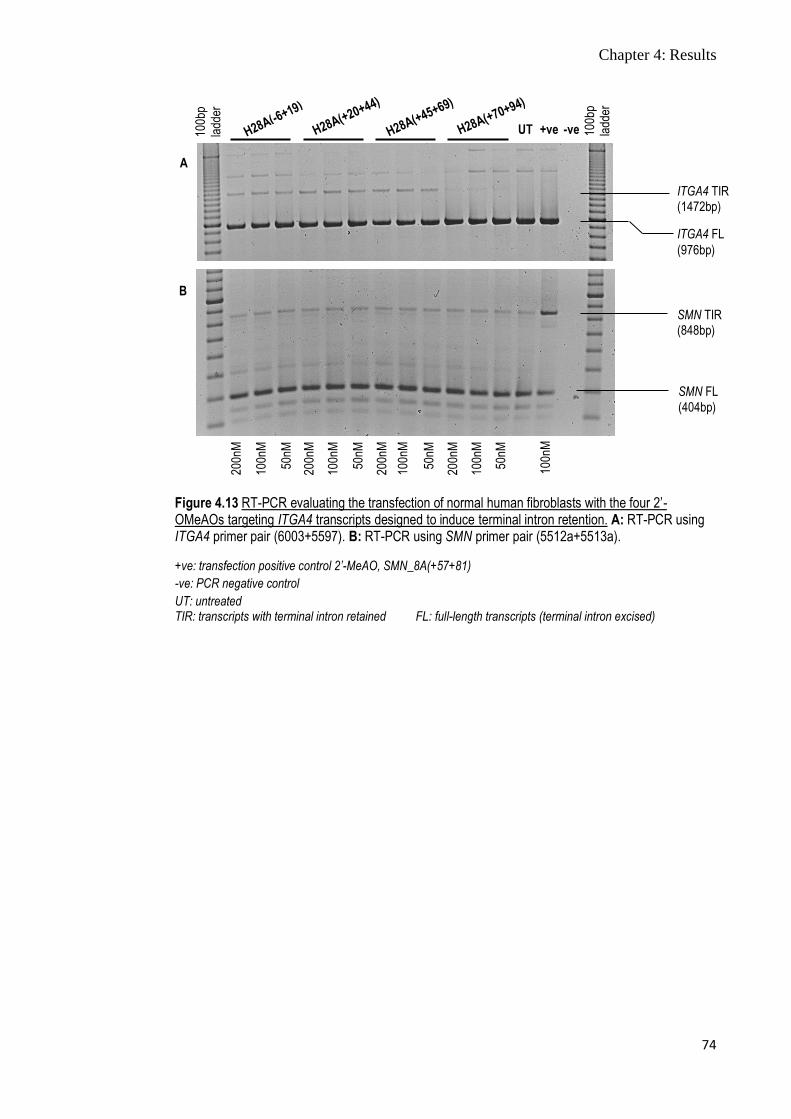
Chapter 4: Results
74
100b
p la
dder
100b
p la
dder
200n
M
100n
M
50nM
200n
M
100n
M
50nM
200n
M
100n
M
50nM
200n
M
100n
M
50nM
100n
M
UT +ve -ve
SMN FL
(404bp)
ITGA4 TIR (1472bp)
ITGA4 FL
(976bp)
SMN TIR (848bp)
Figure 4.13 RT-PCR evaluating the transfection of normal human fibroblasts with the four 2’-OMeAOs targeting ITGA4 transcripts designed to induce terminal intron retention. A: RT-PCR using ITGA4 primer pair (6003+5597). B: RT-PCR using SMN primer pair (5512a+5513a).
+ve: transfection positive control 2’-MeAO, SMN_8A(+57+81)
-ve: PCR negative control
UT: untreated TIR: transcripts with terminal intron retained FL: full-length transcripts (terminal intron excised)
A
B
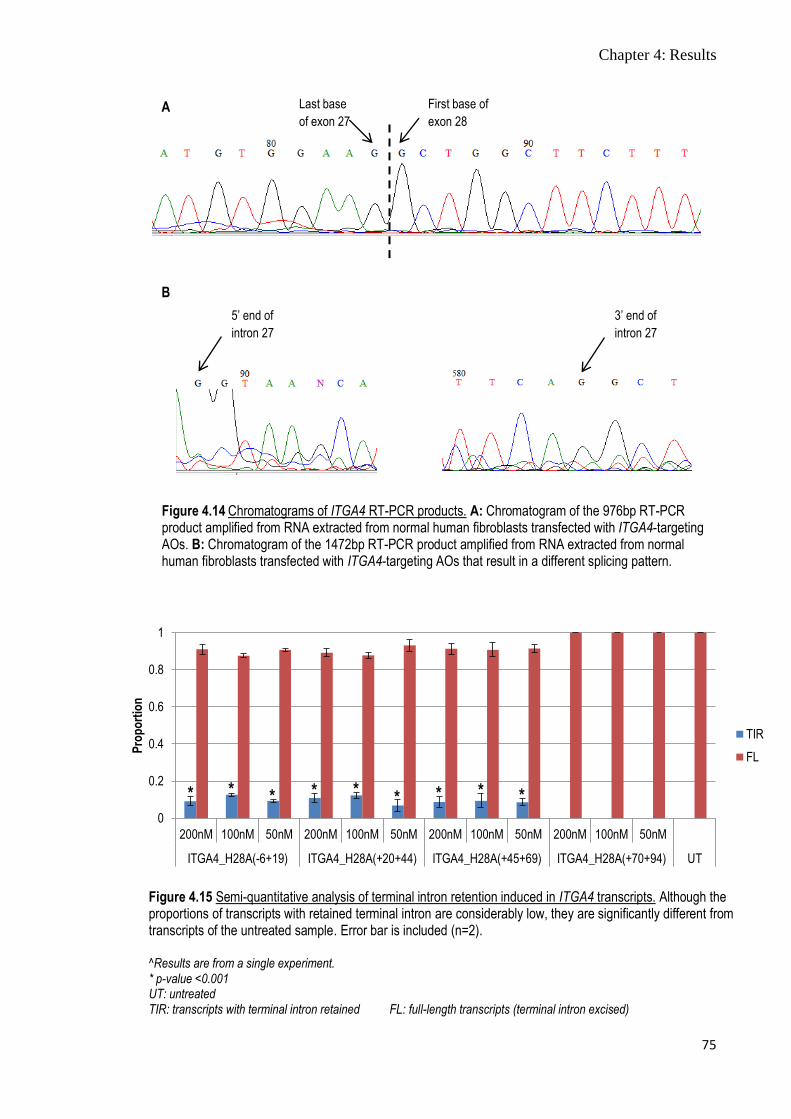
Chapter 4: Results
75
Figure 4.15 Semi-quantitative analysis of terminal intron retention induced in ITGA4 transcripts. Although the proportions of transcripts with retained terminal intron are considerably low, they are significantly different from transcripts of the untreated sample. Error bar is included (n=2). ^Results are from a single experiment. * p-value <0.001 UT: untreated TIR: transcripts with terminal intron retained FL: full-length transcripts (terminal intron excised)
0
0.2
0.4
0.6
0.8
1
200nM 100nM 50nM 200nM 100nM 50nM 200nM 100nM 50nM 200nM 100nM 50nM
ITGA4_H28A(-6+19) ITGA4_H28A(+20+44) ITGA4_H28A(+45+69) ITGA4_H28A(+70+94) UT
Pro
po
rtio
n
TIR
FL
* * * * * * * * *
5’ end of
intron 27
3’ end of
intron 27
Last base
of exon 27
First base of
exon 28 A
B
Figure 4.14 Chromatograms of ITGA4 RT-PCR products. A: Chromatogram of the 976bp RT-PCR product amplified from RNA extracted from normal human fibroblasts transfected with ITGA4-targeting AOs. B: Chromatogram of the 1472bp RT-PCR product amplified from RNA extracted from normal human fibroblasts transfected with ITGA4-targeting AOs that result in a different splicing pattern.
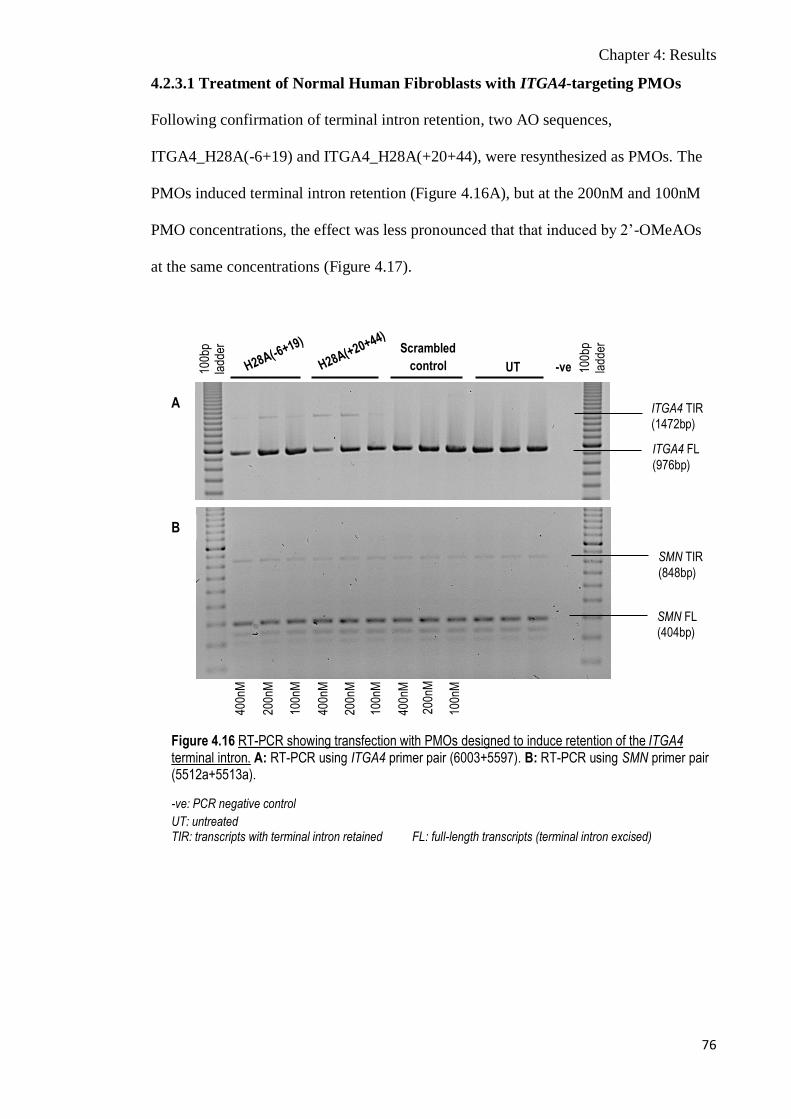
Chapter 4: Results
76
Scrambled
control UT -ve 100b
p la
dder
100b
p la
dder
400n
M
200n
M
100n
M
400n
M
200n
M
100n
M
400n
M
200n
M
100n
M
ITGA4 TIR
(1472bp)
ITGA4 FL
(976bp)
Figure 4.16 RT-PCR showing transfection with PMOs designed to induce retention of the ITGA4 terminal intron. A: RT-PCR using ITGA4 primer pair (6003+5597). B: RT-PCR using SMN primer pair (5512a+5513a).
-ve: PCR negative control
UT: untreated TIR: transcripts with terminal intron retained FL: full-length transcripts (terminal intron excised)
SMN FL
(404bp)
SMN TIR
(848bp)
A
B
4.2.3.1 Treatment of Normal Human Fibroblasts with ITGA4-targeting PMOs
Following confirmation of terminal intron retention, two AO sequences,
ITGA4_H28A(-6+19) and ITGA4_H28A(+20+44), were resynthesized as PMOs. The
PMOs induced terminal intron retention (Figure 4.16A), but at the 200nM and 100nM
PMO concentrations, the effect was less pronounced that that induced by 2’-OMeAOs
at the same concentrations (Figure 4.17).

Chapter 4: Results
77
4.2.4 Treatment of Normal Human Fibroblasts with SOD1-targeting 2’-OMeAOs
The SOD1 gene has 5 exons and codes for a homodimeric enzyme that breaks down
free superoxide radicals that can cause deleterious damage to the cell when present at
high levels (http://www.ncbi.nlm.nih.gov/gene/6647). Induced retention of SOD1
terminal intron (intron 4) using SOD1-targeting 2’-OMeAOs was also investigated.
RNA samples extracted from normal human fibroblasts, transfected with SOD1-
targeting AOs, were amplified by two-step RT-PCR, using SOD1 primer pair
(6007+6008) (Figure 4.1E). The positive control and untreated samples were also
amplified by one-step RT-PCR, using SMN primer pair (5512a+5513a). Analysis of the
two-step RT-PCR products showed multiple randomly amplified products, with a
consistent, intense 300bp product across all samples, while there is obvious product of
*
Figure 4.17 Proportions of ITGA4 transcripts with retained terminal intron when different AO chemistries were used. Even though there is a hint of TIR transcripts amplified from RNA extracted from cells treated with 100nM ITGA4_H28A(+20+44), optical density analysis was not possible.
* p-value <0.001 TIR: transcripts with terminal intron retained
0
0.02
0.04
0.06
0.08
0.1
0.12
0.14
200nM 100nM 200nM 100nM
ITGA4_H28A(-6+19) ITGA4_H28A(+20+44)
Pro
po
rtio
n o
f T
IR T
ran
scri
pts
PMO
2'-OMeAO
*
*

Chapter 4: Results
78
A
Figure 4.18 RT-PCR of RNA extracted from normal human fibroblasts transfected with SOD1-targeting 2’-OMeAOs. A: Two- step long range RT-PCR using SOD1 primer pair (6007+6008). B: One-step RT-PCR using SMN primer pair (5512a+5513a).
+ve: transfection positive control 2’-MeAO, SMN_8A(+57+81)
-ve: PCR negative control
UT: untreated TIR: transcripts with terminal intron retained FL: full-length transcripts (terminal intron excised)
SOD1 FL (300bp)
Potential SOD1 TIR
(1395bp)
100b
p la
dder
100b
p la
dder
200n
M
100n
M
50nM
200n
M
100n
M
50nM
200n
M
100n
M
50nM
200n
M
100n
M
50nM
UT -ve
100b
p la
dder
UT -ve +ve
SMN FL (404bp)
SMN TIR (848bp)
B
the anticipated size of 1395bp (Figure 4.18A). DNA sequencing shows that the 300bp
product represents full-length transcripts without terminal intron (Figure 4.19).

Chapter 4: Results
79
While no clear product-of-interest was observed, the gel image suggests a hint of intron-
retaining products amplified from cells transfected with SOD1_H5A(+21+45) 2’-
OMeAO (Figure 4.18A). Therefore, three additional 2’-OMeAOs were designed around
the region targeted by the SOD1_H5A(+21+45) 2’-OMeAO. Additionally, two 2’-
OMeAOs that target the donor splice site of SOD1 exon 4 were designed and
synthesised, to determine if blocking the donor splice site will induce retention of the
terminal intron. RT-PCR analysis of RNA extracted from cells transfected with the
second generation 2’-OMeAOs did not show any 1395bp bands (Figure 4.20A),
indicating that attempts to induce terminal intron retention in SOD1 transcripts using
these 2’-OMeAOs was not successful.
Last base
of exon 4
First base
of exon 5
Figure 4.19 Chromatogram of the 300bp SOD1 RT-PCR product amplified from RNA extracted from normal human fibroblasts transfected with SOD1-targeting AOs.
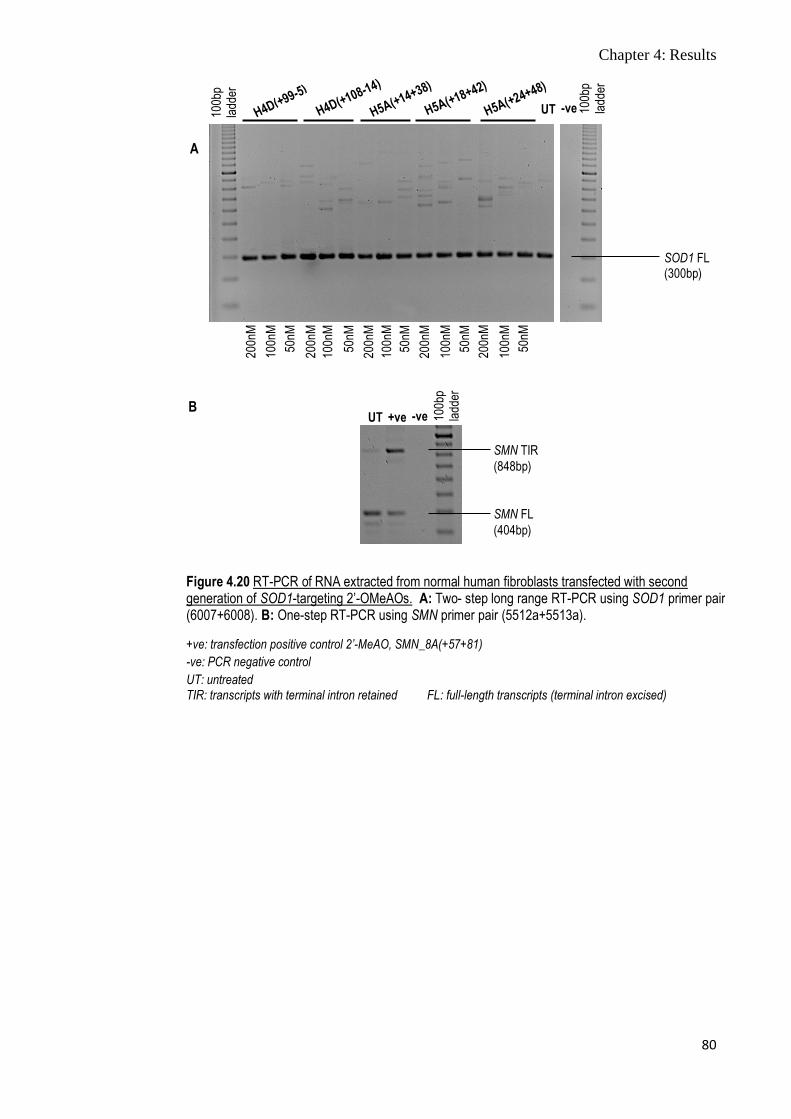
Chapter 4: Results
80
100b
p la
dder
100b
p la
dder
UT -ve
200n
M
100n
M
50nM
200n
M
100n
M
50nM
200n
M
100n
M
50nM
200n
M
100n
M
50nM
200n
M
100n
M
50nM
Figure 4.20 RT-PCR of RNA extracted from normal human fibroblasts transfected with second generation of SOD1-targeting 2’-OMeAOs. A: Two- step long range RT-PCR using SOD1 primer pair (6007+6008). B: One-step RT-PCR using SMN primer pair (5512a+5513a).
+ve: transfection positive control 2’-MeAO, SMN_8A(+57+81)
-ve: PCR negative control
UT: untreated TIR: transcripts with terminal intron retained FL: full-length transcripts (terminal intron excised)
SMN FL
(404bp)
SMN TIR
(848bp)
100b
p la
dder
UT -ve +ve
SOD1 FL (300bp)
A
B
Chapter 4: Results
81
4.2.5 Treatment of Normal Human Fibroblasts and Primary Myoblasts with DMD-
targeting 2’-OMeAOs
At approximately 2.4Mb, DMD is the largest human gene known to date. DMD
comprises of 79 exons, and encodes dystrophin, a large cytoskeletal protein that is
important in maintaining muscle fibre integrity (Muntoni et. al., 2003). Multiple tissue-
specific DMD transcripts are generated by alternative promoter usage, poly(A) tail
addition sites, and splicing (http://www.ncbi.nlm.nih.gov/gene/1756).
To determine if transfection of different cell types with DMD-targeting 2’-OMeAOs
designed to induce retention of the DMD terminal intron (intron 78) will result in
different splicing patterns, transfections were carried out in normal human fibroblasts
and normal primary human myoblasts. RNA was then extracted and amplified via two-
step long range RT-PCR, using the outer DMD primer pair (6004+4894) (Figure 4.1F),
and to determine if transfection was successful, the positive control and untreated
samples were also amplified by one-step RT-PCR, using SMN primer pair
(5512a+5513a). DMD RT-PCR shows no product of the anticipated size of 5091bp in
either fibroblast or myoblast samples, but smaller bands are present in both types of
samples (Figure 4.21A and 4.22A). Three RT-PCR products, slightly smaller than
500bp, were observed in fibroblast samples (Figure 4.21A). However, amplification of
myoblast DMD cDNA produced multiple random bands and two consistent bands with
size slightly less than 500bp, across all samples (Figure 4.22A).
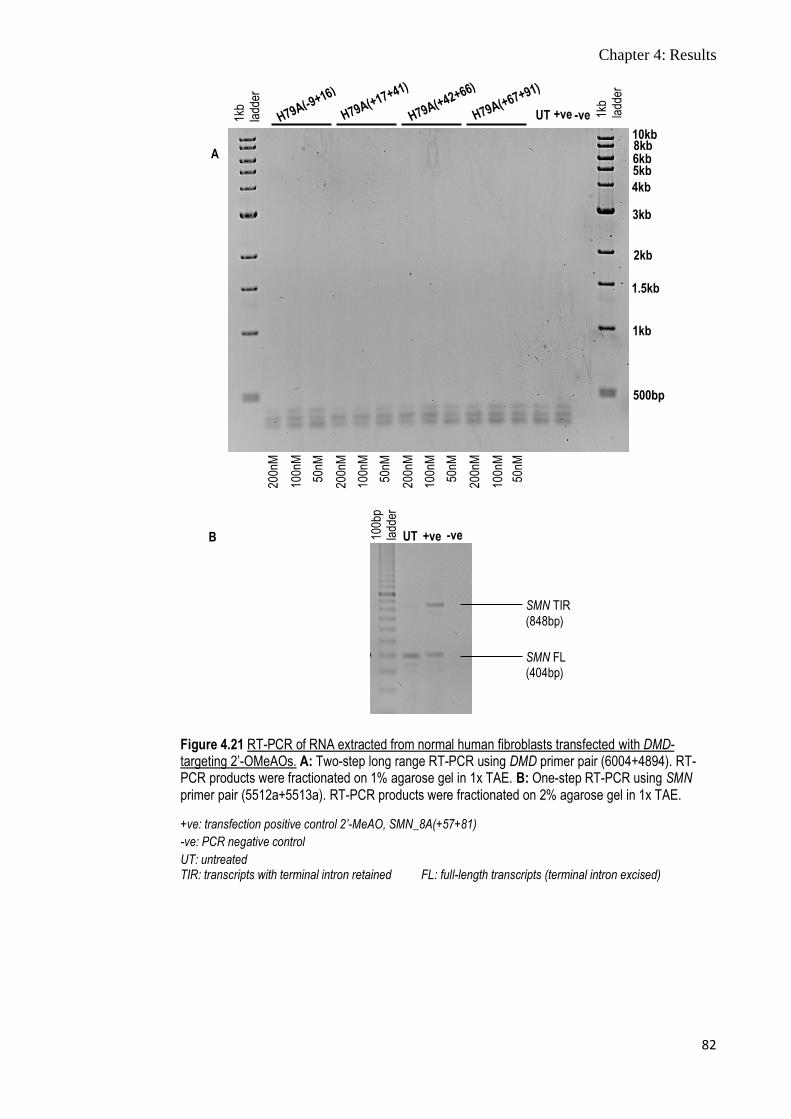
Chapter 4: Results
82
1kb
ladd
er
1kb
ladd
er
UT -ve +ve
500bp
1kb
1.5kb
2kb
3kb
4kb
10kb
5kb
8kb 6kb
Figure 4.21 RT-PCR of RNA extracted from normal human fibroblasts transfected with DMD-targeting 2’-OMeAOs. A: Two-step long range RT-PCR using DMD primer pair (6004+4894). RT-PCR products were fractionated on 1% agarose gel in 1x TAE. B: One-step RT-PCR using SMN primer pair (5512a+5513a). RT-PCR products were fractionated on 2% agarose gel in 1x TAE.
+ve: transfection positive control 2’-MeAO, SMN_8A(+57+81)
-ve: PCR negative control
UT: untreated TIR: transcripts with terminal intron retained FL: full-length transcripts (terminal intron excised)
200n
M
100n
M
50nM
200n
M
100n
M
50nM
200n
M
100n
M
50nM
200n
M
100n
M
50nM
SMN FL (404bp)
SMN TIR
(848bp)
100b
p la
dder
UT -ve +ve
A
B
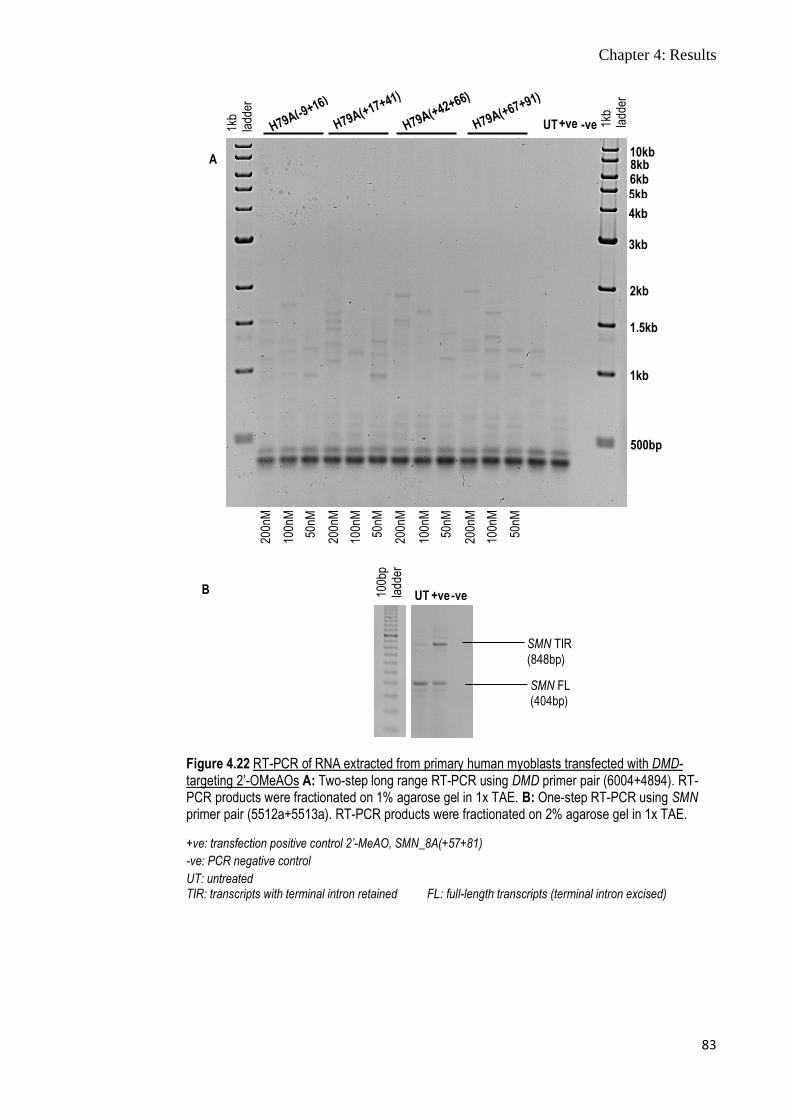
Chapter 4: Results
83
1kb
ladd
er
1kb
ladd
er
UT -ve +ve
Figure 4.22 RT-PCR of RNA extracted from primary human myoblasts transfected with DMD-targeting 2’-OMeAOs A: Two-step long range RT-PCR using DMD primer pair (6004+4894). RT-PCR products were fractionated on 1% agarose gel in 1x TAE. B: One-step RT-PCR using SMN primer pair (5512a+5513a). RT-PCR products were fractionated on 2% agarose gel in 1x TAE.
+ve: transfection positive control 2’-MeAO, SMN_8A(+57+81)
-ve: PCR negative control
UT: untreated TIR: transcripts with terminal intron retained FL: full-length transcripts (terminal intron excised)
200n
M
100n
M
50nM
200n
M
100n
M
50nM
200n
M
100n
M
50nM
200n
M
100n
M
50nM
SMN FL (404bp)
SMN TIR
(848bp)
100b
p la
dder
UT -ve +ve
500bp
1kb
1.5kb
2kb
3kb
4kb
10kb
5kb
8kb 6kb
A
B
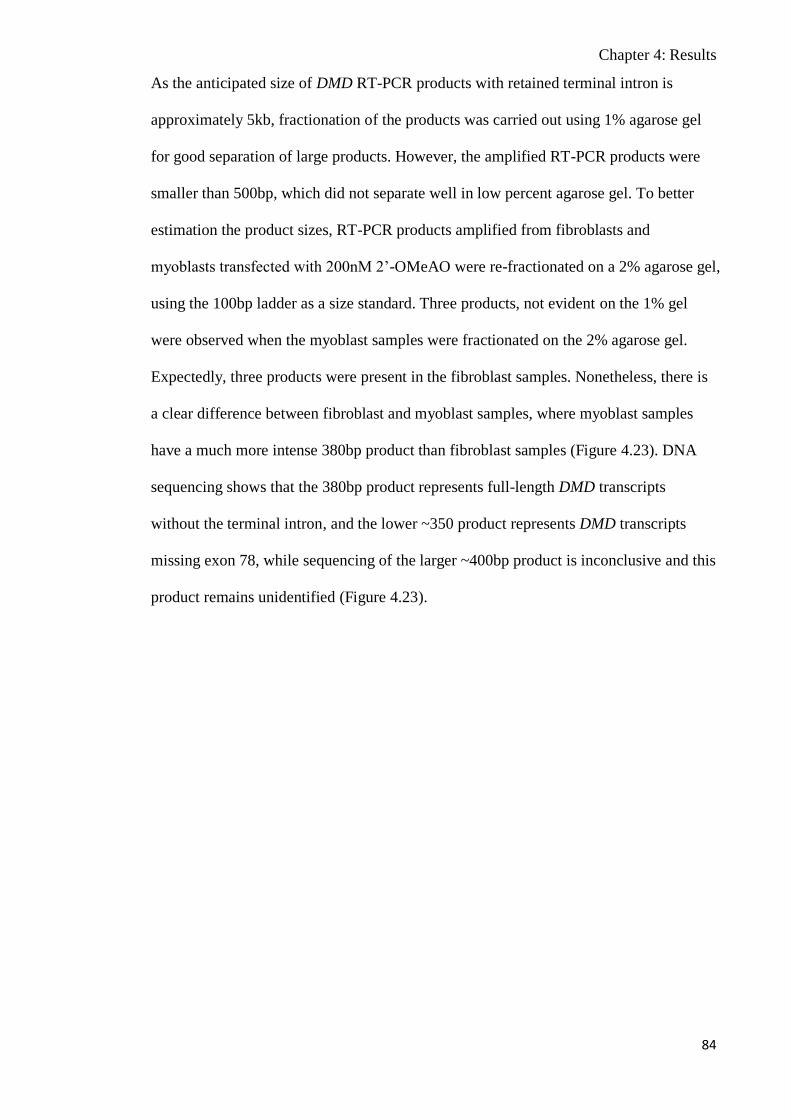
Chapter 4: Results
84
As the anticipated size of DMD RT-PCR products with retained terminal intron is
approximately 5kb, fractionation of the products was carried out using 1% agarose gel
for good separation of large products. However, the amplified RT-PCR products were
smaller than 500bp, which did not separate well in low percent agarose gel. To better
estimation the product sizes, RT-PCR products amplified from fibroblasts and
myoblasts transfected with 200nM 2’-OMeAO were re-fractionated on a 2% agarose gel,
using the 100bp ladder as a size standard. Three products, not evident on the 1% gel
were observed when the myoblast samples were fractionated on the 2% agarose gel.
Expectedly, three products were present in the fibroblast samples. Nonetheless, there is
a clear difference between fibroblast and myoblast samples, where myoblast samples
have a much more intense 380bp product than fibroblast samples (Figure 4.23). DNA
sequencing shows that the 380bp product represents full-length DMD transcripts
without the terminal intron, and the lower ~350 product represents DMD transcripts
missing exon 78, while sequencing of the larger ~400bp product is inconclusive and this
product remains unidentified (Figure 4.23).
Chapter 4: Results
85
Last base
of exon 78
First base of
exon 79
Figure 4.23 Fibroblast and myoblast DMD RT-PCR products and chromatograms of the amplified DMD RT-PCR products. The three RT-PCR products were amplified using DMD primers (6004+4894) in both fibroblast and myoblast samples. Chromatograms of bands A and B are shown. Multiple attempts at sequencing band C were not successful.
F: fibroblast M: myoblast
Last base
of exon 77
First base of
exon 79
C Unidentified product
F 100b
p la
dder
100b
p la
dder
B DMD FL (380bp) A DMD Δ78 (348bp)
M F M F M F M
B
A
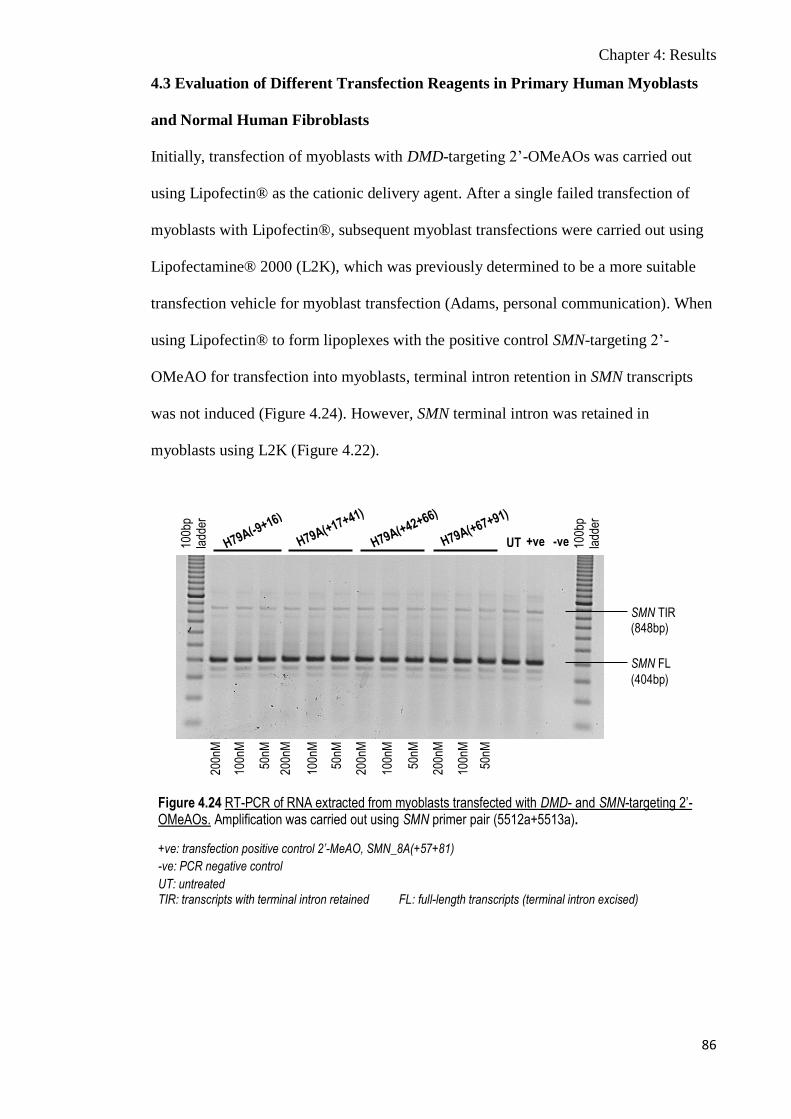
Chapter 4: Results
86
100b
p la
dder
100b
p la
dder
UT -ve +ve
Figure 4.24 RT-PCR of RNA extracted from myoblasts transfected with DMD- and SMN-targeting 2’-OMeAOs. Amplification was carried out using SMN primer pair (5512a+5513a).
+ve: transfection positive control 2’-MeAO, SMN_8A(+57+81)
-ve: PCR negative control
UT: untreated TIR: transcripts with terminal intron retained FL: full-length transcripts (terminal intron excised)
SMN FL
(404bp)
SMN TIR (848bp)
200n
M
100n
M
50nM
200n
M
100n
M
50nM
200n
M
100n
M
50nM
200n
M
100n
M
50nM
4.3 Evaluation of Different Transfection Reagents in Primary Human Myoblasts
and Normal Human Fibroblasts
Initially, transfection of myoblasts with DMD-targeting 2’-OMeAOs was carried out
using Lipofectin® as the cationic delivery agent. After a single failed transfection of
myoblasts with Lipofectin®, subsequent myoblast transfections were carried out using
Lipofectamine® 2000 (L2K), which was previously determined to be a more suitable
transfection vehicle for myoblast transfection (Adams, personal communication). When
using Lipofectin® to form lipoplexes with the positive control SMN-targeting 2’-
OMeAO for transfection into myoblasts, terminal intron retention in SMN transcripts
was not induced (Figure 4.24). However, SMN terminal intron was retained in
myoblasts using L2K (Figure 4.22).
Chapter 4: Results
87
In addition, Lipofectamine® 3000 (L3K) was evaluated in other studies in our
laboratory during the course of this project and found to be superior to Lipofectin®
(Price and Pitout, personal communication). Thus, some experiments were repeated
using L3K as the transfection reagent. LMNA and ITGA4 were selected to examine if
L3K would actually enhance transfection and terminal intron retention. Quite
unexpectedly, there was no increase in the proportion of LMNA and ITGA4 transcripts
showing intron retention 24h after transfection (Figure 4.25A and E). Interestingly,
potential terminal intron retention was observed for LMNA transcripts after 48h
transfection, however, this was not confirmed by DNA sequencing, as there is
insufficient product for sequencing (Figure 4.25C). Nonetheless, variability in the
abundance of full-length LMNA products between and within each AO group is
observed (Figure 4.25A, C). Notably, transfection of normal human fibroblasts with
50nM LMNA_H12A(-16+9) (24h and 48h), 50nM (48h) and 25nM (24h)
LMNA_H12A(+10+34), and 50nM LMNA_H12A(+35+59) (48h) resulted in more than
or close to 50% reduction in the levels of full-length LMNA transcripts (Figure 4.26A).
Surprisingly, transfection with LMNA_H12A(+35+59) and LMNA_H12A(+60+84)
generally caused an up-regulation of full-length LMNA transcripts (Figure 4.26A).
Interestingly, for ITGA4 experiment at the 48h time point, there was a consistent
indication of transfection-associated cell death at the higher concentrations (50nM),
suggested by decreased abundance of both full-length ITGA4 and SMN products (Figure
4.25G, H). Semi-quantitative analysis shows down-regulation of full-length ITGA
transcripts in normal human fibroblasts following transfection with the 4 ITGA4-
targeting 2’-OMeAOs, with significant down-regulation when 50nM of AO was used
(Figure 4.26B).

Chapter 4: Results
88
LMNA FL
(687bp) 10
0bp
ladd
er
100b
p la
dder
UT +ve -ve
50nM
25nM
12.5
nM
50nM
25nM
12.5
nM
50nM
25nM
12.5
nM
50nM
25nM
12.5
nM
50nM
25nM
LMNA FL (687bp)
A
24h
48h
LMNA TIR (1008bp)
C
B
D
SMN TIR (848bp)
SMN FL (404bp)
SMN TIR (848bp)
SMN FL
(404bp)
100b
p la
dder
100b
p la
dder
UT +ve -ve
50nM
25nM
12.5
nM
50nM
25nM
12.5
nM
50nM
25nM
12.5
nM
50nM
25nM
12.5
nM
50nM
25nM
E
24h
48h
ITGA4 TIR
(1472bp)
ITGA4 FL
(976bp)
ITGA4 TIR
(1472bp)
ITGA4 FL
(976bp)
G
F
H
SMN TIR (848bp)
SMN FL
(404bp)
SMN TIR (848bp)
SMN FL
(404bp)
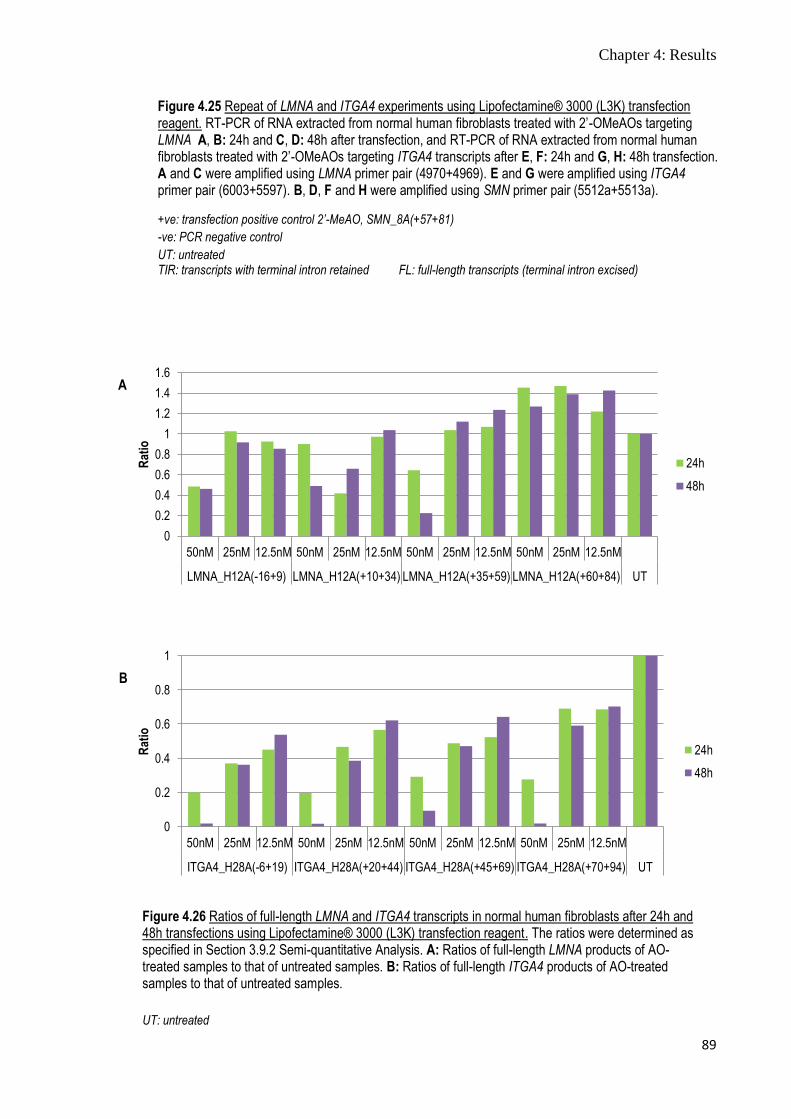
Chapter 4: Results
89
0
0.2
0.4
0.6
0.8
1
1.2
1.4
1.6
50nM 25nM 12.5nM 50nM 25nM 12.5nM 50nM 25nM 12.5nM 50nM 25nM 12.5nM
LMNA_H12A(-16+9) LMNA_H12A(+10+34) LMNA_H12A(+35+59) LMNA_H12A(+60+84) UT
Rat
io
24h
48h
0
0.2
0.4
0.6
0.8
1
50nM 25nM 12.5nM 50nM 25nM 12.5nM 50nM 25nM 12.5nM 50nM 25nM 12.5nM
ITGA4_H28A(-6+19) ITGA4_H28A(+20+44) ITGA4_H28A(+45+69) ITGA4_H28A(+70+94) UT
Rat
io
24h
48h
A
B
Figure 4.26 Ratios of full-length LMNA and ITGA4 transcripts in normal human fibroblasts after 24h and 48h transfections using Lipofectamine® 3000 (L3K) transfection reagent. The ratios were determined as specified in Section 3.9.2 Semi-quantitative Analysis. A: Ratios of full-length LMNA products of AO-treated samples to that of untreated samples. B: Ratios of full-length ITGA4 products of AO-treated samples to that of untreated samples.
UT: untreated
Figure 4.25 Repeat of LMNA and ITGA4 experiments using Lipofectamine® 3000 (L3K) transfection reagent. RT-PCR of RNA extracted from normal human fibroblasts treated with 2’-OMeAOs targeting LMNA A, B: 24h and C, D: 48h after transfection, and RT-PCR of RNA extracted from normal human fibroblasts treated with 2’-OMeAOs targeting ITGA4 transcripts after E, F: 24h and G, H: 48h transfection. A and C were amplified using LMNA primer pair (4970+4969). E and G were amplified using ITGA4 primer pair (6003+5597). B, D, F and H were amplified using SMN primer pair (5512a+5513a).
+ve: transfection positive control 2’-MeAO, SMN_8A(+57+81)
-ve: PCR negative control
UT: untreated TIR: transcripts with terminal intron retained FL: full-length transcripts (terminal intron excised)

Chapter 5: Discussion
90
5. Discussion
Data from the experiments show that terminal intron retention is not inducible in all of
the human gene transcripts examined and not all target sites can mediate intron retention.
In addition, changing AO chemistry and transfection reagent led to different results.
These findings suggest that terminal intron retention is influenced by multiple factors.
Besides offering possible explanations for the experimental results, this discussion will
also examine possible mechanism and features that support terminal intron retention.
Limitations and improvements, as well as future directions will also be discussed.
5.1 General Discussion
5.1.1 Preliminary Experiments on SMN Transcripts
Two 2’-OMeAOs known to induce terminal intron retention in SMN transcripts were
validated for use as positive controls, prior to investigating AO-mediated terminal
intron retention in other target gene transcripts. Furthermore, to determine if blocking
the donor splice site simultaneously would enhance the effect of intron retention
induced by AOs directed to other target gene transcripts, transfection of fibroblasts was
carried out using an AO cocktail comprising of an SMN-targeting AO that binds at the
donor splice site of the terminal intron (SMN_H7D(+17-13)) and one of the previously
developed terminal intron retention-inducing AOs, SMN_H8A(+57+81) or
SMN_H8A(-10+15). The addition of SMN_H7D(+17-13) has no synergistic effect on
terminal intron retention and there appeared to be a decrease in the abundance of
transcripts with retained terminal intron. As SMN_H7D(+17-13) is an exon skipping-
inducing AO, there was also an expected increase in transcripts with SMN exon 7
skipping. This shows that the SMN exon 7 skipping AO overrides the effect of the SMN
intron 7 inclusion AO. While this leads to the conclusion that the inclusion of an AO
targeting the donor splice site does not enhance the effect of a terminal intron retention-

Chapter 5: Discussion
91
inducing AO in SMN transcripts, the result has its limitations. Firstly, the donor splice
site-targeting AO causes exon skipping and secondly, only one donor splice site AO
was tested. Results based on a single AO cocktail may not be representative, therefore,
more cocktail combinations should be tested. Nevertheless, the result confirms that
terminal intron retention is inducible by selected AOs, validating SMN terminal intron
retention as a suitable positive control for this project.
5.1.2 Principle Findings
Overall, the experimental results suggest that terminal intron retention is not readily
inducible using AOs. Only 40% of gene transcripts (n=5) investigated showed some
terminal intron retention following transfection with 2’-OMeAOs. Furthermore, within
the LMNC and ITGA4 transcripts where terminal intron retention was detected, only a
few of the AOs designed were able to induce detectable retention of the last intron when
total cellular RNA was examined, again showing that terminal intron retention is not
easily inducible, and that the effective AO target sites are somewhat constrained.
Notably, the proportion of transcripts with retained terminal intron was consistently low,
ranging from approximately 3% to 13%. Such low levels of transcripts with retained
terminal intron could be due to degradation via nonsense-mediated decay (NMD)
activated by intron retention, as further discussed in the next paragraph.
No 1009bp LMNA RT-PCR product representing LMNA transcripts with retained
terminal intron was amplified, however, some variations in the abundance of full-length
LMNA products were observed. Down-regulation of full-length LMNA transcripts was
observed following transfection of normal human fibroblasts with
LMNA_H12A(+10+34), LMNA_H12A(+35+59) and LMNA_H12A(+60+84). A
possible explanation for this is that terminal intron retention did occur, but resulted in
Chapter 5: Discussion
92
highly unstable intron-retaining LMNA transcripts that were rapidly degraded by NMD
and hence, were not detected by RT-PCR amplification. The terminal intron of LMNA
transcripts contains 2 premature in-frame termination codons (PTCs) that could explain
rapid turnover by NMD (Lewis et. al., 2003, Lareau et. al., 2007). However, the
terminal introns of LMNC and ITGA4 transcripts have more PTCs (5 and 13,
respectively), yet terminal intron retention is evident from RT-PCR. This suggests that
NMD is not wholly dependent on the presence of PTCs, and is probably not influenced
by the number of PTCs.
Although the LMNA-targeting 2’-OMeAOs, LMNA_H12A(+10+34),
LMNA_H12A(+35+59) and LMNA_H12A(+60+84) did not obviously alter the
splicing pattern of LMNA transcripts, SMN RT-PCR products of approximately 500bp
were amplified. 500bp SMN products were also amplified from LMNC_H10A(+16+40)
and LMNC_H10A(+41+65) transfected fibroblasts. These 500bp SMN products were
overlooked initially and were not submitted for sequence analysis, but it is speculated
that they could be heteroduplexes and hence, a PCR artefact.
Interestingly, a LMNC-targeting AO, LMNC_H10A(+66+90), caused skipping of SMN
exon 5. This non-specific effect could have been due to a similarity between the LMNC
target sequence and the SMN sequence. To determine if this might offer an explanation
for the skipping of SMN exon 5, a BLAST search
(http://blast.ncbi.nlm.nih.gov/Blast.cgi) of the targeted LMNC sequence was performed,
but SMN was not a possible match. Another possible reason for the non-specific effect
is similarity between the targeted LMNC sequence and a splicing factor that then has an
effect on skipping of SMN exon 5.
Chapter 5: Discussion
93
Sequencing difficulties were encountered when analysing the LMNC and DMD
experiments, where clean sequencing chromatograms were not achieved. The ~1000bp
product amplified from LMNC cDNA could only be speculated to be due to cryptic
splicing or it could be a heteroduplex, while the ~400bp DMD product is speculated to
be a minor isoform in both fibroblasts and myoblasts.
Besides the ~400bp product, two other products were amplified from DMD cDNA.
These three RT-PCR products most likely represent the different isoforms, driven by
internal promotors in the DMD gene. Consistently expressed at a higher level in
myoblasts, the ~380bp product probably represents the full-length skeletal muscle
isoform, whereas the ~350bp band represents the major isoform in fibroblasts. None of
these three products represent DMD transcripts with retained terminal intron.
The finding that terminal intron retention could only be induced in 40% of gene
transcripts examined cannot be considered conclusive, as only four, 25 base AOs were
designed for each gene transcript. Since properties such as length, sequence and target
site can influence efficacy of an AO in altering a splicing pattern, the lack of success at
inducing terminal intron retention in LMNA, SOD1, and DMD transcripts does not
necessarily mean that induced terminal intron retention is impossible. It has been shown
in some cases that longer 2’-OMeAOs and PMOs have higher efficacies than their
shorter counterparts at inducing exon skipping in DMD transcripts (Harding et. al.,
2007). While other studies have shown opposing results, these studies also showed rare
occurrence of higher efficacy in longer AOs (Adams et. al., 2007; Heemskerk et. al.,
2009). Absence of terminal intron retention induced in 60% of the gene transcripts
examined only implies possible design of non-ideal AOs and/or target site selection.
Furthermore, other factors such as AO concentrations, AO chemistry, cell type,
Chapter 5: Discussion
94
transfection reagent, and duration of transfection, can also affect AO transfection
outcome.
5.1.2.1 AO Concentration and Chemistry
Compared to 2’-OMeAOs, a higher PMO concentration range (100nM-400nM) was
used because un-complexed PMOs are not efficiently taken up by cells in vitro, and
were found to be more efficient at inducing terminal intron retention in SMN transcripts
at the higher concentrations (Price, personal communication). A previous study on
inducing DMD exon skipping also used PMOs at a higher concentration (500nM)
(Arechavala-Gomeza et. al., 2007). To determine if AO chemistries influences
transfection outcomes, a semi-quantitative analysis was carried out for ITGA4-targeting
2’-OMeAOs and PMOs with the same sequence (except where U’s in 2’-OMeAOs were
changed to T’s in the PMOs). Using the PMO chemistry, there was an overall decrease
in the proportion of ITGA4 transcripts with retained terminal intron, relative to when the
2’-O-methyl phosphorothioate chemistry was used. This result is similar to that found
when attempting to induce SMN intron 7 retention (Price, unpublished data). However,
PMOs appeared to be more effective than 2’-OMeAOs at inducing exon skipping in
DMD transcripts (Heemskerk et. al., 2009). The difference in efficacies of PMOs at
promoting intron retention and exon skipping suggests that AO chemistry influences
splicing efficacy and that different chemistries might be better suited to the various
alternative splicing events.
Chapter 5: Discussion
95
5.1.2.2 Transfection Reagent
Lipofectin® efficiently transfected AOs into fibroblasts, but was less effective in
transfecting primary myoblasts, where transfection failed on the first attempt. However,
myoblast transfections using Lipofectamine® 2000 (L2K) were successful, indicating
that the selection of transfection reagent is important, and is likely to differ with each
cell type. Nevertheless, myoblast transfection using Lipofectin® was only carried out
once and hence, it is possible that the failure of this single experiment was not due to
the transfection reagent used. However, L2K has generally been an effective
transfection reagent in several cell strains in our laboratory, and the fact that transfection
using L2K succeeded on the first trial suggests that L2K could be a better vehicle than
Lipofectin® for AO transfection into myoblasts.
It was shown during the course of this honours investigation that L3K has significantly
higher transfection efficiency than Lipofectin® (Pitout, Price, personal communication).
A hint of terminal intron retention within LMNA transcripts after 48h transfection gave
support to the higher transfection efficacy of L3K over Lipofectin®. However, expected
enhancement of ITGA4 terminal intron retention was not observed at both time points
tested. These unexpected results suggest that the target gene transcripts and/or AO
sequences may influence the choice of transfection reagent.
5.1.2.3 Transfection Duration
Selected experiments using L3K also show that transfection duration is another possible
parameter impacting on the detection of AO-induced intron retention. Transfections of
fibroblasts with LMNA- and ITGA4-targeting 2’-OMeAOs using L3K were carried out
for 24h and 48h. In the LMNA experiments, terminal intron retention was evident only
after 48h transfection. Nonetheless, the presence of a light smear in the lanes (of the 24h
Chapter 5: Discussion
96
gel image) corresponding to those in the 48h gel image where terminal intron retention
was suggested, could have obscured the larger band that represents terminal intron-
retaining transcripts. Comparing the results of 24h and 48h transfections for ITGA4
transcripts shows a significant decrease in the abundance of RT-PCR product
representing full-length ITGA4 transcripts at the highest AO concentration (50nM)
across the four 2’-OMeAOs tested, and this decrease might be due to the down-
regulation of full-length ITGA4 transcripts at 50nM AO. Although explainable by a
down-regulation, the decreased abundance could also be the result of transfection or
AO-associated toxicity, as there is also a significant decrease in the abundance of RT-
PCR product representing full-length SMN transcripts. Several other housekeeping
genes like GAPDH can be used in place of SMN, to confirm whether there is a true
knock-down of ITGA4 transcripts. There was also a general decrease in the proportions
of ITGA4 transcripts with retained terminal intron with longer transfection (see
Appendix B). Collectively, the 24h and 48h transfections suggest enhanced AO
transport across the cell membrane with longer transfection duration.
5.2 Possible Mechanism of (Terminal) Intron Retention
Besides being alterable by AOs, splicing is also influenced by interactions between cis-
and trans-acting splicing factors (Will and Luhrmann, 2011), RNA secondary structure
(Hiller et. al., 2007) and more. Furthermore, splicing can be developmental stage-
and/or tissue-specific. While the attempt to alter the DMD transcript splicing pattern
was unsuccessful in both fibroblasts and myoblasts, a distinct difference in the
abundance of different DMD products between the two cell types supports tissue
specificity of splicing.
Chapter 5: Discussion
97
With detectable terminal intron retention being inducible by AOs only in LMNC and
ITGA4 transcripts, it is speculated that these transcripts may possess similar features
that are not present in or are different from LMNA, SOD1 and DMD transcripts, or that
the LMNA, SOD1 and DMD target sites evaluated were inappropriate. Intron retention
may arise when intronic splicing silencers (ISSs; Singh et. al., 2006) and/or exonic
splicing enhancers (ESEs) are blocked by AOs. Blocking of ESE(s) by the AOs could
possibly explain terminal intron retention in LMNC and ITGA4 transcripts, as all
LMNC- and ITGA4-targeting 2’-OMeAOs that induced terminal intron retention
targeted the last exon, with ITGA4_H28A(-6+19) that extends 6 bases into the last
intron as the only exception. Analysis of putative splicing factor binding sites using the
online software, SpliceAid 2 (http://193.206.120.249/splicing_tissue.html), showed that
the terminal intron retention-inducing 2’-OMeAOs cover ESEs where splicing factors
such as SR proteins and Tra2β bind (Appendix C). However, putative ESEs are also
present within LMNA, SOD1, and DMD sequences targeted by the 2’-OMeAOs, yet
terminal intron retention did not occur. On the other hand, blocking of the acceptor
splice site could explain terminal intron retention induced by ITGA4_H28A(-6+19).
Although terminal intron retention in LMNC and ITGA4 transcripts could not be
explained by the blocking of ESEs, it might have occurred via other mechanisms
discussed below.
Weak splice sites can potentially render a transcript more susceptible to intron retention,
and using Human Splicing Finder (http://www.umd.be/HSF3/HSF.html), it was found
that the retainable SMN terminal intron has a weak donor splice site, compared to the
pairing acceptor splice site (Price, personal communication; Appendix D). Therefore, a
possible cause of terminal intron retention within LMNC and ITGA4 transcripts is
decreased strength of the acceptor and donor splice sites of the terminal intron, as a
Chapter 5: Discussion
98
result of AO annealing. However, there is no trend in splice site strength that could
explain why terminal intron retention occurred in LMNC and ITGA4 transcripts only.
LMNC transcripts exhibit a similar trend to SMN transcripts, with a slightly weaker
donor splice site (87.66) relative to the acceptor splice site, whereas ITGA4 transcripts
have a strong donor splice site (96.87). A strong donor splice site for ITGA4 transcripts
that exhibit induced terminal intron retention once again indicates interplay of factors in
intron retention events, especially when SOD1 and DMD transcripts, which did not
show terminal intron retention, also have strong donor splice sites (Appendix D).
Notably, LMNA terminal intron has a very strong donor splice site (98.84), however, it
has a relatively weak acceptor splice site (84.59) that could possibly result in alternative
splicing and hence, explain the decreased levels of full-length LMNA transcript
expression. Collectively, the lack of a trend in splice site strength suggests that it is not
a major determining factor of intron retention and that other factors are involved. This
finding is in agreement with Sakabe’s and de Souza’s (2007) finding of a weak negative
correlation between splice site strength (measured using the Shapiro and Senapathy
scoring scheme) and intron retention frequency.
Short introns tend to be retained more readily, compared to longer introns. Retained
introns were reported to have a median length of 145±479nt (Zheng et. al., 2005), and a
mean length of 219±209nt (Sakabe and de Souza, 2007), showing that there is no clear
definition of a short intron. Six members of the human Kallikrein gene family (KLK)
exhibit retention of intron III and each of these genes has a short intron III (<150nt)
(Michael et. al., 2005), supporting an association between short intron length and intron
retention. This association is also justified by Dyskeratosis congenital 1 gene (DKC1),
where intron retention is also a common splicing event, and it has different isoforms
with retained introns ranging from 370nt to 596nt (Turano et. al., 2005). LMNC and
Chapter 5: Discussion
99
ITGA4 transcripts have terminal introns that are relatively similar in length (421nt and
496nt, respectively). Considering 421nt and 496nt introns short, the association between
short intron length and intron retention holds, and this feature becomes a possible
explanation for terminal intron retention in LMNC and ITGA4 transcripts. On the other
hand, SOD1 and DMD transcripts, which did not exhibit induced terminal intron
retention, have much longer terminal introns (1095nt and 4711nt, respectively).
Therefore, it seems likely that short intron length may determine whether terminal
intron retention is inducible. However, LMNA terminal intron (322nt) is shorter than
LMNC and ITGA4 terminal introns. Yet, detectable terminal intron retention was not
induced in LMNA transcripts, although AO intervention did appear to down-regulate the
full length, splice transcript. This supports the general consensus that splicing events are
dependent on interactions between multiple factors.
Lastly, RESCUE ESEs are present at lower densities within the retained terminal LMNC
and ITGA4 introns than in the SOD1 and DMD terminal introns that were not retained
(Appendix E), similar to the trend noted by Zheng et. al.(2005) and Sakabe and de
Souza (2007). Sakabe and de Souza (2007) also found that retained introns had slightly
higher densities (number of motifs/nucleotide) of SELEX-ESEs (SC35, SF2/ASF,
SRp40 and SRp55) than non-retained introns. LMNC terminal intron was found to have
a higher SELEX-ESE density than SOD1 and DMD terminal introns (Appendix E). This
could explain why the LMNC terminal intron was retained but not the SOD1 and DMD
terminal introns. However, SELEX-ESE density would not be useful in explaining
ITGA4 terminal intron retention, where the retained terminal intron has a lower SELEX-
ESE density than LMNA, SOD1, and DMD terminal introns (Appendix E). Noticeably,
LMNA terminal intron has the second highest SELEX-ESE density, which may support
the postulation of transient terminal intron retention in LMNA transcripts that was not
Chapter 5: Discussion
100
detected in RT-PCR analysis. Furthermore, Sakabe and de Souza (2007) found that
retained introns have higher densities of Class 2 FAS-ESSs (hex3 ESS set) and ISE
trinucleotide, GGG. Zheng et. al.(2005) also reported similar finding about higher ESS
frequency within retained introns compared to constitutive introns. Class 2 ESSs consist
of ESSs other than those containing TAGT or TAGGT (Wang et.al., 2006). LMNC and
SOD1 terminal introns, and ITGA4 and DMD terminal introns, were found to have
similar Class 2 ESS density, respectively (Appendix E). An explanation for terminal
intron retention in LMNC, and not SOD1, transcripts (in ITGA4 and not DMD), though
they have very similar ESS density, could be that long intron length overrides ESS
effects, since SOD1 terminal intron is approximately 2.5 times that of LMNC and DMD
terminal intron is approximately 10 times that of ITGA4. Even with a higher ESS
density, the relatively short LMNA terminal intron was not retained. Therefore, high
Class 2 ESS density and short intron length together could increase a transcript’s
susceptibility to induced terminal intron retention.
Overall, no features examined above can predict whether induced terminal intron
retention will occur. Nevertheless, there might be unexamined features that could
influence retention of the terminal intron. Moreover, the number of different gene
transcripts examined is too small to yield a well-substantiated conclusion on features
influencing AO-induced terminal intron retention.

Chapter 5: Discussion
101
5.3 Limitations
Besides the limitations of a small number of AOs tested for each gene transcript, and a
lack of variability in AO characteristics aforementioned, a major limitation encountered
in this project was the low proportion of terminal intron-retaining transcripts detected,
compared to full-length transcripts. However, the observation that AOs designed to
induce terminal intron retention did, in some instances, reduce the abundance of full-
length transcript product, is an important finding.
Preferential amplification of smaller sized products might have resulted in lower yields
of the larger terminal intron-retaining products, making RT-PCR product isolation and
DNA sequencing difficult. To overcome the difficulty in DNA isolation and sequencing
of the transcripts of interest, DNA cloning might be a solution, where purified DNA can
be cloned by inserting it into a plasmid vector. With multiple copies of the DNA-of-
interest, more DNA sample will be available for sequencing. Additionally, performing a
nuclear RNA extraction may also mean a greater proportion of transcripts with retained
terminal intron that will then lead to enhanced amplification of transcripts-of-interest
and hence, allow for better RT-PCR product isolation and DNA sequencing.
Another limitation encountered is that the lengths of the sequencing reads were
generally shorter than that of the DNA template. This means that the sequencing result
can only confirm whether the terminal intron was retained or not, and not whether the
transcript is the correct, entire full-length transcript with retained terminal intron. While
the terminal introns appeared to entirely retained, it is not known if alternative splicing
might have occurred at another site along the transcript resulting in a different sequence
that has similar length to full-length transcript with retained terminal intron. Since
shorter fragments were sequenced unexpectedly, multiple small fragments can be
Chapter 5: Discussion
102
sequenced using different primers and aligned to form the complete sequence, to check
for any alternative splicing at another site along the transcript. Alternatively, for DMD
experiments where the terminal intron is considerably large, two sets of primers
amplifying from an exon further upstream (e.g. exon 75) to a few hundred nucleotides
into the terminal intron (intron 78), and from a few hundred nucleotides of intron 78 3’-
end to somewhere within exon 79, could be used to check for intron retention. However,
these were not done due to time constraints as multiple gene transcripts were examined
and terminal intron retention in DMD was examined last. Incomplete sequencing could
be due to poor DNA quality and/or quantity that can be enhanced using nuclear RNA
extraction and cloning.
While terminal intron retention was consistently induced by two LMNC-targeting AOs
and three ITGA4-targeting AOs, the RT-PCR product representing transcripts with
retained terminal intron was missing in one to two samples in some experiments. This
means that results from these experiments cannot be used for semi-quantitative analysis.
In the end, only results from two experimental sets could be used, and the small sample
size compromises any statistical significance. In some cases, a trace of the band of
interest was visible when the gel was examined, but densitometry analysis was
impossible as the band was too faint to be detected and analysed by the software. In
other cases, the band was detectable on the image, but since the product abundance was
so low, the peak was small, making quantitative estimation difficult and probably
inaccurate. Nonetheless, the semi-quantitative analyses still provides an indication of
the magnitude of the AO effect on mRNA expression for these genes, but digital droplet
RT-PCR may be used to get a better and more accurate quantification of the terminal
intron-retaining transcripts that are present in low abundance.
Chapter 5: Discussion
103
5.4 Future Directions and Implications
Data from this pilot study on AO-induced terminal intron retention have provided
evidence that terminal intron retention could be induced, and that it appears to modulate
gene expression. The data will provide the basis for a more in-depth exploration of the
technique that could result in the novel application of induced terminal intron retention
as a strategy to downregulate the expression of genes associated with disease.
5.4.1 Western Analysis
Initially cited as an aim of the project, western analysis was not conducted due to time
constraints. Analysis of LMNC and ITGA4 in protein extracts from cells treated with
AOs designed to induce terminal intron retention, would be an important next step,
because a significant decrease in full-length mRNA expression could result in a
significant effect at the protein level. Therefore, the next step is to examine the effect of
terminal intron retention on LMNC and ITGA4 protein expression.
5.4.2 Experimental Modifications
As discussed above, low RNA yields and hence low amount of cDNA, of the desired
transcripts (i.e. transcripts with retained terminal intron) is one limitation encountered in
this project. Low nucleic acid yields can be due to intrinsic or extrinsic factors. Intrinsic
factors would include difficulty in inducing terminal intron retention within the specific
gene transcripts studied, and susceptibility to rapid degradation of transcripts with
retained terminal intron (Green et. al., 2003). Extrinsic factors could be associated with
experimental design, including but not limited to, the AO sequence, length, and
chemistry, transfection reagent, delivery method, transfection cell types and RNA
extraction method. While intrinsic factors are unchangeable, experimental design may
be modified to determine if terminal intron retention is impossible because it just cannot
Chapter 5: Discussion
104
be induced in that gene transcript, or is it because some extrinsic factors are preventing
it. Moreover, changing some elements of the experiment might even enhance the results
of terminal intron retention and modulation of full-length transcripts. For example, a
ratio of 2:1 (µl Lipofectin®:µg leashed PMO) was used in the project, but it was found
that using a ratio of 4:1 was most effective at inducing DMD exon skipping
(Arechavala-Gomeza et. al., 2007). Even though this was tested to be the best ratio to
use for exon skipping, it is also likely to be applicable to AO transfection for terminal
intron retention. In addition, since PMOs were determined to work better at higher
concentrations, transfections could be carried out using concentrations higher than
400nM, or using reagents, such as cell pentrating peptides used in nucleofection, to
enhance PMO uptake by the cells. In short, a small step forward from this project would
be to try altering some aspects of the experimental design, such as testing higher AO
concentrations and AOs with variable lengths, and examining nuclear RNA instead of
total cellular RNA, which were not done in this project. After optimal AO sequences are
identified, other modifications such as changing the chemistry of all or some
nucleotides of the AO, and testing cocktails of different AOs may be made.
Coincidentally, the gene transcripts selected for this project have the terminal intron
located within the normal protein coding region. It would be important to also study
induced retention of terminal introns located within the 3’-untranslated region (UTR),
as introns within the 3’- (and 5’-) UTRs have been discovered to play important roles in
regulation of gene expression as well, by interfering with nuclear export of intron-
retaining transcripts, translation, or eliciting NMD (Bicknell et. al., 2012). Moreover,
retained introns were found to be more prevalent in UTRs and non-coding RNAs, than
in protein coding regions of genes (Braunschweig et. al., 2014). Tissue-specific
expression and conservation of genes with intron within the 3’-UTR among human,

Chapter 5: Discussion
105
mice, and rats, suggest that such intron has some function (Bicknell et. al., 2012).
Besides being able to regulate gene expression by triggering NMD (Bicknell et. al.,
2012), 3’-UTR introns were also found to contain putative miRNA binding sites, and
this finding indicates another potential form of gene regulation provided by 3’-UTR
introns (Price, unpublished data; Tan et. al., 2007), making investigating retention of
terminal introns within 3’-UTRs an interesting topic.
5.4.3 Implications
Retaining the terminal intron within a gene transcript by using an AO, as shown to be
possible in this project, may ultimately be developed as a novel therapeutic strategy if
sufficient impact on gene expression is achieved. Decreased levels of full-length LMNC
and ITGA4 transcripts due to terminal intron retention could have a therapeutic effect by
down-regulating expression of a transcript transcribed from mutated LMNA/C and in
diseases such as multiple sclerosis, where ITGA4 is implicated in excessive
inflammatory response, respectively.
Chapter 6: Conclusion
106
6. Conclusion
In summary, the results show that terminal intron retention is inducible in LMNC and
ITGA4 transcripts using 2’-OMeAOs, while it is postulated to have occurred in LMNA
transcripts. Inclusion of the terminal intron decreases full-length LMNC and ITGA4
mRNA expression, whereas the effect on protein expression was not determined. In
addition, using the PMO chemistry resulted in a reduced effect on induced terminal
intron retention compared to when 2’-OMeAOs were used. Overall, this project is just a
preliminary study demonstrating that terminal intron retention is inducible in human
gene transcripts other than SMN transcripts, and a larger scale study involving more
gene transcripts and/or increased range of factors would be required to draw better
conclusions.
Reference
107
Reference
Aartsma-Rus, A., Janson, A. A., Kaman, W. E., Bremmer-Bout, M., Den Dunnen, J. T.,
Baas, F., Van Ommen, G. J. & Van Deutekom, J. C. 2003. Therapeutic
antisense-induced exon skipping in cultured muscle cells from six different
DMD patients. Hum Mol Genet, 12(8): 907-914.
Aartsma-Rus, A., Janson, A. A., Van Ommen, G. J. & Van Deutekom, J. C. 2007.
Antisense-induced exon skipping for duplications in Duchenne muscular
dystrophy. BMC Med Genet, 8: 43. doi:10.1186/1471-2350-1188-1143.
Adams, A. M., Harding, P. L., Iversen, P. L., Coleman, C., Fletcher, S. & Wilton, S. D.
2007. Antisense oligonucleotide induced exon skipping and the dystrophin gene
transcript: cocktails and chemistries. BMC Mol Biol, 8: 57.
Araki, E., Nakamura, K., Nakao, K., Kameya, S., Kobayashi, T., Kobayashi, O.,
Nonaka, I. & Katsuki, M. 1997. Targeted Disruption of Exon 52 in the Mouse
Dystrophin Gene Induced Muscle Degeneration Similar to That Observed in
Duchenne Muscular Dystrophy. Biochemical and biophysical research
communications, 238(2): 492-497.
Arechavala-Gomeza, V., Graham, I. R., Popplewell, L. J., Adams, A. M., Aartsma-Rus,
A., Kinali, M., Morgan, J. E., Van Deutekom, J. C., Wilton, S. D., Dickson, G.
& Muntoni, F. 2007. Comparative analysis of antisense oligonucleotide
sequences for targeted skipping of exon 51 during dystrophin pre-mRNA
splicing in human muscle. Hum Gene Ther, 18(9): 798-810.
Bai, Y., Ji, S. & Wang, Y. 2015. IRcall and IRclassifier: two methods for flexible
detection of intron retention events from RNA-Seq data. BMC Genomics, 16
(Suppl 2): S9.
Baughan, T. D., Dickson, A., Osman, E. Y. & Lorson, C. L. 2009. Delivery of
bifunctional RNAs that target an intronic repressor and increase SMN levels in
an animal model of spinal muscular atrophy. Human molecular genetics, 18(9):
1600-1611.
Bell, T. J., Miyashiro, K. Y., Sul, J. Y., Mccullough, R., Buckley, P. T., Jochems, J.,
Meaney, D. F., Haydon, P., Cantor, C., Parsons, T. D. & Eberwine, J. 2008.
Cytoplasmic BK(Ca) channel intron-containing mRNAs contribute to the
intrinsic excitability of hippocampal neurons. Proc Natl Acad Sci U S A, 105(6):
1901-1906.
Bergeron, D., Pal, G., Beaulieu, Y. B., Chabot, B. & Bachand, F. 2015. Regulated
Intron Retention and Nuclear Pre-mRNA Decay Contribute to PABPN1
Autoregulation. Molecular and cellular biology, 35(14): 2503-2517.
Reference
108
Bessa, C., Teixeira, C. A., Dias, A., Alves, M., Rocha, S., Lacerda, L., Loureiro, L.,
Guimaraes, A. & Ribeiro, M. G. 2008. CLN2/TPP1 deficiency: the novel
mutation IVS7-10A>G causes intron retention and is associated with a mild
disease phenotype. Mol Genet Metab, 93(1): 66-73.
Bicknell, A. A., Cenik, C., Chua, H. N., Roth, F. P. & Moore, M. J. 2012. Introns in
UTRs: why we should stop ignoring them. Bioessays, 34(12): 1025-1034.
Blazquez, L., Aiastui, A., Goicoechea, M., Martins De Araujo, M., Avril, A., Beley, C.,
Garcia, L., Valcarcel, J., Fortes, P. & Lopez De Munain, A. 2013. In vitro
correction of a pseudoexon-generating deep intronic mutation in LGMD2A by
antisense oligonucleotides and modified small nuclear RNAs. Hum Mutat,
34(10): 1387-1395.
Boise, L. H., González-García, M., Postema, C. E., Ding, L., Lindsten, T., Turka, L. A.,
Mao, X., Nuñez, G. & Thompson, C. B. 1993. bcl-x, a bcl-2-related gene that
functions as a dominant regulator of apoptotic cell death. Cell, 74(4): 597-608.
Boutz, P. L., Chawla, G., Stoilov, P. & Black, D. L. 2007a. MicroRNAs regulate the
expression of the alternative splicing factor nPTB during muscle development.
Genes Dev, 21(1): 71-84.
Boutz, P. L., Stoilov, P., Li, Q., Lin, C. H., Chawla, G., Ostrow, K., Shiue, L., Ares, M.,
Jr. & Black, D. L. 2007b. A post-transcriptional regulatory switch in
polypyrimidine tract-binding proteins reprograms alternative splicing in
developing neurons. Genes Dev, 21(13): 1636-1652.
Braunschweig, U., Barbosa-Morais, N. L., Pan, Q., Nachman, E. N., Alipanahi, B.,
Gonatopoulos-Pournatzis, T., Frey, B., Irimia, M. & Blencowe, B. J. 2014.
Widespread intron retention in mammals functionally tunes transcriptomes.
Genome Res, 24(11): 1774-1786.
Brett, D., Pospisil, H., Valcarcel, J., Reich, J. & Bork, P. 2002. Alternative splicing and
genome complexity. Nat Genet, 30(1): 29-30.
Buckley, P. T., Khaladkar, M., Kim, J. & Eberwine, J. 2014. Cytoplasmic intron
retention, function, splicing, and the sentinel RNA hypothesis. Wiley Interdiscip
Rev RNA, 5(2): 223-230.
Burtis, K. C. & Baker, B. S. 1989. Drosophila doublesex gene controls somatic sexual
differentiation by producing alternatively spliced mRNAs encoding related sex-
specific polypeptides. Cell, 56(6): 997-1010.
Busslinger, M., Moschonas, N. & Flavell, R. A. 1981. Beta + thalassemia: aberrant
splicing results from a single point mutation in an intron. Cell, 27(Pt 1): 289-298.
Reference
109
Cáceres, J. F. & Kornblihtt, A. R. 2002. Alternative splicing: multiple control
mechanisms and involvement in human disease. Trends Genet, 18(4): 186-193.
Cagliani, R., Sironi, M., Ciafaloni, E., Bardoni, A., Fortunato, F., Prelle, A., Serafini,
M., Bresolin, N. & Comi, G. P. 2004. An intragenic deletion/inversion event in
the DMD gene determines a novel exon creation and results in a BMD
phenotype. Human genetics, 115(1): 13-18.
Calvanese, V., Mallya, M., Campbell, R. D. & Aguado, B. 2008. Regulation of
expression of two LY-6 family genes by intron retention and transcription
induced chimerism. BMC Molecular Biology, 9: 81. doi:10.1186/1471-2199-
1189-1181.
Carmody, S. R. & Wente, S. R. 2009. mRNA nuclear export at a glance. Journal of cell
science, 122(12): 1933-1937.
Castellanos, E., Rosas, I., Solanes, A., Bielsa, I., Lazaro, C., Carrato, C., Hostalot, C.,
Prades, P., Roca-Ribas, F., Blanco, I., Serra, E. & Hugtip-Ico-Imppc, N. F. M. C.
2013. In vitro antisense therapeutics for a deep intronic mutation causing
Neurofibromatosis type 2. Eur J Hum Genet, 21(7): 769-773.
Cavalieri, S., Pozzi, E., Gatti, R. A. & Brusco, A. 2013. Deep-intronic ATM mutation
detected by genomic resequencing and corrected in vitro by antisense
morpholino oligonucleotide (AMO). Eur J Hum Genet, 21(7): 774-778.
Chang, S. H., Elemento, O., Zhang, J., Zhuang, Z. W., Simons, M. & Hla, T. 2014.
ELAVL1 regulates alternative splicing of eIF4E transporter to promote postnatal
angiogenesis. Proc Natl Acad Sci U S A, 111(51): 18309-18314.
Chih, B., Gollan, L. & Scheiffele, P. 2006. Alternative splicing controls selective trans-
synaptic interactions of the neuroligin-neurexin complex. Neuron, 51(2): 171-
178.
Clayton, N. P., Nelson, C. A., Weeden, T., Taylor, K. M., Moreland, R. J., Scheule, R.
K., Leger, A. J., Phillips, L., Cheng, S. H. & Wentworth, B. M. 2015. Antisense
oligonucleotide-mediated suppression of muscle glycogen synthase 1 synthesis
as an approach for substrate reduction therapy of Pompe disease. Molecular
genetics and metabolism, 3: e206. doi:210.1038/mtna.2014.1057.
Coelho, M. B. & Smith, C. W. J. 2014. Regulation of alternative pre-mRNA splicing. In
Spliceosomal Pre-mRNA Splicing: Methods and Protocols, Methods in
Molecular Biology, edited by Klemens J. Hertel, 55-82. Springer
Science+Business Media.
Reference
110
Dhir, A. & Buratti, E. 2010. Alternative splicing: role of pseudoexons in human disease
and potential therapeutic strategies. FEBS J, 277(4): 841-855.
Dickson, A., Osman, E. & Lorson, C. L. 2008. A negatively acting bifunctional RNA
increases survival motor neuron both in vitro and in vivo. Human Gene Therapy,
19(11): 1307-1315.
Dominov, J. A., Uyan, O., Sapp, P. C., Mckenna-Yasek, D., Nallamilli, B. R., Hegde, M.
& Brown, R. H., Jr. 2014. A novel dysferlin mutant pseudoexon bypassed with
antisense oligonucleotides. Ann Clin Transl Neurol, 1(9): 703-720.
Dominski, Z. & Kole, R. 1993. Restoration of correct splicing in thalassemic pre-
mRNA by antisense oligonucleotides. Proc Natl Acad Sci U S A, 90(18): 8673-
8677.
Echigoya, Y., Aoki, Y., Miskew, B., Panesar, D., Touznik, A., Nagata, T., Tanihata, J.,
Nakamura, A., Nagaraju, K. & Yokota, T. 2015. Long-term efficacy of systemic
multiexon skipping targeting dystrophin exons 45-55 with a cocktail of vivo-
morpholinos in mdx52 mice. Mol Ther Nucleic Acids, 4:
e225.doi:210.1038/mtna.2014.1076.
Egecioglu, D. E. & Chanfreau, G. 2011. Proofreading and spellchecking: a two-tier
strategy for pre-mRNA splicing quality control. RNA, 17(3): 383-389.
Evers, M. M., Tran, H.-D., Zalachoras, I., Meijer, O. C., Den Dunnen, J. T., Van
Ommen, G.-J. B., Aartsma-Rus, A. & Van Roon-Mom, W. M. C. 2014.
Preventing Formation of Toxic N-Terminal Huntingtin Fragments Through
Antisense Oligonucleotide-Mediated Protein Modification. Nucleic acid
therapeutics, 24(1): 4-12.
Faustino, N. A. & Cooper, T. A. 2003. Pre-mRNA splicing and human disease. Genes
Dev, 17(4): 419-437.
Flanagan, S. E., Xie, W., Caswell, R., Damhuis, A., Vianey-Saban, C., Akcay, T.,
Darendeliler, F., Bas, F., Guven, A., Siklar, Z., Ocal, G., Berberoglu, M.,
Murphy, N., O'sullivan, M., Green, A., Clayton, P. E., Banerjee, I., Clayton, P.
T., Hussain, K., Weedon, M. N. & Ellard, S. 2013. Next-generation sequencing
reveals deep intronic cryptic ABCC8 and HADH splicing founder mutations
causing hyperinsulinism by pseudoexon activation. Am J Hum Genet, 92(1):
131-136.
Forrest, S. T., Barringhaus, K. G., Perlegas, D., Hammarskjold, M.-L. & Mcnamara, C.
A. 2004. Intron Retention Generates a Novel Id3 Isoform That Inhibits Vascular
Lesion Formation. Journal of Biological Chemistry, 279(31): 32897-32903.

Reference
111
Gamazon, E. R. & Stranger, B. E. 2014. Genomics of alternative splicing: evolution,
development and pathophysiology. Hum Genet, 133(6): 679-687.
Garcia-Blanco, M. A., Baraniak, A. P. & Lasda, E. L. 2004. Alternative splicing in
disease and therapy. Nat Biotechnol, 22(5): 535-546.
Goodison, S., Yoshida, K., Churchman, M. & Tarin, D. 1998. Multiple Intron Retention
Occurs in Tumor Cell CD44 mRNA Processing. The American Journal of
Pathology, 153(4): 1221-1228.
Gramlich, M., Pane, L. S., Zhou, Q., Chen, Z., Murgia, M., Schotterl, S., Goedel, A.,
Metzger, K., Brade, T., Parrotta, E., Schaller, M., Gerull, B., Thierfelder, L.,
Aartsma-Rus, A., Labeit, S., Atherton, J. J., Mcgaughran, J., Harvey, R. P.,
Sinnecker, D., Mann, M., Laugwitz, K. L., Gawaz, M. P. & Moretti, A. 2015.
Antisense-mediated exon skipping: a therapeutic strategy for titin-based dilated
cardiomyopathy. EMBO Mol Med, doi:10.15252/emmm.201505047.
Graveley, B. R. 2001. Alternative splicing: increasing diversity in the proteomic world.
Trends Genet, 17(2): 100-107.
Green, R. E., Lewis, B. P., Hillman, R. T., Blanchette, M., Lareau, L. F., Garnett, A. T.,
Rio, D. C. & Brenner, S. E. 2003. Widespread predicted nonsense-mediated
mRNA decay of alternatively-spliced transcripts of human normal and disease
genes. Bioinformatics, 19(1): i118-i121.
Greer, K., Mizzi, K., Rice, E., Kuster, L., Barrero, R. A., Bellgard, M. I., Lynch, B. J.,
Foley, A. R., O Rathallaigh, E., Wilton, S. D. & Fletcher, S. 2015. Pseudoexon
activation increases phenotype severity in a Becker muscular dystrophy patient.
Molecular Genetics & Genomic Medicine: n/a-n/a.
Greer, K. L., Lochmuller, H., Flanigan, K., Fletcher, S. & Wilton, S. D. 2014. Targeted
exon skipping to correct exon duplications in the dystrophin gene. Mol Ther
Nucleic Acids, 3: e155. doi:110.1038/mtna.2014.1038.
Gurvich, O. L., Tuohy, T. M., Howard, M. T., Finkel, R. S., Medne, L., Anderson, C. B.,
Weiss, R. B., Wilton, S. D. & Flanigan, K. M. 2008. DMD pseudoexon
mutations: splicing efficiency, phenotype, and potential therapy. Ann Neurol,
63(1): 81-89.
Gygi, S. P., Zhou, Z., Licklider, L. J. & Reed, R. 2002. Comprehensive proteomic
analysis of the human spliceosome. Nature, 419(6903): 182-185.
Hamid, F. M. & Makeyev, E. V. 2014. Regulation of mRNA abundance by
polypyrimidine tract-binding protein-controlled alternate 5' splice site choice.
PLoS genetics, 10(11): e1004771. doi:1004710.1001371/journal.pgen.1004771.
Reference
112
Harding, P. L., Fall, A. M., Honeyman, K., Fletcher, S. & Wilton, S. D. 2007. The
influence of antisense oligonucleotide length on dystrophin exon skipping. Mol
Ther, 15(1): 157-166.
Heemskerk, H. A., De Winter, C. L., De Kimpe, S. J., Van Kuik-Romeijn, P.,
Heuvelmans, N., Platenburg, G. J., Van Ommen, G. J., Van Deutekom, J. C. &
Aartsma-Rus, A. 2009. In vivo comparison of 2'-O-methyl phosphorothioate and
morpholino antisense oligonucleotides for Duchenne muscular dystrophy exon
skipping. J Gene Med, 11(3): 257-266.
Hiller, M., Zhang, Z., Backofen, R. & Stamm, S. 2007. Pre-mRNA secondary structures
influence exon recognition. PLoS Genet, 3(11): e204.
Homolova, K., Zavadakova, P., Doktor, T. K., Schroeder, L. D., Kozich, V. & Andresen,
B. S. 2010. The deep intronic c.903+469T>C mutation in the MTRR gene
creates an SF2/ASF binding exonic splicing enhancer, which leads to
pseudoexon activation and causes the cblE type of homocystinuria. Human
mutation, 31(4): 437-444.
Hua, Y., Sahashi, K., Hung, G., Rigo, F., Passini, M. A., Bennett, C. F. & Krainer, A. R.
2010. Antisense correction of SMN2 splicing in the CNS rescues necrosis in a
type III SMA mouse model. Genes and Development, 24(15): 1634-1644.
Hube, F. & Francastel, C. 2015. Mammalian Introns: When the Junk Generates
Molecular Diversity. Int J Mol Sci, 16(3): 4429-4452.
Hutton, M., Lendon, C. L., Rizzu, P., Baker, M., Froelich, S., Houlden, H., Pickering-
Brown, S., Chakraverty, S., Isaacs, A., Grover, A., Hackett, J., Adamson, J.,
Lincoln, S., Dickson, D., Davies, P., Petersen, R. C., Stevens, M., De Graaff, E.,
Wauters, E., Van Baren, J., Hillebrand, M., Joosse, M., Kwon, J. M., Nowotny,
P., Che, L. K., Norton, J., Morris, J. C., Reed, L. A., Trojanowski, J., Basun, H.,
Lannfelt, L., Neystat, M., Fahn, S., Dark, F., Tannenberg, T., Dodd, P. R.,
Hayward, N., Kwok, J. B., Schofield, P. R., Andreadis, A., Snowden, J.,
Craufurd, D., Neary, D., Owen, F., Oostra, B. A., Hardy, J., Goate, A., Van
Swieten, J., Mann, D., Lynch, T. & Heutink, P. 1998. Association of missense
and 5'-splice-site mutations in tau with the inherited dementia FTDP-17. Nature,
393(6686): 702-705.
Hyvonen, M. T., Uimari, A., Keinanen, T. A., Heikkinen, S., Pellinen, R., Wahlfors, T.,
Korhonen, A., Narvanen, A., Wahlfors, J., Alhonen, L. & Janne, J. 2006.
Polyamine-regulated unproductive splicing and translation of
spermidine/spermine N1-acetyltransferase. RNA, 12(8): 1569-1582.

Reference
113
Ichtchenko, K., Hata, Y., Nguyen, T., Ullrich, B., Missler, M., Moomaw, C. & Sudhof,
T. C. 1995. Neuroligin 1: a splice site-specific ligand for beta-neurexins. Cell,
81(3): 435-443.
Kalsotra, A., Wang, K., Li, P. F. & Cooper, T. A. 2010. MicroRNAs coordinate an
alternative splicing network during mouse postnatal heart development. Genes
Dev, 24(7): 653-658.
Keil, J. M., Seo, J., Howell, M. D., Hsu, W. H., Singh, R. N. & Didonato, C. J. 2014. A
short antisense oligonucleotide ameliorates symptoms of severe mouse models
of spinal muscular atrophy. Mol Ther Nucleic Acids, 3: e174.
doi:110.1038/mtna.2014.1023.
Khaladkar, M., Buckley, P. T., Lee, M. T., Francis, C., Eghbal, M. M., Chuong, T.,
Suresh, S., Kuhn, B., Eberwine, J. & Kim, J. 2013. Subcellular RNA sequencing
reveals broad presence of cytoplasmic intron-sequence retaining transcripts in
mouse and rat neurons. PLoS One, 8(10): e76194.
doi:76110.71371/journal.pone.0076194.
Khelifi, M. M., Ishmukhametova, A., Khau Van Kien, P., Thorel, D., Mechin, D.,
Perelman, S., Pouget, J., Claustres, M. & Tuffery-Giraud, S. 2011. Pure intronic
rearrangements leading to aberrant pseudoexon inclusion in dystrophinopathy: a
new class of mutations? Hum Mutat, 32(4): 467-475.
Kishore, S. & Stamm, S. 2006. The snoRNA HBII-52 Regulates Alternative Splicing of
the Serotonin Receptor 2C. Science, 311(5758): 230-232.
Kollberg, G., Tulinius, M., Melberg, A., Darin, N., Andersen, O., Holmgren, D.,
Oldfors, A. & Holme, E. 2009. Clinical manifestation and a new ISCU mutation
in iron-sulphur cluster deficiency myopathy. Brain, 132(Pt 8): 2170-2179.
Krecic, A. M. & Swanson, M. S. 1999. hnRNP complexes: composition, structure, and
function. Current opinion in cell biology, 11(3): 363-371.
Lareau, L. F., Brooks, A. N., Soergel, D. a. W., Meng, Q. & Brenner, S. E. 2007. The
coupling of alternative splicing and nonsense-mediated mRNA decay. In
Alternative splicing in the postgenomic era, edited by Benjamin J. Blencowe and
Brenton R. Graveley, 190-212. Landes Bioscience.
Le Hir, H., Charlet-Berguerand, N., De Franciscis, V. & Thermes, C. 2002. 5'-End RET
splicing: absence of variants in normal tissues and intron retention in
pheochromocytomas. Oncology, 63(1): 84-91.
Reference
114
Lewis, B. P., Green, R. E. & Brenner, S. E. 2003. Evidence for the widespread coupling
of alternative splicing and nonsense-mediated mRNA decay in humans. Proc
Natl Acad Sci U S A, 100(1): 189-192.
Li, Q., Lee, J. A. & Black, D. L. 2007. Neuronal regulation of alternative pre-mRNA
splicing. Nat Rev Neurosci, 8(11): 819-831.
Licatalosi, D. D. & Darnell, R. B. 2006. Splicing Regulation in Neurologic Disease.
Neuron, 52(1): 93-101.
Lim, S. R. & Hertel, K. J. 2001. Modulation of survival motor neuron pre-mRNA
splicing by inhibition of alternative 3' splice site pairing. J Biol Chem, 276(48):
45476-45483.
Lokody, I. 2014. Alternative splicing: aberrant splicing promotes colon tumour growth.
Nat Rev Cancer, 14(6): 382-383.
Lu, Q. L., Cirak, S. & Partridge, T. 2014. What Can We Learn From Clinical Trials of
Exon Skipping for DMD? Molecular Therapy-Nucleic Acids, 3(3): e152.
doi:110.1038/mtna.2014.1036.
Luco, R. F. & Misteli, T. 2011. More than a splicing code: integrating the role of RNA,
chromatin and non-coding RNA in alternative splicing regulation. Current
opinion in genetics & development, 21(4): 366-372.
Madden, H. R., Fletcher, S., Davis, M. R. & Wilton, S. D. 2009. Characterization of a
complex Duchenne muscular dystrophy-causing dystrophin gene inversion and
restoration of the reading frame by induced exon skipping. Human mutation,
30(1): 22-28.
Madocsai, C., Lim, S. R., Geib, T., Lam, B. J. & Hertel, K. J. 2005. Correction of
SMN2 Pre-mRNA splicing by antisense U7 small nuclear RNAs. Molecular
Therapy, 12(6): 1013-1022.
Manley, J. L. & Tacke, R. 1996. SR proteins and splicing control. Genes and
Development, 10(13): 1569-1579.
Mann, C. J., Honeyman, K., Cheng, A. J., Ly, T., Lloyd, F., Fletcher, S., Morgan, J. E.,
Partridge, T. A. & Wilton, S. D. 2001. Antisense-induced exon skipping and
synthesis of dystrophin in the mdx mouse. Proc Natl Acad Sci U S A, 98(1): 42-
47.
Mann, C. J., Honeyman, K., Mcclorey, G., Fletcher, S. & Wilton, S. D. 2002. Improved
antisense oligonucleotide induced exon skipping in the mdx mouse model of
muscular dystrophy. J Gene Med, 4(6): 644-654.

Reference
115
Manning, J. & O’malley, D. 2015. What has the mdx mouse model of duchenne
muscular dystrophy contributed to our understanding of this disease? Journal of
muscle research and cell motility, 36(2): 155-167.
Mansilla, A., Lopez-Sanchez, C., De La Rosa, E. J., Garcia-Martinez, V., Martinez-
Salas, E., De Pablo, F. & Hernandez-Sanchez, C. 2005. Developmental
regulation of a proinsulin messenger RNA generated by intron retention. EMBO
Rep, 6(12): 1182-1187.
Mendell, J. R., Rodino-Klapac, L. R., Sahenk, Z., Roush, K., Bird, L., Lowes, L. P.,
Alfano, L., Gomez, A. M., Lewis, S., Kota, J., Malik, V., Shontz, K., Walker, C.
M., Flanigan, K. M., Corridore, M., Kean, J. R., Allen, H. D., Shilling, C., Melia,
K. R., Sazani, P., Saoud, J. B., Kaye, E. M. & Eteplirsen Study, G. 2013.
Eteplirsen for the treatment of Duchenne muscular dystrophy. Ann Neurol, 74(5):
637-647.
Michael, I. P., Kurlender, L., Memari, N., Yousef, G. M., Du, D., Grass, L., Stephan, C.,
Jung, K. & Diamandis, E. P. 2005. Intron Retention: A Common Splicing Event
within the Human Kallikrein Gene Family. Clinical chemistry, 51(3): 506-515.
Mitrpant, C., Porensky, P., Zhou, H., Price, L., Muntoni, F., Fletcher, S., Wilton, S. D.
& Burghes, A. H. 2013. Improved antisense oligonucleotide design to suppress
aberrant SMN2 gene transcript processing: towards a treatment for spinal
muscular atrophy. PLoS One, 8(4):
e62114.doi:62110.61371/journal.pone.0062114.
Mollet, I. G., Ben-Dov, C., Felicio-Silva, D., Grosso, A. R., Eleuterio, P., Alves, R.,
Staller, R., Silva, T. S. & Carmo-Fonseca, M. 2010. Unconstrained mining of
transcript data reveals increased alternative splicing complexity in the human
transcriptome. Nucleic Acids Res, 38(14): 4740-4754.
Muchir, A., Bonne, G., Van Der Kooi, A. J., Van Meegen, M., Baas, F., Bolhuis, P. A.,
De Visser, M. & Schwartz, K. 2000. Identification of mutations in the gene
encoding lamins A/C in autosomal dominant limb girdle muscular dystrophy
with atrioventricular conduction disturbances (LGMD1B). Hum Mol Genet, 9(9):
1453-1459.
Muntoni, F., Torelli, S. & Ferlini, A. 2003. Dystrophin and mutations: one gene, several
proteins, multiple phenotypes. Lancet Neurology, 2(12): 731-740.
Norris, A. D. & Calarco, J. A. 2012. Emerging Roles of Alternative Pre-mRNA
Splicing Regulation in Neuronal Development and Function. Front Neurosci,
6.doi: 10.3389/fnins.2012.00122.
Reference
116
Osman, E. Y., Miller, M. R., Robbins, K. L., Lombardi, A. M., Atkinson, A. K., Brehm,
A. J. & Lorson, C. L. 2014. Morpholino antisense oligonucleotides targeting
intronic repressor Element1 improve phenotype in SMA mouse models. Hum
Mol Genet, 23(18): 4832-4845.
Osman, E. Y., Yen, P.-F. & Lorson, C. L. 2012. Bifunctional RNAs targeting the
intronic splicing silencer N1 increase SMN levels and reduce disease severity in
an animal model of spinal muscular atrophy. Molecular Therapy, 20(1): 119-126.
Osorio, F. G., Navarro, C. L., Cadinanos, J., Lopez-Mejia, I. C., Quiros, P. M., Bartoli,
C., Rivera, J., Tazi, J., Guzman, G., Varela, I., Depetris, D., De Carlos, F., Cobo,
J., Andres, V., De Sandre-Giovannoli, A., Freije, J. M., Levy, N. & Lopez-Otin,
C. 2011. Splicing-directed therapy in a new mouse model of human accelerated
aging. Sci Transl Med, 3(106): 106ra107.
Palhais, B., Praestegaard, V. S., Sabaratnam, R., Doktor, T. K., Lutz, S., Burda, P.,
Suormala, T., Baumgartner, M., Fowler, B., Bruun, G. H., Andersen, H. S.,
Kozich, V. & Andresen, B. S. 2015. Splice-shifting oligonucleotide (SSO)
mediated blocking of an exonic splicing enhancer (ESE) created by the prevalent
c.903+469T>C MTRR mutation corrects splicing and restores enzyme activity
in patient cells. Nucleic Acids Res, doi: 10.1093/nar/gkv275.
Pan, Q., Shai, O., Lee, L. J., Frey, B. J. & Blencowe, B. J. 2008. Deep surveying of
alternative splicing complexity in the human transcriptome by high-throughput
sequencing. Nat Genet, 40(12): 1413-1415.
Passini, M. A., Bu, J., Richards, A. M., Kinnecom, C., Sardi, S. P., Stanek, L. M., Hua,
Y. M., Rigo, F., Matson, J., Hung, G., Kaye, E. M., Shihabuddin, L. S., Krainer,
A. R., Bennett, C. F. & Cheng, S. H. 2011. Antisense Oligonucleotides
Delivered to the Mouse CNS Ameliorate Symptoms of Severe Spinal Muscular
Atrophy. Science Translational Medicine, 3(72): 72ra18.
Petruzzella, V., Panelli, D., Torraco, A., Stella, A. & Papa, S. 2005. Mutations in the
NDUFS4 gene of mitochondrial complex I alter stability of the splice variants.
FEBS Lett, 579(17): 3770-3776.
Porensky, P. N., Mitrpant, C., Mcgovern, V. L., Bevan, A. K., Foust, K. D., Kaspar, B.
K., Wilton, S. D. & Burghes, A. H. M. 2012. A single administration of
morpholino antisense oligomer rescues spinal muscular atrophy in mouse.
Human molecular genetics, 21(7): 1625-1638.
Pros, E., Fernandez-Rodriguez, J., Canet, B., Benito, L., Sanchez, A., Benavides, A.,
Ramos, F. J., Lopez-Ariztegui, M. A., Capella, G., Blanco, I., Serra, E. & Lazaro,
C. 2009. Antisense therapeutics for neurofibromatosis type 1 caused by deep
intronic mutations. Hum Mutat, 30(3): 454-462.
Reference
117
Quesnel-Vallieres, M., Irimia, M., Cordes, S. P. & Blencowe, B. J. 2015. Essential roles
for the splicing regulator nSR100/SRRM4 during nervous system development.
Genes Dev, 29(7): 746-759.
Rando, T. A. & Blau, H. M. 1994. Primary mouse myoblast purification,
characterization, and transplantation for cell-mediated gene therapy. J Cell Biol,
125(6): 1275-1287.
Rimoldi, V., Solda, G., Asselta, R., Spena, S., Stuani, C., Buratti, E. & Duga, S. 2013.
Dual role of G-runs and hnRNP F in the regulation of a mutation-activated
pseudoexon in the fibrinogen gamma-chain transcript. PLoS One, 8(3): e59333.
doi:59310.51371/journal.pone.0059333.
Sakabe, N. J. & De Souza, S. J. 2007. Sequence features responsible for intron retention
in human. BMC Genomics, 8: 59.
Sanaker, P. S., Toompuu, M., Mcclorey, G. & Bindoff, L. A. 2012. Antisense
oligonucleotide corrects splice abnormality in hereditary myopathy with lactic
acidosis. Gene, 494(2): 231-236.
Shepard, P. J. & Hertel, K. J. 2009. The SR protein family. Genome Biol, 10(10): 242.
Singh, N. K., Singh, N. N., Androphy, E. J. & Singh, R. N. 2006. Splicing of a critical
exon of human Survival Motor Neuron is regulated by a unique silencer element
located in the last intron. Mol Cell Biol, 26(4): 1333-1346.
Singh, N. N., Lawler, M. N., Ottesen, E. W., Upreti, D., Kaczynski, J. R. & Singh, R. N.
2013. An intronic structure enabled by a long-distance interaction serves as a
novel target for splicing correction in spinal muscular atrophy. Nucleic acids
research, 41(17): 8144-8165.
Singh, N. N., Lee, B. M. & Singh, R. N. 2015. Splicing regulation in spinal muscular
atrophy by an RNA structure formed by long-distance interactions. Ann N Y
Acad Sci, 1341: 176-187.
Sivanesan, S., Howell, M. D., Didonato, C. J. & Singh, R. N. 2013. Antisense
oligonucleotide mediated therapy of spinal muscular atrophy. Transl Neurosci, 4.
doi:10.2478/s13380-013-0109-2.
Spena, S., Asselta, R., Plate, M., Castaman, G., Duga, S. & Tenchini, M. L. 2007.
Pseudo-exon activation caused by a deep-intronic mutation in the fibrinogen
gamma-chain gene as a novel mechanism for congenital afibrinogenaemia.
British journal of haematology, 139(1): 128-132.

Reference
118
Staropoli, J. F., Li, H., Chun, S. J., Allaire, N., Cullen, P., Thai, A., Fleet, C. M., Hua,
Y., Bennett, C. F., Krainer, A. R., Kerr, D., Mccampbell, A., Rigo, F. & Carulli,
J. P. 2015. Rescue of gene-expression changes in an induced mouse model of
spinal muscular atrophy by an antisense oligonucleotide that promotes inclusion
of SMN2 exon 7. Genomics, 105(4): 220-228.
Stévenin, J., Soret, J., Dooghe, Y., Sureau, A. & Gattoni, R. 2001. SC35 autoregulates
its expression by promoting splicing events that destabilize its mRNAs. The
EMBO journal, 20(7): 1785-1796.
Sud, R., Geller, E. T. & Schellenberg, G. D. 2014. Antisense-mediated Exon Skipping
Decreases Tau Protein Expression: A Potential Therapy For Tauopathies. Mol
Ther Nucleic Acids, 3: e180. doi:110.1038/mtna.2014.1030.
Sugnet, C. W., Kent, W. J., Ares, J. M. & Haussler, D. 2004. Transcriptome and
genome conservation of alternative splicing events in humans and mice. Pacific
Symposium on Biocomputing.Pacific Symposium on Biocomputing: 66.
Tan, S., Guo, J., Huang, Q., Chen, X., Li-Ling, J., Li, Q. & Ma, F. 2007. Retained
introns increase putative microRNA targets within 3' UTRs of human mRNA.
FEBS Lett, 581(6): 1081-1086.
Tuffery-Giraud, S., Saquet, C., Chambert, S. & Claustres, M. 2003. Pseudoexon
activation in the DMD gene as a novel mechanism for Becker muscular
dystrophy. Hum Mutat, 21(6): 608-614.
Turano, M., Angrisani, A., Di Maio, N. & Furia, M. 2013. Intron retention: a human
DKC1 gene common splicing event. Biochem Cell Biol, 91(6): 506-512.
Unsworth, B. R., Hayman, G. T., Carroll, A. & Lelkes, P. I. 1999. Tissue-specific
alternative mRNA splicing of phenylethanolamine N-methyltransferase (PNMT)
during development by intron retention. Int J Dev Neurosci, 17(1): 45-55.
Van Deutekom, J. C. T., Bremmer-Bout, M., Janson, A. a. M., Ginjaar, I. B., Baas, F.,
Den Dunnen, J. T. & Van Ommen, G.-J. B. 2001. Antisense-induced exon
skipping restores dystrophin expression in DMD patient derived muscle cells.
Human molecular genetics, 10(15): 1547-1554.
Van Vliet, L., De Winter, C. L., Van Deutekom, J. C., Van Ommen, G. J. & Aartsma-
Rus, A. 2008. Assessment of the feasibility of exon 45-55 multiexon skipping
for Duchenne muscular dystrophy. BMC Med Genet, 9: 105. doi:110.1186/1471-
2350-1189-1105.
Reference
119
Voit, T., Topaloglu, H., Straub, V., Muntoni, F., Deconinck, N., Campion, G., De
Kimpe, S. J., Eagle, M., Guglieri, M., Hood, S., Liefaard, L., Lourbakos, A.,
Morgan, A., Nakielny, J., Quarcoo, N., Ricotti, V., Rolfe, K., Servais, L.,
Wardell, C., Wilson, R., Wright, P. & Kraus, J. E. 2014. Safety and efficacy of
drisapersen for the treatment of Duchenne muscular dystrophy (DEMAND II):
an exploratory, randomised, placebo-controlled phase 2 study. Lancet Neurol,
13(10): 987-996.
Wang, E. T., Sandberg, R., Luo, S., Khrebtukova, I., Zhang, L., Mayr, C., Kingsmore, S.
F., Schroth, G. P. & Burge, C. B. 2008. Alternative isoform regulation in human
tissue transcriptomes. Nature, 456(7221): 470-476.
Wang, Q., Chikina, M. D., Pincas, H. & Sealfon, S. C. 2014. Homer1 alternative
splicing is regulated by gonadotropin-releasing hormone and modulates
gonadotropin gene expression. Mol Cell Biol, 34(10): 1747-1756.
Ward, A. J., Norrbom, M., Chun, S., Bennett, C. F. & Rigo, F. 2014. Nonsense-
mediated decay as a terminating mechanism for antisense oligonucleotides.
Nucleic acids research, 42(9): 5871-5879.
Will, C. L. & Luhrmann, R. 2011. Spliceosome structure and function. Cold Spring
Harb Perspect Biol, 3:a003707. doi: 10.1101/cshperspect.a003707.
Williams, J. H., Schray, R. C., Patterson, C. A., Ayitey, S. O., Tallent, M. K. & Lutz, G.
J. 2009. Oligonucleotide-mediated survival of motor neuron protein expression
in CNS improves phenotype in a mouse model of spinal muscular atrophy. J
Neurosci, 29(24): 7633-7638.
Willmann, R., Possekel, S., Dubach-Powell, J., Meier, T. & Ruegg, M. A. 2009.
Mammalian animal models for Duchenne muscular dystrophy. Neuromuscul
Disord, 19(4): 241-249.
Wilton, S. D., Fall, A. M., Harding, P. L., Mcclorey, G., Coleman, C. & Fletcher, S.
2007. Antisense oligonucleotide-induced exon skipping across the human
dystrophin gene transcript. Mol Ther, 15(7): 1288-1296.
Wollerton, M. C., Gooding, C., Wagner, E. J., Garcia-Blanco, M. A. & Smith, C. W.
2004. Autoregulation of polypyrimidine tract binding protein by alternative
splicing leading to nonsense-mediated decay. Mol Cell, 13(1): 91-100.
Wong, J. J., Ritchie, W., Ebner, O. A., Selbach, M., Wong, J. W., Huang, Y., Gao, D.,
Pinello, N., Gonzalez, M., Baidya, K., Thoeng, A., Khoo, T. L., Bailey, C. G.,
Holst, J. & Rasko, J. E. 2013. Orchestrated intron retention regulates normal
granulocyte differentiation. Cell, 154(3): 583-595.

Reference
120
Xiao, S., Tjostheim, S., Sanelli, T., Mclean, J. R., Horne, P., Fan, Y., Ravits, J., Strong,
M. J. & Robertson, J. 2008. An Aggregate-Inducing Peripherin Isoform
Generated through Intron Retention Is Upregulated in Amyotrophic Lateral
Sclerosis and Associated with Disease Pathology. Journal of Neuroscience,
28(8): 1833-1840.
Xu, Q., Walker, D., Bernardo, A., Brodbeck, J., Balestra, M. E. & Huang, Y. 2008.
Intron-3 retention/splicing controls neuronal expression of apolipoprotein E in
the CNS. J Neurosci, 28(6): 1452-1459.
Xu, W., Yang, X., Hu, X. & Li, S. 2014. Fifty-four novel mutations in the NF1 gene
and integrated analyses of the mutations that modulate splicing. Int J Mol Med,
34(1): 53-60.
Yap, K., Lim, Z. Q., Khandelia, P., Friedman, B. & Makeyev, E. V. 2012. Coordinated
regulation of neuronal mRNA steady-state levels through developmentally
controlled intron retention. Genes and Development, 26(11): 1209-1223.
Yuste-Checa, P., Medrano, C., Gamez, A., Desviat, L. R., Matthijs, G., Ugarte, M.,
Perez-Cerda, C. & Perez, B. 2015. Antisense-mediated therapeutic pseudoexon
skipping in TMEM165-CDG. Clin Genet, 87(1): 42-48.
Zheng, C. L., Fu, X. D. & Gribskov, M. 2005. Characteristics and regulatory elements
defining constitutive splicing and different modes of alternative splicing in
human and mouse. RNA, 11(12): 1777-1787.
Zheng, S. & Black, D. L. 2013. Alternative pre-mRNA splicing in neurons: growing up
and extending its reach. Trends Genet, 29(8): 442-448.
Zheng, S., Gray, E. E., Chawla, G., Porse, B. T., O'dell, T. J. & Black, D. L. 2012. PSD-
95 is post-transcriptionally repressed during early neural development by PTBP1
and PTBP2. Nature neuroscience, 15(3): 381-389.
Zhou, H., Janghra, N., Mitrpant, C., Dickinson, R. L., Anthony, K., Price, L., Eperon, I.
C., Wilton, S. D., Morgan, J. & Muntoni, F. 2013. A novel morpholino oligomer
targeting ISS-N1 improves rescue of severe spinal muscular atrophy transgenic
mice. Hum Gene Ther, 24(3): 331-342.

Appendix
121
Appendix
A. Recipes
0.5M EDTA (pH8)
186.1g EDTA
800ml Milli-Q water
50x TAE
484g Trizma Base
114.2ml glacial acetic acid
200ml 0.5M EDTA (pH8)
Make up to final volume of 2L with Milli-Q water.
Adjust pH to 8.2 using acetic acid.
1x TAE
400ml 50x TAE
Make up to a final volume of 20L using Milli-Q water.
1x PBS
16g NaCl
0.4g KCl
2.88g Na2HPO4
0.48g KH2PO4
Make up to a final volume of 2L using Milli-Q water.
Adjust pH to 7.4 using HCl.
Autoclave on liquid cycle.
10x PBS
80g NaCl
2g KCl
14.4g Na2HPO4
2.4g KH2PO4
Dissolve the salts in 800ml Milli-Q water.
Make up to a final volume of 1L.

Appendix
122
1% Agarose Gel
4.0g agarose
400ml 1x TAE
2% Agarose Gel
8.0g agarose
400ml 1x TAE
RedSafe Staining Solution
10µl Red SafeTM
nucleic acid staining solution
250ml 1x TAE
Ethidium Bromide Staining Solution
10 µl ethidium bromide (10mg/ml)
100ml 1x TAE

Appendix
123
0
0.02
0.04
0.06
0.08
0.1
0.12
0.14
0.16
0.18
50nM 25nM 12.5nM 50nM 25nM 12.5nM 50nM 25nM 12.5nM
ITGA4_H28A(-6+19) ITGA4_H28A(+20+44) ITGA4_H28A(+45+69)
Pro
po
rtio
n
L3K (24h)
L3K (48h)
Figure B1 Proportions of ITGA4 transcripts with retained terminal intron in normal human fibroblasts transfected with ITGA4-targeting 2’-OMeAOs using Lipofectamine® 3000 transfection reagent. The proportions of terminal intron retaining ITGA4 transcripts present after 24 hours and 48 hours of transfection were compared. Except for one anomaly (12.5nM ITGA4_H28A(-6+19)), the proportion of ITGA4 transcripts
with retained terminal intron decreased with longer transfection duration.
B. Comparison of ITGA4 transcripts with retained terminal intron in L3K
transfections.

Appendix
124
C. Splicing Motif Analyses
Putative motifs within targeted sites of each gene transcripts that splicing factors bind to are identified
using the online software, SpliceAid 2 (http://193.206.120.249/splicing_tissue.html). Positions of each AO
designed to target each gene transcript examined in this project are shown. Both AOs that induced
terminal intron retention (underlined) and AOs that did not (not underlined), cover exonic splicing
enhancers such as SR proteins and Tra2β binding sites.
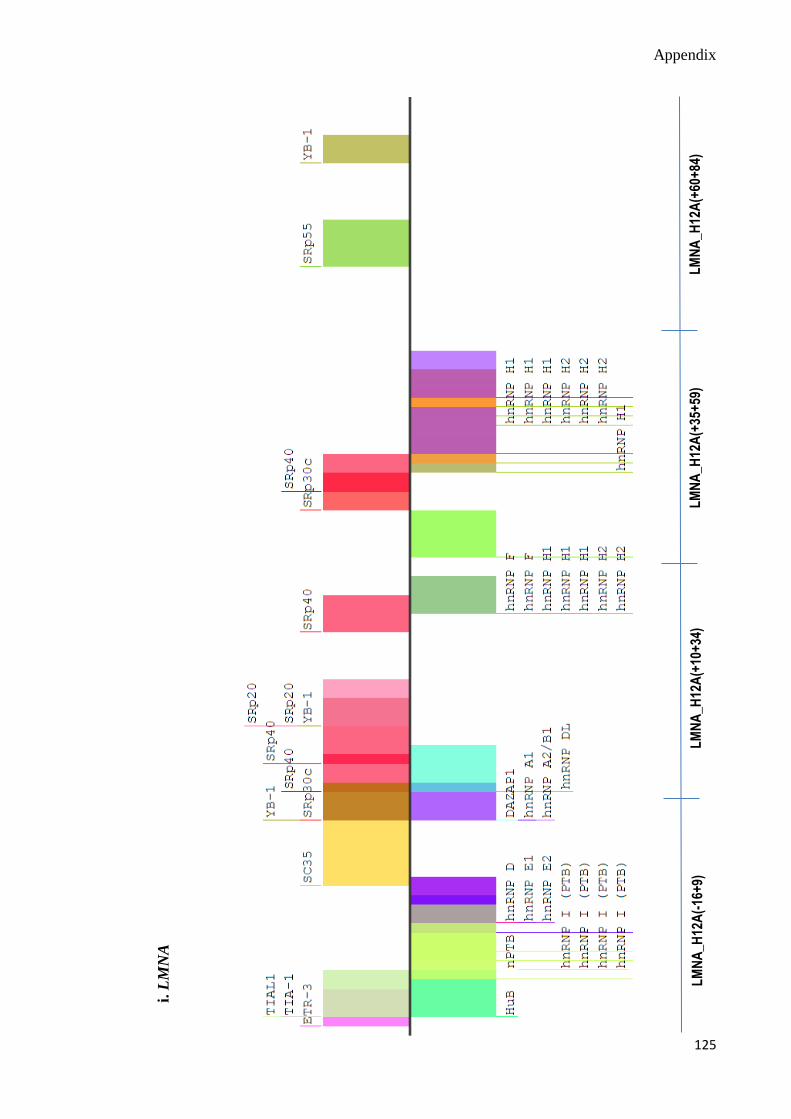
Appendix
125
LM
NA
_H12
A(-
16+
9)
LM
NA
_H12
A(+
10+
34)
LM
NA
_H12
A(+
35+
59)
LM
NA
_H12
A(+
60+
84)
i.
LM
NA

Appendix
126
ii.
LM
NC
LM
NC
_H10
A(-
10+
15)
LM
NC
_H10
A(+
16+
40)
LM
NC
_H10
A(+
41+
65)
LM
NC
_H10
A(+
66+
90)
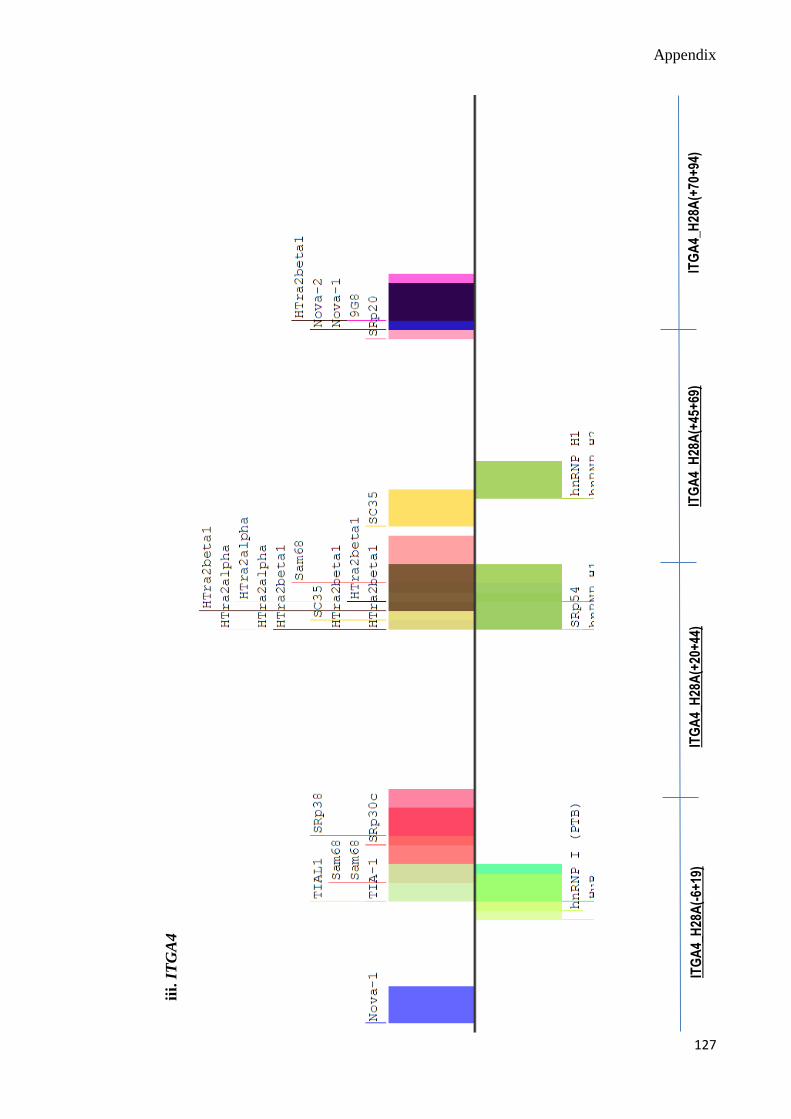
Appendix
127
iii.
IT
GA
4
ITG
A4_
H28
A(-
6+19
) IT
GA
4_H
28A
(+20
+44
) IT
GA
4_H
28A
(+45
+69
) IT
GA
4_H
28A
(+70
+94
)
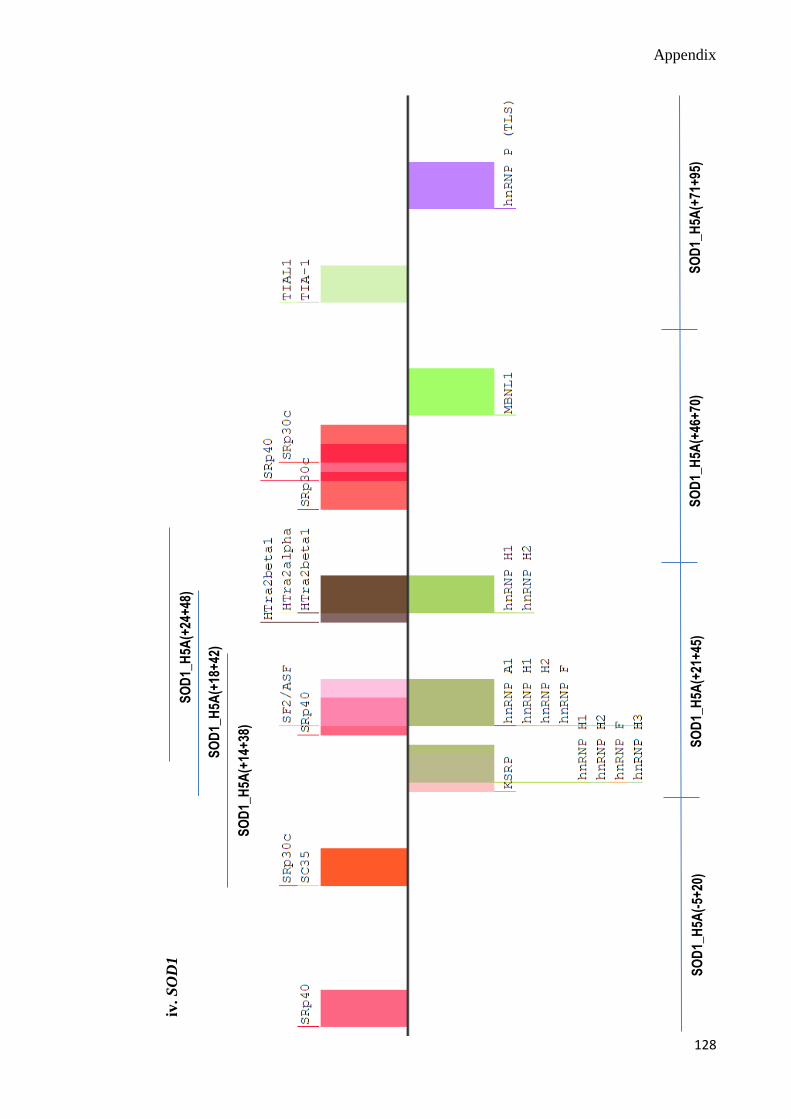
Appendix
128
SO
D1_
H5A
(-5+
20)
SO
D1_
H5A
(+21
+45
) S
OD
1_H
5A(+
46+
70)
SO
D1_
H5A
(+71
+95
)
SO
D1_
H5A
(+14
+38
)
SO
D1_
H5A
(+18
+42
)
SO
D1_
H5A
(+24
+48
)
iv. S
OD
1
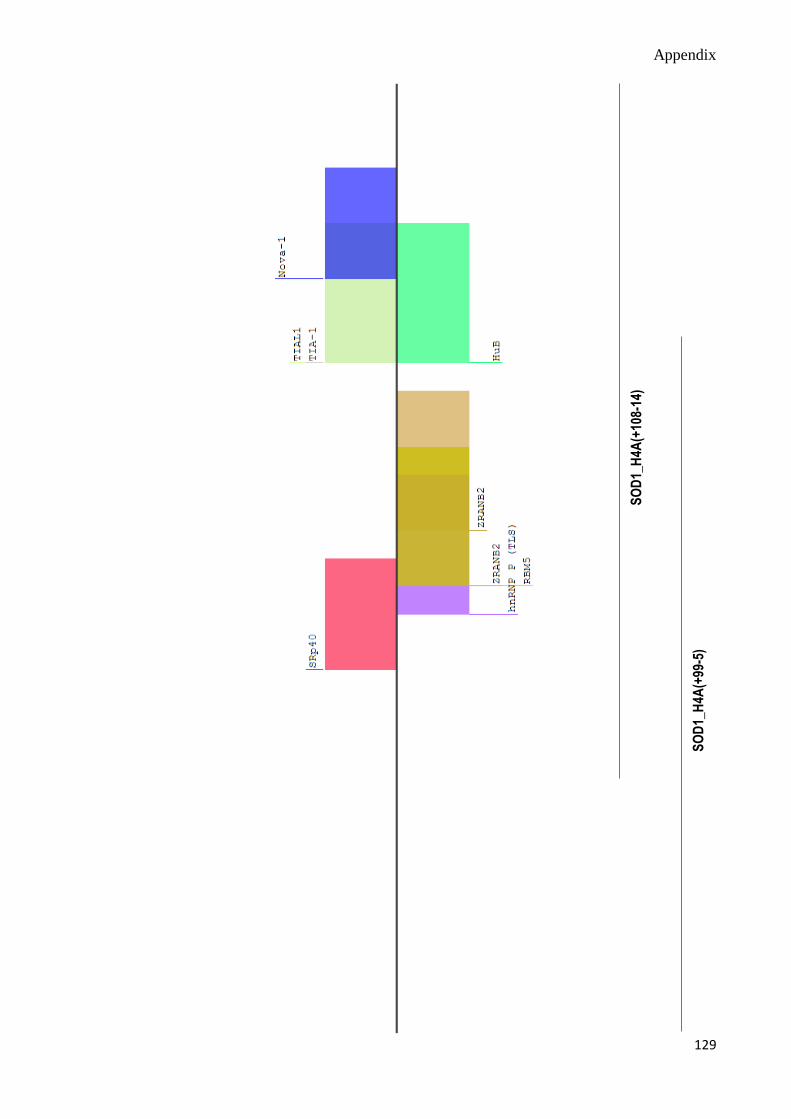
Appendix
129
SO
D1_
H4A
(+99
-5)
SO
D1_
H4A
(+10
8-14
)

Appendix
130
v. D
MD
DM
D_H
79A
(-9+
16)
DM
D_H
79A
(+17
+41
) D
MD
_H79
A(+
42+
66)
DM
D_H
79A
(+67
+91
)

Appendix
131
D. Splice Site Scores
Table D1 Splice site scores of the terminal intron’s donor and acceptor splice sites. The scores were calculated using Human Splicing Finder, version 3.0 (http://www.umd.be/HSF3/HSF.html).
Gene Transcript
(Terminal) Intron
Splice site type
Motif New potential splice
site Consensus
value (0-100)
SMN* 7 Donor GGAgtaagt GGAgtaagt 82.81
Acceptor tctcatttgcagGA tctcatttgcagGA 91.9
LMNA^ 11 Donor CAGgtgagt CAGgtgagt 98.84
Acceptor tttctctcttagAG tttctctcttagAG 84.59
LMNC* 9 Donor GAAgtaagt GAAgtaagt 87.66
Acceptor tgtccccaccagGA tgtccccaccagGA 90.83
ITGA4* 27 Donor AAGgtaagc AAGgtaagc 96.87
Acceptor tgctattttcagGC tgctattttcagGC 90.45
SOD1 4 Donor GTGgtaagt GTGgtaagt 93.49
Acceptor aattttttacagGT aattttttacagGT 90.5
DMD 78 Donor GAGgttagt GAGgttagt 93.22
Acceptor tttgttttccagGA tttgttttccagGA 94.45 * terminal intron retention is evident
^ terminal intron retention is suspected

Appendix
132
E. ESE and ESS Densities of Terminal Intron
Table E1 Density of RESCUE-ESEs within the terminal intron of the 5 gene transcripts chosen for the
project. The number of RESCUE-ESE motifs was determined using the RESCUE-ESE web server
(http://genes.mit.edu/burgelab/rescue-ese/).
Gene Transcript
RESCUE-ESEs Terminal Intron Length Density
(no. of ESE motifs/nucleotide)
LMNA 5 322nt 0.0155
LMNC 25 421nt 0.0594
ITGA4 28 496nt 0.0565
SOD1 76 1095nt 0.0694
DMD 410 4711nt 0.0870
Table E2 Density of SELEX-ESEs within the terminal intron of the 5 gene transcripts chosen for the project. The number of SELEX-ESE motifs was determined using ESEfinder3.0 (http://rulai.cshl.edu/cgi-bin/tools/ESE3/esefinder.cgi?process=home).
Gene Transcript
SELEX-ESEs Terminal Intron Length
Density (no. of ESE
motifs/nucleotide) SF2/ASF SC35 SRp40 SRp55
LMNA 17 16 14 9 322nt 0.1739
LMNC 21 24 25 11 421nt 0.1924
ITGA4 8 13 18 10 496nt 0.0988
SOD1 16 25 34 18 1095nt 0.0849
DMD 100 123 168 101 4711nt 0.1044
Table E3 Density of Class 2 FAS-ESSs within the terminal intron of the 5 gene transcripts chosen for the
project. The number of FAS-ESS motifs was determined using the FAS-ESS web server
(http://genes.mit.edu/fas-ess/).
Gene Transcript
FAS-ESSs Terminal Intron Length Density
(no. of ESS motifs/nucleotide)
LMNA 31 322nt 0.0963
LMNC 15 421nt 0.0356
ITGA4 9 496nt 0.0181
SOD1 37 1095nt 0.0338
DMD 88 4711nt 0.0187