manhattan research knowledge bite
TRANSCRIPT

1

2
§ Cybercitizen Health EU – 2012 – Cancer
§ Cybercitizen Health US – 2011 Cancer 2012 ADD ADHD 2012 HIV/AIDS 2012 MS
§ ePharma Consumer US – 2011 Epilepsy Segmentation
§ Cybercitizen Health US – 2013 Reference Deck
§ ePharma Consumer US – 2012 Manhattan Research consumer study
Manhattan Research
Consumer HCP
§ ePharma Physician US 2011 – Urologists § Taking the Pulse US – 2010 Allergists
2010 Neurologists § Taking the Pulse – 2012 Pharmacists § Taking the Pulse – 2013
Cardiologists Endocrinologists Neurologists Oncologists PCPs Psychiatrists Rheumatologists
§ ePharma Physician US – 2012 § Taking the Pulse 2011 – Europe § Taking the Pulse 2012 - BRIC § Taking the Pulse 2013 - US

3
Manhattan Research: Taking the Pulse Global
Country-specific HCP technology/social usage, resources, pharma company relationships
Taking the Pulse § Australia 2014 § Brazil 2014 § Canada 2014 § China 2014 § Europe 2013
§ France § Germany § Italy § Spain § UK
§ India 2014 § Japan 2014 § Mexico 2014 § Middle East 2013 § Russia 2014 § South Africa 2013 § Turkey 2014
Digital Workflow: How are physicians flowing across screens and platforms and how can marketers provide value-add
content and services ?
Media Mix: Which sources are physicians relying on day-to-day to conduct their practices?
Mobile optimization: How are smartphones and tablets
impacting decisions?
Pharma relationship: How can pharma leverage relationships with physicians both online and offline?

4
Taking the Pulse® Global 2014 Study Methodology Summary
Source: Manhattan Research, Taking the Pulse® Global 2014
How was the survey conducted?
When was the survey fielded/released?
The 2014 survey was conducted online.
The survey was fielded in Q1 of 2014.
Where was the survey conducted?
In order to optimize the study and provide geographic diversity, various regions were targeted in each country. First, second, and third tier cities were targeted, as well as segments of non-urban physicians in each
country, including rural physicians from towns, villages, outer-suburbs, county-level cities, and the countryside. Of the physicians who participated in the survey, 50% live in Tier 1 cities, 35% live in Tier 2
cities, and 15% live in Tier 3 cities.
Australia Brazil Canada China India Japan Mexico Russia Turkey
Total Participants
228 205 230 362 201 202 203 204 202
PCPs 121 99 111 151 100 100 100 101 101
Specialists 107 106 119 211 101 102 103 103 101
Surveyed face-to-
face/phone
- 103 - 157 100 - 101 90 102
Surveyed Online
228 102 230 205 101 202 102 114 100
Non-urban physicians
34 50 50 87 44 51 45 46 47

5
Taking the Pulse® Global 2013 Study Methodology Summary
Source: Manhattan Research, Taking the Pulse® Global 2014
How was the survey conducted?
When was the survey fielded/released?
The Taking the Pulse Europe 2013 survey was conducted online and recruited via email. The Middle East and South Africa Taking the Pulse 2013 surveys were conducted via face to
face interviews.
The Europe survey was fielded and released in Q4 of 2013. The Middle East survey and the South Africa survey were both conducted December 2013 – February 2014.
Where was the survey conducted?
The 2013 survey was conducted online and physicians were recruited via email. Physicians were told it was regarding “communication channels” within their practice and were given the option to complete the survey
in the language of their choice (options were German, Spanish, French, Italian, or English).
Europe: France
Europe: Germany
Europe: Italy
Europe: Spain
Europe: UK
Middle East
South Africa
Total Participant
s
256 248 249 252 250 110 (50 United Arab
Emirates, 30 Kuwait, 30 Saudi Arabia)
51

6
6
Today’s Focus
• What’s New? • What’s Unexpected and Surprising? • How are HCPs different?

7
7
Digital WorkFlow

8
Digital Workflow:
Triple screen threat: The majority of all 2014 surveyed na8ons’ HCPs u8lize their desktop/laptop, smartphone, and tablet in their workday.
• Japan is the only excep8on, where less than half of their physicians (47%) u8lize triple screens for professional purposes.

9
Digital Workflow:
Top Screen: While many HCPs use desktop/laptop the most as their top screen during the workday and during pa8ent consulta8ons, some HCPs in certain markets do spend the most 8me on other devices
• Notably, physicians in China, India, Mexico, and Russia spend more 8me on their smartphones during the workday than on their desktop/laptop or tablet device
• When comparing tablet and smartphone professional usage, most polled countries indicate equal usage, with a few excep8ons
• HCPs in Japan are more likely to own a tablet than a smartphone
• Physicians in Turkey are more likely to use their smartphone during the day than a tablet

10
Device Profile: In terms of frequency of use, desktops/laptops are the leading screen. These sessions last longer than sessions on tablets and smartphones
Digital Workflow:
• HCPs use their desktop/laptop anywhere from 4 8mes a day to 25 8mes a day, with sessions las8ng 15 minutes to 24 minutes EACH
Sharing Resources: Physicians vary in terms of their openness with sharing a digital resource with pa8ents during a pa8ent consulta8on
• In countries such as Brazil, Canada, and South Africa, physicians are open to usually showing a resource to a pa8ent during a consulta8on
• HCPs in Australia, China, India, Japan, Middle East, Russia, and Turkey occasionally or never show a digital resource to their pa8ent

11
Digital Workflow:
Typical workday: In all countries, physicians spend the majority of their workday seeing pa8ents (anywhere from 4.7 hours to 7.5 hours a day)
• In countries such as China and Turkey, physicians do not report spending 8me on EHR plaWorms in their workday
Low EHR usage
High EHR usage
Australia – 72%
Brazil – 62%
Canada – 60%
India – 33%
Japan – 60%
Mexico – 51%
Russia – 33%
Turkey – 0%
China – 0%
France– 70%
Italy 21%
Germany- 46%
Spain – 74%
UK – 59%

12
12
Media Mix

13
Media Mix:
Source of InformaMon: In all polled countries, the majority of HCPs prefer digital format over print as their first choice when looking for informa8on to guide their clinical decisions
India – 60%
China – 62%
Japan – 66%
Russia & South
Africa – 71%
Turkey and
Middle East- 73%
Canada – 80%
Brazil – 81%
Mexico – 82%
Australia – 86%
% of HCPs who prefer digital resources

14
Media Mix:
Pharma website visitaMon: Pharma website weekly visita8on amongst physicians ranges from 19% to 82% in a country. Pharma websites are defined as pharmaceu8cal product websites, customer service websites, corporate websites and disease/condi8on websites
• Of all polled countries, the majority physicians in Russia (82%) visit any pharma website weekly or more o[en, indica8ng that those physicians are most willing or open to pharma-‐sponsored sources for informa8on and digital assets
15
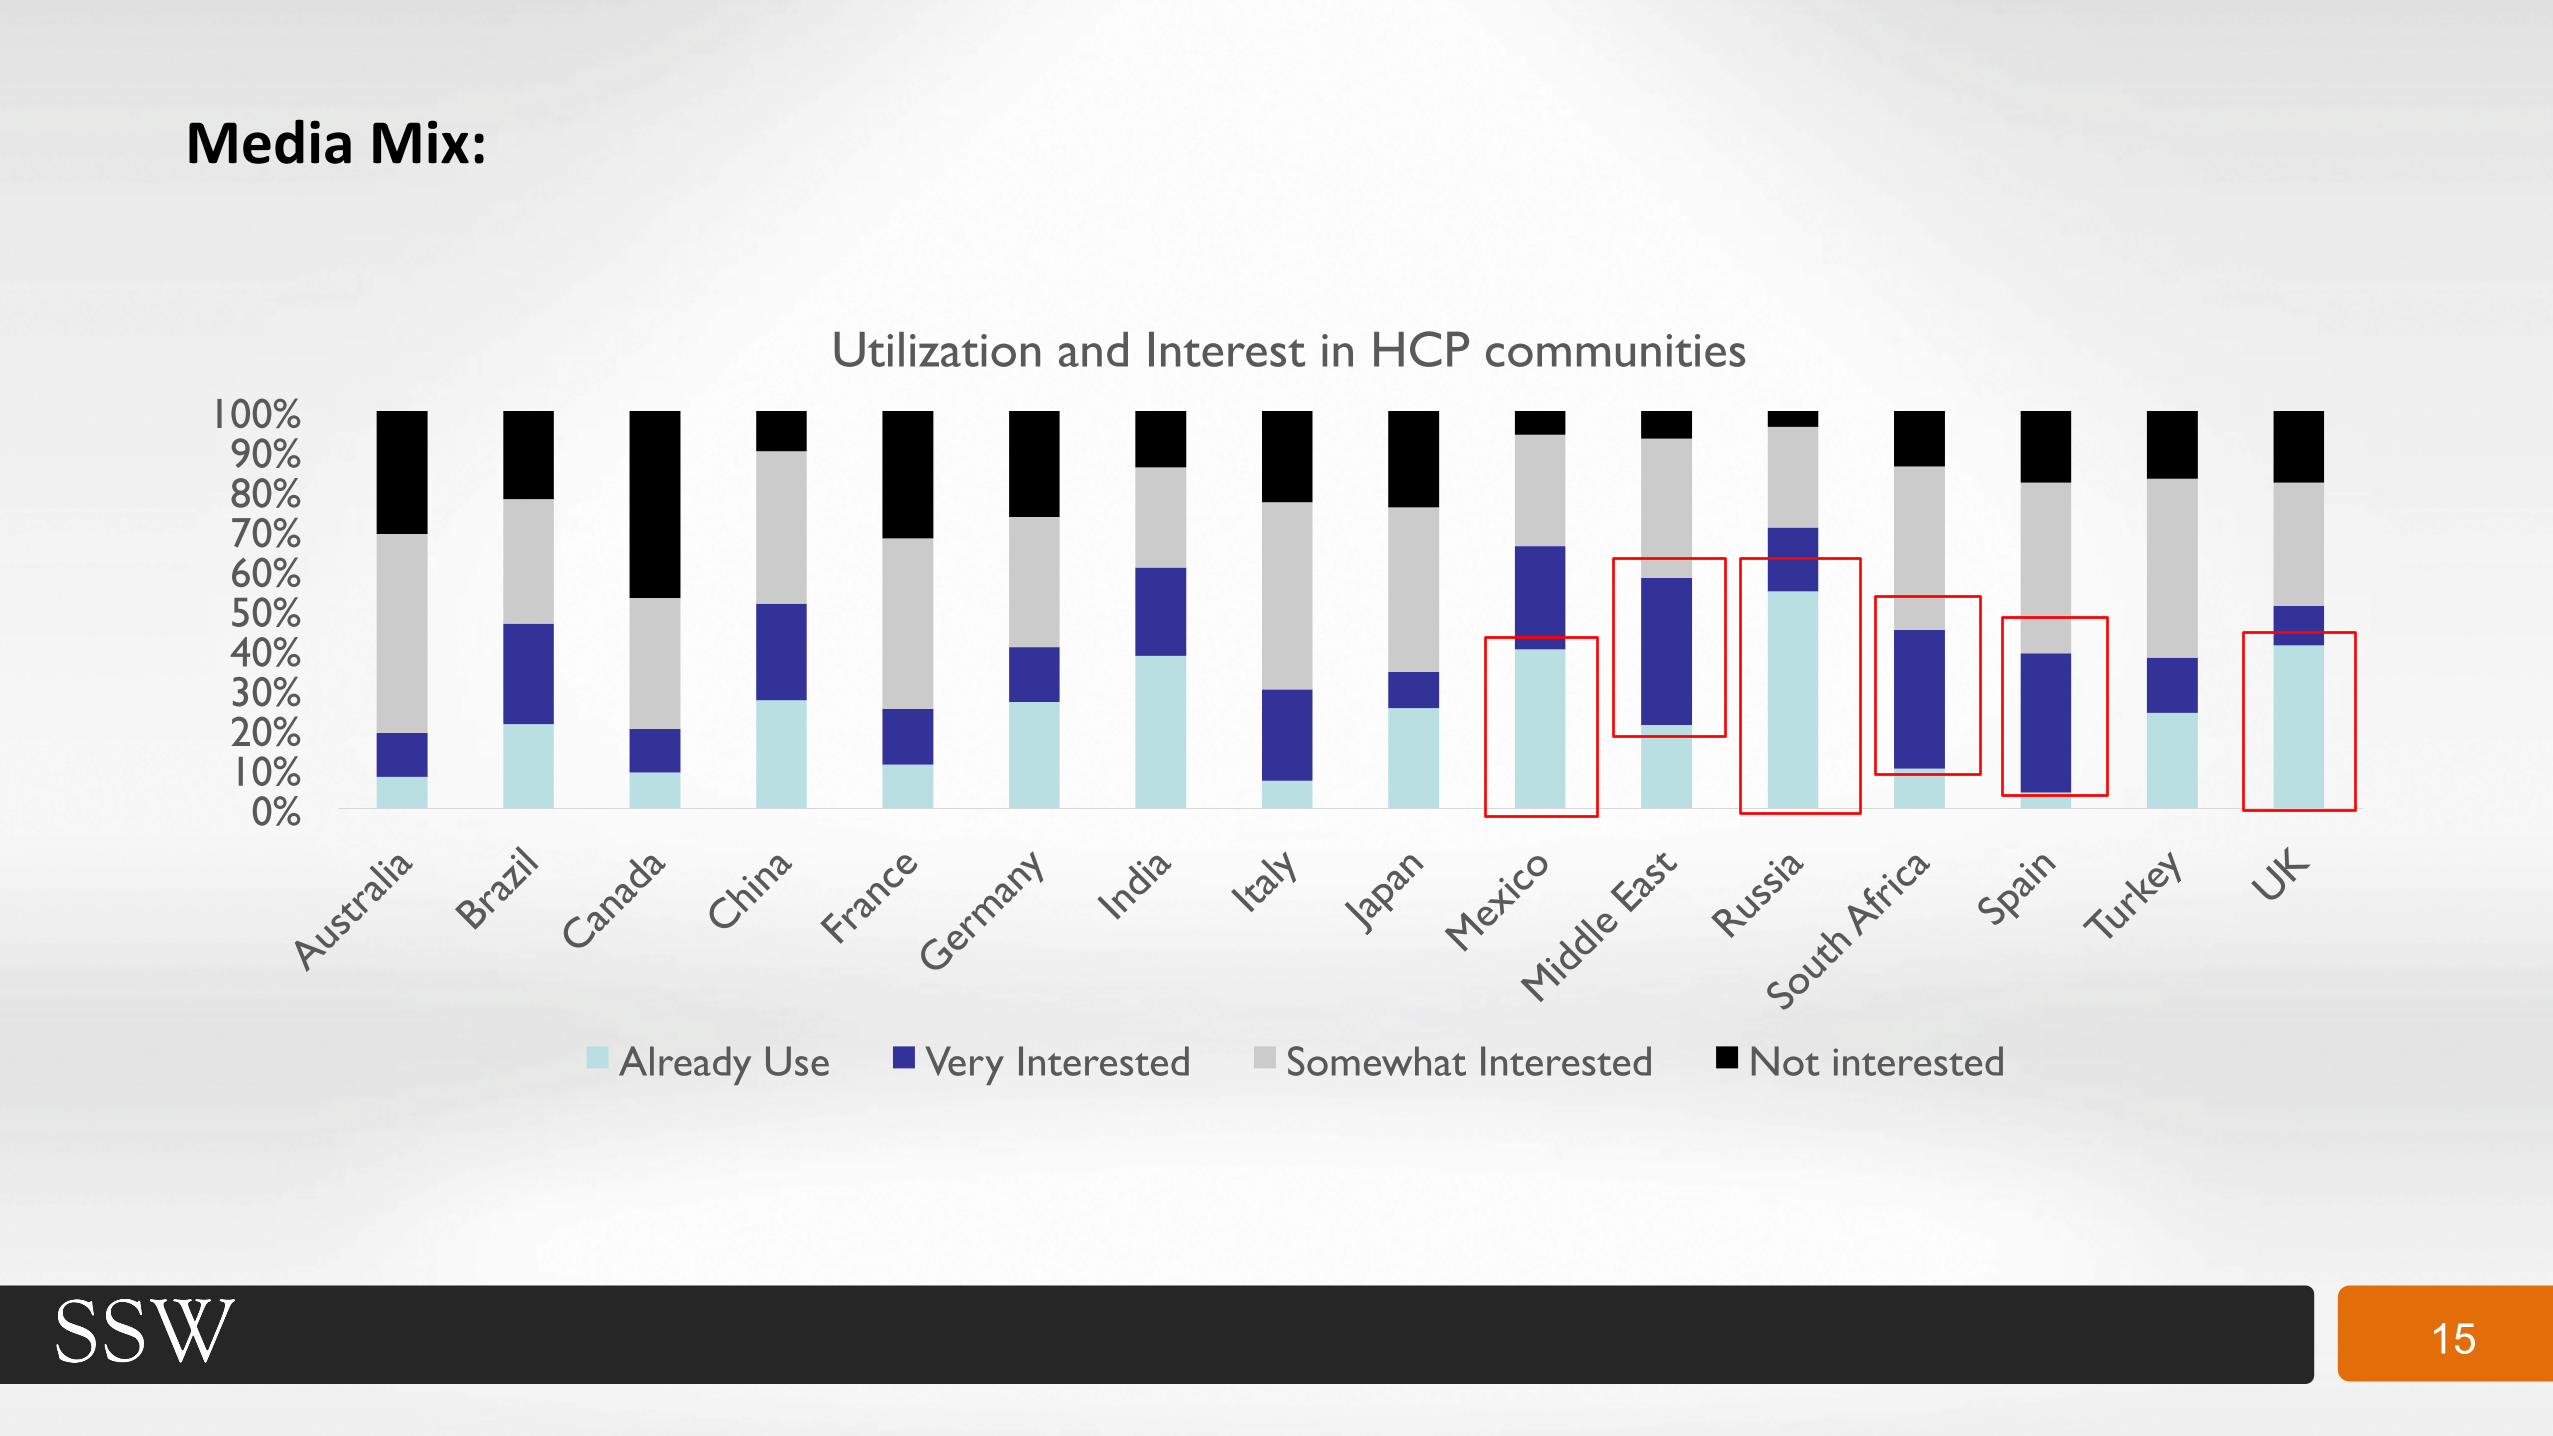
Media Mix:
0% 10% 20% 30% 40% 50% 60% 70% 80% 90%
100% Utilization and Interest in HCP communities
Already Use Very Interested Somewhat Interested Not interested

16
Media Mix:
Local Networks
Doctors.net.uk Coliquio Egora Medscape Physician Connect Medicitalia
NIH Medportal.Ru Weibo Orkut Quora Bebo
Viadeo Tuen8 Xing

17
17
Mobile Optimization

18
Mobile OpMmizaMon:
Top Smartphone/Tablet
• The Top Smartphone is iOS/Apple in Australia, Brazil, Canada, EU, Japan, Turkey, and South Africa
• Android is the top smartphone in China, India, Mexico, Middle East, and Russia
• Incidentally, physicians in China, India, Mexico, and Russia also reported that they spend more 8me on their smartphone than on their desktop/laptop during the workday, indica8ng that the Android plaWorm may be more conducive to longer usage sessions than the iOS plaWorm for HCPs
• Android plaWorm is gaining trac8on in the EU smartphone market
• The Top Tablet is iOS/Apple in Australia, Brazil, Canada, China, Japan, EU, Mexico, Middle East, Turkey, and South Africa
• Android is the top tablet in both India and Russia
• Physicians in India and Russia are also more likely to have both a smartphone and tablet on the Android plaWorm

19
Mobile OpMmizaMon: Interest in InteracMng with Pharma via Smartphone
• HCPs vary in their interest in using pharma resources on their smartphone. The most common interests that respondents chose were product websites, condiMon specific websites, or an app provided by a pharma company.
55%
79%
48%
81% 74% 75% 90% 86%
75% 63% 63%
0%
20%
40%
60%
80%
100% HCP interest in smartphone pharma resources
*EU not depicted

20
20
Relationship with Pharma

21
Pharma RelaMonship: Sales Rep Access: Sales rep penetraMon in HCP offices vary by country
87% 92%
77% 70%
83% 83% 91% 93% 91%
83% 91%
76%
92% 90% 81%
75%
0
5
10
15
20
25
0% 10% 20% 30% 40% 50% 60% 70% 80% 90%
100% Rep Access
Mean number of times Saw a rep last 6 months

22
Pharma RelaMonship:
Why do HCPs feel that rep visits are beneficial?
• Product informaMon is the number one reason why HCPs find rep visits to be beneficial
• Physicians in India, Russia, and Turkey find value in printed brochures/pa8ent educa8onal materials – these are also the three countries with lowest EHR usage
0
1
2
3
4
5
6
7
8
9
Product Information Answering Specific questions relating to
products
Drug Samples Clinical Trial Results Information about Medical conferences/meetings
Printed brochures and other printed patient ed
leave behinds
Top Benefits
Excluding Middle East and South Africa

23
Pharma RelaMonship: Tablet Reps
Australia Brazil Canada China France
Germany India Italy Japan Mexico
Middle East Russia
South Africa Spain Turkey UK
Saw an iPad rep 84% 63% 78% 46% 54% 60% 31% 68% 71% 70% 76% 22% 71% 75% 71% 65% Agree tablets add value to the meeting 50% 50% 44% 71% 27% 18% 63% 7% 10% 71% 81% 63% 63% 9% 68% 5%
0%
10%
20%
30%
40%
50%
60%
70%
80%
90%
100% Tablet Rep Details

24
Pharma RelaMonship:
Why do HCPs not uMlize Pharma websites?
Almost all polled countries listed “InformaMon is biased” as the number one reason why physicians do not use pharma websites
However, the majority of HCPs agree that they would use pharma websites more with certain improvements:
• Regularly updated content • Beder quality pharma websites • Links to other medical resources • Easier to navigate

25
Country by Country

26
• Reason for not using pharma websites is because HCPs feel the information is
biased. 10% read professional email newsletters from pharma companies
• Most HCPs find Rx information on their own, but 92% are interested in sharing pharma provided patient educational materials with their patients
• About half of Australian HCPs show interest in using pharma resources on a
smartphone
• They under-index in their social network usage
• About half carry their smartphone with them all day, and 86% prefer digital resources for clinical information. However, they spend the most time on desktops/laptops
Trusts Pharma?
Mobile Friendly?
Australia
Social Savvy?

27
• Their pharma website visitation is strong (60%). They are also the most ikely to trust a pharma-sponsored website and would find value in pharma company interaction in an online physician community.
• There is a high demand for content catered specifically to Brazil
• Reps have a broad reach in Brazil. HCPs refer to them for drug samples
• HCPs in Brazil are more likely to go on social networks (Facebook is a top choice)
• They spend more time on EHR platforms in a given workday than physicians in other countries
• 81% agree that their first choice for clinical information is digital sources
Trusts Pharma?
Mobile Friendly?
Brazil
Social Savvy?

28
• Low pharma site visitation, and low social network utilization. They do not use pharma websites because they feel the information is biased
• Physicians use their tablets/smartphones almost equally compared to their desktops. About half carry their smartphone all day
• They primarily use their smartphone/tablet devices to read news articles and abstracts
Trusts Pharma?
Mobile Friendly?
Social Savvy?
Canada

29
• Heavy smartphone usage. Physicians report it is the top screen used throughout the workday, followed by desktop
• There is an interest in Chinese-specific resources from pharma. Their top reason for not using pharma websites more is because they do not know which website will have the information that they need
• 56% use the Weibo social network for professional purposes. While the minority use physician-only communities, 85% are very receptive with pharma involvement. 81% are interested in using a pharma-sponsored mobile resource
• 46% physicians in China reported seeing a rep with an iPad (iPad detail), with the majority still using printed materials. However, the majority agree that tablets add value to a rep visit
China
Trusts Pharma?
Mobile Friendly?
Social Savvy?

30
• More EU physicians own a smartphone than any other device for professional use
• But more 8me is spent on their desktop, and physicians do not u8lize tablet very o[en in the work day
• 59% access medical resources in English, and 61% are interested in resources created specifically for their country
• Their top social networks are Google+, LinkedIn, and Facebook
• 18% are currently on physician only networks
• 85% recalled seeing a rep in person, and reps are more o[en u8lizing print materials rather than an ipad detail
Trusts Pharma?
Mobile Friendly?
Social Savvy?
European Union: France, Germany, Italy, Spain, UK

31
• HCPs in India over-index in their agreement that pharma-sponsored communications are credible (26%). However, their top reason for not using pharma website is because they feel the information is biased
• Majority are interested in pharma involvement in physician-only communities
• Physicians use their three devices (desktop, tablet, and smartphone) but smartphone is the top screen during a typical workday
• EHR platforms are used sparingly in the workday, and adoption is low
• 60% prefer digital resources (under-index compared to other countries)
Trusts Pharma?
Mobile Friendly?
Social Savvy?
India

32
• The percentage of physicians who use a tablet during the workday over-
indexes compared to other countries
• While their top screen used throughout the day is the desktop, their smartphone/tablet usage is equal. Only 17% agree that smartphone is a critical resource in their working day
• 89% utilize websites designed for HCP audience. Half use any pharma website
• Physicians predominately use Facebook, followed by Google+, for professional social networking
• 25% are currently on physician-only communities, and the majority are receptive to pharma company interactions
Trusts Pharma?
Mobile Friendly?
Social Savvy?
Japan

33
• HCPs in Mexico, on average, over-index in their time spend on digital resources in a typical workday when compared with other markets (2.9 hours)
• Smartphone is their top screen used during the workday, and their tablet sessions are longer than desktop sessions
• A strong percentage (82%) prefer digital resources and half would like to see a pharma-sponsored mobile app
• 61% visit any pharma website, and 94% are interested in pharma interaction in an HCP-only community
• They also believe that pharma sources are credible
Trusts Pharma?
Mobile Friendly?
Social Savvy?
Mexico

34
• A strong percentage of physicians use Facebook for professional purposes (78%)
• 69% carry their smartphone and use it constantly
• 99% access materials in English because they feel they have the most complete information available, but half would like to see more country-specific professional resources
• 66% would prefer a physician online community without other information like medical news
Trusts Pharma?
Mobile Friendly?
Social Savvy?
Middle East (United Emirates, Kuwait, Saudi Arabia)

35
• Smartphones are their top screen used throughout the day
• 82% of physicians visit any pharma website, over-indexing other countries
• 94% indicate they are open to pharma interaction in physician only networks, and 75% indicate an interest in pharma resources on their smartphone
• Their top reason for not visiting pharma websites is because they do not know which websites have the information they need
Trusts Pharma?
Mobile Friendly?
Social Savvy?
Russia

36
• Percentage of physicians who use a smartphone is nearly equal to that of those who use a desktop, however, they still spend the most time on desktop devices in a typical workday
• 70% carry a smartphone and use it constantly. Of those who are interested in pharma resources on their smartphone, they would like to see condition-specific websites or product websites
• High demand for specific patient education materials as well as materials created specifically for South Africa. 98% are interested in sharing patient educational materials provided from pharma companies
• 92% saw a rep and the majority agree that they trust and respect the professional opinion of their reps
Trusts Pharma?
Mobile Friendly?
Social Savvy?
South Africa

37
• Physicians in Turkey are moving towards mobile, however 22% carry a smartphone and use it constantly throughout the day
• They do not use pharma communications because they feel information is biased or superficial, but 75% would be interested in pharma interaction in physician networks
• 64% are satisfied with the quality of medical digital resources in their local language
• Pharma rep reach is not as broad as in other countries, but those who do see a rep have higher than average frequency
Trusts Pharma?
Mobile Friendly?
Social Savvy?
Turkey