mangiferin induces cell cycle arrest at g2/m phase through atr-chk1 pathway … · 2017-10-19 ·...
TRANSCRIPT

©FUNPEC-RP www.funpecrp.com.brGenetics and Molecular Research 14 (2): 4989-5002 (2015)
Mangiferin induces cell cycle arrest at G2/M phase through ATR-Chk1 pathway in HL-60 leukemia cells
Z.G. Peng, Y.B. Yao, J. Yang, Y.L. Tang and X. Huang
Department of Hematology, The First Affiliated Hospital,Guangxi Medical University, Nanning, China
Corresponding author: Z.G. Peng E-mail: [email protected]
Genet. Mol. Res. 14 (2): 4989-5002 (2015)Received March 28, 2014Accepted October 23, 2014Published May 12, 2015DOI http://dx.doi.org/10.4238/2015.May.12.2
ABSTRACT. This study aimed to determine the effect of mangiferin on the cell cycle in HL-60 leukemia cells and expression of the cell cycle-regulatory genes Wee1, Chk1 and CDC25C and to further investigate the molecular mechanisms of the antileukemic action of mangiferin. The inhibitory effect of mangiferin on HL-60 leukemia cell proliferation was determined by the MTT assay. The impact of mangiferin on the HL-60 cell cycle was evaluated by flow cytometry. After the cells were treated with different concentrations of mangiferin, the expression levels of Wee1, Chk1 and CDC25C mRNA were determined by RT-PCR, and Western blot was used to evaluate the expression levels of cdc25c, cyclin B1, and Akt proteins. The inhibition of HL-60 cell growth by mangiferin was dose- and time-dependent. After treatment for 24 h, cells in G2/M phase increased, and G2/M phase arrest appeared with increased mRNA expression of Wee1, Chk1 and CDC25C. Mangiferin inhibited Chk1 and cdc25c mRNA expression at high concentrations and induced Wee1 mRNA expression in a dose-dependent manner. It significantly inhibited ATR, Chk1, Wee1, Akt, and ERK1/2 phosphorylation but increased cdc2 and cyclin

Z.G. Peng et al. 4990
©FUNPEC-RP www.funpecrp.com.brGenetics and Molecular Research 14 (2): 4989-5002 (2015)
B1 phosphorylation. Furthermore, mangiferin reduced cdc25c, cyclin B1, and Akt protein levels while inducing Wee1 protein expression. It also antagonized the phosphorylation effect of vanadate on ATR, and the phosphorylation effect of EGF on Wee1. These findings indicated that mangiferin inhibits cell cycle progression through the ATR-Chk1 stress response DNA damage pathway, leading to cell cycle arrest at G2/M phase in leukemia cells.
Key words: Mangiferin; HL-60; Cell cycle; ATR; Chk1
INTRODUCTION
Recent studies have found that the occurrence of leukemia is related to the dysregula-tion of the cell cycle (Nong et al., 2005). Due to p53 deletion, p53 mutations or G1/S check point deletion, most tumor cells are more and more dependent on the G2/M check point (Gar-rido et al., 2004; Muruganandan et al., 2005; Pardo-Andreu et al., 2008; Marquez et al., 2012). Therefore, the regulation of the G2/M check point is particularly important in the regulation of the cell cycle in tumor cells.
Flavonoids are a class of polyphenolic compounds widely existent in natural plants, which have been found to have significant antitumor effects (Chattopadhyay et al., 1987; Ang et al., 2011; Rivera et al., 2011). Their derivatives such as flavopiridol and genistein have been used safely in human trials (Guha et al., 1996; Huang et al., 2001) to be further applied to experimental evaluation of solid tumors in clinical phaseII (Makare et al., 2001; Garcia et al., 2003). Therefore, these compounds have potential medicinal value. Mangiferin is a flavonoid and it is extracted from the mango tree. Studies have found that mangiferin can inhibit the growth of liver cancer cells, colon cancer cells, leukemia K562 cells, and other tumor cells, and the inhibition of tumor cells is related to the induction of cell cycle arrest at the G2/M phase (Huang et al., 2002; Rajendran et al., 2008; Garcia-Rivera et al., 2011). On the basis of our previous studies, which showed that mangiferin inhibits the proliferation of HL-60 leuke-mia cells and induces apoptosis, we investigated the impact of mangiferin on the HL-60 cell cycle and the expression regulation of related genes to clarify the antileukemic mechanism of mangiferin, so as to provide experimental evidence for using mangiferin as a new leukemia-treatment drug.
Leukemia is a malignant blood disease that is associated with a disorder in the cell cycle and apoptosis. Cancer cells, including leukemic cells, tend to be resistant to chemo-therapeutic agents and become refractory, resulting in failure of treatment. Although different types of chemotherapeutic agents are available for the treatment of leukemia, the toxicity and side effects of the drugs and the resistance of the leukemic cells to the agents remain unsolv-able issues in clinical practice. Thus, to break through this bottleneck, new chemotherapeutic agents with mild side effects and multi-target efficacy with low resistance are needed and will be ideal in curing this life-threatening blood malignancy.
Mangiferin, a naturally occurring flavonoid compound that can be extracted from bark and leaves of Mangifera indica L. (Nong et al., 2005) and other herbal species, has been demonstrated to possess antioxidative (Muruganandan et al., 2005; Pardo-Andreu et al., 2008; Marquez et al., 2012), anti-inflammatory (Garrido et al., 2004; Rivera et al., 2011), anti-bone resorption (Ang et al., 2011), and immunoregulatory effects with mild or non-existent side ef-

4991Mangiferin induces cell cycle arrest
©FUNPEC-RP www.funpecrp.com.brGenetics and Molecular Research 14 (2): 4989-5002 (2015)
fects (Chattopadhyay et al., 1987; Guha et al., 1996; Huang et al., 2001; Makare et al., 2001; Garcia et al., 2003). More interestingly, this flavonoid has been further shown to possess an-tiproliferative and antitumor growth properties, thus making it a potential anticancer agent in recent years (Huang et al., 2001; Rajendran et al., 2008; Garcia-Rivera et al., 2011). Previous in-depth studies have found that mangiferin induces apoptosis (Huang et al., 2002; Peng et al., 2004; Sarkar et al., 2004; Cheng et al., 2007; du Plessis-Stoman et al., 2011; Shoji et al., 2011) and inhibits cell cycle progression in liver cancer and leukemic cells, leading to G2/M phase arrest (Huang et al., 2002; Yao et al., 2010); however, since the compound’s antitumor properties have not been studied extensively, the mechanisms of action in cell apoptosis induc-tion and cell cycle inhibition have not been fully elucidated. It is reported here that mangiferin inhibits cell cycle progression at G2/M phase through the ATR (ataxia telangiectasia and Rad3 related)-Chk1 (checkpoint kinase 1) pathway in HL-60 leukemia cells.
MATERIAL AND METHODS
Cell culture and mangiferin preparation
The HL-60 human promyelocytic leukemia cell line was purchased from Cell Bank of Shanghai Institute of Cell Biology, Chinese Academy of Science. Cells were maintained in IMDM supplemented with 10% heat-inactivated fetal bovine serum (Hyclone, Logan, UT, USA) and grown in T-25 flasks (Corning, Corning, NY, USA) at 37°C in a 5% CO2 humidified incubator (Thermo Fisher Scientific, Waltham, MA, USA). The medium was replaced every other day by centrifugation. HPLC and capillary electrophoresis grade mangiferin were gen-erously provided by Dr. Huayi Huang of Guangxi Nationalities Hospital in Guangxi, China (currently at Roswell Park Cancer Institute, Buffalo, NY, USA). The compound was dissolved in 2% NaHCO3 and was prepared as a 10 mM stock solution, which was kept at -20°C in ali-quoted vials away from light.
Cell cytotoxicity assay
The 3-(4,5-dimethylthiazol-2-yl)-2,5-diphenyltetrazolium bromide (MTT) assay (Sigma-Aldrich, St. Louis, MO, USA) was used in determining the cytotoxicity of mangiferin. Briefly, 4 x 10⁴ cells in 200 µL medium were added to each well of a 96-well plate and were incubated overnight. The cells were exposed to mangiferin on the next day at final concentra-tions of 20, 40, 80, 160, 200, and 250 µM for 24, 48, and 72 h. NaHCO3 solution was used as the vehicle control. Each concentration and time point of treatment were tested with 5 repli-cate wells. At the indicated time point of treatment, 10 µL MTT solution was added to each well and the cells incubated for 4 h in a 5% CO2 incubator. The plate was then centrifuged at 2500 rpm for 10 min, and the supernatant was carefully removed by pipetting. Finally, 150 µL DMSO was added to each well followed by incubation for 10 min at 37°C. When the purple crystals were completely dissolved, the absorbance at 490 nm was measured using a Bio-Rad microplate reader (Bio-Rad, Hercules, CA, USA). The experiment was conducted in triplicate.
Cell cycle analysis
HL-60 cells were exposed to various concentrations of mangiferin for 24 and 48 h.

Z.G. Peng et al. 4992
©FUNPEC-RP www.funpecrp.com.brGenetics and Molecular Research 14 (2): 4989-5002 (2015)
The cells were then collected by centrifugation, washed twice with cold PBS, and fixed with 5 mL 70% cold ethanol at 4°C for at least 18 h. After fixation, the cells were again washed twice with PBS, and the cell number was adjusted to 1 x 10⁶ in a BD Falcon (BD Biosciences, Frank-lin Lakes, NJ, USA) centrifugation tube. These cells were kept on ice, and 1 mL (50 µg/mL) propidium iodide (Sigma-Aldrich) was added followed by incubation for 30 min. The DNA fragments were analyzed on a Beckman Coulter Epics XL flow cytometer (Beckman Coulter, Brea, CA, USA), and the data were analyzed using the EXPO32 ADC software.
Wright-Giemsa staining and photographing
HL-60 cells (5x10⁴) were placed in each well of a 6-well plate (Corning) overnight. The cells were then exposed to 160 mM mangiferin for 24, 48 and 72 h. Afterwards, the plate was centrifuged at 3000 rpm and 4°C for 10 min on a Beckman Coulter Allegra 6R centrifuge (Beckman Coulter). The culture medium was then removed carefully by aspiration, and the cells were air-dried for 10 min at room temperature. The cells were fixed with 1 mL methanol (slowly added along the edge of the wells) for 1 min at room temperature. The methanol solu-tion was then aspirated and the cells were stained with Wright-Giemsa-staining solutions (gen-tly added along the edge of the wells) for 1 min. The wells were then gently washed with PBS 3 times to remove the excess and unbound dye. The cells that were damaged by mangiferin were unable to attach to the well after centrifugation and were removed with the solutions. The cells in all wells were then observed and photographed under a ZEISS Axiovert 25 inverted microscope equipped with a digital camera system (ZEISS North America, Peabody, MA, USA). The central areas of all wells were chosen for photographing.
RNA extraction and RT-PCR
HL-60 cells were treated with mangiferin for 24 h. Total RNA was extracted using Trizol reagent (Invitrogen, Carlsbad, CA, USA) following manufacturer instructions. The RNA quantity and quality were analyzed on a Beckman Coulter DU-800 spectrophotometer using the nucleic acid II software-RNA/Oligo.
cDNA was synthesized using SuperScript III First-Strand Synthesis System (Invitro-gen) following manufacturer instructions. Oligo (dT) was used as primer. The resulting cDNA concentration was determined with the Beckman Coulter DU-800 spectrophotometer using the nucleic acid II software-ssDNA.
Chk1, cdc25c, and Wee1 cDNA were amplified using the primers as follows: Chk1: forward primer: 5'-ATG AAG CGT GCC GTA GAC T-3' and reverse primer: 5'-TCC AAG GGT TGA GGT ATG T-3' to generate an amplicon of 571 bp. cdc25c: forward primer: 5'-GAA CAG GCC AAG ACT GAA GC-3' and reverse primer: 5'-GCC CCT GGT TAG AAT CTT CC-3' to generate an amplicon of 179 bp. Wee1: forward primer: 5'-ATG AGC AGA ACG CTT TGA G-3' and reverse primer: 5'-CTT GTG GTA TCC GAG GTA ATC-3' to generate an amplicon of 594 bp. β-actin served as the endogenous standard with a primer set of forward: 5'-TCC AAG GGT TGA GGT ATG T-3' and reverse: 5'-CAG GTC CAG ACG CAG GAT GGC-3'. The size of the amplicon was 273 bp. After reverse transcription, we prepared a 20-µL reaction mixture containing 2 µL 10X PCR buffer, 2 µL 2.5 mM dNTP mixture, 1.2 µL 25 mM MgCl2, 1 µL (100 ng) cDNA, 1 µL forward and reverse primers, 0.1 µL (0.5 U) DNA polymerase and 11.7 µL H2O. Thermal cycling was carried out on a Bio-Rad iCycler with the
4993Mangiferin induces cell cycle arrest
©FUNPEC-RP www.funpecrp.com.brGenetics and Molecular Research 14 (2): 4989-5002 (2015)
following conditions: 95°C for 3 min; 28 cycles of 94°C for 30 s, 57°C (Wee1 and Chk1) or 59°C (cdc25c and β-actin) for 30 s and 72°C for 30 s; and further extension at 72°C for 10 min. The PCR products were analyzed by 2% agarose gel electrophoresis and were visualized and quantified by the UVP BioImaging system (UVP, Upland, CA, USA). The densities of Chk1, cdc25c, and Wee1 over the density of β-actin were obtained for further statistical analysis.
Western blot
The HL-60 cells (1 x 10⁶) were placed in T-25 flasks (Corning). There were three different treatment groups. In group 1, cells were treated with 160 µM mangiferin alone for 24, 48 and 72 h. In group 2, cells were treated with mangiferin with the same procedures as group 1 plus treatment with epidermal growth factor (EGF, 100 ng/mL; Invitrogen) for 15 min prior to harvesting. In group 3, cells were treated with mangiferin with the same procedures as group 1 plus treatment with 1 mM sodium orthovanadate (Sigma-Aldrich) for 3 h prior to harvesting. The cells were then washed with cold PBS twice and lyzed with a lysis buffer [25 mM Tris-HCl, pH 7.5, 150 mM NaCl, 1 mM EDTA, 1% Triton X-100, and 1% protease and phosphatase inhibitor cocktails (Sigma-Aldrich)]. The crude lysates were transferred to pre-chilled centrifuge tubes and centrifuged at 13,000 rpm for 15 min at 4°C. For immunoblotting, lysate protein (30 µg) was resolved on an SDS-polyacrylamide gel fol-lowed by transfer to a PVDF membrane using the Bio-Rad Mini-Protein 3 electrophoresis and transfer apparatus (Bio-Rad). Membranes were then incubated with 5% non-fat dry milk for 1 h at room temperature to block the nonspecific protein binding sites on the membrane followed by incubation with the primary antibodies (rabbit anti-phospho-ATR, ser428; rab-bit anti-phospho-Chk1, ser345 or ser317; rabbit anti-phospho-Wee1, ser642; rabbit anti-phospho-cdc2, tyr15; rabbit anti-phospho-cyclin B1, ser133; rabbit anti-phospho-ERK1/2, T202/Y; mouse anti-Wee1 antibody; rabbit anti-cdc2; rabbit anti-Akt; rabbit anti-ERK1/2 (Cell Signaling Technology, Danvers, MA, USA); rabbit anti-phospho-Akt, ser473 (R & D Systems, Minneapolis, MN, USA); mouse anti-Chk1; mouse anti-cdc25c; rabbit anti-cyclin B1 (Santa Cruz Biotechnology, Santa Cruz, CA, USA); and mouse anti-actin (Sigma-Al-drich) overnight at 4°C on a shaker (VWR International, Radnor, PA, USA). This was fol-lowed by incubation with a goat anti-rabbit or goat anti-mouse HRP-conjugated secondary antibody (KPL, Gaithersburg, MD, USA) at a dilution of 1:5000 at room temperature for 1 h. Protein bands were visualized using SuperSignal West Pico Chemiluminescent Substrate (Pierce, Rockford, IL, USA) and X-ray film exposure.
Statistics analysis
The experimental data were analyzed utilizing the SPSS11.5 statistical software with one-way ANOVA. A difference of P < 0.05 was considered to be significant. GraphPad Prism 5 was used to determine the IC50.
RESULTS
Cell proliferation and viability
HL-60 cells were exposed to 20, 40, 80, 160, 200, and 250 µM mangiferin for 24, 48
Z.G. Peng et al. 4994
©FUNPEC-RP www.funpecrp.com.brGenetics and Molecular Research 14 (2): 4989-5002 (2015)
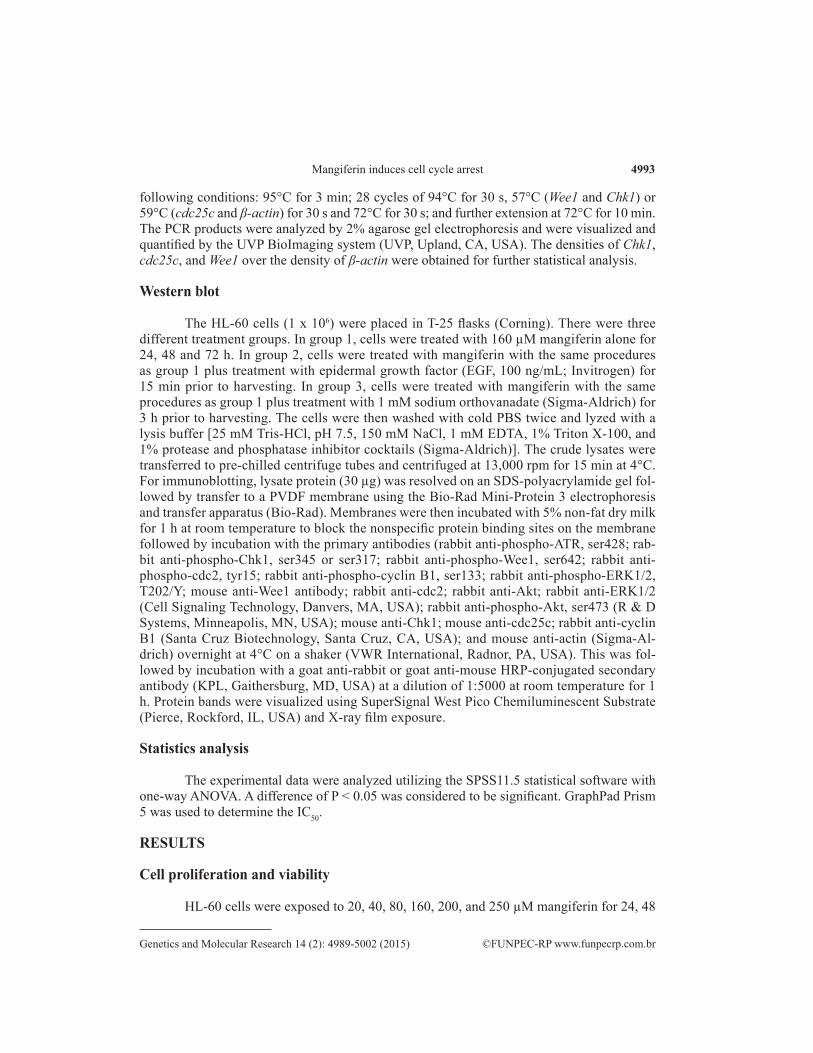
and 72 h. The MTT cell proliferation/cytotoxicity assay results are shown in Table 1. The data represent an average of three different experiments with 5 replicate wells with the correspond-ing standard deviation. The IC50 from 24-, 48- and 72-h treatments are shown in Figure 1.
Table 1. Effect of mangiferin (MA) on cell proliferation/cytotoxicity (MTT assay, OD:490 nm).
MA (µM) 24 h 48 h 72 h
0 0.8583 ± 0.0945 0.9800 ± 0.0562 1.2150 ± 0.0333 20 0.7767 ± 0.0326* 0.8717 ± 0.0671# 0.9500 ± 0.1020#
40 0.7683 ± 0.0402# 0.8300 ± 0.0438# 0.8883 ± 0.0483#
80 0.7350 ± 0.0281# 0.7900 ± 0.0704# 0.8333 ± 0.0814#
160 0.7183 ± 0.0591# 0.7383 ± 0.0331# 0.6500 ± 0.0374#
200 0.6850 ± 0.0187# 0.6350 ± 0.0432# 0.5817 ± 0.1038#
250 0.6267 ± 0.0485# 0.5617 ± 0.0232# 0.4917 ± 0.0147#
*P < 0.05, #P < 0.01 comparing with vehicle control (0 µM).
Figure 1. Effect of mangiferin (MA) on cell growth and viability. HL-60 cells were treated with 20, 40, 80, 160, 200, and 250 µM mangiferin for 24, 48, and 72 h (MTT assay). The absorbance at 570 nm of wavelength was obtained using a microplate reader. The IC50 from various time points of treatment are presented.
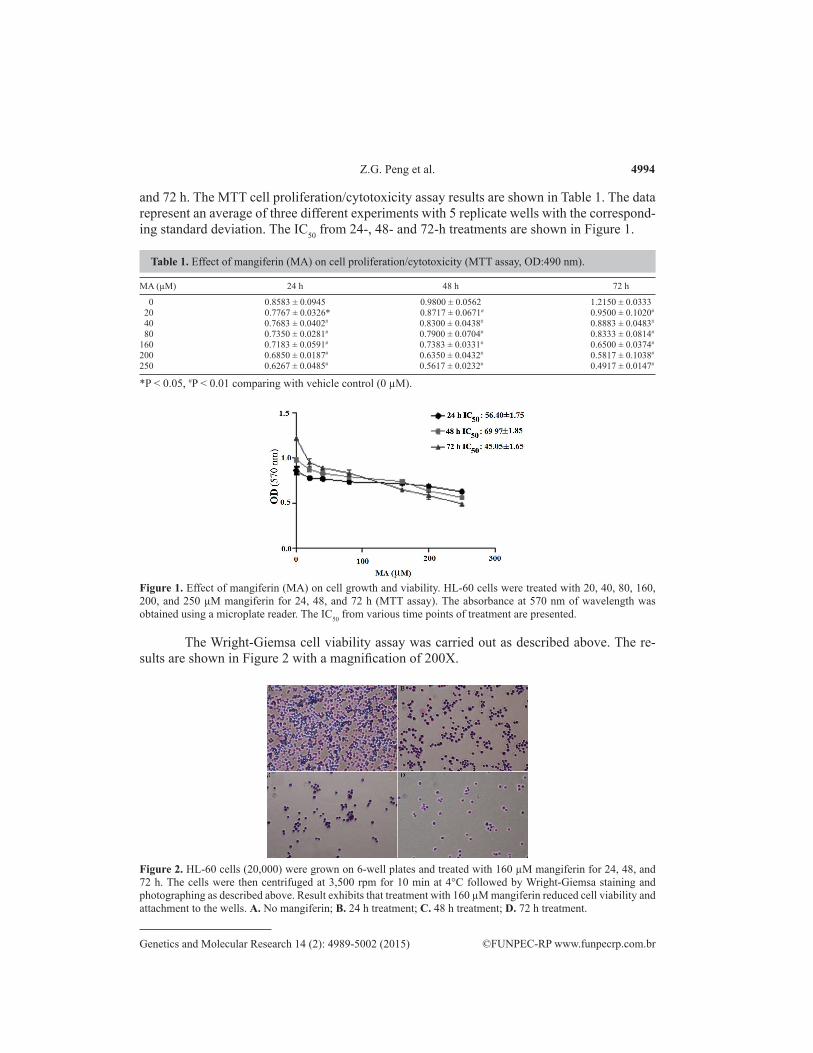
Figure 2. HL-60 cells (20,000) were grown on 6-well plates and treated with 160 µM mangiferin for 24, 48, and 72 h. The cells were then centrifuged at 3,500 rpm for 10 min at 4°C followed by Wright-Giemsa staining and photographing as described above. Result exhibits that treatment with 160 µM mangiferin reduced cell viability and attachment to the wells. A. No mangiferin; B. 24 h treatment; C. 48 h treatment; D. 72 h treatment.
The Wright-Giemsa cell viability assay was carried out as described above. The re-sults are shown in Figure 2 with a magnification of 200X.
4995Mangiferin induces cell cycle arrest
©FUNPEC-RP www.funpecrp.com.brGenetics and Molecular Research 14 (2): 4989-5002 (2015)
Cell cycle
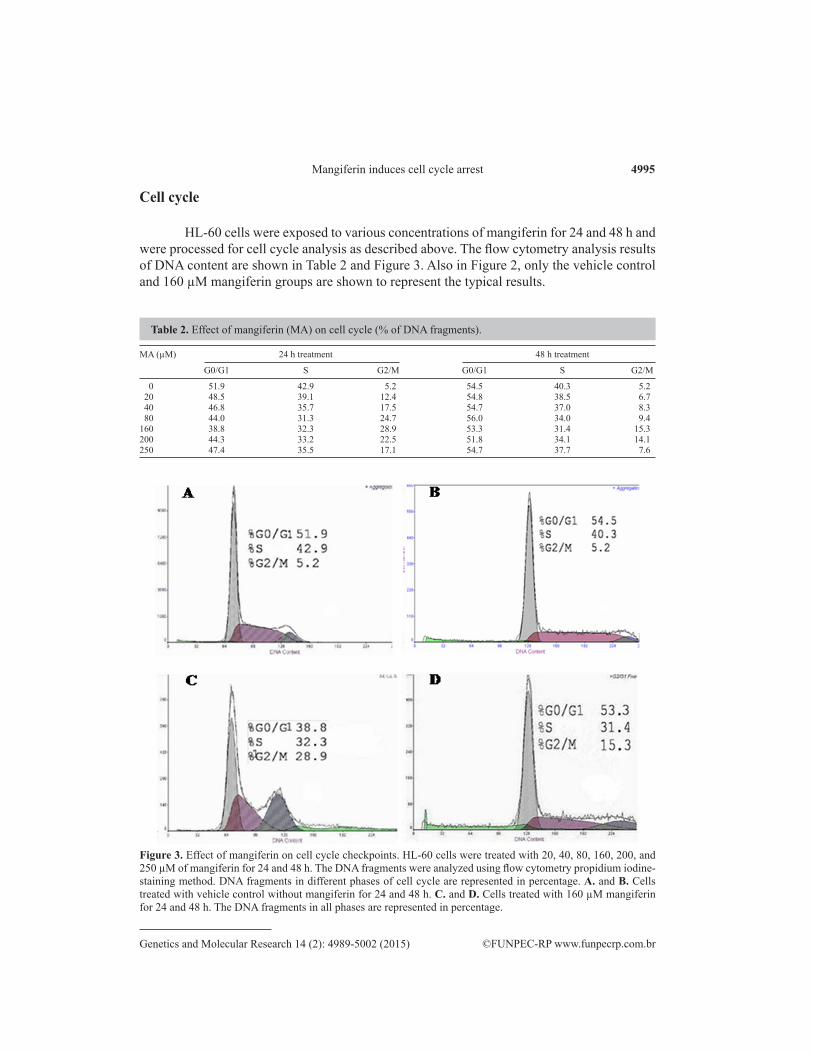
HL-60 cells were exposed to various concentrations of mangiferin for 24 and 48 h and were processed for cell cycle analysis as described above. The flow cytometry analysis results of DNA content are shown in Table 2 and Figure 3. Also in Figure 2, only the vehicle control and 160 µM mangiferin groups are shown to represent the typical results.
Table 2. Effect of mangiferin (MA) on cell cycle (% of DNA fragments).
MA (µM) 24 h treatment 48 h treatment
G0/G1 S G2/M G0/G1 S G2/M
0 51.9 42.9 5.2 54.5 40.3 5.2 20 48.5 39.1 12.4 54.8 38.5 6.7 40 46.8 35.7 17.5 54.7 37.0 8.3 80 44.0 31.3 24.7 56.0 34.0 9.4160 38.8 32.3 28.9 53.3 31.4 15.3200 44.3 33.2 22.5 51.8 34.1 14.1250 47.4 35.5 17.1 54.7 37.7 7.6
Figure 3. Effect of mangiferin on cell cycle checkpoints. HL-60 cells were treated with 20, 40, 80, 160, 200, and 250 µM of mangiferin for 24 and 48 h. The DNA fragments were analyzed using flow cytometry propidium iodine-staining method. DNA fragments in different phases of cell cycle are represented in percentage. A. and B. Cells treated with vehicle control without mangiferin for 24 and 48 h. C. and D. Cells treated with 160 µM mangiferin for 24 and 48 h. The DNA fragments in all phases are represented in percentage.
Z.G. Peng et al. 4996
©FUNPEC-RP www.funpecrp.com.brGenetics and Molecular Research 14 (2): 4989-5002 (2015)
Chk1, cdc25c, and Wee1 mRNA expression
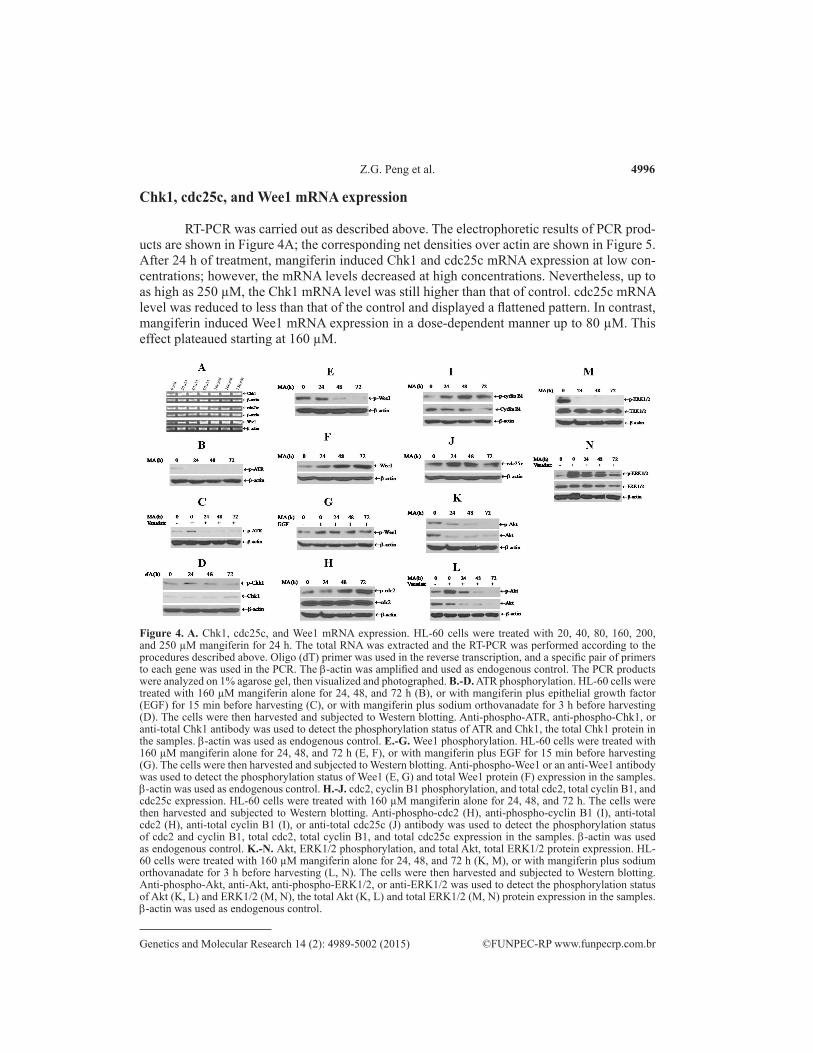
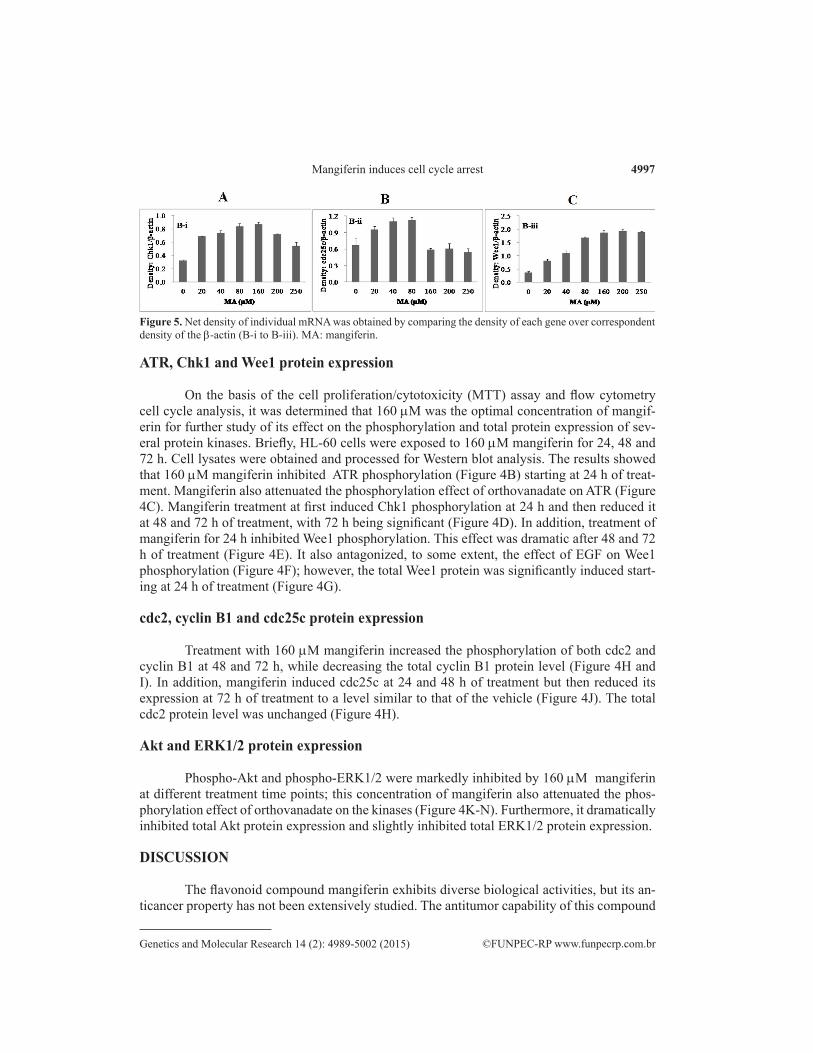
RT-PCR was carried out as described above. The electrophoretic results of PCR prod-ucts are shown in Figure 4A; the corresponding net densities over actin are shown in Figure 5. After 24 h of treatment, mangiferin induced Chk1 and cdc25c mRNA expression at low con-centrations; however, the mRNA levels decreased at high concentrations. Nevertheless, up to as high as 250 µM, the Chk1 mRNA level was still higher than that of control. cdc25c mRNA level was reduced to less than that of the control and displayed a flattened pattern. In contrast, mangiferin induced Wee1 mRNA expression in a dose-dependent manner up to 80 µM. This effect plateaued starting at 160 µM.
Figure 4. A. Chk1, cdc25c, and Wee1 mRNA expression. HL-60 cells were treated with 20, 40, 80, 160, 200, and 250 µM mangiferin for 24 h. The total RNA was extracted and the RT-PCR was performed according to the procedures described above. Oligo (dT) primer was used in the reverse transcription, and a specific pair of primers to each gene was used in the PCR. The b-actin was amplified and used as endogenous control. The PCR products were analyzed on 1% agarose gel, then visualized and photographed. B.-D. ATR phosphorylation. HL-60 cells were treated with 160 µM mangiferin alone for 24, 48, and 72 h (B), or with mangiferin plus epithelial growth factor (EGF) for 15 min before harvesting (C), or with mangiferin plus sodium orthovanadate for 3 h before harvesting (D). The cells were then harvested and subjected to Western blotting. Anti-phospho-ATR, anti-phospho-Chk1, or anti-total Chk1 antibody was used to detect the phosphorylation status of ATR and Chk1, the total Chk1 protein in the samples. b-actin was used as endogenous control. E.-G. Wee1 phosphorylation. HL-60 cells were treated with 160 µM mangiferin alone for 24, 48, and 72 h (E, F), or with mangiferin plus EGF for 15 min before harvesting (G). The cells were then harvested and subjected to Western blotting. Anti-phospho-Wee1 or an anti-Wee1 antibody was used to detect the phosphorylation status of Wee1 (E, G) and total Wee1 protein (F) expression in the samples. b-actin was used as endogenous control. H.-J. cdc2, cyclin B1 phosphorylation, and total cdc2, total cyclin B1, and cdc25c expression. HL-60 cells were treated with 160 µM mangiferin alone for 24, 48, and 72 h. The cells were then harvested and subjected to Western blotting. Anti-phospho-cdc2 (H), anti-phospho-cyclin B1 (I), anti-total cdc2 (H), anti-total cyclin B1 (I), or anti-total cdc25c (J) antibody was used to detect the phosphorylation status of cdc2 and cyclin B1, total cdc2, total cyclin B1, and total cdc25c expression in the samples. b-actin was used as endogenous control. K.-N. Akt, ERK1/2 phosphorylation, and total Akt, total ERK1/2 protein expression. HL-60 cells were treated with 160 µM mangiferin alone for 24, 48, and 72 h (K, M), or with mangiferin plus sodium orthovanadate for 3 h before harvesting (L, N). The cells were then harvested and subjected to Western blotting. Anti-phospho-Akt, anti-Akt, anti-phospho-ERK1/2, or anti-ERK1/2 was used to detect the phosphorylation status of Akt (K, L) and ERK1/2 (M, N), the total Akt (K, L) and total ERK1/2 (M, N) protein expression in the samples. b-actin was used as endogenous control.
4997Mangiferin induces cell cycle arrest
©FUNPEC-RP www.funpecrp.com.brGenetics and Molecular Research 14 (2): 4989-5002 (2015)
Figure 5. Net density of individual mRNA was obtained by comparing the density of each gene over correspondent density of the b-actin (B-i to B-iii). MA: mangiferin.
ATR, Chk1 and Wee1 protein expression
On the basis of the cell proliferation/cytotoxicity (MTT) assay and flow cytometry cell cycle analysis, it was determined that 160 mM was the optimal concentration of mangif-erin for further study of its effect on the phosphorylation and total protein expression of sev-eral protein kinases. Briefly, HL-60 cells were exposed to 160 mM mangiferin for 24, 48 and 72 h. Cell lysates were obtained and processed for Western blot analysis. The results showed that 160 mM mangiferin inhibited ATR phosphorylation (Figure 4B) starting at 24 h of treat-ment. Mangiferin also attenuated the phosphorylation effect of orthovanadate on ATR (Figure 4C). Mangiferin treatment at first induced Chk1 phosphorylation at 24 h and then reduced it at 48 and 72 h of treatment, with 72 h being significant (Figure 4D). In addition, treatment of mangiferin for 24 h inhibited Wee1 phosphorylation. This effect was dramatic after 48 and 72 h of treatment (Figure 4E). It also antagonized, to some extent, the effect of EGF on Wee1 phosphorylation (Figure 4F); however, the total Wee1 protein was significantly induced start-ing at 24 h of treatment (Figure 4G).
cdc2, cyclin B1 and cdc25c protein expression
Treatment with 160 mM mangiferin increased the phosphorylation of both cdc2 and cyclin B1 at 48 and 72 h, while decreasing the total cyclin B1 protein level (Figure 4H and I). In addition, mangiferin induced cdc25c at 24 and 48 h of treatment but then reduced its expression at 72 h of treatment to a level similar to that of the vehicle (Figure 4J). The total cdc2 protein level was unchanged (Figure 4H).
Akt and ERK1/2 protein expression
Phospho-Akt and phospho-ERK1/2 were markedly inhibited by 160 mM mangiferin at different treatment time points; this concentration of mangiferin also attenuated the phos-phorylation effect of orthovanadate on the kinases (Figure 4K-N). Furthermore, it dramatically inhibited total Akt protein expression and slightly inhibited total ERK1/2 protein expression.
DISCUSSION
The flavonoid compound mangiferin exhibits diverse biological activities, but its an-ticancer property has not been extensively studied. The antitumor capability of this compound
Z.G. Peng et al. 4998
©FUNPEC-RP www.funpecrp.com.brGenetics and Molecular Research 14 (2): 4989-5002 (2015)
can be traced back as far as 1987 (Chattopadhyay et al., 1987). In the later stage of studies of this compound, several significant findings relevant to its anticancer properties have been re-ported (Chattopadhyay et al., 1987; Huang et al., 2002; Rajendran et al., 2008; Garcia-Rivera et al., 2011). As mentioned above, this compound has a mild pharmacological action that is less toxic both in vitro and in vivo (Chattopadhyay et al., 1987; Huang et al., 2001, 2002). Che-motherapeutic agents are usually highly toxic to both cancer and normal cells, thus causing significant adverse effects. In addition, cancer cells become tolerant and subsequently resistant to the chemotherapeutic agents during the treatment course. Studies have indicated that this naturally occurring flavonoid compound is effective in inducing apoptosis and blocking cell cycle progression (Huang et al., 2002; Peng et al., 2004; Cheng et al., 2007); however, the molecular mechanisms involved in these actions are not fully understood. In this study, it was shown that the stress response DNA damage pathway, or the ATR-Chk1 pathway, is involved in the inhibition of cell cycle progression by mangiferin in HL-60 leukemia cells.
The cell proliferation/toxicity assay (MTT) results again showed that mangiferin in-hibited the human promyelocytic leukemia cells HL-60 growth in a dose- and time-dependent manner (Table 1) with IC50 of 56.40 ± 1.75 (24 h), 69.97 ± 1.85 (48 h), and 45.05 ± 1.65 µM (72 h) (Figure 1), with the IC50 at 72 h being the lowest. This means that in this cell line, 72 h of treatment is optimal for obtaining the best growth inhibitory effect on the basis of the time points tested in this study. Interestingly, Wright-Giemsa staining of the cells after exposure to 160 µM mangiferin at the indicated times showed that mangiferin significantly inhibited the viability and the adhesion/attachment ability of HL-60 cells, with 72 h of treatment being the most potent, which is consistent with the toxicity assay results (Figure 2). This result also indicates that mangiferin may have impaired or interfered with the assembly or functioning of microtubule filaments or cellular matrix components, thus disrupting the cells’ adhesion/attachment ability, although this hypothesis needs to be further investigated. In addition, this result further confirmed the growth inhibition results from previous studies on leukemia and other types of cancer cells (Huang et al., 2002; Peng et al., 2004; Cheng et al., 2007; du Plessis-Stoman et al., 2011; Shoji et al., 2011). At 72 h, with concentrations as high as 160 µM, mangiferin inhibited approximately half of the cells’ growth (Table 1). This result also indicates that the growth-inhibitory effect of mangiferin is mild, which is consistent with pre-vious reports in other cancers (Chattopadhyay et al., 1987; Huang et al., 2001). It is believed that chemotherapeutic agents such as naturally occurring flavonoid compounds causing mild growth inhibition rather than strong cell kill/toxicity may have lesser adverse side effects. Also, development of resistance of cancer cells to the agents tends to be slower. Similar stud-ies with another type of flavonoid compound, eupatilin, showed that it had relatively low tox-icity to normal cells compared to cisplatin (Cho et al., 2011). In this case, other mechanisms such as immunomodulatory efficacy may be involved in cell growth inhibition caused by man-giferin, as hinted in a previous study (Guha et al., 1996; Makare et al., 2001). This hypothesis would be of interest in future pharmacological and pharmaceutical studies.
The flow cytometry cell cycle analysis indicated that mangiferin, at various concen-trations and time points, inhibited cell cycle progression in HL-60 cells. At the concentrations indicated, cell cycle arrest at G2/M phase occurred after exposure to mangiferin for 24 and 48 h (Table 2). The peak of DNA content in G2/M phase obtained with 160 µM after 24 and 48 h of treatment and the percentage of DNA content in G2/M phase were both increased, with the 24-h treatment being the highest. Interestingly, G2/M DNA content decreased above 160 µM with S phase being slightly increased. This phenomenon suggests that high concentrations of
4999Mangiferin induces cell cycle arrest
©FUNPEC-RP www.funpecrp.com.brGenetics and Molecular Research 14 (2): 4989-5002 (2015)
mangiferin also inhibit DNA synthesis in addition to inhibiting mitosis, and a switch in check-point effect from low to high concentrations was observed. Figure 3 illustrates the typical flow cytometry histograms of the results at 160 µM.
Various concentrations of mangiferin ranging from 20 to 250 mM were tested for 24 h in this experiment. RT-PCR results of Chk1, cdc25c, and Wee1 after mangiferin treatment indi-cated that lower concentrations ranging from 20 to 160 mM induced Chk1 mRNA expression; however, the mRNA level declined at 200 mM. Similar results were observed in the cdc25c mRNA level, with slightly higher potencies compared to that of Chk1. Contrary to Chk1 and cdc25c mRNA expression levels, mangiferin treatment for 24 h increased Wee1 mRNA ex-pression in dose-dependent manner (Figures 4A and 5). On the basis of these results, it was hypothesized that mangiferin is more potent in targeting cdc25c and Wee1 expression than that of Chk1, even though there was insufficient time to perform the time course experiments beyond 24 h for evaluation of mRNA expression.
ATR is one of the kinases belonging to the phosphoinositide-3-like kinase (PI3K) family and shares similar domain architecture and several modes of regulation (Mordes and Cortez, 2008). ATR is activated when DNA damage occurs and preferentially phosphorylates other downstream proteins, including Chk1. ATR is essential in replicating cells, as it responds to replication stress to restore the stalled cell cycle checkpoint and ensures the re-entry of the cell cycle (Cimprich and Cortez, 2008). Thus, ATR and Chk1 are currently considered cancer chemotherapeutic targets, and inhibitors of these kinases have emerged and are being devel-oped as new anticancer agents (Dent et al., 2011). In this study, it was found that mangiferin at 160 µM inhibited the autophosphorylation of ATR. Exposure to mangiferin for various lengths of time completely inhibited ATR phosphorylation starting at 24 h of treatment (Figure 4B).
Vanadate is a broad-spectrum phosphatase inhibitor, although its action is more potent on tyrosine phosphatases than on serine and threonine phosphatases (Crans et al., 1989; Huyer et al., 1997). To confirm whether mangiferin inhibits ATR phosphorylation, HL-60 cells were exposed to mangiferin for the indicated times. Prior to harvesting, cells were treated with 1 mM sodium orthovanadate for 3 h. The results showed that mangiferin inhibited the phos-phorylation of ATR enhanced by vanadate (Figure 4C).
As described above, the cell cycle checkpoint kinase Chk1 is one of ATR’s downstream kinases. Inhibition of the phosphorylation of ATR resulted in first inducing Chk1 phosphoryla-tion at 24 h of treatment and then reducing it at 48 and 72 h (Figure 4D). To interpret this phe-nomenon, it was assumed that Chk1 activity underwent a compensating reaction to maintain the entry of G2/M under stress at 24 h of treatment due to inhibition of its upstream kinase, ATR activity; however, this compensating reaction was diminished with longer treatment time.
Wee1 is a protein kinase that controls the entry of the mitotic phase of the cell cycle through phosphorylation of cdc2 at Tyr15 and Thr14 (McGowan and Russell, 1993). Wee1 also regulates the DNA damage checkpoint that controls G2/M transition (Rowley et al., 1992). Wee1 kinase activity is deactivated when it is phosphorylated or degraded (Watanabe et al., 1995). Studies have found that inhibition of Wee1 results in enhanced cell proliferation (Chen and Gardner, 2004). In this study, the results indicated that mangiferin induced Wee1 expression at both mRNA and protein levels while decreasing autophosphorylation (Figure 4A, E, F). In addition, mangiferin, to some extent, attenuated the EGF-induced phosphoryla-tion of Wee1 (Figure 4G). Thus, it is likely that mangiferin behaves in a dual-action manner by inhibiting ATR and Chk1 kinase activities while enhancing Wee1 activity.
As mentioned above, cdc2 (cyclin-dependent kinase-1, CDK1) functions as serine/

Z.G. Peng et al. 5000
©FUNPEC-RP www.funpecrp.com.brGenetics and Molecular Research 14 (2): 4989-5002 (2015)
threonine kinase and pairs with cyclin B to form a CDK-cyclin B complex that regulates the cell cycle including G2/M checkpoint. The cdc2/cyclin B complex is deactivated when phosphorylated by Wee1 and re-activated by cdc25 (A/B/C) phosphatase via dephosphory-lation (Qiao et al., 2006; Hu and Moscinski, 2011). The cell division cycle 25s (cdc25) are dual-specificity phosphatases that are considered a subclass of protein tyrosine phosphatases. The cdc25 proteins control entry into the cell cycle and progression through various phases of the cell cycle, including the M and S phases during normal cell division, and in the event of DNA damage, they are key targets of the checkpoint machinery that ensures genetic stability (Boutros et al., 2007). In this study, 160 µM mangiferin increased both cdc2 and cyclin B1 phosphorylation starting at 24 h of treatment but reduced the total cyclin B1 protein level at 72 h of treatment; total cdc2 showed no change (Figure 4H and I).
cdc25c was first induced by mangiferin at 24 and 48 h but was then reduced at 72 h of treatment (Figure 4J). This result is consistent with the mRNA level, which indicated that cdc25c was induced by low concentrations (20-80 mM) of mangiferin at 24 h of treatment (Figure 4A). The phosphorylation effects of mangiferin on cdc2 and cyclin B1 indicated that this compound may behave as a cdc25c phosphatase inhibitor and a Wee1 kinase stimulator.
It is already known that PI3K/Akt is one of the downstream pathways and substrates of ATR kinase. Studies have found that Akt is hyperactivated in many human cancers, as it promotes proliferation and cancer cell survival in response to DNA-damaging agents (Fraser et al., 2011). In addition, the extracellular signal-regulated kinase 1/2 (ERK1/2) is also in-volved in ATM/ATR-mediated G2/M checkpoint activation (Yan et al., 2007, 2008). It was found that 160 mM mangiferin dramatically inhibited phospho-Akt and phospho-ERK1/2 as well as total Akt protein in a time-dependent manner; total ERK1/2 protein level was slightly reduced as well after treatment at all time points (Figure 4K and M). Mangiferin also dimin-ished the effect of phosphatase inhibitor vanadate on the phosphorylation of Akt and ERK1/2, with the effect on Akt being more potent (Figure 4L and N). These results indicated that Akt and ERK1/2 are involved in ATR-mediated G2/M checkpoint in the stress response DNA dam-age pathways; however, the precise relationship between ATR and ERK1/2 is still unknown.
In conclusion, this study hypothesizes that mangeferin inhibits cell cycle progression at G2/M phase through the ATR-Chk1-cdc25c and cdc2/cyclin B pathway as illustrated in the following schematic chart:
5001Mangiferin induces cell cycle arrest
©FUNPEC-RP www.funpecrp.com.brGenetics and Molecular Research 14 (2): 4989-5002 (2015)
ACKNOWLEDGMENTS
Research supported by the Natural Science Foundation of Guangxi (grant #0447041 to Z.G. Peng). We sincerely thank Dr. Huayi Huang at Roswell Park Cancer Institute for pro-viding mangiferin and critical discussions on the study.
REFERENCES
Ang E, Liu Q, Qi M, Liu HG, et al. (2011). Mangiferin attenuates osteoclastogenesis, bone resorption, and RANKL-induced activation of NF-κB and ERK. J. Cell. Biochem. 112: 89-97.
Boutros R, Lobjois V and Ducommun B (2007). CDC25 phosphatases in cancer cells: key players? Good targets? Nat. Rev. Cancer 7: 495-507.
Chattopadhyay U, Das S, Guha S and Ghosal S (1987). Activation of lymphocytes of normal and tumor bearing mice by mangiferin, a naturally occurring glucosylxanthone. Cancer Lett. 37: 293-299.
Chen S and Gardner DG (2004). Suppression of WEE1 and stimulation of CDC25A correlates with endothelin-dependent proliferation of rat aortic smooth muscle cells. J. Biol. Chem. 279: 13755-13763.
Cheng P, Peng ZG, Yang J and Song SJ (2007). The effect of mangiferin on telomerase activity and apoptosis in leukemic K562 cells. Zhong Yao Cai 30: 306-309.
Cho JH, Lee JG, Yang YI, Kim JH, et al. (2011). Eupatilin, a dietary flavonoid, induces G2/M cell cycle arrest in human endometrial cancer cells. Food Chem. Toxicol. 49: 1737-1744.
Cimprich KA and Cortez D (2008). ATR: an essential regulator of genome integrity. Nat. Rev. Mol. Cell Biol. 9: 616-627.Crans DC, Simone CM, Saha AK and Glew RH (1989). Vanadate monomers and dimers both inhibit the human prostatic
acid phosphatase. Biochem. Biophys. Res. Commun. 165: 246-250.Dent P, Tang Y, Yacoub A, Dai Y, et al. (2011). CHK1 inhibitors in combination chemotherapy: thinking beyond the cell
cycle. Mol. Interv. 11: 133-140.du Plessis-Stoman D, du Preez J and van de Venter M (2011). Combination treatment with oxaliplatin and mangiferin
causes increased apoptosis and downregulation of NFκB in cancer cell lines. Afr. J. Tradit. Complement. Altern. Med. 8: 177-184.
Fraser M, Harding SM, Zhao H, Coackley C, et al. (2011). MRE11 promotes AKT phosphorylation in direct response to DNA double-strand breaks. Cell Cycle 10: 2218-2232.
Garcia D, Leiro J, Delgado R, Sanmartin ML, et al. (2003). Mangifera indica L. extract (Vimang) and mangiferin modulate mouse humoral immune responses. Phytother. Res. 17: 1182-1187.
Garcia-Rivera D, Delgado R, Bougarne N, Haegeman G, et al. (2011). Gallic acid indanone and mangiferin xanthone are strong determinants of immunosuppressive anti-tumour effects of Mangifera indica L. bark in MDA-MB231 breast cancer cells. Cancer Lett. 305: 21-31.
Garrido G, Gonzalez D, Lemus Y, García D, et al. (2004). In vivo and in vitro anti-inflammatory activity of Mangifera indica L. extract (Vimang). Pharmacol. Res. 50: 143-149.
Guha S, Ghosal S and Chattopadhyay U (1996). Antitumor, immunomodulatory and anti-HIV effect of mangiferin, a naturally occurring glucosylxanthone. Chemotherapy 42: 443-451.
Hu X and Moscinski LC (2011). cdc2: a monopotent or pluripotent CDK? Cell Prolif. 44: 205-211.Huang H, Zhao S, Nong C, Guo L, et al. (2001). The effects of mangiferin on serum soluble E-cadherin and CEA level,
and MAO activity in liver cancer rats. Chin. J. Dig. Dis. 21: 508-509.Huang H, Nong C, Guo L, Meng G, et al. (2002). Mangiferin inhibits liver cancer cell growth and induces cell apoptosis.
Chin. J. Dig. Dis. 22: 341-343.Huyer G, Liu S, Kelly J, Moffat J, et al. (1997). Mechanism of inhibition of protein-tyrosine phosphatases by vanadate and
pervanadate. J. Biol. Chem. 272: 843-851.Makare N, Bodhankar S and Rangari V (2001). Immunomodulatory activity of alcoholic extract of Mangifera indica L. in
mice. J. Ethnopharmacol. 78: 133-137.Marquez L, Garcia-Bueno B, Madrigal JL and Leza JC (2012). Mangiferin decreases inflammation and oxidative damage
in rat brain after stress. Eur. J. Nutr. 51: 729-739.McGowan CH and Russell P (1993). Human Wee1 kinase inhibits cell division by phosphorylating p34cdc2 exclusively
on Tyr15. EMBO J. 12: 75-85.Mordes DA and Cortez D (2008). Activation of ATR and related PIKKs. Cell Cycle 7: 2809-2812.Muruganandan S, Lal J and Gupta PK (2005). Immunotherapeutic effects of mangiferin mediated by the inhibition of
Z.G. Peng et al. 5002
©FUNPEC-RP www.funpecrp.com.brGenetics and Molecular Research 14 (2): 4989-5002 (2015)
oxidative stress to activated lymphocytes, neutrophils and macrophages. Toxicology 215: 57-68.Nong C, He W, Fleming D, Pan L, et al. (2005). Capillary electrophoresis analysis of mangiferin extracted from Mangiferin
indica L. bark and Mangifera persiciformis C.Y. Wu et T.L. Ming leaves. J. Chromatogr. B Analyt. Technol. Biomed. Life Sci. 826: 226-231.
Pardo-Andreu GL, Paim BA, Castilho RF, Velho JA, et al. (2008). Mangiferin indica L. extract (Vimang) and its main polyphenol mangiferin prevent mitochondrial oxidative stress in atherosclerosis-prone hypercholesterolemic mouse. Pharmacol. Res. 57: 332-338.
Peng ZG, Luo J, Xia LH, Chen Y, et al. (2004). CML cell line K562 cell apoptosis induced by mangiferin. Zhongguo Shi Yan Xue Ye Xue Za Zhi 12: 590-594.
Qiao M, Shapiro P, Fosbrink M, Rus H, et al. (2006). Cell cycle-dependent phosphorylation of the RUNX2 transcription factor by cdc2 regulates endothelial cell proliferation. J. Biol. Chem. 281: 7118-7128.
Rajendran P, Ekambaram G and Sakthisekaran D (2008). Effect of mangiferin on benzo(a) pyrene induced lung carcinogenesis in experimental Swiss albino mice. Nat. Prod. Res. 22: 672-680.
Rivera DG, Hernandez I, Merino N, Luque Y, et al. (2011). Mangiferin indica L. extract (Vimang) and mangiferin reduce the airway inflammation and Th2 cytokines in murine model of allergic asthma. J. Pharm. Pharmacol. 63: 1336-1345.
Rowley R, Hudson J and Young PG (1992). The wee1 protein kinase is required for radiation-induced mitotic delay. Nature 356: 353-355.
Sarkar A, Sreenivasan Y, Ramesh GT and Manna SK (2004). β-D-glucoside suppresses tumor necrosis factor-induced activation of nuclear transcription factor κB but potentiates apoptosis. J. Biol. Chem. 279: 33768-33781.
Shoji K, Tsubaki M, Yamazoe Y, Satou T, et al. (2011). Mangiferin induces apoptosis by suppressing Bcl-xL and XIAP expressions and nuclear entry of NF-κB in HL-60 cells. Arch. Pharm. Res. 34: 469-475.
Watanabe N, Broome M and Hunter T (1995). Regulation of the human WEE1Hu CDK tyrosine 15-kinase during the cell cycle. EMBO J. 14: 1878-1891.
Yan Y, Back CP and Cowan KH (2007). Irradiation-induced G2/M checkpoint response requires ERK1/2 activation. Oncogene 26: 4689-4698.
Yan Y, Black CP, Cao PT, Haferbier JL, et al. (2008). Gamma-irradiation-induced DNA damage checkpoint activation involves feedback regulation between extracellular signal-regulated kinase ½ and BRCA1. Cancer Res. 68: 5113-5121.
Yao YB, Peng ZG, Liu ZF, Yang J, et al. (2010). Effects of mangiferin on cell cycle status and CDC2/Cyclin B1 expression of HL-60 cells. Zhong Yao Cai 33: 81-85.