manegerial+eco costs production
TRANSCRIPT

8/8/2019 Manegerial+ECO Costs Production
http://slidepdf.com/reader/full/manegerialeco-costs-production 1/61
Copyright © 2004 South-Western/
The Costs of Production

8/8/2019 Manegerial+ECO Costs Production
http://slidepdf.com/reader/full/manegerialeco-costs-production 2/61
Copyright © 2004 South-Western/
The Market Forces of Supply andDemand
Supply and demand are the two words that
economists use most often.
Supply and demand are the forces that make
market economies work.
Modern microeconomics is about supply,
demand, and market equilibrium.

8/8/2019 Manegerial+ECO Costs Production
http://slidepdf.com/reader/full/manegerialeco-costs-production 3/61
Copyright © 2004 South-Western/
WHAT ARE COSTS?
According to the Law of SupplyLaw of Supply:
Firms are willing to produce and sell a greater
quantity of a good when the price of the good is
high.
This results in a supply curve that slopes upward.

8/8/2019 Manegerial+ECO Costs Production
http://slidepdf.com/reader/full/manegerialeco-costs-production 4/61
Copyright © 2004 South-Western/
WHAT ARE COSTS?
The Firm¶s Objective
The economic goal of the firm is to maximize
profits.

8/8/2019 Manegerial+ECO Costs Production
http://slidepdf.com/reader/full/manegerialeco-costs-production 5/61
Copyright © 2004 South-Western/
Total Revenue, Total Cost, and Profit
Tot al Revenue
The amount a firm receives for the sale of its
output.
Tot al C ost
The market value of the inputs a firm uses in
production.

8/8/2019 Manegerial+ECO Costs Production
http://slidepdf.com/reader/full/manegerialeco-costs-production 6/61
Copyright © 2004 South-Western/
Total Revenue, Total Cost, and Profit
Pr ofit is the firm¶s total revenue minus its total
cost.
Profit = Total revenueProfit = Total revenue -- Total costTotal cost

8/8/2019 Manegerial+ECO Costs Production
http://slidepdf.com/reader/full/manegerialeco-costs-production 7/61
Copyright © 2004 South-Western/
Costs as Opportunity Costs
A firm¶s cost of pr oduction includes all the
opportunity costs of making its output of goods
and services.
Explicit and Implicit Costs
A firm¶s cost of production include explicit costs
and implicit costs.
Expl icit costs are input costs that require a direct outlay of money by the firm.
Impl icit costs are input costs that do not require an outlay
of money by the firm.

8/8/2019 Manegerial+ECO Costs Production
http://slidepdf.com/reader/full/manegerialeco-costs-production 8/61
Copyright © 2004 South-Western/
Economic Profit versus Accounting Profit
Economists measure a firm¶s economic pr ofit as
total revenue minus total cost, including both
explicit and implicit costs.
Accountants measure the accounting pr ofit as
the firm¶s total revenue minus only the firm¶s
explicit costs.

8/8/2019 Manegerial+ECO Costs Production
http://slidepdf.com/reader/full/manegerialeco-costs-production 9/61
Copyright © 2004 South-Western/
Economic Profit versus Accounting Profit
When total revenue exceeds both explicit and
implicit costs, the firm earns economic profit.
Economic profit is smaller than accounting profit.

8/8/2019 Manegerial+ECO Costs Production
http://slidepdf.com/reader/full/manegerialeco-costs-production 10/61
Figure 1 Economic versus Accountants
Copyright © 2004 South-Western
Revenue
Total
opportunitycosts
How an Economist
Views a Firm
How an Accountant
Views a Firm
Revenue
Economicprofit
Implicitcosts
Explicitcosts
Explicitcosts
Accountingprofit

8/8/2019 Manegerial+ECO Costs Production
http://slidepdf.com/reader/full/manegerialeco-costs-production 11/61
Table 1 A Production Function and Total Cost:Hungry Helen¶s Cookie Factory
Copyright©2004 South-Western

8/8/2019 Manegerial+ECO Costs Production
http://slidepdf.com/reader/full/manegerialeco-costs-production 12/61
Copyright © 2004 South-Western/
PRODUCTION AND COSTS
The Production Function
The pr oduction f unction shows the relationship
between quantity of inputs used to make a good and
the quantity of output of that good.
8/8/2019 Manegerial+ECO Costs Production
http://slidepdf.com/reader/full/manegerialeco-costs-production 13/61
Copyright © 2004 South-Western/
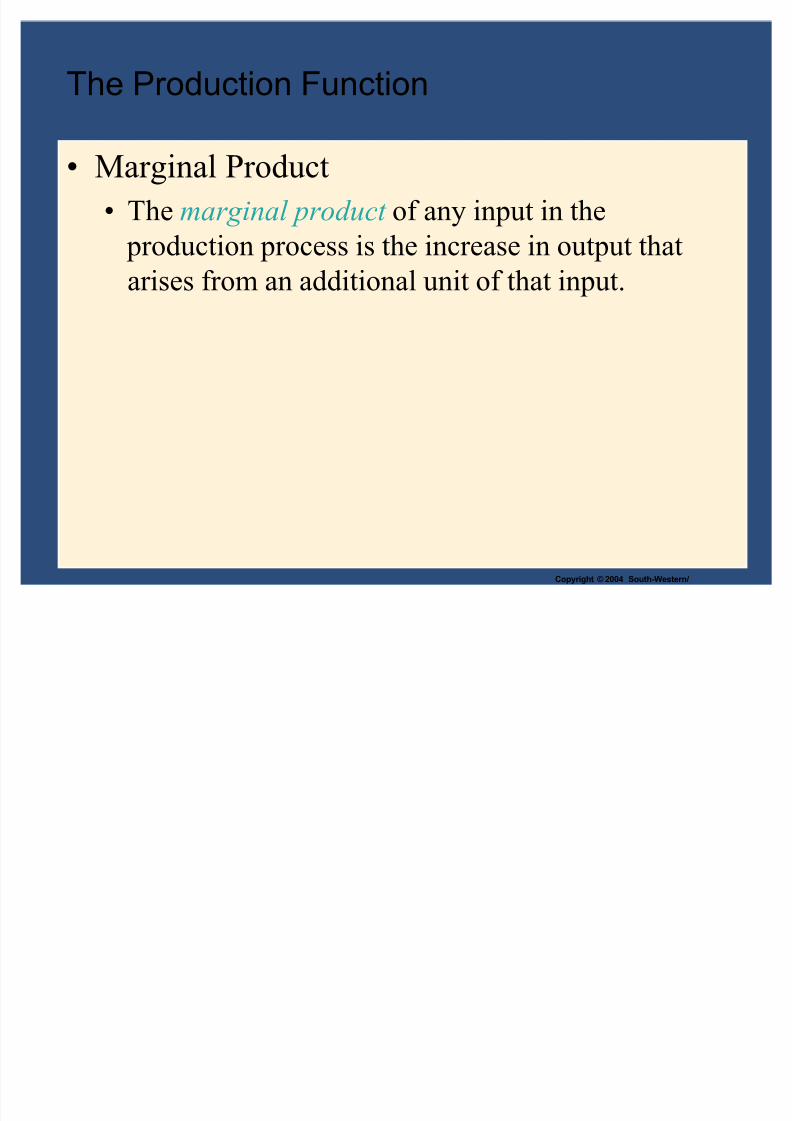
The Production Function
Marginal Product
The mar g inal pr oduct of any input in the
production process is the increase in output that
arises from an additional unit of that input.

8/8/2019 Manegerial+ECO Costs Production
http://slidepdf.com/reader/full/manegerialeco-costs-production 14/61
Copyright © 2004 South-Western/
The Production Function
Diminishing Marginal Product
Diminishing mar g inal pr oduct is the property
whereby the marginal product of an input declines
as the quantity of the input increases. Example: As more and more workers are hired at a firm,
each additional worker contributes less and less to
production because the firm has a limited amount of
equipment.

8/8/2019 Manegerial+ECO Costs Production
http://slidepdf.com/reader/full/manegerialeco-costs-production 15/61
Figure 2 Hungry Helen¶s Production Function
Copyright © 2004 South-Western
Quantity of
Output(cookies
per hour)
150
140
130
120
110
100
90
80
70
60
50
40
30
20
10
Number of Workers Hired0 1 2 3 4 5
Production function

8/8/2019 Manegerial+ECO Costs Production
http://slidepdf.com/reader/full/manegerialeco-costs-production 16/61
Copyright © 2004 South-Western/
From the Production Function to the Total-Cost Curve
The relationship between the quantity a firm
can produce and its costs determines pricing
decisions.
The tot al-cost cur ve shows this relationship
graphically.

8/8/2019 Manegerial+ECO Costs Production
http://slidepdf.com/reader/full/manegerialeco-costs-production 17/61
Table 1 A Production Function and Total Cost:Hungry Helen¶s Cookie Factory
Copyright©2004 South-Western

8/8/2019 Manegerial+ECO Costs Production
http://slidepdf.com/reader/full/manegerialeco-costs-production 18/61
Figure 3 Hungry Helen¶s Total-Cost Curve
Copyright © 2004 South-Western
Total
Cost
$80
70
60
50
40
30
20
10
Quantity
of Output(cookies per hour)
0 10 20 30 15013011090705040 1401201008060
Total-costcurve

8/8/2019 Manegerial+ECO Costs Production
http://slidepdf.com/reader/full/manegerialeco-costs-production 19/61
Copyright © 2004 South-Western/
THE V ARIOUS MEASURES OFCOST
Costs of production may be divided into fi xed
costs and var iable costs.
Fixed costsFixed costs are those costs that do not vary
with the quantity of output produced.
Variable costsVariable costs are those costs that d o var y with
the quantity of output produced.

8/8/2019 Manegerial+ECO Costs Production
http://slidepdf.com/reader/full/manegerialeco-costs-production 20/61
Copyright © 2004 South-Western/
Fixed and Variable Costs
Total Costs
Total Fixed Costs (TF C )
Total Variable Costs (TV C )
Total Costs (T C )
T C = TF C + TV C

8/8/2019 Manegerial+ECO Costs Production
http://slidepdf.com/reader/full/manegerialeco-costs-production 21/61
Table 2 The Various Measures of Cost: ThirstyThelma¶s Lemonade Stand
Copyright©2004 South-Western

8/8/2019 Manegerial+ECO Costs Production
http://slidepdf.com/reader/full/manegerialeco-costs-production 22/61
Copyright © 2004 South-Western/
Fixed and Variable Costs
Average Costs
Average costs can be determined by dividing the
firm¶s costs by the quantity of output it produces.
The average cost is the cost of each typical unit of product.
Average Fixed Costs ( A F C )
Average Variable Costs ( AV C )
Average Total Costs ( AT C )
AT C = A F C + AV C

8/8/2019 Manegerial+ECO Costs Production
http://slidepdf.com/reader/full/manegerialeco-costs-production 23/61
Copyright © 2004 South-Western/
Average Costs
AFCFC
Q! !
Fixed cost
Quantity
AVCVC
Q! !Variable cost
uantity
ATCTC
Q! !
Total cost
uantity

8/8/2019 Manegerial+ECO Costs Production
http://slidepdf.com/reader/full/manegerialeco-costs-production 24/61
Table 2 The Various Measures of Cost: ThirstyThelma¶s Lemonade Stand
Copyright©2004 South-Western

8/8/2019 Manegerial+ECO Costs Production
http://slidepdf.com/reader/full/manegerialeco-costs-production 25/61
Copyright © 2004 South-Western/
Fixed and Variable Costs
Marginal Cost
M ar g inal cost ( M C ) measures the increase in total
cost that arises from an extra unit of production.
Marginal cost helps answer the following question: How much does it cost to produce an additional unit of
output?
MC TCQ
! !(change in total cost)(change in quantity)
(
(

8/8/2019 Manegerial+ECO Costs Production
http://slidepdf.com/reader/full/manegerialeco-costs-production 26/61
Copyright © 2004 South-Western/
Marginal CostThirsty Thelma¶s Lemonade Stand
Quantity TotalCost
MarginalCost
Quantity TotalCost
MarginalCost
0 $3.00 1 3.30 $0.30 6 $7.80 $1.30
2 3.80 0.50 7 9.30 1.503 4.50 0.70 8 11.00 1.70
4 5.40 0.90 9 12.90 1.90
5 6.50 1.10 10 15.00 2.10

8/8/2019 Manegerial+ECO Costs Production
http://slidepdf.com/reader/full/manegerialeco-costs-production 27/61
Figure 5 Thirsty Thelma¶s Average-Cost and Marginal-CostCurves
Copyright © 2004 South-Western
Costs
$3.50
3.25
3.00
2.75
2.50
2.25
2.00
1.75
1.50
1.25
1.00
0.75
0.50
0.25
Quantity
of Output
(glasses of lemonade per hour)
0 1 432 765 98 10
MC
ATC
AVC
AFC

8/8/2019 Manegerial+ECO Costs Production
http://slidepdf.com/reader/full/manegerialeco-costs-production 28/61
Copyright © 2004 South-Western/
Cost Curves and Their Shapes
The average totalaverage total--costcost curve is U - shaped .
At very low levels of output average total cost
is high because fixed cost is spread over only a
few units.
Average total cost declines as output increases.
Average total cost starts rising because average
variable cost rises substantially.

8/8/2019 Manegerial+ECO Costs Production
http://slidepdf.com/reader/full/manegerialeco-costs-production 29/61
Copyright © 2004 South-Western/
Cost Curves and Their Shapes
The bottom of the U-shaped AT C curve occurs
at the quantity that minimize s aver age tot al
cost . This quantity is sometimes called the
e fficient scale of the firm.

8/8/2019 Manegerial+ECO Costs Production
http://slidepdf.com/reader/full/manegerialeco-costs-production 30/61
Figure 5 Thirsty Thelma¶s Average-Cost and Marginal-CostCurves
Copyright © 2004 South-Western
Costs
$3.50
3.25
3.00
2.75
2.50
2.25
2.00
1.75
1.50
1.25
1.00
0.75
0.50
0.25
Quantity
of Output
(glasses of lemonade per hour)
0 1 432 765 98 10
ATC

8/8/2019 Manegerial+ECO Costs Production
http://slidepdf.com/reader/full/manegerialeco-costs-production 31/61
Copyright © 2004 South-Western/
Cost Curves and Their Shapes
Relationship between Marginal Cost and
Average Total Cost
Whenever marginal cost is less than average total
cost, average total cost is falling.
Whenever marginal cost is greater than average
total cost, average total cost is rising.

8/8/2019 Manegerial+ECO Costs Production
http://slidepdf.com/reader/full/manegerialeco-costs-production 32/61
Copyright © 2004 South-Western/
Cost Curves and Their Shapes
Relationship Between Marginal Cost and
Average Total Cost
The marginal-cost curve crosses the average-total-
cost curve at the efficient scaleefficient scale. Efficient scale is the quantity that minimizes average total
cost.

8/8/2019 Manegerial+ECO Costs Production
http://slidepdf.com/reader/full/manegerialeco-costs-production 33/61
Figure 5 Thirsty Thelma¶s Average-Cost and Marginal-CostCurves
Copyright © 2004 South-Western
Costs
$3.50
3.25
3.00
2.75
2.50
2.25
2.00
1.75
1.50
1.25
1.00
0.75
0.50
0.25
Quantity
of Output
(glasses of lemonade per hour)
0 1 432 765 98 10
ATC
MC

8/8/2019 Manegerial+ECO Costs Production
http://slidepdf.com/reader/full/manegerialeco-costs-production 34/61
Copyright © 2004 South-Western/
Typical Cost Curves
It is now time to examine the
relationships that exist between the
different measures of cost.

8/8/2019 Manegerial+ECO Costs Production
http://slidepdf.com/reader/full/manegerialeco-costs-production 35/61
Copyright © 2004 South-Western/
Big Bob¶s Cost Curves

8/8/2019 Manegerial+ECO Costs Production
http://slidepdf.com/reader/full/manegerialeco-costs-production 36/61
Copyright © 2004 South-Western/
Typical Cost Curves
Three Important Properties of Cost Curves
Marginal cost eventually rises with the quantity of
output.
The average-total-cost curve is U-shaped.
The marginal-cost curve crosses the average-total-
cost curve at the minimum of average total cost.

8/8/2019 Manegerial+ECO Costs Production
http://slidepdf.com/reader/full/manegerialeco-costs-production 37/61
Copyright © 2004 South-Western/
COSTS IN THE SHORT RUN ANDIN THE LONG RUN
For many firms, the division of total costs
between fixed and variable costs depends on the
time horizon being considered.
In the short run, some costs are fixed.
In the long run, fixed costs become variable costs.

8/8/2019 Manegerial+ECO Costs Production
http://slidepdf.com/reader/full/manegerialeco-costs-production 38/61
Copyright © 2004 South-Western/
COSTS IN THE SHORT RUN ANDIN THE LONG RUN
Because many costs are fixed in the short run
but variable in the long run, a firm¶s long-run
cost curves differ from its short-run cost curves.

8/8/2019 Manegerial+ECO Costs Production
http://slidepdf.com/reader/full/manegerialeco-costs-production 39/61
Figure 7 Average Total Cost in the Short and Long Run
Copyright © 2004 South-Western
Quantity of
Cars per Day
0
AverageTotal
Cost
1,200
$12,000
ATC in shortrun with
small factory
ATC in shortrun with
medium factory
ATC in shortrun with
large factory
ATC in long run

8/8/2019 Manegerial+ECO Costs Production
http://slidepdf.com/reader/full/manegerialeco-costs-production 40/61
Copyright © 2004 South-Western/
Economies and Diseconomies of Scale
E conomie s of scale refer to the property
whereby long-run average total cost falls as the
quantity of output increases.
Diseconomie s of scale refer to the propertywhereby long-run average total cost rises as the
quantity of output increases.
C on st ant r et ur n s to scale refers to the propertywhereby long-run average total cost stays the
same as the quantity of output increases

8/8/2019 Manegerial+ECO Costs Production
http://slidepdf.com/reader/full/manegerialeco-costs-production 41/61
Figure 7 Average Total Cost in the Short and Long Run
Copyright © 2004 South-Western
Quantity of
Cars per Day
0
AverageTotal
Cost
1,200
$12,000
1,000
10,000
Economies
of scale
ATC in shortrun with
small factory
ATC in shortrun with
medium factory
ATC in shortrun with
large factory ATC in long run
Diseconomiesof
scale
Constant
returns toscale

8/8/2019 Manegerial+ECO Costs Production
http://slidepdf.com/reader/full/manegerialeco-costs-production 42/61
Copyright © 2004 South-Western/
Linkage Between Cost, Revenueand Output Through Optimization
Total Revenue: is the total amount of money received by a firm
from goods and services sold during a certain time period.
TR= P X Q
Average R evenue: is the revenue earned per unit of output sold.AR= TR/Q

8/8/2019 Manegerial+ECO Costs Production
http://slidepdf.com/reader/full/manegerialeco-costs-production 43/61
Copyright © 2004 South-Western/
Linkage Between Cost, Revenueand Output Through Optimization
M arginal Revenue: is a revenue a firm gains in
producing one additional unit of a commodity.
It is calculated by determining the difference
between the total revenues earned before andafter a unit increase in production. Thus:
M Rq= TRq-TRq-1
M R= ¨ TR/¨Output

8/8/2019 Manegerial+ECO Costs Production
http://slidepdf.com/reader/full/manegerialeco-costs-production 44/61
Copyright © 2004 South-Western/
Break Even Analysis
It examines the relation between total revenue,
total costs and total profits of a firm at different
levels of ouput.
It is basically about determining profits at various projects levels of sales, identifying the
breakeven point, and making managerial
decision regarding the relationship betweenlikely sales and the breakeven point.

8/8/2019 Manegerial+ECO Costs Production
http://slidepdf.com/reader/full/manegerialeco-costs-production 45/61
Copyright © 2004 South-Western/

8/8/2019 Manegerial+ECO Costs Production
http://slidepdf.com/reader/full/manegerialeco-costs-production 46/61
Copyright © 2004 South-Western/
Break Even Analysis
F rom the above diagram:
1. On the vertical axis cost and revenue is
calculated
2. On the horizontal axis ³output/production
(units) is calculated
3. You draw the total cost curve (TC in the
diagram) which shows the total cost associatedwith each possible level of output.

8/8/2019 Manegerial+ECO Costs Production
http://slidepdf.com/reader/full/manegerialeco-costs-production 47/61
Copyright © 2004 South-Western/
Break Even Analysis
4. The fixed cost curve (FC) which shows the
costs that do not vary with output level, and
finally the total revenue line which show the
total amount of revenue received at each outputlevel, given the price you will be charging.
5. The break even points (E) is the point of
intersection between the total cost curve (TC)and a total revenue curve ( TR )

8/8/2019 Manegerial+ECO Costs Production
http://slidepdf.com/reader/full/manegerialeco-costs-production 48/61
Copyright © 2004 South-Western/
Break Even Analysis
6. The gap between total costs line and revenue
line beyond the breakeven point represents the
level of profit (or loss). If the gap is such that
TC line is above is above the TR line, the areawould represents loss, if the TR line is above
TC line, would represents profit.

8/8/2019 Manegerial+ECO Costs Production
http://slidepdf.com/reader/full/manegerialeco-costs-production 49/61
Copyright © 2004 South-Western/
Break even analysis depends on the following
variables:
The fixed production costs for a product.
The variable production costs for a product.
The product's unit price.
The product's expected unit sales [sometimes
called projected sales.]

8/8/2019 Manegerial+ECO Costs Production
http://slidepdf.com/reader/full/manegerialeco-costs-production 50/61
Copyright © 2004 South-Western/
Break Even Analysis
On the surface, break-even analysis is a tool to
calculate at which sales volume the variable and
fixed costs of producing your product will be
recovered. Another way to look at it is that the break-even point is the point at which your
product stops costing you money to produce
and sell, and starts to generate a profit for your company.

8/8/2019 Manegerial+ECO Costs Production
http://slidepdf.com/reader/full/manegerialeco-costs-production 51/61
Copyright © 2004 South-Western/
Break Even Analysis
You can also use break even analysis to solve
managerial problems:
setting price levels
targeting optimal variable/ fixed cost
combinations
determining the financial attractiveness of
different strategic options for your company

8/8/2019 Manegerial+ECO Costs Production
http://slidepdf.com/reader/full/manegerialeco-costs-production 52/61
Copyright © 2004 South-Western/
Break Even Analysis
Break Even Point = Fixed Costs/Price ±
Variable Costs
XYZ C or por ation ha s cal culat ed that it ha s fi xed costs
that con sist of its lea se, depr eciation of its a ssets ,executive salar ie s , and pr o per t y t axe s. Those fi xed
costs add up to $60,000. Their pr oduct is the A/ C s.
Their var iable costs a ssociat ed with pr oducing the
A/ C s ar e r aw mat er ial, f actor y labor , and sale s commission s. V ar iable costs have been cal culat ed to
be $0.80 per unit. The pr oduct is pr iced at $2.00 each

8/8/2019 Manegerial+ECO Costs Production
http://slidepdf.com/reader/full/manegerialeco-costs-production 53/61
Copyright © 2004 South-Western/
Given this information, we can calculate the
breakeven point for XYZ Corporation¶s
product, the A/C.
Fixed Costs/Price ± Variable Costs
$60,000/$2.00 - $0.80 = 50,000 units
XYZ Corporation has to produce and sell 50,000
units in order to cover their total expenses,fixed and variable. At this level of sales, they
will make no profit but will just breakeven.

8/8/2019 Manegerial+ECO Costs Production
http://slidepdf.com/reader/full/manegerialeco-costs-production 54/61
Copyright © 2004 South-Western/
What Happens to the Break even Point if
Sales Change?
What if your sales change? For example, if the
economy is in a recession, your sales mightdrop. If sales drop, then you won¶t sell enough
to make your breakeven point. In the example
of XYZ Corporation, you might not sell the50,000 units necessary to breakeven.

8/8/2019 Manegerial+ECO Costs Production
http://slidepdf.com/reader/full/manegerialeco-costs-production 55/61
Copyright © 2004 South-Western/
In that case, you would not be able to pay all
your expenses. What can you do in this
situation?
If you look at the breakeven formula, you cansee that there are two solutions. You can either
raise the price of your product or you can find
ways to cut your costs, your fixed and/or your variable costs

8/8/2019 Manegerial+ECO Costs Production
http://slidepdf.com/reader/full/manegerialeco-costs-production 56/61
Copyright © 2004 South-Western/
Let¶s say you find a way to cut the cost of your
overhead or fixed costs by reducing your own
salary by $10,000. That makes your fixed costs
drop from $60,000 to $50,000. The breakeven point is, holding other variables the same,:

8/8/2019 Manegerial+ECO Costs Production
http://slidepdf.com/reader/full/manegerialeco-costs-production 57/61
Copyright © 2004 South-Western/
$50,000/$2.00-$0.80 = 41,666 units
Predictably, cutting your fixed costs drops your
breakeven point.If you reduce your variable costs by
cutting your costs of goods sold to $0.60 per unit, thenyour breakeven point, holding other variables the
same, becomes:
60,000/$2.00-$0.60=42,857 units
From this analysis, you can see that if you can reduce thecost variables, you can lower your breakeven point
without having to raise your price

8/8/2019 Manegerial+ECO Costs Production
http://slidepdf.com/reader/full/manegerialeco-costs-production 58/61
Copyright © 2004 South-Western/
Summary
The goal of firms is to maximize profit, which
equals total revenue minus total cost.
When analyzing a firm¶s behavior, it is
important to include all the opportunity costs of production.
Some opportunity costs are explicit while other
opportunity costs are implicit.

8/8/2019 Manegerial+ECO Costs Production
http://slidepdf.com/reader/full/manegerialeco-costs-production 59/61
Copyright © 2004 South-Western/
Summary
A firm¶s costs reflect its production process.
A typical firm¶s production function gets flatter
as the quantity of input increases, displaying the
property of diminishing marginal product.
A firm¶s total costs are divided between fixed
and variable costs. Fixed costs do not change
when the firm alters the quantity of output produced; variable costs do change as the firm
alters quantity of output produced.

8/8/2019 Manegerial+ECO Costs Production
http://slidepdf.com/reader/full/manegerialeco-costs-production 60/61
Copyright © 2004 South-Western/
Summary
Average total cost is total cost divided by the
quantity of output.
Marginal cost is the amount by which total cost
would rise if output were increased by one unit.
The marginal cost always rises with the
quantity of output.
Average cost first falls as output increases andthen rises.

8/8/2019 Manegerial+ECO Costs Production
http://slidepdf.com/reader/full/manegerialeco-costs-production 61/61
Summary
The average-total-cost curve is U-shaped.
The marginal-cost curve always crosses the
average-total-cost curve at the minimum of
ATC.
A firm¶s costs often depend on the time horizon
being considered.
In particular, many costs are fixed in the shortrun but variable in the long run.