manappuram finance · pdf filemanappuram finance limited investor presentation november 2017...
TRANSCRIPT

Manappuram Finance Limited
Investor PresentationNovember 2017
Gold Loans Housing FinanceMicrofinance Vehicle Finance

Quarterly Update
Company Overview
Business Strategy
Key Technology Initiatives
Annexure

3
AUM
Rs 137,232 Mn
(+ 2.6% QoQ)
Capital Adequacy *
28.7%
Net Profit
Rs 1,603.7 Mn
(3.5 % QoQ)
Borrowing Cost *
8.8%
Networth
Rs 35,748 Mn
GNPA *
1.2%
ROA 4.3%
ROE 18.2%
BV / Share Rs 42.46
EPS Rs 7.61
AUM: Assets Under Management, Net Profit: PAT after Minority Interest
* Calculated on standalone basis
Q2 FY18 RESULTS:
CONSOLIDATED RESULT HIGHLIGHTS
Dividend / Share
FY17: Rs 2.00
Share of New
Businesses
22.0%
Total Branches
4,148
No of Live Customers
3.5 mn
4
Q2 FY18 RESULTS:
CONSOLIDATED PROFIT & LOSS STATEMENT
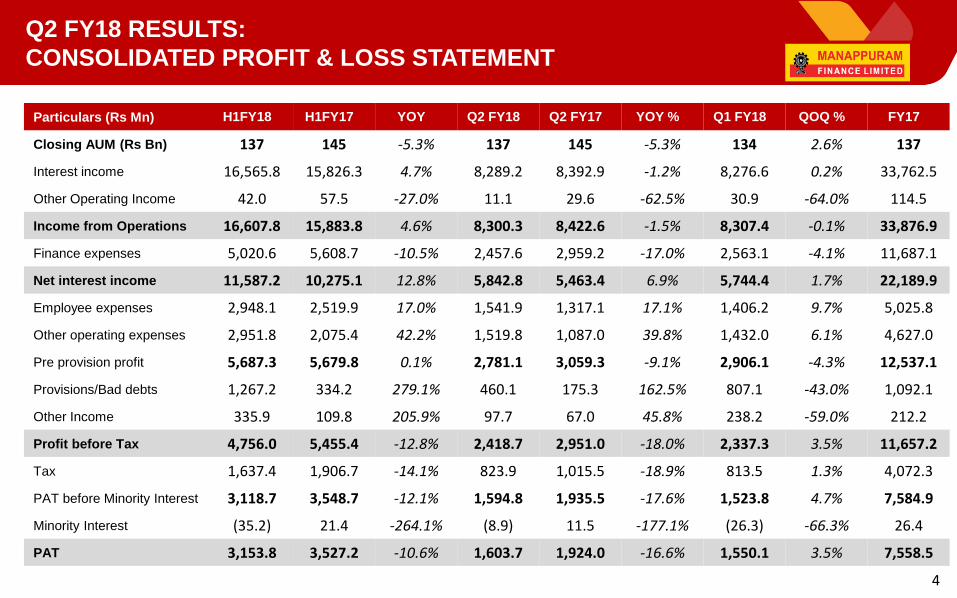
Particulars (Rs Mn) H1FY18 H1FY17 YOY Q2 FY18 Q2 FY17 YOY % Q1 FY18 QOQ % FY17
Closing AUM (Rs Bn) 137 145 -5.3% 137 145 -5.3% 134 2.6% 137
Interest income 16,565.8 15,826.3 4.7% 8,289.2 8,392.9 -1.2% 8,276.6 0.2% 33,762.5
Other Operating Income 42.0 57.5 -27.0% 11.1 29.6 -62.5% 30.9 -64.0% 114.5
Income from Operations 16,607.8 15,883.8 4.6% 8,300.3 8,422.6 -1.5% 8,307.4 -0.1% 33,876.9
Finance expenses 5,020.6 5,608.7 -10.5% 2,457.6 2,959.2 -17.0% 2,563.1 -4.1% 11,687.1
Net interest income 11,587.2 10,275.1 12.8% 5,842.8 5,463.4 6.9% 5,744.4 1.7% 22,189.9
Employee expenses 2,948.1 2,519.9 17.0% 1,541.9 1,317.1 17.1% 1,406.2 9.7% 5,025.8
Other operating expenses 2,951.8 2,075.4 42.2% 1,519.8 1,087.0 39.8% 1,432.0 6.1% 4,627.0
Pre provision profit 5,687.3 5,679.8 0.1% 2,781.1 3,059.3 -9.1% 2,906.1 -4.3% 12,537.1
Provisions/Bad debts 1,267.2 334.2 279.1% 460.1 175.3 162.5% 807.1 -43.0% 1,092.1
Other Income 335.9 109.8 205.9% 97.7 67.0 45.8% 238.2 -59.0% 212.2
Profit before Tax 4,756.0 5,455.4 -12.8% 2,418.7 2,951.0 -18.0% 2,337.3 3.5% 11,657.2
Tax 1,637.4 1,906.7 -14.1% 823.9 1,015.5 -18.9% 813.5 1.3% 4,072.3
PAT before Minority Interest 3,118.7 3,548.7 -12.1% 1,594.8 1,935.5 -17.6% 1,523.8 4.7% 7,584.9
Minority Interest (35.2) 21.4 -264.1% (8.9) 11.5 -177.1% (26.3) -66.3% 26.4
PAT 3,153.8 3,527.2 -10.6% 1,603.7 1,924.0 -16.6% 1,550.1 3.5% 7,558.5

5
Q2 FY18 RESULTS:
CONSOLIDATED BALANCE SHEET
Particulars (Rs Mn) Sep 2017 Sep 2016 YOY % Jun 2017 QOQ %
Cash & Bank Balances 5,926.1 6,285.9 -5.7% 4,608.0 28.6%
Investments 50.5 50.5 0.0% 50.5 0.0%
Loans & Advances 137,007.8 143,895.6 -4.8% 134,497.4 1.9%
Fixed Assets 1,787.7 1,866.0 -4.2% 1,830.2 -2.3%
Other Assets 5,683.6 6,311.9 -10.0% 5,338.3 6.5%
Total Assets 150,455.8 158,410.0 -5.0% 146,324.4 2.8%
Share Capital 1,683.9 1,683.2 0.0% 1,683.9 0.0%
Reserves & Surplus 34,064.1 28,918.9 17.8% 32,974.1 3.3%
Borrowings 107,527.4 122,258.1 -12.0% 103,670.4 3.7%
Other Liabilities & Provisions 6,977.0 5,316.3 31.2% 7,783.8 -10.4%
Minority Interest 203.3 233.5 -12.9% 212.1 -4.2%
Total Liabilities 150,455.8 158,410.0 -5.0% 146,324.4 2.8%
6
Q2 FY18 RESULTS:
CONSOLIDATED RESULT HIGHLIGHTS
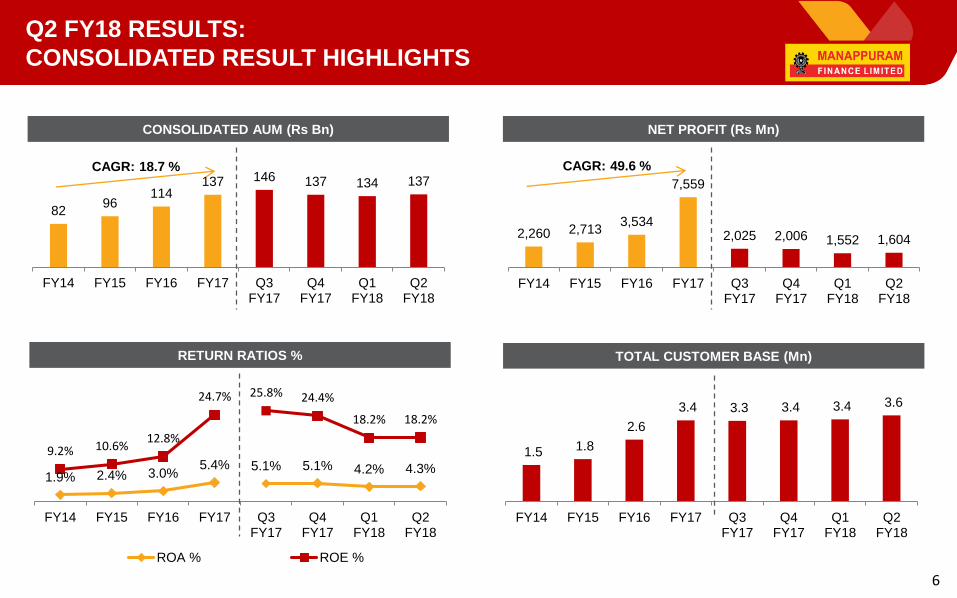
CONSOLIDATED AUM (Rs Bn) NET PROFIT (Rs Mn)
8296
114137 146 137 134 137
FY14 FY15 FY16 FY17 Q3FY17
Q4FY17
Q1FY18
Q2FY18
2,260 2,7133,534
7,559
2,025 2,006 1,552 1,604
FY14 FY15 FY16 FY17 Q3FY17
Q4FY17
Q1FY18
Q2FY18
RETURN RATIOS %
1.9% 2.4% 3.0%5.4% 5.1% 5.1% 4.2% 4.3%
9.2% 10.6%12.8%
24.7% 25.8% 24.4%
18.2% 18.2%
FY14 FY15 FY16 FY17 Q3FY17
Q4FY17
Q1FY18
Q2FY18
ROA % ROE %
CAGR: 18.7 % CAGR: 49.6 %
TOTAL CUSTOMER BASE (Mn)
1.5 1.8
2.6
3.4 3.3 3.4 3.4 3.6
FY14 FY15 FY16 FY17 Q3FY17
Q4FY17
Q1FY18
Q2FY18

7
Q2 FY18 RESULTS:
CONSOLIDATED RESULT HIGHLIGHTS
BOOK VALUE PER SHARE (Rs)
29.6 31.3 32.8
39.9 38.2 39.9 41.2 42.5
FY14 FY15 FY16 FY17 Q3FY17
Q4FY17
Q1FY18
Q2FY18
EARNINGS PER SHARE (Rs) DIVIDEND PER SHARE (Rs)
2.7 3.24.2
9.0 9.6 9.5
7.4 7.6
FY14 FY15 FY16 FY17 Q3FY17
Q4FY17
Q1FY18
Q2FY18
1.8 1.8 1.82.0
0.5 0.5 0.5 0.5
FY14 FY15 FY16 FY17 Q3FY17
Q4FY17
Q1FY18
Q2FY18
NETWORTH (Rs Mn)
24,918 26,328 27,580
33,618 32,106 33,618 34,658 35,748
FY14 FY15 FY16 FY17 Q3FY17
Q4FY17
Q1FY18
Q2FY18

8
Q2 FY18 RESULTS:
CONSOLIDATED AUM UPDATE
CONSOLIDATED AUM (Rs Mn)
0.1%
3.9%
11.8%
19.0%
15.7%
19.0% 19.8%21.6%
FY14 FY15 FY16 FY17 Q3FY17
Q4FY17
Q1FY18
Q2FY18
Particulars (Rs Mn) FY14 FY15 FY16 FY17 Q3FY17 Q4FY17 Q1FY18 Q2FY18
Gold Loans 81,552.4 92,244.8 100,806.0 111,245.3 122,672.0 111,245.3 107,273.1 107,609.1
Microfinance 0.0 3,220.0 9,988.0 17,959.4 16,504.0 17,959.4 18,271.2 19,645.8
Housing Finance 0.0 21.9 1,286.0 3,104.1 2,630.0 3,104.1 3,197.8 3,265.8
Vehicle Finance 0.0 153.7 1,297.7 3,058.3 2,505.0 3,058.3 3,437.4 4,190.9
Other Loans 78.3 295.0 952.0 1,204.8 1,233.0 1,204.8 1,619.0 2,520.5
Total 81,630.7 95,935.4 114,329.7 136,572.0 145,544.0 136,572.0 133,798.4 137,232.2
SHARE OF NEW BUSINESSES IN CONSOLIDATED AUM
9
Q2 FY18 RESULTS:
MANAPPURAM FINANCE: BORROWING PROFILE
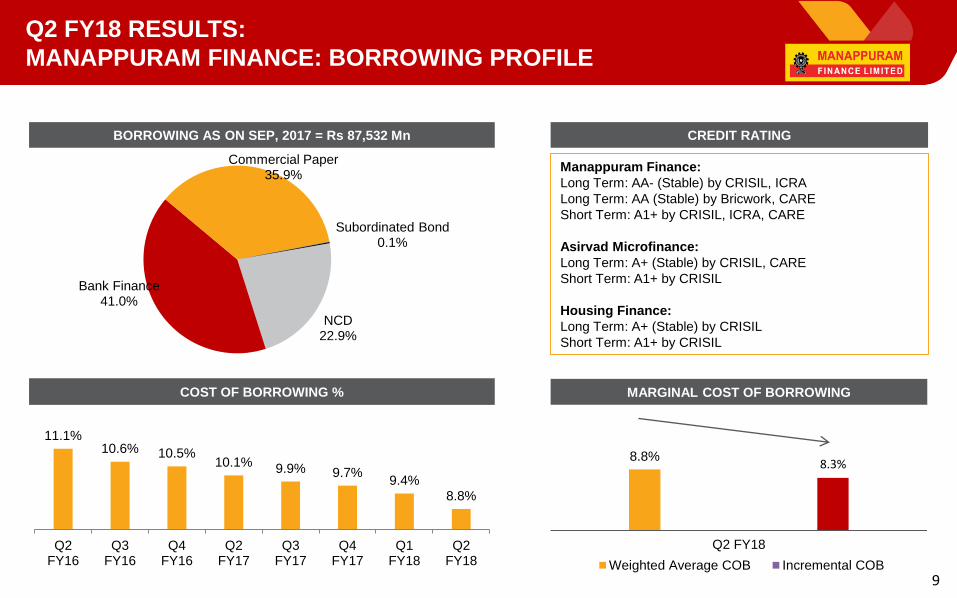
BORROWING AS ON SEP, 2017 = Rs 87,532 Mn
NCD22.9%
Bank Finance41.0%
Commercial Paper35.9%
Subordinated Bond0.1%
Manappuram Finance:
Long Term: AA- (Stable) by CRISIL, ICRA
Long Term: AA (Stable) by Bricwork, CARE
Short Term: A1+ by CRISIL, ICRA, CARE
Asirvad Microfinance:
Long Term: A+ (Stable) by CRISIL, CARE
Short Term: A1+ by CRISIL
Housing Finance:
Long Term: A+ (Stable) by CRISIL
Short Term: A1+ by CRISIL
CREDIT RATING
8.8%8.3%
Q2 FY18
Weighted Average COB Incremental COB
MARGINAL COST OF BORROWING
11.1%10.6% 10.5%
10.1%9.9% 9.7%
9.4%8.8%
Q2FY16
Q3FY16
Q4FY16
Q2FY17
Q3FY17
Q4FY17
Q1FY18
Q2FY18
COST OF BORROWING %

10
Q2 FY18 RESULTS:
MANAPPURAM FINANCE: RESULT ANALYSIS
GOLD LOAN AUM (Rs Bn)
8292 101
111123
111 107 108
FY14 FY15 FY16 FY17 Q3FY17
Q4FY17
Q1FY18
Q2FY18
NET PROFIT (Rs Mn)
2,260 2,7073,372
7,260
1,899 2,072 1,878 1,702
FY14 FY15 FY16 FY17 Q3FY17
Q4FY17
Q1FY18
Q2FY18
OPEX TO AUM %
7.7% 7.6% 8.1%7.0%
6.4%7.5%
8.7%9.3%
FY14 FY15 FY16 FY17 Q3FY17
Q4FY17
Q1FY18
Q2FY18
GOLD LOAN DISBURSEMENTS (Rs Bn)
203245
361
525
121 123 127 128
FY14 FY15 FY16 FY17 Q3FY17
Q4FY17
Q1FY18
Q2FY18
CAGR: 10.9 %
11
Q2 FY18 RESULTS:
MANAPPURAM FINANCE: RESULT ANALYSIS
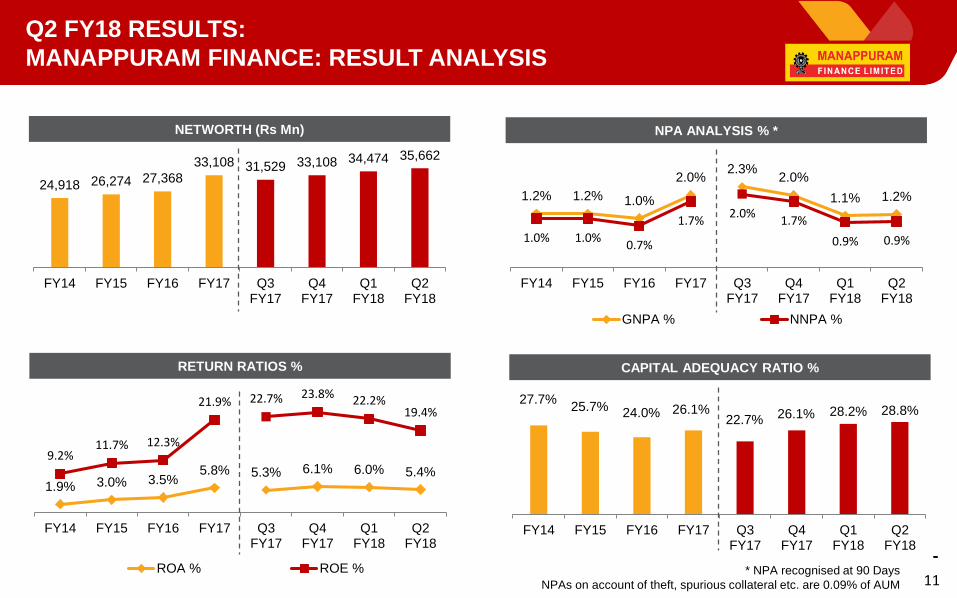
* NPA recognised at 90 Days
NPAs on account of theft, spurious collateral etc. are 0.09% of AUM
CAPITAL ADEQUACY RATIO %
27.7%25.7% 24.0% 26.1%
22.7% 26.1% 28.2% 28.8%
FY14 FY15 FY16 FY17 Q3FY17
Q4FY17
Q1FY18
Q2FY18
RETURN RATIOS %
1.9% 3.0% 3.5%5.8% 5.3% 6.1% 6.0% 5.4%
9.2%11.7% 12.3%
21.9% 22.7% 23.8% 22.2%19.4%
FY14 FY15 FY16 FY17 Q3FY17
Q4FY17
Q1FY18
Q2FY18
ROA % ROE %
NETWORTH (Rs Mn)
24,918 26,274 27,368
33,108 31,529 33,108 34,474 35,662
FY14 FY15 FY16 FY17 Q3FY17
Q4FY17
Q1FY18
Q2FY18
1.2% 1.2% 1.0%
2.0%2.3%
2.0%
1.1% 1.2%
1.0% 1.0%0.7%
1.7%2.0%
1.7%
0.9% 0.9%
FY14 FY15 FY16 FY17 Q3FY17
Q4FY17
Q1FY18
Q2FY18
GNPA % NNPA %
NPA ANALYSIS % *

12
Q2 FY18 RESULTS:
MANAPPURAM FINANCE: GOLD AUM UPDATE
PAN INDIA PRESENCE GOLD AUM - REGIONWISE BREAKUP
61%
12%
17%
10%
South North West East
Chandigarh, 4
Punjab, 75
Haryana, 62
Rajasthan, 79
Madhya Pradesh, 95
Karnataka, 570
Kerala, 486
Himachal Pradesh, 6
Bihar, 16
West Bengal, 92
Jharkhand, 9
Chattisgarh, 49
Puducherry, 10
Tamil Nadu, 580
Jammu & Kashmir, 12
Gujarat, 109
Daman and Diu: 1
Maharashtra: 193
Goa, 8
Delhi, 59
Uttarakhand, 5
Assam, 8
Andhra Pradesh, 332
Telangana, 253
Odisha, 72
Uttar Pradesh, 106
3,300 Branches as on Sep 2017
GOLD AUM – RURAL URBAN MIX
12%
32%
33%
23%
Rural Semi-Urban Urban Metro
Tripura, 2

13
Q2 FY18 RESULTS:
MANAPPURAM FINANCE: GOLD AUM UPDATE
GOLD HOLDING (TONNES)
CUSTOMER BASE (Mn) & AVG. LOAN TICKET SIZE (Rs ‘000)
45.653.1
59.6 61.165.1
61.1 59.4 59.8
FY14 FY15 FY16 FY17 Q3FY17
Q4FY17
Q1FY18
Q2FY18
1.5 1.8 1.9 2.1 2.3 2.1 2.1 2.2
31.7 30.4 32.5 33.6 34.6 33.6 33.2 32.2
FY14 FY15 FY16 FY17 Q3FY17
Q4FY17
Q1FY18
Q2FY18
No. of Customers (Mn) Avg. loan ticket size
GOLD AUM PER BRANCH (Rs Mn)
24.828.0
30.633.8
37.333.8 32.6 32.6
FY14 FY15 FY16 FY17 Q3FY17
Q4FY17
Q1FY18
Q2FY18

14
Q2 FY18 RESULTS:
ASIRVAD MICROFINANCE: KEY HIGHLIGHTS
Particulars (Rs Mn) H1 FY18 H1 FY17 YOY% Q2 FY18 Q2 FY17 YOY % Q2 FY18 QOQ % FY17
Closing AUM 19,645.8 15,591.2 26.0% 19,645.8 15,591.2 26.0% 18,271.2 7.5% 17,959.4
Interest income 1,839.6 1,261.9 45.8% 922.1 710.4 29.8% 917.5 0.5% 3,059.2
Other Operating Income 156.9 194.3 -19.2% 91.5 88.0 4.0% 65.4 39.9% 369.0
Income from Operations 1,996.5 1,456.2 37.1% 1,013.6 798.4 27.0% 982.9 3.1% 3,428.2
Finance expenses 1,017.1 635.1 60.1% 519.0 349.6 48.5% 498.1 4.2% 1,542.2
Net interest income 979.4 821.1 19.3% 494.6 448.8 10.2% 484.8 2.0% 1,886.0
Employee expenses 466.4 288.9 61.4% 244.0 169.5 44.0% 222.4 9.8% 650.9
Other operating expenses 238.0 150.4 58.2% 121.4 88.0 38.0% 116.5 4.2% 395.3
Pre provision profit 275.0 381.7 -28.0% 129.2 191.4 -32.5% 145.9 -11.4% 839.3
Provisions/Bad debts 1,103.3 57.2 1830.4% 381.7 34.2 1017.1% 721.5 -47.1% 522.2
Other Income 126.4 92.2 37.1% 77.0 61.3 25.7% 49.4 56.0% 206.0
Profit before Tax -701.9 416.7 -268.4% -175.5 218.4 -180.3% -526.3 -66.7% 523.1
Tax -244.8 143.1 -271.0% -60.0 74.9 -180.1% -184.8 -67.5% 179.7
PAT -457.1 273.6 -267.1% -115.5 143.5 -180.5% -341.4 -66.2% 343.4
Borrowings 17,615.5 12,475.4 41.2% 17,615.5 12,475.4 41.2% 15,925.8 10.6% 15,927.0
Networth 2,186.8 2,574.1 -15.0% 2,186.8 2,574.1 -15.0% 2,302.4 -5.0% 2,643.8

15
Q2 FY18 RESULTS:
ASIRVAD MICROFINANCE: RESULT ANALYSIS
0.03% 0.11%
4.66%
0.16%
4.66%
6.93%
3.03%
0.03% 0.08%1.36%
0.00%
1.36%0.79% 0.92%
FY15 FY16 FY17 Q3FY17
Q4FY17
Q1FY18
Q2FY18
GNPA % NNPA %
NPA ANALYSIS % *
RETURN RATIOS %
3.6% 3.4% 2.5% 3.5%-1.7%
-6.9%-2.2%
14.6% 14.1% 13.9%21.8%
-11.1%
-55.3%
-20.6%
FY15 FY16 FY17 Q3FY17
Q4FY17
Q1FY18
Q2FY18
ROA % ROE %
AUM (Rs Mn)
3,220
9,988
17,95916,504
17,959 18,27119,646
FY15 FY16 FY17 Q3FY17
Q4FY17
Q1FY18
Q2FY18
CAGR: 136 %
CAPITAL ADEQUACY RATIO %
34.8%
24.8%20.6% 21.4% 20.6%
17.5% 16.3%
FY15 FY16 FY17 Q3FY17
Q4FY17
Q1FY18
Q2FY18
* NPA recognised at 90 Days
16
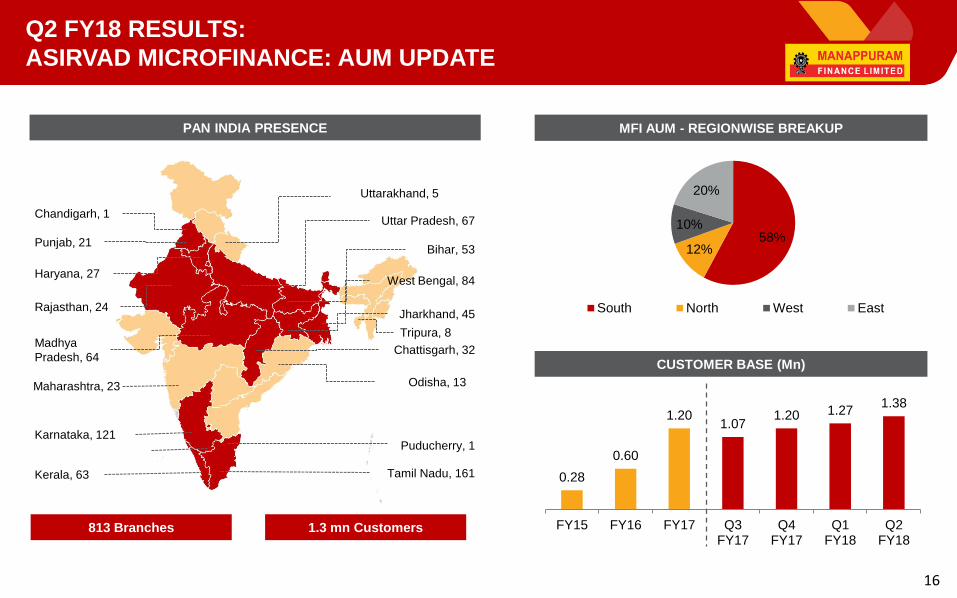
Q2 FY18 RESULTS:
ASIRVAD MICROFINANCE: AUM UPDATE
PAN INDIA PRESENCE MFI AUM - REGIONWISE BREAKUP
813 Branches
Chandigarh, 1
Punjab, 21
Haryana, 27
Rajasthan, 24
Madhya
Pradesh, 64
Karnataka, 121
Kerala, 63
Uttar Pradesh, 67
Bihar, 53
West Bengal, 84
Jharkhand, 45
Chattisgarh, 32
Puducherry, 1
Tamil Nadu, 161
58%12%
10%
20%
South North West East
1.3 mn Customers
CUSTOMER BASE (Mn)
0.28
0.60
1.201.07
1.20 1.271.38
FY15 FY16 FY17 Q3FY17
Q4FY17
Q1FY18
Q2FY18
Maharashtra, 23 Odisha, 13
Uttarakhand, 5
Tripura, 8

17
Q2 FY18 RESULTS:
HOUSING FINANCE: BUSINESS UPDATE
AUM (Rs Mn)
22
1,286
3,1042,630
3,104 3,198 3,266
FY15 FY16 FY17 Q3FY17
Q4FY17
Q1FY18
Q2FY18
AFFORDABLE HOUSING
▪ Started commercial operations in January 2015.
▪ Focus on Affordable Housing for Mid to Low income Group.
▪ Focus on South and West of India.
▪ Rated A+/Stable (Long Term) & A1+ (Short Term) by CRISIL
HOUSING FINANCE METRICS
AUM (Rs Mn) – Sep 2017 3,266
Branch Network 35
Number of States 6
Average Ticket Size (Rs mn) 1.09
Average Yield (%) 15.2%
CAGR: 1090.5 %

18
Q2 FY18 RESULTS:
VEHICLE FINANCE: BUSINESS UPDATE
AUM (Rs Mn)
154
1,298
3,0582,505
3,0583,437
4,191
FY15 FY16 FY17 Q3FY17
Q4FY17
Q1FY18
Q2FY18
VEHICLE FINANCE
▪ Started commercial operations in January 2015.
▪ The operations are a part of Manappuram Finance Ltd and are
carried out from existing gold loan branches
▪ Selectively entered in Southern and Western India.
▪ Focus on Underserved Category of Customers who do not have
access to Formal Banking system.
VEHICLE FINANCE METRICS
AUM (Rs Mn) – Sep 2017 4,191
Branch Network 59
Number of States 10
Average Ticket Size (Rs mn) 0.67
Average Yield (%) 17.7%
GNPA % 1.9%
CAGR: 346 %

Quarterly Update
Company Overview
Business Strategy
Key Technology Initiatives
Annexure

20
COMPANY OVERVIEW:
BRIEF PROFILE
STRONG
PEDIGREE
FINANCIAL
OVERVIEW
BUSINESS
OVERVIEW
▪ Incorporated in 1992, the company has been one of India’s leading gold loans NBFCs.
▪ Promoted by Mr. V.P. Nandakumar (current MD & CEO) whose family has been involved in gold loans since 1949.
▪ Total AUM has grown from Rs 75.5 Bn in FY11 to Rs 137 Bn in FY17 at CAGR of 10%.
▪ Standalone Capital Adequacy Ratio in FY17 stood at 26.1%.
▪ Net Interest Income of Rs 22,189.9 Mn and PAT of Rs 7,558.5 Mn in FY17 grown at CAGR of 7 % and 5 % respectively over last 5
years.
▪ Return ratios: ROA – 5.4% in FY17, ROE – 24.7 % in FY17.
▪ Focus on utilising surplus capital to build or acquire new lending products relevant to the existing retail customer base.
▪ Addition of new synergistic product segments – Microfinance (MFI), Commercial vehicles (CV), Mortgage & Housing Finance.
▪ Consolidated AUM of Rs 137 Bn as on Mar-2017
▪ Established pan-India presence
HIGH
CORPORATE
GOVERGANCE
STANDARDS
▪ Consistent dividends to shareholders.
▪ Reputed auditors such as KPMG as internal auditors and Deloitte Haskins & Sells LLP as statutory auditors to ensure accurate
financial reporting & transparency.
▪ Strong external professional representation on the Board with 6 of the 10 directors being independent. Board is chaired by Mr.
Jagdish Capoor – Ex-Deputy Governer of RBI, Ex-Chairman of HDFC Bank.

21
COMPANY OVERVIEW:
STRONG BRAND RECALL
▪ Strong brand equity built over the
years.
▪ Celebrity endorsements have led to
enhanced visibility and growing
business.
▪ Brand ‘Manappuram’ is endorsed by
well recognized film industry icons
across India .
▪ Our brand ambassadors - Venkatesh,
Mohan Lal, Puneeth Rajkumar, Vikram,
Akshay Kumar, Jeet, Sachin Khedekar
And Uttam Mohanty.

22
COMPANY OVERVIEW:
EXPERIENCED MANAGEMENT TEAM
Mr. V. P. Nandakumar
Managing Director & CEO
▪ Chief Promoter of
Manappuram Group
▪ Certified Associate of
Indian Institute of Bankers
Mr. B.N. Raveendra Babu
Executive Director
▪ Director since July 1992
▪ Worked in a senior role with
Blue Marine International in
U.A.E
Mr. Kapil Krishan
Group Chief Financial Officer
▪ 27 years experience with
organizations such as
CRISIL, HSBC, Standard
Chartered, Hewitt
Associates, India Infoline
Mr. K Senthil Kumar
Head – Commercial Vehicle
▪ Over 21 years experience
with organizations such as
Fullerton India ,Citi Bank,
HDFC Bank etc.
Mr. Subhash Samant
CEO– Housing Finance
▪ Over 21 years experience
with organizations such as
L&T Housing , DHFL, ICICI
Bank , GIC Housing
Mr. Avik Saha
EVP- Data Analysis and Strategy
▪ Over 20 years experience
with organizations such as
TCS, Wipro, Microsoft and
Oracle consulting
Mr. Kamalakar Sai Palavalasa
EVP- Insurance
Mr. Raja Vaidhyanathan
Managing Director – MFI
▪ Erstwhile Promoter of
Asirvad Microfinance
▪ IIT IIM Alumni with over 33
years of experience across
industries
Mr. Jeevandas Narayan
Managing Director – Housing Finance
▪ Erstwhile MD of State Bank
of Travancore
▪ Over 37 years of
experience in the financial
services industry
▪ Over 24 years experience
with organizations such as
Genosar ,IndiaFirst,
Reliance and Birla
Insurance Company

23
COMPANY OVERVIEW:
CORPORATE GOVERNANCE – STRONG BOARD OF DIRECTORS
Mr. Jagdish Capoor
CHAIRMAN, INDEPENDENT &
NON-EXECUTIVE DIRECTOR
• Former Chairman of HDFC Bank, former Deputy Governor of Reserve Bank of India, former Chairman of UTI and BSE Ltd
• Currently, he is on the Board of Indian Hotels Company Limited, Assets Care Enterprise Limited, Indian Institute of
Management, LIC Pension Fund Limited and is the Chairman of Quantum Trustee Company Private Limited.
Dr. Shailesh J Mehta
INDEPENDENT &
NON-EXECUTIVE DIRECTOR
• Bachelor of Technology in mechanical engineering from IIT Mumbai, MSc in Operations Research from Case Western
Reserve University and PhD degree in Operation Research and Human Letters from California State University and in
Computer Science and Operations Research from Case Western Reserve University.
• Over 38 years of experience, was President of Granite Hill Capital Ventures, Chairman and CEO of Providian Financial
Corporation, operating general partner of West Bridge Capital, President and COO of Capital Holding and Executive Vice
President of Key Corp
Mr. E. A. Kshirsagar
NOMINEE DIRECTOR
• He is a Fellow of the Institute of Chartered Accountants in England & Wales
• He was associated with the Management Consultancy division of A F Ferguson for over three decades and retired in
2004 as the Senior Partner
Mr P. Manomohanan
INDEPENDENT &
NON-EXECUTIVE DIRECTOR
• Bachelor of Commerce from Kerala University, Diploma in Industrial finance from Indian Institute of Bankers and also a
Certified Associate of the Indian Institute of Bankers
• Has over 38 years of work experience in the RBI and in the regulatory aspects of NBFCs

24
COMPANY OVERVIEW:
CORPORATE GOVERNANCE – STRONG BOARD OF DIRECTORS
Mr. Rajiven V. R.
INDEPENDENT &
NON-EXECUTIVE DIRECTOR
• He holds a Bachelor of Science degree and has completed his LLB from Govt. Law College, Trivandrum
• Shri Rajiven brings to the Board a wealth of experience in areas like Leadership and Staff management, Strategic
Management, Financial Control / Budgeting, Team Development etc.
Dr. Amla Samanta
INDEPENDENT &
NON-EXECUTIVE DIRECTOR
• Bachelor of Science from Mumbai University, Masters in Biochemistry from GS Medical College, Mumbai.
• She is Managing Director of Samanta Organics Pvt Ltd, Tarapur & Ashish Rang Udyog Pvt Ltd.
• She has served on the boards of HDFC Bank & HDFC Securities. Prior to this she was consultant bio-chemist at Lilavati
Hospital
Mr V. R. Ramchandran
INDEPENDENT &
NON-EXECUTIVE DIRECTOR
• He holds a Bachelor of Science from the Calicut University and a Bachelor degree in law from the Kerala University.
• He has over 32 years of work experience and is a civil lawyer enrolled with the Thrissur Bar Association.
25
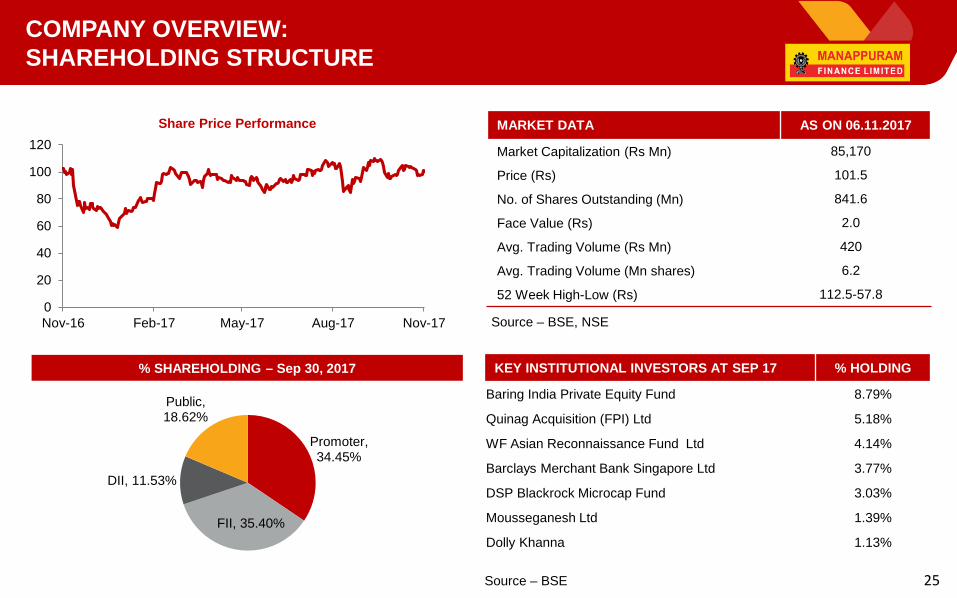
COMPANY OVERVIEW:
SHAREHOLDING STRUCTURE
KEY INSTITUTIONAL INVESTORS AT SEP 17 % HOLDING
Baring India Private Equity Fund 8.79%
Quinag Acquisition (FPI) Ltd 5.18%
WF Asian Reconnaissance Fund Ltd 4.14%
Barclays Merchant Bank Singapore Ltd 3.77%
DSP Blackrock Microcap Fund 3.03%
Mousseganesh Ltd 1.39%
Dolly Khanna 1.13%
Promoter, 34.45%
FII, 35.40%
DII, 11.53%
Public, 18.62%
Source – BSE
Source – BSE, NSE0
20
40
60
80
100
120
Nov-16 Feb-17 May-17 Aug-17 Nov-17
Share Price Performance MARKET DATA AS ON 06.11.2017
Market Capitalization (Rs Mn) 85,170
Price (Rs) 101.5
No. of Shares Outstanding (Mn) 841.6
Face Value (Rs) 2.0
Avg. Trading Volume (Rs Mn) 420
Avg. Trading Volume (Mn shares) 6.2
52 Week High-Low (Rs) 112.5-57.8
% SHAREHOLDING – Sep 30, 2017
Quarterly Update
Company Overview
Business Strategy
Key Technology Initiatives
Annexure
27
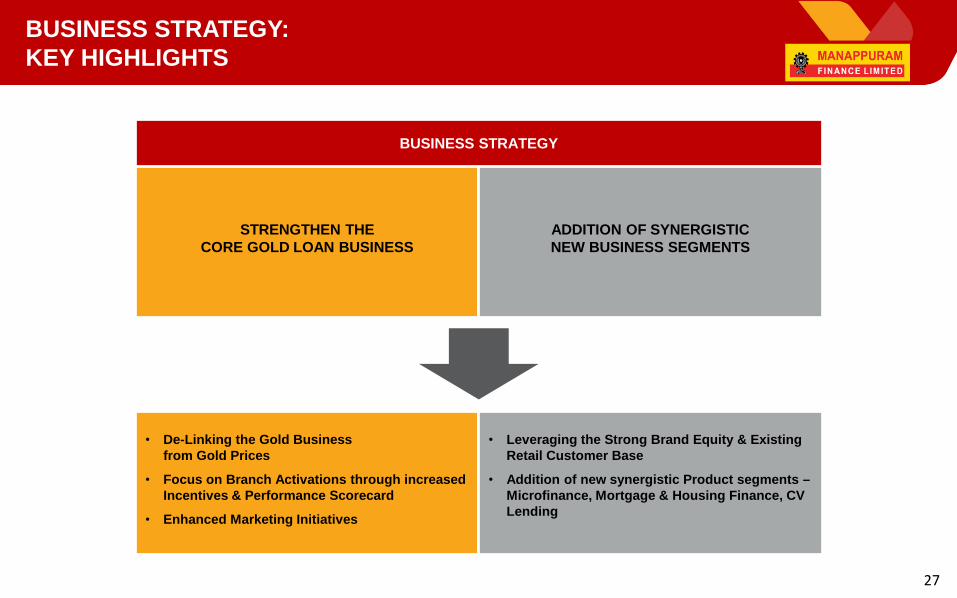
BUSINESS STRATEGY:
KEY HIGHLIGHTS
STRENGTHEN THE
CORE GOLD LOAN BUSINESS
ADDITION OF SYNERGISTIC
NEW BUSINESS SEGMENTS
BUSINESS STRATEGY
• De-Linking the Gold Business
from Gold Prices
• Focus on Branch Activations through increased
Incentives & Performance Scorecard
• Enhanced Marketing Initiatives
• Leveraging the Strong Brand Equity & Existing
Retail Customer Base
• Addition of new synergistic Product segments –
Microfinance, Mortgage & Housing Finance, CV
Lending

28
BUSINESS STRATEGY:
DE-LINKING GOLD BUSINESS FROM GOLD PRICES
▪ Recalibrated the product structure to de-Link from gold price fluctuation.
▪ Loan to value (LTV) ratio is now linked to the tenure of the loan. Therefore, the maximum permissible LTV of 75% would
be available on loans of shorter tenure rather than one year as was the standard practice earlier.
Current Revised Scenario –
3 to 6 month Short Tenure Products3 months 6 months 9 months 12 months
Additional 2 month for
Auction
3 Month
Scenario
6 Month
Scenario
9 Month
Scenario
12 Month
Scenario If the Customer does not
pay or close the Loan,
there is ample margin of
safety to recover Principal
as well as Interest.
Also, Linkage to Gold
prices is Negligible.
Gold value 100 100 100 100
LTV # 75% 70% 65% 60%
Gold Loan 75 70 65 60
Interest Rate 24% 24% 24% 24%
Interest cost * 7.5 11.2 14.3 16.8
Total Principal + Interest * 82.5 81.2 79.3 76.8
Earlier Scenario –
12 month Long Tenure Product12 months – Single Product Offering
Additional 2 month for
Auction
Gold value 100
If the Customer does not
pay or close the Loan,
then there is likely loss of
interest for 2 months
during Auction
LTV 75%
Gold Loan 75
Interest Rate 24%
Interest Cost* 21
Total Principal + Interest* 96
* Includes interest outgo during 2 months of auctioning period# Currently the company is giving only 3 months loan in view of the rise in gold prices

29
BUSINESS STRATEGY:
GOLD LOAN BUSINESS – REACHING OUT TO THE CUSTOMER
Increased
marketing
initiatives across
branches and key
markets
Significantly
enhanced our
marketing spend
with growing BTL
and ATL activities
Increased
incentives and
branch activations
Initiative to track
branch level
performance
scorecard
STRATEGIC
INITIATIVES TO
DRIVE BUSINESS
PERFORMANCE

30
BUSINESS STRATEGY:
INTRODUCING NEW SYNERGISTIC PRODUCT SEGMENTS
CAPITAL AVAILABILITY
▪ Current Capital Adequacy at
28.7% compared to the
minimum 15% as stipulated by
the RBI.
▪ Gearing levels at ~2.4x
leaving ample scope for
increase in leverage.
STRONG BRAND EQUITY
EXISTING RETAIL CUSTOMER
BASE
PAN INDIA DISTRIBUTION
PRESENCE
RELATIONSHIPS WITH
LENDERS
ADDITION ON NEW SYNERGISTIC
PRODUCT SEGMENTS
MICROFINANCE
MORTGAGE & HOUSING
COMMERCIAL VEHICLES
RATIONALE FOR STARTEGY TO DIVERSIFY INTO SYNERGISTIC PRODUCT SEGMENTS -
▪ Strategy to Utilise surplus capital to build or acquire new lending products relevant to the existing retail customer base.
▪ To leverage the strong retail customer base, retail branch network and the strong Manappuram Brand Equity build over the years.
▪ To Leverage our operational capability to process large volume, small ticket lending transactions with semi-urban and rural customers.
▪ Focus to enhance the revenue mix and improve structural return on equity (RoE).

Quarterly Update
Company Overview
Business Strategy
Key Technology Initiatives
Annexure
32
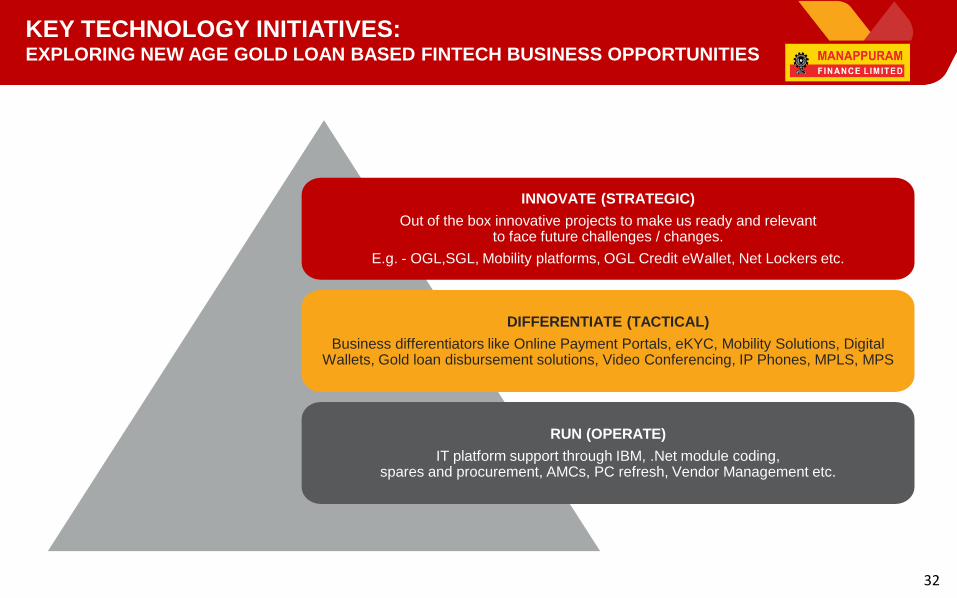
KEY TECHNOLOGY INITIATIVES:EXPLORING NEW AGE GOLD LOAN BASED FINTECH BUSINESS OPPORTUNITIES
INNOVATE (STRATEGIC)
Out of the box innovative projects to make us ready and relevant to face future challenges / changes.
E.g. - OGL,SGL, Mobility platforms, OGL Credit eWallet, Net Lockers etc.
DIFFERENTIATE (TACTICAL)
Business differentiators like Online Payment Portals, eKYC, Mobility Solutions, Digital Wallets, Gold loan disbursement solutions, Video Conferencing, IP Phones, MPLS, MPS
RUN (OPERATE)
IT platform support through IBM, .Net module coding, spares and procurement, AMCs, PC refresh, Vendor Management etc.
33
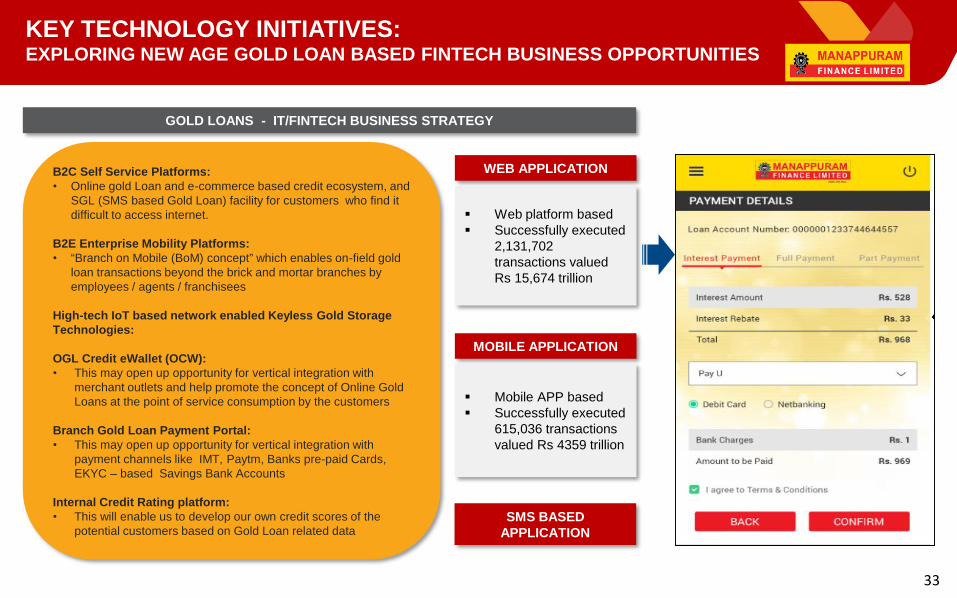
KEY TECHNOLOGY INITIATIVES:EXPLORING NEW AGE GOLD LOAN BASED FINTECH BUSINESS OPPORTUNITIES
B2C Self Service Platforms:
• Online gold Loan and e-commerce based credit ecosystem, and
SGL (SMS based Gold Loan) facility for customers who find it
difficult to access internet.
B2E Enterprise Mobility Platforms:
• “Branch on Mobile (BoM) concept” which enables on-field gold
loan transactions beyond the brick and mortar branches by
employees / agents / franchisees
High-tech IoT based network enabled Keyless Gold Storage
Technologies:
OGL Credit eWallet (OCW):
• This may open up opportunity for vertical integration with
merchant outlets and help promote the concept of Online Gold
Loans at the point of service consumption by the customers
Branch Gold Loan Payment Portal:
• This may open up opportunity for vertical integration with
payment channels like IMT, Paytm, Banks pre-paid Cards,
EKYC – based Savings Bank Accounts
Internal Credit Rating platform:
• This will enable us to develop our own credit scores of the
potential customers based on Gold Loan related data
WEB APPLICATION
MOBILE APPLICATION
SMS BASED
APPLICATION
▪ Web platform based
▪ Successfully executed
2,131,702
transactions valued
Rs 15,674 trillion
▪ Mobile APP based
▪ Successfully executed
615,036 transactions
valued Rs 4359 trillion
GOLD LOANS - IT/FINTECH BUSINESS STRATEGY

34
KEY TECHNOLOGY INITIATIVES:TECHOLOGICAL INNOVATIONS TO ENHANCE VALUE PROPOSITION
CENTRALIZED IOT BASED KEYLESS ELOCKERS TIE-UP WITH
E-COMMERCE
PLATFORMS
FOCUS ON BRAND POSITIONING, IMPROVED COLLECTION,
EFFECTIVE LEAD GENERATION, SUPERIOR CUSTOMER EXPERIENCE, OPEX COST REDUCTION
35
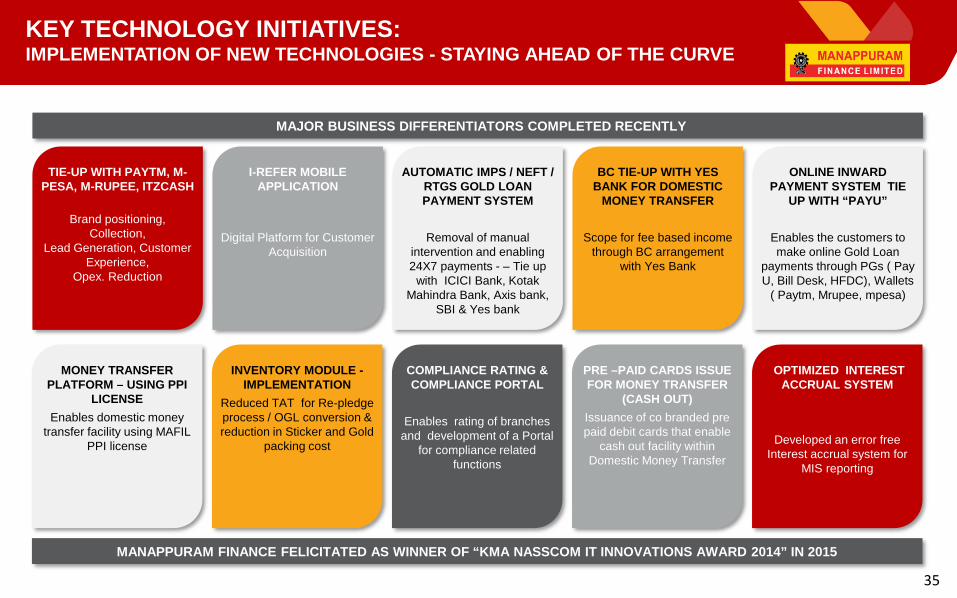
KEY TECHNOLOGY INITIATIVES:IMPLEMENTATION OF NEW TECHNOLOGIES - STAYING AHEAD OF THE CURVE
MAJOR BUSINESS DIFFERENTIATORS COMPLETED RECENTLY
MANAPPURAM FINANCE FELICITATED AS WINNER OF “KMA NASSCOM IT INNOVATIONS AWARD 2014” IN 2015
TIE-UP WITH PAYTM, M-
PESA, M-RUPEE, ITZCASH
Brand positioning,
Collection,
Lead Generation, Customer
Experience,
Opex. Reduction
I-REFER MOBILE
APPLICATION
Digital Platform for Customer
Acquisition
AUTOMATIC IMPS / NEFT /
RTGS GOLD LOAN
PAYMENT SYSTEM
Removal of manual
intervention and enabling
24X7 payments - – Tie up
with ICICI Bank, Kotak
Mahindra Bank, Axis bank,
SBI & Yes bank
BC TIE-UP WITH YES
BANK FOR DOMESTIC
MONEY TRANSFER
Scope for fee based income
through BC arrangement
with Yes Bank
ONLINE INWARD
PAYMENT SYSTEM TIE
UP WITH “PAYU”
Enables the customers to
make online Gold Loan
payments through PGs ( Pay
U, Bill Desk, HFDC), Wallets
( Paytm, Mrupee, mpesa)
MONEY TRANSFER
PLATFORM – USING PPI
LICENSE
Enables domestic money
transfer facility using MAFIL
PPI license
INVENTORY MODULE -
IMPLEMENTATION
Reduced TAT for Re-pledge
process / OGL conversion &
reduction in Sticker and Gold
packing cost
COMPLIANCE RATING &
COMPLIANCE PORTAL
Enables rating of branches
and development of a Portal
for compliance related
functions
PRE –PAID CARDS ISSUE
FOR MONEY TRANSFER
(CASH OUT)
Issuance of co branded pre
paid debit cards that enable
cash out facility within
Domestic Money Transfer
OPTIMIZED INTEREST
ACCRUAL SYSTEM
Developed an error free
Interest accrual system for
MIS reporting

Quarterly Update
Company Overview
Business Strategy
Key Technology Initiatives
Annexure

37
UNDERSTANDING OUR EVOLUTION
PHASE 1: FY08 - FY12
400
900
1400
1900
Jan-07 Jan-08 Jan-09 Jan-10 Jan-11 Jan-12
Gold Price (US Dollars)GOLD PRICES US$
SUPPORTED BY RISING GOLD PRICES….
▪ Higher Loan To Value (LTV) up to 85%
▪ Lower Cost of Funds due to Eligibility under Priority Sector
Lending
▪ Supported by Buoyant Economic Growth
▪ Long Tenure Products supported by Rising Gold Prices
▪ Strong Competitive Positioning - Better LTV, Lower interest
rate compared to Moneylenders, Prompt Disbursement,
Convenience of Place/time
8 1226
75
116
436645
1005
2064
2908
0
750
1500
2250
3000
0
50
100
150
FY 08 FY 09 FY 10 FY 11 FY 12
AUM (Rs. Bn) No of Branches
STRONG GROWTH WITNESSED….
Company witnessed CAGR of ~95%
in AUM over FY08 - FY12.
Branch Network grew by 7x over FY08 - FY12.
Strong Execution Capabilities and
well defined systems and processes.
Source - Bloomberg

38
UNDERSTANDING OUR EVOLUTION
PHASE 2: FY12 - FY14
ALONG WITH FALLING GOLD PRICES….
REGULATORY OVERHANG IMPACT….
Source - Bloomberg
75
116100
82
020406080
100120140
FY 11 FY 12 FY13 FY14
AUM (Rs. Bn)
700
1000
1300
1600
1900
Apr-12 Oct-12 Apr-13 Oct-13 Apr-14 Oct-14 Apr-15
GOLD PRICE (US $)
Regulatory Changes by RBI-
▪ Mar - 2012 : Removal of Priority Sector Lending Status
– led to Higher Borrowing Cost.
▪ Mar - 2012 : Cap on LTV to not exceed more than 60%
-
▪ Weakened the Competitive positioning vis-à-vis
Banks and Moneylenders.
▪ Higher LTV Focused customers moved to
Moneylenders whereas Interest Rate sensitive
customers moved to Banks.
▪ Cap on Maximum Borrowing up to
Rs. 2.5 Mn.
Fall in Gold Prices –
▪ Peak LTV was 85% for FY12 and Long Tenure portfolio.
Negative Operating Leverage resulted into fall in Return
Ratios and Profitability.
39
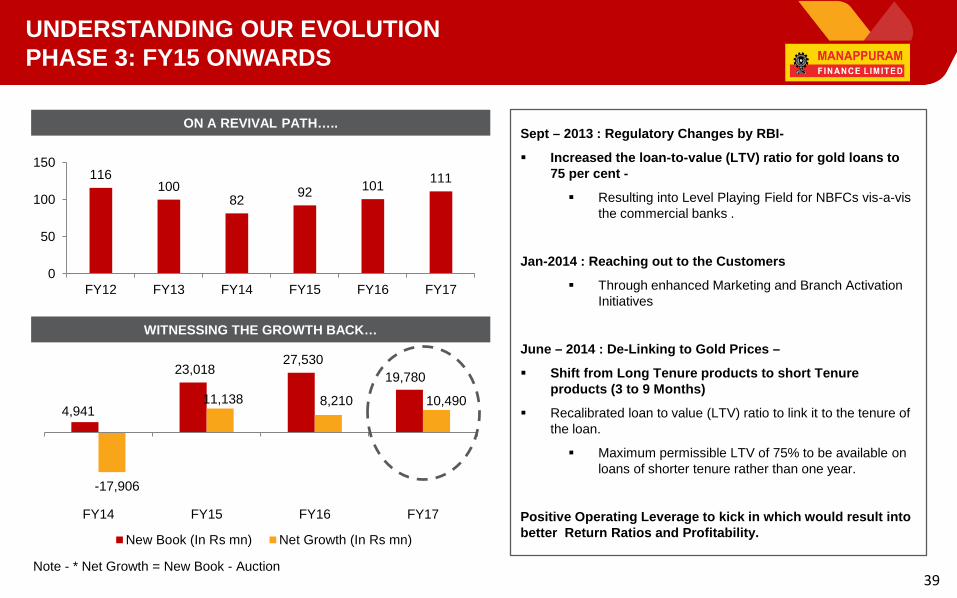
UNDERSTANDING OUR EVOLUTION
PHASE 3: FY15 ONWARDS
WITNESSING THE GROWTH BACK…
ON A REVIVAL PATH…..Sept – 2013 : Regulatory Changes by RBI-
▪ Increased the loan-to-value (LTV) ratio for gold loans to
75 per cent -
▪ Resulting into Level Playing Field for NBFCs vis-a-vis
the commercial banks .
Jan-2014 : Reaching out to the Customers
▪ Through enhanced Marketing and Branch Activation
Initiatives
June – 2014 : De-Linking to Gold Prices –
▪ Shift from Long Tenure products to short Tenure
products (3 to 9 Months)
▪ Recalibrated loan to value (LTV) ratio to link it to the tenure of
the loan.
▪ Maximum permissible LTV of 75% to be available on
loans of shorter tenure rather than one year.
Positive Operating Leverage to kick in which would result into
better Return Ratios and Profitability.
116100
8292
101111
0
50
100
150
FY12 FY13 FY14 FY15 FY16 FY17
4,941
23,018 27,530
19,780
-17,906
11,138 8,210 10,490
FY14 FY15 FY16 FY17
New Book (In Rs mn) Net Growth (In Rs mn)
Note - * Net Growth = New Book - Auction

40
INDUSTRY OVERVIEW:
INDIA GOLD MARKET
Source – WGC – World Gold Council, ICRA
India possesses over ~20,000 tonnes of gold worth more than US$ 800 bn.
Organized gold loan sector penetration is Just 3% !
▪ India is the largest consumer of gold jewellery in the world - Together with China, it makes up over half the global consumer
demand for gold.
▪ Further, Rural India is estimated to hold around 65% of total gold stock. For Rural India gold is the virtually the bank account of
the people - As historically gold has been an good hedge against inflation & since it is fairly liquid, a lot of savings are in the
form of gold.
• Southern India has been the largest market accounting for approximately
40% of the gold demand, followed by the western region at approximately
25% of India's annual gold demand.40%
25%
20%
15%
Region wise Share
South West East North

41
INDUSTRY OVERVIEW:
KEY DRIVERS FOR GOLD LOAN MARKET
ADVANTAGE CONSUMER ADVANTAGE LENDER
▪ Idle gold can be monetized for productive purposes.
▪ Prompt Disbursement - Faster turnaround time.
▪ Minimal Documentation - No major documentation
requirement.
▪ Flexible repayment options available.
▪ Collateral / Security is with the lender – No
requirement to reposes.
▪ No Liquidity Issues – Gold is one of the most liquid
asset class.
▪ No Asset Liability Mismatch – Loan assets are for 3 to
6 months whereas liabilities are for 1 year and above.
▪ One of the lowest NPA segment
LEADING TO A WIN-WIN SITUATION FOR ALL STAKEHOLDERS

42
INDUSTRY OVERVIEW:
COMPETITIVE ADVANTAGE - GOLD LOAN NBFC’S
Parameter Gold loan NBFC's Banks Moneylenders
LTV Up to 75% Lower LTV than NBFC's Higher than 75%
Processing Fees No / Minimal Processing FeesProcessing charges are much
higher compared to NBFC'sNo Processing Fees
Interest Charges ~18% to 24% p.a ~12% to 15% p.aUsually in the range of 36% to
60% p.a.
Penetration Highly Penetrated Not highly penetrated. Selective
BranchesHighly Penetrated
Mode of DisbursalCash/Cheque (Disbursals More than
Rs. 0.1 mn in Cheque)Cheque Cash
Working Hours Open Beyond Banking Hours Typical Banking Hours Open Beyond Banking Hours
Regulated Regulated by RBI Regulated by RBI Not Regulated
Fixed Office place for
conducting transactions
Proper Branch with dedicated staff for
gold loansProper Branch
No fixed place for conducting
business
Customer Service High – Gold Loan is a Core Focus Non Core Core Focus
Documentation
RequirementMinimal Documentation, ID Proof Entire KYC Compliance Minimal Documentation
Repayment Structure
/ Flexibility
Flexible Re-Payment Options.
Borrowers can pay both the Interest
and Principal at the closure.
No Pre-Payment Charges.
EMI compulsorily consists of
interest and principal.
Pre-Payment Penalty is Charged.
-
Turnaround Time 10 minutes 1-2 hours 10 minutes
NBFC’s RETAIN NICHE POSITIONING
43
FOR FURTHER QUERIES:
Nilesh Dalvi
IR Consultant
Contact No : + 91 9819289131
Email – [email protected]
Ravindra Bhandari
IR Consultant
Contact No: 9283614197
Email: [email protected]
Mr. Kapil Krishan
Group Chief Financial Officer
Contact No : +912226674311
Email – [email protected]
DISCLAIMER :
This presentation and the contents therein are for information purposes only and
does not and should not construed to be any investment or legal advice. Any action
taken or transaction pursued based on the basis of the information contained
herein is at your sole risk and responsibility and Manappuram Finance
or its employees or directors, associates will not be liable in any manner for
the consequences of any such reliance placed on the contents of this
presentation. We have exercised reasonable care in checking the correctness and
authenticity of the information contained herein, but do not represent that it is
true, accurate or complete. Manappuram Finance or associates or employees shall
not be in anyway responsible for any loss or damage that may arise to any person
from any inadvertent error or omission in the information contained in this
presentation. The recipients of this presentation should make their own
verifications and investigations to check the authenticity of the said information if
they wish. Manappuram Finance and/or directors, employees or associates
may be deemed to have interests, financial or otherwise in the equity shares of
Manappuram Finance.