managing zirconium chemistry and phase … reports/fy 2013/13...managing zirconium chemistry and...
TRANSCRIPT

Managing Zirconium Chemistry and Phase Compatibility in Combined
Process Separations for Minor Actinide Partitioning
Fuel Cycle Research and Development Nathalie Wall
Washington State University
Jim Bresee, Federal POC Gregg Lume>a, Technical POC
Project No. 13-5350

DE-NE0000674 – Final report
1 of 49
Managing Zirconium Chemistry and Phase Compatibility in Combined Process Separations for Minor Actinide
Washington State University
DE-NE0000674
Final report

DE-NE0000674 – Final report
2 of 49
INTRODUCTION
In response to the NEUP Program Supporting Fuel Cycle R&D Separations and Waste Forms call DE-FOA-0000799, this report describes the results of an R&D project focusing on streamlining separation processes for advanced fuel cycles. An example of such a process relevant to the U.S. DOE FCR&D program would be one combining the functions of the TRUEX process for partitioning of lanthanides and minor actinides from PUREX(UREX) raffinates with that of the TALSPEAK process for separating transplutonium actinides from fission product lanthanides. A fully-developed PUREX(UREX)/TRUEX/TALSPEAK suite would generate actinides as product(s) for reuse (or transmutation) and fission products as waste. As standalone, consecutive unit-operations, TRUEX and TALSPEAK employ different extractant solutions (solvating (CMPO, octyl(phenyl)-N,N-diisobutylcarbamoylmethylphosphine oxide) vs. cation exchanging (HDEHP, di-2(ethyl)hexylphosphoric acid) extractants), and distinct aqueous phases (2-4 M HNO3 vs. concentrated pH 3.5 carboxylic acid buffers containing actinide selective chelating agents). The separate processes may also operate with different phase transfer kinetic constraints.
Experience teaches (and it has been demonstrated at the lab scale) that, with proper control, multiple process separation systems can operate successfully. However, it is also recognized that considerable economies of scale could be achieved if multiple operations could be merged into a single process based on a combined extractant solvent. The task of accountability of nuclear materials through the process(es) also becomes more robust with fewer steps, providing that the processes can be accurately modeled. Work is underway in the U.S. and Europe on developing several new options for combined processes (TRUSPEAK, ALSEP, SANEX, GANEX, ExAm are examples). There are unique challenges associated with the operation of such processes, some relating to organic phase chemistry, others arising from the variable composition of the aqueous medium. This project targets in particular two problematic issues in designing combined process systems: managing the chemistry of challenging aqueous species (like Zr4+) and optimizing the composition and properties of combined extractant organic phases.
The ideal solution, being pursued with limited success is to develop actinide-selective extractants that do not also extract lanthanides. Several different soft donor extractants have been developed but this class of reagents has suffered issues of hydrolytic and radiolytic instability and slow phase transfer kinetics. A process based on soft donor extractant molecules might require a preliminary isolation of lanthanides and actinides in any case, as several high yield transition metals present in the raffinate (Pd2+, Rh3+, Cd2+, Ag+) have high affinity for such complexants and so would compete with the actinides. Given the implicit complexity of this system, a combined extraction process that incorporates a reverse TALSPEAK actinide-selective strip appears to be a viable alternative.
In a combined process that starts with a PUREX (UREX/NPEX/COEX) separation to manage U and Pu (or U, Pu, and Np), a mixed extractant solvent would likely be contacted with an acidic aqueous medium (e.g., PUREX(UREX/NPEX/COEX) raffinate) to concentrate the elements of interest (minor actinides Am, Cm, plus residual U, Np, Pu). This aqueous feed solution will (besides the actinides) contain all fission products that are not removed by volatilization or precipitation plus stainless steel corrosion products. Species most important to developing a successful minor actinide process are those that might compete for the actinide separations reagents. Because of their similar chemistry, fission product lanthanides would be expected to follow the trivalent actinides under most circumstances, as is seen in the TRUEX, DIAMEX and TODGA Processes. 1 Important fission and corrosion products that can be problematic because of their solvent extraction chemistry are Zr4+, MoO2
2+/MoO42-, Pd2+, Fe3+, Ru3+, and fission product lanthanides. The
Combined Process solvent will most easily be designed to selectively extract actinides, fission product lanthanides and yttrium simply because it is quite difficult to partition An(III) away from Ln(III).
After conditioning the loaded solvent (in principle bearing actinides and lanthanides only), a second contact of that loaded solvent with a different aqueous medium would accomplish the polishing separation that

DE-NE0000674 – Final report
3 of 49
isolates the desired product, in this case all actinides, while leaving all else in the extractant phase. The organic phase would then be stripped of waste products to allow recycle of the extractant to continue/repeat the process. In the TRUEX/TALSPEAK example, the first (TRUEX-dominated) stage separates trivalent actinides, un-extracted U, Pu and possibly Np plus fission product lanthanides from the bulk of fission products as their CMPO-nitrate solvated complexes or as mixed CMPO-HDEHP species. As the PUREX/UREX raffinate that feeds this process would still contain selected problematic metal ions (Zr4+, MoO2
2+/MoO42-, Pd2+, Fe3+), it would be necessary to adjust the chemistry of the system to prevent their
extraction. A key objective in the design of efficient solvent extraction processes is to avoid unnecessary phase transfer reactions as much as possible so as to maximize extractant effectiveness.
In the ideal combined process, the extractant molecules would function independently, interact minimally (or even better, cooperatively), and separation performance would rely principally on changes in the aqueous media that contact the combined process solvent. The only species partitioning from the aqueous phase into the extractant would be the ions of interest. Unfortunately, studies that we and others have conducted of combined processes and the inherently complex TALSPEAK process reveal that interactions are more complicated. Detailed investigations characterizing the composition of both aqueous and organic phases have revealed that at a molecular level speciation is often more complex than the process concept 2. Involved patterns of material movement in a solvent extraction system lead to processes that are difficult to optimize and often more difficult to control and model3. These movements become more complex as concentrations of solutes increase.
References.
1. Kenneth L. Nash, Charles Madic, Jagdish N. Mathur and Jerome Lacquement, Chapter 24: Actinide Separation Science and Technology. In The Chemistry of the Actinides and Transactinide Elements, L. R. Morss, J. J. Katz, N. Edelstein, J. Fuger, editors (2006) pp. 2622-2798.
2. Lumetta, G.J.; Gelis, A.V.; Braley, J.C.; Carter, J.C.; Pittman, J.W.; Warner, M.G.; Vandegrift, G.F.; 2013, Solv. Ext. Ion. Exch.31, 223-236.
3. M. Nilsson, K. L. Nash, Solvent Extr. Ion Exch. 2007, 25(6), 665-701; M. Nilsson, K. L. Nash. Solvent Extr. Ion Exch. 2009, 27(3), 354-377.

DE-NE0000674 – Final report
4 of 49
TASK 1. DEVELOPING IMPROVED APPROACHES TO CHARACTERIZING AND CONTROLLING
ZIRCONIUM CHEMISTRY IN STREAMLINED ACTINIDE RECYCLING STREAMS
Publications and Presentations
Mitchell T. Friend and Nathalie A. Wall: Hafnium(IV) complexation with oxalate at variable temperatures. Radiochimica Acta (2016), published online: DOI:10.1515/ract-2016-2686.
Mitchell T. Friend and Nathalie A. Wall: Oxalate complexation with Hf(IV) and its applications to the PUREX process. 252nd American Chemical Society National Meeting & Exposition, Philadelphia, PA, Aug. 21-25, 2016.
Introduction
Zirconium is a high yield fission product (11% of the mass of fission products after 10 y cooling of 1 t U as 3.2% enriched UO2 fuel) with unique chemistry. In particular, 93Zr is a long lived fission product (1.5∙106 y half-life), with a 6.4% isobaric yield for thermal fission of 235U. The speciation of zirconium is dominated by Zr(OH)3+, Zr(OH)2
2+, Zr(OH)3+, Zr(OH)4, Zr(OH)5
-, Zr3(OH)48+, Zr4(OH)8
8+, in absence of complexing agents. Mixed nitrate complexes dominate speciation of Zr(IV) under the conditions of PUREX feed solutions (4 M HNO3) and Zr(NO3)4 is readily extracted by TBP in PUREX. Zr concentration is ca. 0.08 M in PUREX raffinate while total fission product lanthanides are 0.14 M and the target Am 0.0012 M. It is important to retain Zr in the aqueous phase holdback reagent(s) while Ln(III)/An(III) are extracted, otherwise poor separation performance and impure products would be expected. Thermodynamic databases (e.g. NIST Critical Stability Constants database) provide very little options for Zr4+ complexing reagents; fewer than 20% of the reported stability constants are considered accurate enough to be included in the database. There is a need for accurate stability constant determinations for Zr complexes with N-donor ligands, mono or polycarboxylic acids (including oxalate), and simple amino acids.
The goal of this work was to improve the understanding of fission product Zr chemistry in the nuclear fuel cycle. This was done by developing the methodologies for determination of accurate stability constants and thermodynamic data for Zr complexes with complexing agents which have potential applications as aqueous phase holdback reagents in nuclear fuel separations. The rational for this work was a better understanding of fission product chemistries would improve the predictability of nuclear fuel separations from the development of thermodynamic models, as well as providing the data necessary for the creation efficient separation methods for advanced nuclear fuel reprocessing.
Zirconium hydrolysis
An important facet of Zr chemistry is the hydrolytic formation of monomeric and polymeric Zr(IV) hydroxides, even in acidic solutions >1 M H+. The hydrolyzed polymers are thought to be unreactive (as has been observed in solvent extraction applications), therefore it was necessary to develop the methodology to produce polymer free Zr(IV) solutions. A brief study was carried out which involved the preparation and subsequent standardization of Zr(IV) perchlorate solutions utilizing two different sample preparations. From a starting material of zirconyl chloride hydrate (ZrOCl2∙xH2O, x = 6-8), stock solutions where prepared in 2 M HClO4 with Zr(IV) concentrations of ~10-4 M. One set of solutions were used as is, while others were fumed multiple times with 2 M HClO4 and then filtered. The non-fumed stocks displayed slight Tyndall beams while the fumed stocks did not. These two different preparations were compared by standardizing the Zr(IV) concentrations by ICP-OES and spectrophotometric EDTA titration with Arsenazo III (AAIII) indicator. ICP-OES was used to measure the total concentration of Zr in the solutions (dissolved Zr(IV) + polymerized Zr), and the EDTA titrations used to quantify the amount of the reactive Zr(IV) present in solution (i.e. non-polymerized Zr(IV)). The results of the ICP-OES gave similar concentrations for both the non-fumed and fumed preparations. Differences between the two different stock preparations became evident in the EDTA titrations however. For the fumed stocks, the results of the EDTA titrations

DE-NE0000674 – Final report
5 of 49
gave Zr(IV) concentrations that agreed with the ICP results, while the non-fumed stocks gave Zr(IV) concentrations that were significantly lower than what was measured by ICP. This was an indication that in the non-fumed solutions, unreactive polymers are likely to have formed in these solutions. The exact composition of the Zr(IV) hydrolytic species were not confirmed, however it was estimated that the non-fumed solutions were 10-20% polymerized. The agreement between the ICP and EDTA titration results for the fumed stocks however, indicated that those solutions are free of polymers (i.e. all dissolved Zr is a reactive Zr(IV)). Monomeric hydroxo species, such as ZrOH3+, are expected to exist in these solutions based on speciation calculations, however they do not hinder Zr(IV) complexation with strongly binding ligands, e.g. EDTA, under the solution conditions studied (2 M HClO4, <10-4 M Zr(IV)). The fuming process was found to be necessary in producing polymer free Zr(IV) and Hf(IV) solutions and used throughout all subsequent studies.
Zr(IV) and Hf(IV) interactions with Arsenazo III
Solutions of Zr(IV) and Hf(IV) are transparent and do not absorb UV or visible light. The study of the complexation of these cations with ligands by spectrophotometric methods therefore requires a colorimetric reagent. Arsenazo III (AAIII) is an azo dye that is used as a colorimetric reagent for the spectrophotometric analysis of tetravalent cations (e.g. Zr4+, Th4+, and U4+), lanthanide ions, and Ca2+ and Sr2+. Additionally, AAIII has been shown to display selectivity for tetravalent cations in media of 1-9 M H+ and therefore was chosen as the colorimetric reagent for spectrophotometric study of Zr(IV) and Hf(IV).
Commercial AAIII at the highest available purity (~90-95%) was found by thin layer chromatography (TLC) to contain a variety of impurities which is thought to include precursor synthetic starting materials, monoazo derivaties such as Arsenazo I (another azo dye), and cationic impurities, namely Ca2+, Sr2+, and Ba2+. The presence of additional azo dyes and interfering cation species could potentially present an issue in the complexation of Zr(IV) and Hf(IV) and colorimetric reaction with AAIII. As a result, much effort was invested into developing the methodology for purifying AAIII. The final purification procedure, adapted from methods reported in the literature, first began by dissolving gram quantities of AAIII in sufficient volume (~20 mL) of 5v% aq. NH3, followed by precipitation by dropwise addition of concentrated HCl. The precipitate was filtered, dried, and loaded onto a silica gel column (19 mm ID × 46 cm) with a minimal quantity of 1:1 v/v 2-propanol/15v% aq. NH3, and then was eluted through the column with a mobile phase composed of the same solvent mixture. External pressure was applied to adjust the flow rate to 1-2 mL/min. The blue colored fraction containing AAIII free from the major impurities was collected and freeze dried. The removal of cation impurities and generation of the free acid form of AAIII was accomplished by dissolution in water and passage through Dowex 50WX (H form) cation exchange resin. The final product produced one spot on TLC. Total reflection X-ray fluorescence (TXRF) spectroscopy was performed to qualitatively identify the cations present in the AAIII before purification, after the silica gel column step, and in the final product after the cation exchange step as shown in Figure 1. The TXRF analysis indicated that the cation exchange step in the purification process was necessary for removal of Ca2+, Sr2+, and Ba2+ impurities, in addition to generating the free acid of AAIII. While the developed purification procedure yields purified AAIII, the process suffers in that the mass yields are typically <10%. Decreasing the flow rate to 1 mL/min during the silca gel column step was found to improve the yields somewhat. Reducing the solvent polarity by increasing the ratio of 2-propanol to NH3 increased the AAIII elution time from 1-2 hr to roughly 6 hr with no significant improvement to the purification yield of AAIII. Further experiments with different solvent compositions and stationary phases (e.g. cellulose) could be explored to potentially improve the purification yield.

DE-NE0000674 – Final report
6 of 49
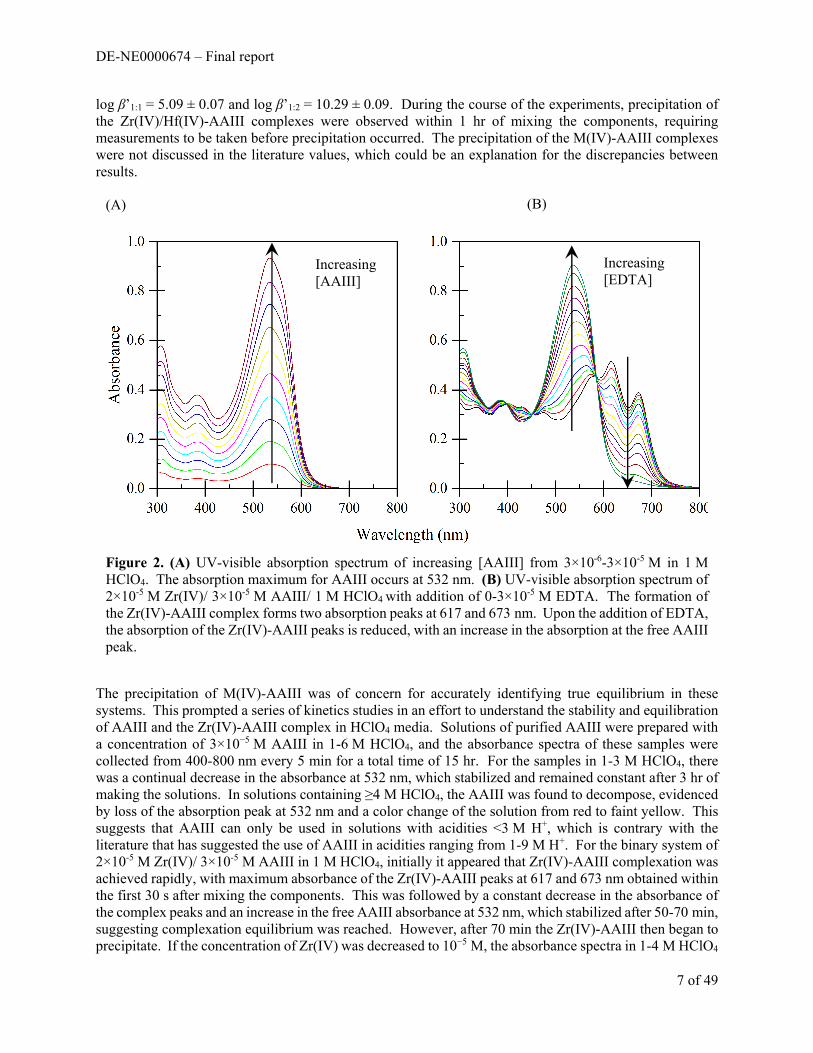
Arsenazo III dissolved in 1-2 M HClO4 produces a red colored solution with an absorbance maximum at 532 nm and is shown in Figure 2. Upon addition of Zr(IV) or Hf(IV), the solution turns blue-green with a decrease in the absorbance of the free AAIII peak at 532 nm and the formation of two new absorbance peaks at 617 and 673 nm for the M(IV)-AAIII complex(es). The stoichiometries of the Zr(IV)-AAIII and Hf(IV)-AAIII complexes were identified by the method of continuous variation (Job’s method). Both the Zr(IV)-AAIII and Hf(IV)-AAIII systems displayed maximum absorbances (Figure 3) at an AAIII mole fraction of 0.58 in 1 and 2 M HClO4. This result identifies the formation of 1:1 and 1:2 M(IV):AAIII complexes which are present simultaneously in solution, and is consistent with the findings in the literature. Based on the Job’s method results, absorbance spectra 400-800 nm were collected from batch samples of 1 M HClO4/ 3×10⁻⁵ M AAIII/ 0-5×10⁻⁵ M M(IV) and imported into the program HypSpec2014 for fitting of the stability constants for the 1:1 and 1:2 M(IV):AAIII species. Protonation constants for AAIII were initially measured by potentiometric titration in 0.1 M NaClO4 and are shown in Table 1. Inclusion of these constants or a variety of literature values resulted in a failure of stability constant refinement by the program, allowing only for the determination of conditional stability constants, β’M:L. The conditional stability constants in 1 M HClO4 for the Zr(IV)-AAIII and Hf(IV)-AAIII systems are displayed in Table 2. Speciation models using these measured constants predicts the presence of the 1:1 and 1:2 M(IV):AAIII complexes, which is consistent with the Job’s method results. The conditional stability constants for the Zr(IV)-AAIII system in 1 M HClO4 are higher than the previously published values of
Figure 1. Qualitative TXRF spectra of (top to bottom) 10 μL of 10-3 M commercial, unpurified AAII, AAIII after purification on a silica gel column, and after cation exchange on a Dowex 50WX (H form) column. Counting time was 5 min. The AAIII signatures are the As Kα and Kβ emissions at 10.54 and 11.7 keV and the S Kα emission at 1.74 keV. The Mo peak arrises from the Mo cathode tube X-ray source, and the escape peak from the partial absorption of the As Kα emission.
(A) (B)
DE-NE0000674 – Final report
7 of 49
log β’1:1 = 5.09 ± 0.07 and log β’1:2 = 10.29 ± 0.09. During the course of the experiments, precipitation of the Zr(IV)/Hf(IV)-AAIII complexes were observed within 1 hr of mixing the components, requiring measurements to be taken before precipitation occurred. The precipitation of the M(IV)-AAIII complexes were not discussed in the literature values, which could be an explanation for the discrepancies between results.
The precipitation of M(IV)-AAIII was of concern for accurately identifying true equilibrium in these systems. This prompted a series of kinetics studies in an effort to understand the stability and equilibration of AAIII and the Zr(IV)-AAIII complex in HClO4 media. Solutions of purified AAIII were prepared with a concentration of 3×10⁻⁵ M AAIII in 1-6 M HClO4, and the absorbance spectra of these samples were collected from 400-800 nm every 5 min for a total time of 15 hr. For the samples in 1-3 M HClO4, there was a continual decrease in the absorbance at 532 nm, which stabilized and remained constant after 3 hr of making the solutions. In solutions containing ≥4 M HClO4, the AAIII was found to decompose, evidenced by loss of the absorption peak at 532 nm and a color change of the solution from red to faint yellow. This suggests that AAIII can only be used in solutions with acidities <3 M H+, which is contrary with the literature that has suggested the use of AAIII in acidities ranging from 1-9 M H+. For the binary system of 2×10⁻⁵ M Zr(IV)/ 3×10⁻⁵ M AAIII in 1 M HClO4, initially it appeared that Zr(IV)-AAIII complexation was achieved rapidly, with maximum absorbance of the Zr(IV)-AAIII peaks at 617 and 673 nm obtained within the first 30 s after mixing the components. This was followed by a constant decrease in the absorbance of the complex peaks and an increase in the free AAIII absorbance at 532 nm, which stabilized after 50-70 min, suggesting complexation equilibrium was reached. However, after 70 min the Zr(IV)-AAIII then began to precipitate. If the concentration of Zr(IV) was decreased to 10−5 M, the absorbance spectra in 1-4 M HClO4
Figure 2. (A) UV-visible absorption spectrum of increasing [AAIII] from 3×10⁻⁶-3×10⁻⁵ M in 1 M HClO4. The absorption maximum for AAIII occurs at 532 nm. (B) UV-visible absorption spectrum of 2×10⁻⁵ M Zr(IV)/ 3×10⁻⁵ M AAIII/ 1 M HClO4 with addition of 0-3×10⁻⁵ M EDTA. The formation of the Zr(IV)-AAIII complex forms two absorption peaks at 617 and 673 nm. Upon the addition of EDTA, the absorption of the Zr(IV)-AAIII peaks is reduced, with an increase in the absorption at the free AAIII peak.
(A) (B)
Increasing [AAIII]
Increasing [EDTA]

DE-NE0000674 – Final report
8 of 49
were found to remain constant after 3 h with no evidence of precipitation. When the concentration of HClO4 exceeded 4 M, the AAIII was again found to undergo decomposition. When EDTA was added forming a ternary system of 1-2×10⁻⁵ M Zr(IV)/ 3×10⁻⁵ M AAIII/ 1-2×10⁻⁵ M EDTA, a similar change in the absorbance peaks were observed for 30 min, after which the spectra then remained constant. Precipitation of the colored Zr(IV)-AAIII complex was not observed in the ternary system when the Zr(IV) concentration was 10-5 M or less, but was observed at higher concentrations. The concentration of EDTA was found to have no influence on this precipitation. These results show that the Zr(IV) concentration cannot exceed 10-5 M, to avoid precipitation, and at least 60 min is required for equilibrium after mixing the components. Following those guide lines, spectra of batch samples containing 10-5 M Zr(IV) )/ 3×10⁻⁵ M AAIII/ 0-3×10⁻⁵ M EDTA in 1 M HClO4 were collected and imported into the program HypSpec2014 for fitting of the Zr(IV)-EDTA stability constants. The refinement of the constants resulted in a failure by the program, mostly due to failed calculation of the free concentrations of each component. In these stability constant determinations, typically ligand concentrations are chosen to be in excess of the metal such that the concentration of free ligand is not greatly changed upon complexation. Due to the precipitation issues caused by this specific system however, the concentration of Zr(IV), AAIII, and EDTA were maintained on the order of 10-5 M, which could explain the failed refinement by the program, as there was too much variation in solving for the changing concentrations of each potential species present in this complicated system. The concentration of EDTA needs to be increased to at least 10−4 M, however this potentially presents a solubility issue in >1 M HClO4 media. Additionally, because of the strong complexation EDTA displays for Zr(IV), Zr(IV) complexation with AAIII would be completely overwhelmed at that concentration of EDTA, making AAIII no longer a suitable competing ligand. AAIII concentration could also be increased to better compete with a higher EDTA concentration, but that would yield absorbances >1 absorbance unit as well as the potential for precipitation of the Zr(IV)-AAIII complex.
Figure 3. Job’s method plot for Zr(IV)-AAIII in 2 M HClO4 with total [Zr(IV)] + [AAIII] = 3.5×10⁻⁵ M.

DE-NE0000674 – Final report
9 of 49
Determination and analysis of ligand stability constants using solvent extraction techniques
The difficulties encountered in the AAIII system prompted the desire for an additional method for determining Zr(IV) and Hf(IV) ligand stability constants. Solvent extraction techniques utilizing the β-diketone extractant, 2-thenoyltrifluoroacetone (TTA), have been used with great success in determining the metal-ligand stability constants of tetravalent actinides. Using TTA as the extractant and 175+181Hf(IV) radiotracer which was produced by neutron irradiation at Washington State University’s 1 MW TRIGA research reactor, we have developed and characterized a solvent extraction system applicable for the determination of Zr(IV), Hf(IV), and Pu(IV) ligand stability constants. This system was put into practice to measure Hf(IV)-oxalate stability constants in 1 M HClO4 in temperatures ranging from 15-35°C. van’t Hoff analysis of the temperature varied stability constants yielded ΔrH and ΔrS for the complexation reactions.
Table 1. Dissociation constants of Arsenazo III in 0.1 M NaClO4 and 25.0°C
Constant Reference p.w. a † 1 † 2 ‡ 3 ‡ 4 ‡ 5 b ‡
pKa1 0.6 ± 0.1 pKa2 0.8 ± 0.1 pKa3 3.0 ± 0.2 2.60 1.6 ± 0.1 2.626 3.64 1.80 pKa4 4.4 ± 0.2 4.29 3.4 ± 0.1 5.801 5.05 3.31 pKa5 7.1 ± 0.2 6.70 6.27 ± 0.2 7.532 6.77 6.65 pKa6 9.3 ± 0.3 8.79 9.05 ± 0.2 9.340 7.64 8.86 pKa7 11.4 ± 0.7 10.58 11.98 ± 0.11 10.677 9.30 11.10 pKa8 12.4 ± 0.3 10.99 15.1 ± 0.1 12.563 11.85 14.92
a: p.w. = present work, errors reported as 3σ from replicates b: 0.2 M NaClO4 † = potentiometry, ‡ = spectrophotometry 1. Nemcova, I., et al.: Talanta 33(10), 841-842 (1986). 2. Budesinksy, B., et al.: Talanta 16(9), 1277-1288 (1969). 3. Leporati, E.: Annali di Chimica (Rome) 73(1-2), 1-13 (1983). 4. Palei, P. N., et al.: Zh. Anal. Khim. 22(12), 1797-1804 (1967). 5. Mogi, H., et al.: Nippon Kagaku Kaishi 1983(10), 1437-1441 (1983).
Table 2. M(IV)-AAIII conditional stability constants
Metal ion Ionic radius (CN 8)1 Medium
Conditional stability constant Ref.
log β’1:1 log β’1:2 Hf4+ 0.83 Å 1 M HClO4 6.35 ± 0.05 11.54 ± 0.07 p.w. a
Zr4+ 0.84 Å 1 M HClO4 6.4 ± 0.2 11.8 ± 0.4 p.w 1 M HClO4 5.09 ± 0.07 10.29 ± 0.09 2 U4+ 1.00 Å 6 M HCl 6.12 12.04 3 Th4+ 1.05 Å 6 M HCl 5.84 11.56 3
a: p.w. = present work, errors reported as 3σ from replicates 1. Shannon, R. D.: Acta Cryst. A32, 751-767 (1976). 2. Matteson, B. S. et al.: Sep. Sci. Technol. 45(12-13), 1733-1742 (2010). 3. Rohwer, H. et al.: Anal. Chim. Acta 341, 263-268 (1997).

DE-NE0000674 – Final report
10 of 49
The developed solvent extraction system used equal volumes of organic and aqueous phases (1.5 mL each) contacted in 4 mL glass screw top vials that were sealed with Parafilm. The organic phase consisted of TTA, which was purified by recrystallization, dissolved to concentrations of 0.005-0.0025 M in toluene. The aqueous phase contained ≤10-5 total M(IV) (stable carrier + suitable radiotracer) and varying concentration of ligand (0-10-4 M) in ≥1 M HClO4. Specific concentrations of reagents were chosen such that the distribution ratio of M(IV) falls between 0.01-10. Extraction equilibrium was reached within 15 min when the phases were contacted by mixing with a vortex. The extraction mechanism and the extraction equilibrium constant, Kex, was determined from radiometric slope-analysis experiments. Using a 175+181Hf radiotracer and automatic-gamma counting for the measurement of the distribution ratio, slope-analysis experiments displayed in Figure 4 showed a 4th power dependence on both TTA and H+ concentrations with slopes of 3.98 ± 0.08 and -4.0 ± 0.1 respectively, and identified Hf(TTA)4 as the extracted species. The extraction equilibrium constant was calculated from this data and found to be log Kex = 7.67 ± 0.07 (25 ± 1°C, 1 M HClO4).
This solvent extraction system found use in measuring the stability constants of Hf(IV)-oxalate in 1 M HClO4 at 15-25°C. The distribution ratio of 175+181Hf(IV) in the absence, D0, and in the presence, D, of varying concentration of oxalate (ox2-) was measured from batch samples at 15, 25, and 35°C. The distribution ratio was found to decrease with increasing [ox2-] which indicated Hf(IV)-oxalate complexation in the aqueous phase. The Hf(IV)-oxalate species that formed and their stability constants were measured from the coefficients of polynomial fits of (D0/D-1) vs. [ox2-] as shown in Figure 5A. The stability constants at the variable temperature were used to construct van’t Hoff plots (Figure 5B) from which ΔrH and ΔrS were determined. The results from this study are summarized in Table 3. Overall, Hf(IV) was found to form strong 1:0:1 and 1:0:2 complexes with oxalate in 1 M HClO4 solution. Positive values for ΔrH and ΔrS indicate endothermic reactions for the formation of the 1:0:1 and 1:0:2 Hf(IV)-ox complexes, and the thermodynamic spontaneity of the reactions are driven by the positive changes in entropy. Furthermore, these positive values provide an indication for the formation of inner-sphere complexes.
Figure 4. (A) log D0 vs. log [TTA] from the extraction system 10−5 M Hf(IV)/1 M HClO4/toluene at 25 ± 1°C. (B) log D0 vs. log [HClO4] from the extraction system 10−5 M Hf(IV)/0.012 M TTA/toluene at 25 ± 1°C. Errors are 2σ from replicates.
(A) (B)

DE-NE0000674 – Final report
11 of 49
An added benefit of using the solvent extraction technique is direct comparisons of Zr(IV)/Hf(IV) stability constants with tetravalent actinides are possible because the same methodology has been used (Np(IV) and Pu(IV) stability constants with ligands in the literature have often utilized the same TTA system). Comparing our Hf(IV)-oxalate complexation data with literature data for oxalate complexation of Zr(IV), Th(IV), Np(IV), and Pu(IV) revealed potential thermodynamic trends. The complexation strength of
Figure 5. (A) (D0/D − 1) vs. [ox2−] for the extraction system 10−5 M Hf(IV)/1 M HClO4/0.020 M TTA/ toluene at variable temperatures. Errors are 2σ from replicates. (B) van’t Hoff plots of ln β vs. 1/T for the determined Hf(IV)-ox complexes. Dashed lines represent 95% confidence bands from the regression analysis.
(A) (B)
Table 3. Stability constants and thermodynamic parameters for Hf(IV)-ox complexation in HClO4
Species T (°C) log appβ log β ΔrG (kJ mol−1)
ΔrH (kJ mol−1)
ΔrS (J mol−1 K−1)
Ref.
Hf(ox)2+ 15 ± 1 9.9 ± 0.3 9.9 ± 0.3 p.w.a
25 ± 1 10.12 ± 0.02
10.15 ± 0.04
−58 ± 3 27 ± 7 285 ± 24 p.w.
35 ± 1 10.20 ± 0.03
10.23 ± 0.05
p.w.
9.97 1 b
20 10.22 2 b
Hf(ox)2 (aq) 15 ± 1 18.8 ± 0.1 18.8 ± 0.1 p.w.
25 ± 1 18.88 ± 0.02
18.91 ± 0.05
−108 ± 4 18 ± 4 422 ± 13 p.w.
35 ± 1 19.03 ± 0.05
19.05 ± 0.06
p.w.
19.24 1 20 18.88 2
a: p.w. = present work, I = 1 M HClO4

DE-NE0000674 – Final report
12 of 49
oxalate increases on the order of Th4+<Np4+<Pu4+<Zr4+<Hf4+, correlating with a decrease in cationic radius. Reaction enthalpies and entropies were also found to become increasingly positive across the same cation series. This data provides evidence for the formation of inner sphere complexes by oxalate with these cations. Speciation calculations predict the same order of complexation in solution, with Hf(IV)-oxalate complexes forming preferentially before Zr(IV), Pu(IV), etc. The potential use of aqueous holdback reagents in the prevention of Zr(IV) co-extraction with Pu(IV) is of importance in the reprocessing of used nuclear fuel. Prediction of a particular aqueous ligand’s holdback potential and selectivity can be estimated by modeling the complexation with various competing analytes given the stability constants are known. Strongly complexed aqueous M:L species that form in the context of solvent extraction based separations are expected to hinder that species extraction into the organic phase. Using Hf(IV) as an analog for fission product Zr(IV) and the measured Hf(IV)-oxalate stability constants, the aqueous speciation of a system representative of the PUREX process was simulated in which oxalate was added as a holdback reagent for Hf(IV). Example speciation plots are displayed in Figure 6. These calculations indicate the formation of 1:0:1 and 1:0:2 oxalate complexes with both Hf(IV) and Pu(IV), and minimal complexation with U(VI). The Hf(IV) and Pu(IV) oxalate complexes are the primary species expected to be in solution if oxalate is introduced as a holdback reagent, and likely would hinder the extraction of both these metals in PUREX. Therefore, oxalate would not be suitable holdback of fission product Zr(IV) without also hindering the extraction of Pu(IV).
Conclusion
In our studies on Zr(IV)-AAIII and Hf(IV)-AAIII systems in HClO4 media we found it necessary to perform purifications of AAIII to remove the potentially interfering impurities that were present. Job’s method experiments for both Zr(IV)-AAIII and Hf(IV)-AAIII systems in 1 and 2 M HClO4 suggest the formation of 1:1 and 1:2 M(IV)-AAIII complexes. The presence of these complexes was consistent with speciation models which utilized conditional stability constants determined from fitting the absorption data with the
Figure 6. (A) Speciation of PUREX relevant concentrations of 1.05 M U(VI), 0.01 M Pu(IV), 0.0095 M Hf(IV), and 3 M H+ with varied concentration of oxalate. Hydroxo and nitrate species are not shown for clarity. (B) Speciation of PUREX relevant concentrations of 1.05 M U(VI), 0.01 M Pu(IV), 0.0095 M Hf(IV), and 0.1 M oxalate with varied concentration of H+. Hydroxo and nitrate species are not shown for clarity.
(A) (B)

DE-NE0000674 – Final report
13 of 49
program HypSpec2014. Precipitation of the M(IV)-AAIII complexes was a concern and was further investigated by kinetics experiments. Solutions of 3×10⁻⁵ M AAIII were found to give stable absorbance spectra after 3 hr in <3 M HClO4. When the concentration of HClO4 exceeds 3 M, AAIII beings to decompose, meaning AAIII is not a viable indicator reagent in acidities >3 M H+. Precipitation of the Zr(IV)-AAIII complex is avoided when the concentration of Zr(IV) is 10−5 M or less in 1-4 M HClO4 media, and displays stable absorbance spectra after 3 hr. Decomposition occurs in >4 M HClO4
The solvent extraction system we have developed, which used the extractant TTA, provided a method of stability constant measurement that is applicable for the study of Zr(IV), Hf(IV), and Pu(IV). Distribution measurements of 175+181Hf(IV) radiotracer characterized the extraction mechanism and extraction equilibrium constant specific to that system. Inclusion of oxalate into the system allowed for determination of Hf(IV)-oxalate stability constants and calculation of thermodynamic complexation data. The results of this work yielded results that were directly comparable to tetravalent actinide stability constants with oxalate, and allowed for speciation calculations to be performed. The system can readily be adapted for the study of Zr(IV) and Pu(IV). In the case of Zr, either 95Zr is used for radiometric measurement of distribution ratios or using stable Zr and measuring the distribution ratios by ICP-OES.
DE-NE0000674 – Final report
14 of 49
TASK 2. CHARACTERIZING THE MOLECULAR SCALE IMPACTS OF DILUENTS AND PHASE
MODIFIERS
Publications
Working title dissertation Ashleigh Kimberlin: "Utilization of Traditional and Novel NMR Spectroscopic Techniques to Probe Interactions in the Organic Phase of Liquid-Liquid Solvent Extraction Systems" expected completion June 2017
Working title dissertation Devon Dodd:"Profiling Complex Acidic Organophosphorus Extractant Interactions in Organic Phase and Interfacial Region in Separations Systems" expected completion June 2017
Completed dissertation partially supported by this project: PROBING MOLECULAR INTERACTIONS IN THE ORGANIC PHASE OF TALSPEAK-LIKE SYSTEMS USING NMR SPECTROSCOPY
Elizabeth O’Leary Krahn, Doctor of Philosophy, Washington State University, Department of Chemistry, July 2016
Publications in preparation
Section 1. Several papers are in preparation based on the work detailed in section 1 of the report. The first, “Diluent Effects in Advanced TALSPEAK”, is currently being prepared and will detail all of the work in the first part of this manuscript pertaining to how non-hydrogen bonding diluents affect extraction by HEH[EHP]. The second will contain investigations into how the polar diluent/phase modifier n-octanol effects the extraction and how this could be applied to other solvent extraction systems. The third will be a paper introducing DOSY to the analysis of organic phases and will contain the CMPO-HDEHP work along with the analysis of HEH[EHP] with DOSY.
Section 2. Several future publications are expected to result from the process of completing this body of work. The first will be Diluent Effects in Advanced TALSPEAK which will discuss possible contributions to the observed diluent effect on HEH[EHP] extraction of Eu from nitric acid media. The second, will be a paper on the investigations of the subtleties of the thermodynamic differences between diluent systems for a variety of metals: Eu, Tb, and Yb. A third paper, will look at the interfacial behavior of HEH[EHP] as a whole, since it is not well documented in the existing literature. The effect of temperature, contents of the aqueous phase including pH and ionic strength, and diluent will all be studied. Finally, a fourth paper will be prepared fcusing on the interfacial interactions between two commonly used phase modifiers, TBP and octanol, with HEH[EHP] as well as their sterically hindered derivatives, cyclohexanone and cyclohexanol, with HEH[EHP].
Section 3.
Publication 1: impact of 1-octanol as a phase modifier on SX of europium by HEH[EHP] and HDEHP
Publication 2: Stability constants determination and prediction of SX of lanthanides by HEH[EHP]
Section 4.
NMR Dynamics study of solvent extraction applications of phase modifiers and diluent effects
Introduction
The second issue that was addressed in this program is characterization of the effect of organic solvent composition on solvent extraction process performance. It is known from reported NMR spectroscopic studies and ESI-MS that in a combined extractant system (like the TRUSPEAK process), the acidic and

DE-NE0000674 – Final report
15 of 49
solvating extractant molecules can interact strongly with each other.1,2 Two conditions result: 1) less extractant is available for metal ion partitioning via the conventional extractant pathway, and 2) the interaction between the extractants create more complex extractant solutions that decrease predictability of metal ion partitioning reactions.
An unwritten rule of solvent extraction process design is that “when all else fails, change the diluent”, which can sometimes provide unexpected process performance benefits. Recent work in this area modifies this guidance with an admonition to analyze interactions between molecules and ions more deeply to gain understanding (then, change the diluent if you must). This strategy was employed in our prior studies of the TALSPEAK Process 3,4 and has been used extensively in the European program dedicated to developing advanced nuclear fuel reprocessing schemes. 5
Due in part to the diverse array of organic solvents with widely variable solvation properties that can be employed in liquid-liquid extraction, few models based on fundamental interaction properties have been developed to describe solvation phenomena in organic solutions. The models that have proven most useful (e.g., Hildebrand solubility parameters which are based on “cohesive energy density”) mainly involve empirical/semi-empirical correlations of physicochemical properties whose relationship to solvent extraction is obscure. Marcus has probably provided the most cogent descriptions of these phenomena that are of relevance to solvent extraction. 6 Our detailed investigations of solute partitioning in the TALSPEAK process have convinced us of the value of spectroscopic examination of the organic solutions that are central to solvent extraction. In those investigations, vibrational and optical spectroscopy, NMR spectrometry, ESI-MS, Fluorescence spectroscopy, and Small Angle Neutron Scattering (SANS) were combined with water analysis, tensiometry, calorimetry, and radiotracer distribution studies to enable a level of modeling of TALSPEAK organic phases that is not typically attempted in solvent extraction systems. It has become clear that interactions within the organic phase can be complex in solvent extraction.
We have also observed in some preliminary experiments relevant to this project that partitioning of water and solute molecules between the aqueous and organic phases can also have impact on phase transfer reactions. We have examined the partitioning of Eu3+ between a 2 M NaNO3 solution and solutions of HDEHP in five diluents of different classes, dodecane, tetrachloroethylene, toluene, octanol and cyclohexanone. As shown in Figure 1.1, slope analysis of HDEHP in the three nonpolar diluents differ by about 103. The slope of log D vs. log [HDEHP] increases from dodecane to tetrachloroethylene to toluene. It has been conventional to attribute such differences in slope to activity coefficient changes, though our earlier spectroscopic studies suggest that more detailed examination of such phenomena can provide useful insights into organic phase solubility phenomena, often attributable to molecular scale ordering phenomena. The polar diluents octanol and cyclohexanone exhibit much lower Eu3+ distribution ratios and an apparent much lower Eu:HDEHP stoichiometry in the apparent extracted complex. Karl Fisher analysis of the extractant phases after equilibration with 2 M NaNO3 confirms the hydrophilic nature of cyclohexanone and 1-octanol, but also establishes that the nonpolar diluents also accept considerable concentrations of water as the concentration of extractant increases. In dodecane, tetrachloroethylene, and toluene an apparent 1:1 stoichiomety between extracted water and [HDEHP]org is indicated above some threshold concentration. The correlation between increasing extractant concentration and water content in that solution should not be surprising, but mixing between the phases may have important implications (and possibilities) in the tuning of extraction systems. In combined extractant systems or systems whose concentrations of extracted metal ions approach organic phase saturation limits may undergo substantial alteration. 7 This increased complexity represents both a potential problem but also an opportunity to improve system operations.

DE-NE0000674 – Final report
16 of 49
Recent work reported elsewhere and done in our labs on combined extractant systems have provided further indications that the details of such interactions have significant long–term value. One objective of this portion of the project is to advance knowledge of organic solvation phenomena toward a deeper understanding based on fundamental interactions between solvent and solute molecules.
Section 1. Changing Stoichiometry of extraction reactions or Activity Effects?
Slope Analysis
To follow on from these early observations (while simultaneously providing a radioanalytical chemistry training exercise for several graduate students), a study of slope analysis in cation exchanging solvent extraction systems was completed. In this study, students were directed to a diverse array of organic diluents and instructed to investigate both the acid (H+) dependence and the extractant dependence for radiotracer Eu extraction by HEH[EHP] in a variety of diluents. An example slope analysis plot for the pH dependence and extractant dependence is shown in Figure 1.2.
The total summary of the diluent dependent experiments is shown in Table 1.1. For all diluents tested, the pH dependent log-log plot produce a straight line with a slope of 3, indicating that 3 protons are exchanged for the Eu3+
ion and charge neutrality in the organic phase is being maintained. The HEH[EHP] dependent log-log plots produced straight lines with slopes that varied from a minimum of 2.4 in n-dodecane to 3 in benzene. The amount of extraction changed according to diluent as well, with about a 2 order of magnitude difference in Kex values calculated according to equation 4.
-0.5 0.0 0.5 1.0-4
-2
0
2
log
DE
u
log [HDEHP], M
dodecane tetrachloroethylene toluene octanol cyclohexanone
-3 -2 -1 0
-3
-2
-1
0
1
log
[H2O
] org, M
log [HDEHP], M
dodecane tetrachloroethylene toluene octanol cyclohexanone
Left panel. Distribution coefficients for five different diluents in function of the HDEHP concentration. The slopes are 2.79 ± 0.05, 2.90 ± 0.04 and 2.97 ± 0.03 for respectively dodecane, tetrachloroethylene and toluene. Right panel. Corresponding water content of organic phases at equilibrium.

DE-NE0000674 – Final report
17 of 49
In order to understand the diluent effect, the slope analysis data was modeled in two ways. The most obvious explanation for this effect is that the slope analysis is reflective of the average stoichiometry of the final extracted metal complex. This suggests that in aliphatic diluents there is a mixture of 5 and 6 HEH[EHP] monomers around the metal center. This is the original hypothesis provided by Mason and Peppard 8 when this phenomenon was first observed. Two Kex values can be theorized based off of this, shown in Equation 1. Assuming that the 5 and 6 ligand complexes are the only ones formed, the observed D value can then be rewritten as shown in Equation 2. These equations can then be combined into Equation 3.
K .ML HL HM HL . K
ML HL HM HL
Eq. 1
DML HL ML HL
MEq. 2
-2.0 -1.5 -1.0
-2
-1
0
1
log
D
log [HEHEHP]
m = 2.69 Diluent: n-octanepH = 2
1.2 1.4 1.6 1.8 2.0 2.2 2.4 2.6 2.8-3
-2
-1
0
1
2
3
log
D
pH
m = 3.01 0.08Diluent: n-octane[HEHEHP] = 0.02M
-1.4 -1.2 -1.0 -0.8-1.0
-0.5
0.0
0.5
1.0
m = 3.03 0.03Diluent: toluene[HEHEHP] = 0.25M
m = 2.96 0.01Diluent: toluenepH = 2
log
D
log [HEHEHP]
1.0 1.5 2.0 2.5-2
0
2
4
log
D
pH
Figure 1.2: Examples of pH dependent (a) and ligand dependent (b) slope analysis. n-Octane was used as the organic diluent for both extraction sets. The pH dependent plot had a constant [HEHEHP] = 0.02 M. The aqueous phase was HNO3/ NaNO3 with an ionic strength of 0.1 M. The pH was held constant at pH = 2 for the ligand dependent plot.

DE-NE0000674 – Final report
18 of 49
DK . HL . K HL
HEq. 3
In order for these equations to be valid, the amount HEH[EHP] dimer needs to be known. Because dimerization constants are only known for a handful of diluents tested and fairly high concentrations of HEH[EHP] are used in most cases, it is assumed that the HEH[EHP] is 100% dimerized. K3 and K2.5 values were calculated using the Solver function in Microsoft Excel and are shown in Table 2.
The other method is assuming that the only metal species in the organic diluent is the 1:6 M:L species and that the effect seen is the diluent’s effect on various other equilibria in the solvent extraction system. Since the studying diluent effects on all possible equilibria (including pKa’s, dimerization, water uptake, etc.) for all the diluents studied is a gargantuan task, for now all of these effects are being rolled into activity coefficients so that the different diluents can be compared directly. If it is assumed that only the 1:6 complex forms in solution, the difference in slopes can be corrected using a basic organic activity model. In this model, the slope of the ligand-dependent analysis was forced to the ideal value of 3, as shown in Equation 4.
Eq 4
Eq 5
Table 2: Log K values calculated from Equation 6. The error shown is 1σ and was calculated based on variation of individual fits of D values. The data is arranged according to decreasing Δ log K. The difference between the two K values (therefore the ratio of the 1:5 and 1:6 complex) is what causes the change in slope according to the multi-complex theory
Diluent log K3 log K2.5 Δ log K n-Dodecane -1.56 ± 0.13 -0.47 ±0.14 1.09 n-Decane -1.55 ± 0.15 -0.53 ± 0.12 1.02 Isooctane -1.47 ± 0.16 -0.49 ± 0.34 0.98 Nitrobenzene -1.74 ± 0.59 -2.47 ± 0.47 0.73 Decalin -1.510 ± 0.002 -0.82 ± 0.27 0.68 n-Octane -1.40 ± 0.12 -0.75 ± 0.09 0.65 Cyclohexane -1.32 ± 0.21 -1.02 ± 0.15 0.30 Cyclohexene -0.93 ± 0.16 -2.18 ± 0.42 -1.25 Tetrachloroethylene -1.27 ± 0.28 -2.63 ± 0.11 -1.36 o-Dichlorobenzene -1.88 ± 0.18 -3.32 ± 0.8 -1.44 1,3-Diisopropylbenzene -0.78 ± 0.21 -2.29 ± 0.62 -1.51 Xylenes -2.02 ± 0.25 -4.44 ± 0.88 -1.77 Benzene -2.27 ± 0.15 -4.55 ± 0.19 -2.12 Toluene -1.95 ± 0.03 -4.54 ± 0.63 -2.59 Tetralin -1.79 ± 0.32 -4.58 ± 0.35 -2.79

DE-NE0000674 – Final report
19 of 49
The chemical activity of HEH[EHP] was then plotted against the molar [HEH[EHP]] and fit to a line. This linear equation was used to compare the effects that different diluents had on the extraction. The linear fit parameters as well as organic activity corrected log Kex values are reported in Table 3.
To further test the effect of diluent on the extraction of Eu by HEH[EHP], an extended range of points was obtained for n-octane and toluene. These diluents were chosen because they model the two extremes of the diluent effect seen with HEH[EHP]. Because the gamma counting efficiency is such that counts below 50 cpm are inadequate for analysis, the pH range of the extraction had to be altered so that the log D value was between -2.5 and 2.5. This created the three regions seen in Figure 1.3; the rightmost one was collected with an aqueous pH of 1.0, the middle pH = 2.0, and the leftmost pH = 2.6. In n-octane, the slope of the ligand dependent extraction curve decreased at the high end of HEH[EHP] ([HEH[EHP]] > 1M). In toluene, there was a slight increase in extraction at the same high [HEH[EHP]]. The slope of the log-log plot in the low [HEH[EHP]] region ([HEH[EHP]]<1mM, pH = 2.6) approached 2.5 in both n-octane and toluene.
In an effort to understand this trend, the solvent extraction modeling program SXFIT was used to construct a model that took organic phase activities into account. The model used is as shown in Table 4. The equilibrium constants, mason coefficients, and molar volumes used were pulled from various literature sources. 9-16 Due to the limitations of SXFIT, only one parameter was fit at a time until the values seemed to converge. This unfortunately makes the model heavily dependent on the initial values. The initial Hildebrand parameters for the HEH[EHP] dimer were estimated to be similar to those of HDEHP, taken from Gray’s work using vapor pressure osmometry. The others were assumed to be 1 until fit. While these models provided a fair fit for the high and middle regions of the curve (Figure 1.4), the low end of the curve could not be fit with this model.
Table 3: HEHEHP Activity fits using Equation 6 and Eu-HEHEHP extraction coefficients
Diluent m b log Kex
Isooctane 1.25 ± 0.02 6x10⁻³± 1 x10⁻³ -1.38 ± 0.12
n-Dodecane 1.17 ± 0.01 1.4 x10⁻² ± 1 x10⁻³ -1.44 ± 0.05
n-Decane 1.18 ± 0.01 1.6 x10⁻² ± 1 x10⁻³ -1.52 ± 0.06
Decalin 1.23 ± 0.01 4.5 x10⁻³ ± 4 x10⁻⁴ -1.61 ± 0.17
n-Octane 1.19 ± 0.02 1.1 x10⁻² ± 1 x10⁻³ -1.78 ± 0.07
Cyclohexane 1.14 ± 0.01 1.1 x10⁻² ± 1 x10⁻³ -1.90 ± 0.05
1,3-Diisopropylbenzene 1.12 ± 0.01 5.2 x10⁻³± 8x10⁻⁴ -2.22 ± 0.14
Cyclohexene 1.11 ± 0.01 6.1 x10⁻³ ± 7 x10⁻⁴ -2.29 ± 0.30
Tetrachloroethylene 1.09 ± 0.01 5 x10⁻³ ± 1 x10⁻³ -2.67 ± 0.12
Tetralin 0.938 ± 0.007 -3.1 x10⁻³ ± 8 x10⁻⁴ -2.90 ± 0.12
Nitrobenzene 1.23 ± 0.02 5 x10⁻³± 1 x10⁻³ -3.06 ± 0.14
o-Dichlorobenzene 1.07 ± 0.01 5 x10⁻³ ± 1 x10⁻³ -3.24 ±0.09
Xylenes 1.013 ± 0.001 2.6 x10⁻⁴ ± 5 x10⁻⁵ -3.31 ± 0.23
Benzene 0.9945 ± 0.003 5x10⁻⁵± 3 x10⁻⁶ -3.52 ± 0.15
Toluene 1.011 ± 0.008 8.1 x10⁻⁴ ± 8 x10⁻⁵ -3.60 ± 0.03

DE-NE0000674 – Final report
20 of 49
Solvent extraction of Eu3+ by HEH[EHP] was also performed in a mixed toluene-octane organic solvent. The results are shown in Figure 1.5. There was only a slight linear correlation of the ligand dependent slope with the amount of toluene in the solvent, mostly because the range of possible slopes was rather small and the errors in the slope large. The Kex, calculated according to Equation 2, provided a much better correlation. When the log Kex is plotted against the mole fraction of toluene in the solvent, a curve is produced. This curve seems to tend towards the toluene side of the mixed diluent extraction, suggesting that toluene preferentially solvates in this system.
-3 -2 -1 0 1-4
-3
-2
-1
0
1
2
3lo
g D
log HEHEHP
(a)
-4 -3 -2 -1 0 1-4
-3
-2
-1
0
1
2
3
log
D
log [HEHEHP]
(b)
Figure 1.3: Slope analysis of a large range of [HEHEHP] in both toluene (a) and n-octane (b). In order to avoid counting errors due to low activity in either phase, the extractions were modified so that the log D values remained between +3 and -3. The pH had to be changed to achieve this, resulting in the three lines seen in each graph. The rightmost line was taken at pH = 1.0, the middle line was at pH = 2.0 and the leftmost line was taken at pH = 2.6.
-3.0 -2.5 -2.0 -1.5 -1.0 -0.5 0.0 0.5
-4
-3
-2
-1
0
1
2
3
Collected Data SXFIT Model 2.5 SXFIT Model 3
log
D
log [HEHEHP]
(a)
-4.5 -4.0 -3.5 -3.0 -2.5 -2.0 -1.5 -1.0 -0.5 0.0-6
-5
-4
-3
-2
-1
0
1
2
3
Collected Data SXFIT Model 2.5 SXFIT Model 3
log
D
log [HEHEHP]
(b)
Figure 1.4: Slope analysis of a large range of [HEHEHP] with the modeled points generated by SXFIT. Panel a depicts the extraction of Eu into toluene and panel b shows the same extraction into n-octane. The fitting parameters and fitted values are shown in Table 1.4. Model 2.5 was generated assuming only the only extracted species is MH3L5 and model 3 was generated using MH3L6.

DE-NE0000674 – Final report
21 of 49
The effects of adding a phase modifier to extraction systems was also probed by performing slope analysis of Eu extraction by HEH[EHP] with n-octanol present in varying amounts. Up to 30% v/v octanol was added to the organic phase to test how changing the polarity and the hydrogen bonding “network” effects the extraction of metal. The amount of octanol added could not go above 30% because no extraction occurs. The results are shown in Figure 1.6. Generally, the amount of extraction decreased with increasing [octanol] and the slope of the extractant dependent line increased to a maximum value of 4.5.
Eu Luminescence Studies
The luminescence spectra of the Eu complexes can provide unique insights into the coordination environment around the metal center and so, useful information about the metal – extractant interactions.
0 20 40 60 80 100
2.65
2.70
2.75
2.80
2.85
2.90
2.95
3.00H
EH
[EH
P]
Dep
t Slo
pe
% Toluene
0 20 40 60 80 100-4.0
-3.5
-3.0
-2.5
-2.0
-1.5
-1.0
log
Kex
Percent Toluene
Figure 1.5: Slope analysis results in a mixed toluene/ n-octane diluent. The left graph depicts the slope of the log [HEHEHP]-log D line produced for the extraction of radiotracer Eu by HEHEHP. The curve on the right depicts the log Kex calculated using equation 2. The curve on the right graph is to guide the eye.
0.0 0.2 0.4 0.6
3.0
3.2
3.4
3.6
3.8
4.0
Lig
nad
Dep
t. L
og-L
og S
lope
[n-OctOH]
-1.4 -1.2 -1.0 -0.8 -0.6 -0.4 -0.2 0.0 0.2 0.41E-6
1E-5
1E-4
Kex
log [n-OctOH] (M)
Figure 1.6: Slope analysis results of Eu extraction by HEH[EHP] as the phase modifier n-octanol is added. The top graph shows the variation in the [HEHEHP] dependent slope analysis, i.e. the apparent stoichiometry of the Eu-HEH[EHP] complex. The lower graph shows the variation in Kex
(Equ. 2) as octanol is added. The [HEHEHP] in the lower graph is 0.1M and the aqueous phase is pH = 2, μ = 0.1M HNO3/NaNO3.

DE-NE0000674 – Final report
22 of 49
Luminescence spectra of selected Eu3+-HEH[EHP] complex were taken in a couple of diluents in order to probe potential changes in stoichiometry. The spectra taken in toluene and n-octane are shown in Figure 1.7. The two spectra, once normalized to the 590 nm peak, appear to be virtually identical. One interesting feature is that the D0→F0 transition, although very weak, can be seen. In order to improve the signal to noise ratio of this peak, approximately 40 spectra were taken and averaged together. The result is shown in panel b of Figure 1.7. There are three peaks for this transition, located at 575 nm, 577.8 nm, and 581 nm. This corresponds to an energy difference of approximately 0.01 eV between each peak in the transition. The time resolved fluorescence (TRF) spectra of the Eu-HEH[EHP] complex in each diluent was also taken. The two lifetimes were 3410±12 μs in n-octane and 2949±4 μs in toluene. These are both too long to be fit with Kimura’s empirical correlation with the number of waters, suggesting that there is not a significant amount of water in the extracted metal ligand complex.
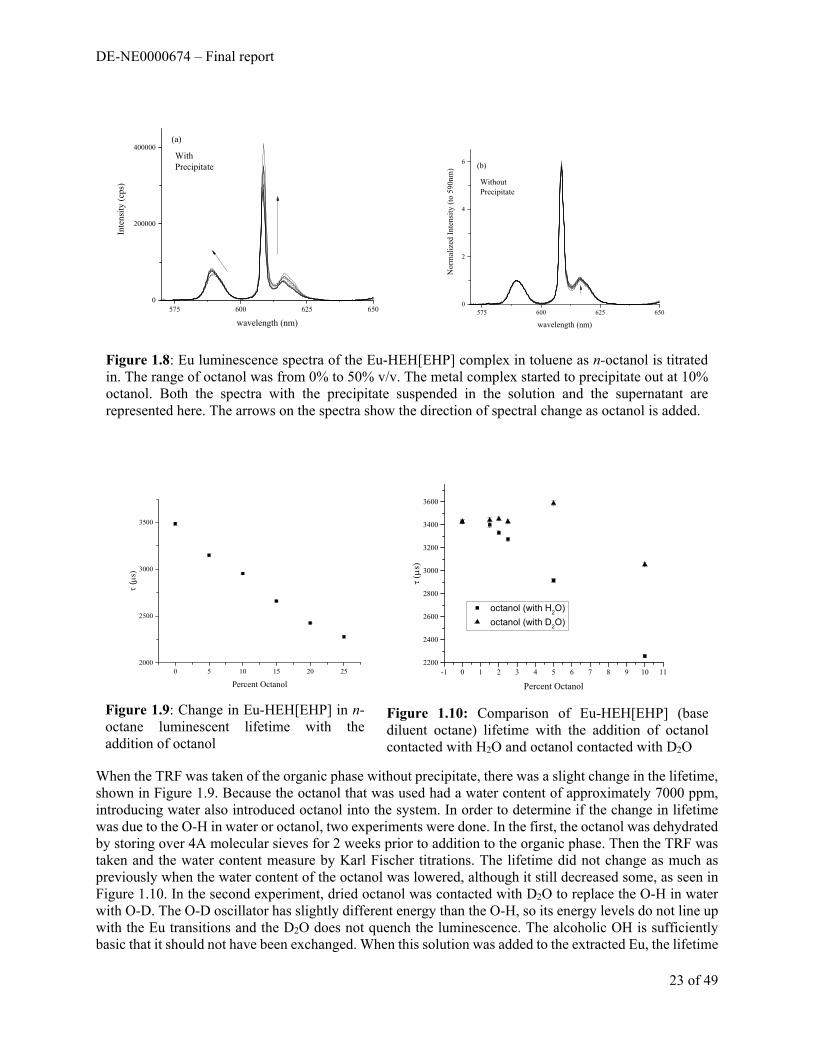
Because the electronic transitions of Eu+3 line up well with the vibrational transitions of O-H groups, the TRF traces can be used to quantify the number of O-H groups directly bonded to the Eu metal center. To investigate the possibility of partial hydration of the final extracted complex, varying amounts of the phase modifier n-octanol was added to toluene based organic phases post extraction. Toluene was chosen as the base diluent because solvent extraction was ideal (m=3) in toluene. First, the luminescence spectra were taken at each [octanol]. A precipitate began to form at about 7% v/v octanol. This was determined to primarily be the Eu-HEH[EHP] complex through FTIR and taking the luminescence spectrum of the precipitate suspended in solution. The normalized and background corrected spectra of the organic phase with and without the precipitate is shown in Figure 1.8. The spectra without the precipitate present appear identical, suggesting that the octanol is only affecting the solubility of the extracted metal complex. The peak at 590 nm in the spectra with the precipitate appears to split, indicating a solidification of the geometry around the Eu metal center. The hypersensitive transition at 618 nm decreases in intensity, perhaps reflecting that a more symmetric geometry in being created around the metal center.
550 600 6500.0
0.5
1.0
norm
aliz
ed in
tens
ity
wavelength (nm)
(a)
565 570 575 580 5850
1
2
3
4
5
norm
aliz
ed in
tens
ity
wavelength (nm)
(b)
Figure 1.7: Luminescence spectra of approx. 6mM Eu extracted by 0.2M HEH[EHP] and diluted by a factor of 4. Panel a shows the background corrected, normalized (to the 620 nm peak) full spectrum of Eu-HEH[EHP] extracted complex in both n-octane (gray line) and toluene (light gray dashes). Panel b depicts the 5D0→7F0 transition, normalized to the peak at 577 nm. Because of the low intensity of this transition (about 1% the height of the main peak) the spectra shown are an average of 32 spectra.
DE-NE0000674 – Final report
23 of 49
When the TRF was taken of the organic phase without precipitate, there was a slight change in the lifetime, shown in Figure 1.9. Because the octanol that was used had a water content of approximately 7000 ppm, introducing water also introduced octanol into the system. In order to determine if the change in lifetime was due to the O-H in water or octanol, two experiments were done. In the first, the octanol was dehydrated by storing over 4A molecular sieves for 2 weeks prior to addition to the organic phase. Then the TRF was taken and the water content measure by Karl Fischer titrations. The lifetime did not change as much as previously when the water content of the octanol was lowered, although it still decreased some, as seen in Figure 1.10. In the second experiment, dried octanol was contacted with D2O to replace the O-H in water with O-D. The O-D oscillator has slightly different energy than the O-H, so its energy levels do not line up with the Eu transitions and the D2O does not quench the luminescence. The alcoholic OH is sufficiently basic that it should not have been exchanged. When this solution was added to the extracted Eu, the lifetime
575 600 625 6500
200000
400000
Inte
nsity
(cp
s)
wavelength (nm)
(a)
With Precipitate
575 600 625 6500
2
4
6
Nor
mal
ized
Int
ensi
ty (
to 5
90nm
)
wavelength (nm)
(b)
WithoutPrecipitate
Figure 1.8: Eu luminescence spectra of the Eu-HEH[EHP] complex in toluene as n-octanol is titrated in. The range of octanol was from 0% to 50% v/v. The metal complex started to precipitate out at 10% octanol. Both the spectra with the precipitate suspended in the solution and the supernatant are represented here. The arrows on the spectra show the direction of spectral change as octanol is added.
0 5 10 15 20 252000
2500
3000
3500
(
s)
Percent Octanol
Figure 1.9: Change in Eu-HEH[EHP] in n-octane luminescent lifetime with the addition of octanol
-1 0 1 2 3 4 5 6 7 8 9 10 112200
2400
2600
2800
3000
3200
3400
3600
s)
Percent Octanol
octanol (with H2O)
octanol (with D2O)
Figure 1.10: Comparison of Eu-HEH[EHP] (base diluent octane) lifetime with the addition of octanol contacted with H2O and octanol contacted with D2O

DE-NE0000674 – Final report
24 of 49
decreased again but not as dramatically as when H2O was present. This could be from residual H2O or from octanol coordinating to the metal center. In all of the previous cases mentioned, the lifetime of Eu3+ never decreased below 1145 μs, which is the threshold for one OH oscillator around the Eu3+ center.
Total X-Ray Fluorescence
To probe how many HEH[EHP] molecules were around the Eu center, the ratio of Eu to P was measured using TXRF. The Eu-HEH[EHP] complex was extracted into octane, precipitated using octanol, and redissolved in heptane to ensure that most of the HEH[EHP] came from the metal complex. The peaks from P and Eu were present, along with trace amounts of Zn, Br, Ca, Cu, Ti, and Cl that most likely came from dust or cleaning solution still present on the sampling plates. The spectra were analyzed using the SPECTRA software included with the S2 Picofox spectrometer. The ratio of P to Eu was determined to be 6.0 ± 0.2. While this is the expected stoichiometry, this analysis is purely reflective of the solid precipitate and not necessarily the stoichiometry present in solution.
NMR Spectroscopy
A new method of K determination in organic media was developed using Diffusion Ordered Spectroscopy (DOSY), a 2D NMR technique that probes the size of species in solution. A calibration curve created using molecules that were oblate spheroids (the shape of the HEH[EHP] dimer and most extractants) was created in n-dodecane using the method developed by Neufeld and Stalke17. A calibration curve previously created by that group was used for the analyses in toluene. Anthracene was used as an internal reference in the analysis.
To test this new method, the interaction equilibrium between HDEHP and CMPO in n-dodecane was tested using both the chemical shifts in the 31P spectrum and the DOSY analysis collected using the proton spectrum. The results are shown in Figure 1.11. The value for KCMPO-HDEHP was 2.70 ± 0.04 and the K(HDEHP)2
was 2.68 ± 0.11. Both of these are lower than the values from the literature, but the literature value was determined in a solution that had been contacted with water.

DE-NE0000674 – Final report
25 of 49
The dimerization constant of HEH[EHP] in n-dodecane, n-octane, and toluene was determined through chemical shift analysis and DOSY spectroscopy. Both the 31P of HEH[EHP] and the acidic proton were followed and the K2 was modeled using HypNMR and Excel. A coaxial insert containing the deuterated lock solvent and H3PO4 for 31P reference was used. The DOSY spectrum was taken using the proton spectrum and the OCH2 peak at 3.12 ppm was followed in the analysis. The chemical shift analysis using both the 31P and the acidic proton should have produced the same K2 value, but the two fits disagreed with one another. The fits according to the 31P spectra and the predicted molecular weights using the calculated K2 are shown in Figure 1.12. The K2 value determined using the phosphorus was far too low, and the predicted molecular weights did not match those determined through DOSY. In toluene, the chemical shift of the acidic proton could be fit using HypNMR. The results and comparison to the molecular weights obtained through DOSY are shown in Figure 1.13. In n-dodecane, the proton spectrum chemical shifts could not be fit, so the molecular weights were used to estimate the dimerization constant. In both diluents, the diffusion coefficient of the anthracene internal standard changed by more than 1x10⁻¹⁰ m2/s when [HEH[EHP]] > 0.1M. This indicates a large change in the solvent viscosity, so diffusion coefficients collected at [HEH[EHP]] > 0.1M were neglected. The K2 values determined in both diluents were within error of one another, suggesting that something is being neglected in this analysis. The K2 in aliphatic diluents has consistently been shown to be higher than aromatics in the literature. Additionally, the K2
Figure 1.11: Analysis of the KCMPO-HDEHP in n-dodecane. [CMPO] = 0.01M and [HDEHP] = 0.001-0.1M. Both the 31P of the CMPO and HDEHP were followed and referenced to H3PO4 dissolved in acetone in a coaxial insert. The CMPO fit is the upper left graph and the HDEHP fit is the upper HDEHP graph. The lower graph is the molecular weights determined through DOSY. The red line on this graph is the predicted molecular weights from the HypNMR fits.
CMPO-HDEHP
-3.0 -2.6 -2.2 -1.8 -1.4 -1.0log concentration of HDEHP
30
32
34
36
38
chem
ical
shi
fts fo
r nu
cleu
s P
C
0
10
20
30
40
50
60
70
80
90
100
% fo
rmat
ion
rela
tive
to C
MP
O
CMPO-HDEHP
-3.0 -2.6 -2.2 -1.8 -1.4 -1.0log concentration of HDEHP
-2.6
-2.2
-1.8
chem
ical
shi
fts fo
r nu
cleu
s P
H
0
10
20
30
40
50
60
70
80
90
100
% fo
rmat
ion
rela
tive
to H
DE
HPCMPO
CMPO‐HDEHP
CMPO‐HDEHP
HDEHP
(HDEHP)2
1E-3 0.01 0.1400
500
600
700
Mol
ecul
ar W
eigh
t
[HDEHP] Added

DE-NE0000674 – Final report
26 of 49
determined was far lower than the literature values. This could be due to most of the literature contacting the organic phase with water in the analysis of the dimerization constant.
The DOSY spectrum of Lu-HEH[EHP] complexes was taken in both n-dodecane and toluene. The molecular weight of the species in toluene corresponded to 2.85 ± 0.25 HEH[EHP] monomers around the metal center and in n-dodecane 3.22 ± 0.07 monomers. This suggests that the primary extracted metal complex contains 3 HEH[EHP] that are tightly bound directly to the metal center and that any others that are present are coordinating in a secondary manner.
Figure 1.12: Dimerization constant of HEH[EHP] in n-dodecane and toluene determined using the 31P NMR chemical shifts. The upper plots are the fits from HypNMR and the bottom are the DOSY results. The line on the bottom plots are the predicted molecular weights
HEHEHP dimerization in dodecane
-2.5 -1.5 -0.5log concentration of HL
30.6
31.0
31.4
31.8
32.2
chem
ical
shi
fts fo
r nu
cleu
s 31
P
0
10
20
30
40
50
60
70
80
90
100
% fo
rmat
ion
rela
tive
to H
L
2
-3.0 -2.0 -1.0 0log concentration of HL
33.2
33.6
34.0
34.4
chem
ical
shi
fts fo
r nu
cleu
s 31
P
0
10
20
30
40
50
60
70
80
90
100
% fo
rmat
ion
rela
tive
to H
L
n-DodecaneLiterature K2 = 4.42
Determined K2 = 0.2512 ± 0.03
TolueneLiterature K2 = 3.37
Determined K2 = -0.2598 ± 0.09
HEHEHP HEHEHP
(HEHEHP)2(HEHEHP)2
-2.0 -1.8 -1.6 -1.4 -1.2 -1.0 -0.8 -0.6 -0.4 -0.2 0.0 0.2300
350
400
450
500
550
Mo
lecu
lar
Wei
ght
log[HEHEHP] (M)-2.5 -2.0 -1.5 -1.0 -0.5 0.0
300
350
400
450
500
550
600
650
700
Mol
ecu
lar
Wei
ght
log[HEHEHP] (M)

DE-NE0000674 – Final report
27 of 49
References
1. Lumetta, G.J.; Gelis, A.V.; Braley, J.C.; Carter, J.C.; Pittman, J.W.; Warner, M.G.; Vandegrift, G.F.; 2013, Solv. Ext. Ion. Exch.31, 223-236.
2. Aaron Johnson, Joel Alvarez, and Kenneth L. Nash, Solvent Extraction and Ion Exchange, 35, in press 2017
3. Travis S. Grimes, Guoxin Tian, Linfeng Rao, Kenneth L. Nash. Inorganic Chemistry (2012), 51(11), 6299-6307
4. Cecile Marie, Bill Hiscox, Kenneth L. Nash Dalton Transactions [1477-9226] (2012) vol:41 iss:3 pg:1054-1064
5. C. Hill, “Overview of Recent Advances in An(III)/Ln(III) Separation by Solvent Extraction” Ch. 3 in Ion Exchange and Solvent Extraction Vol 19. B. A. Moyer, Ed. CRC Press 2010, pp. 119-194.
6. Y. Marcus “Principles of Solvents and Solultions” Ch. 2 in Solvent Extraction Principles and Practice, 2nd Edition. J. Rydberg, M. Cox, C. Musikas, G. R. Choppin Eds. Marcel Dekker, 2004. pp.27-80.
7. Travis S. Grimes, Mark P. Jensen, Lisa Debeer-Schmidt, Ken Littrell, Kenneth L. Nash. Journal of Physical Chemistry B (2012), 116(46), 13722-13730.
8. Mason, G. W.; Bollmeier, A. F.; Peppard, D. F. J. Inorg. Nucl. Chem. 1967, 29, 1103–1112. 9. Chatterjee, S.; Campbell, E. L.; Neiner, D.; Pence, N. K.; Robinson, T. A.; Levitskaia, T. G. J.
Chem. Eng. Data 2015, 60, 2974–2988. 10. Barton, Allan, F. M. CRC Handbook of Solubility Parameters; 1983. 11. Millero, F. J. In Water and Aqueous Solutions; 1972. 12. Wohlfarth, C. W. CRC Handb. Chem. Phys. 2016, 6-187-6–208. 13. Kolarik, Z. Solvent Extr. Ion Exch. 2010, 28, 707–763.
Figure 1.13: Dimerization constant of HEH[EHP] in dodecane and toluene determined using the 1H chemical shifts and the molecular weights obtained through DOSY
n-DodecaneLiterature K2 = 4.42
Determined K2 = 2.60 ± 0.07*Viscosity Increases at [HEHEHP] > 0.1M
TolueneLiterature K2 = 3.37
Determined K2 = 2.68 ± 0.04*Viscosity Increases at [HEHEHP] > 0.1M
-1.5 -1.0 -0.5 0.010.0
10.5
11.0
11.5
12.0
12.5
(p
pm
)
log [HEHEHP]
-2.5 -2.0 -1.5 -1.0 -0.5 0.0
450
500
550
600
650
700
Mol
ecul
ar W
eigh
t
log [HEHEHP]
-2.0 -1.8 -1.6 -1.4 -1.2 -1.0 -0.8 -0.6 -0.4 -0.2 0.0 0.2
440
460
480
500
520
540
560
580
Mol
ecul
ar W
eigh
t
log[HEHEHP] (M)

DE-NE0000674 – Final report
28 of 49
14. Miralles, N.; Sastre, a.; Martinez, M.; Aguilar, M. Anal. Sci. 1992, 8, 773–777. 15. Andersson, S.; Eberhardt, K.; Ekberg, C.; Liljenzin, J. O.; Nilsson, M.; Skarnemark, G.
Radiochim. Acta 2006, 94, 469–474. 16. Gray, M.; Zalupski, P.; Nilsson, M. Procedia Chem. 2012, 7, 209–214. 17. Neufeld, R.; Stalke, D. Chem. Sci. 2015, 6, 3354–3364.
Section 2. Thermochemical Investigations of Diluent Effects in Cationic Exchange Extraction Processes
The focus of this portion of the project was to investigate the solvent-solute interactions occurring in the bulk organic phase and interfacial region in solvent extraction systems in which organophosphoric acid extractants are used. Literature has reported changes in behavior for extractants, HDEHP and HEH[EHP], as the solvent environment is altered.1–3 However, the ultimte origin of these changes in extraction behavior are unknown. The extraction of 152/154Eu (III) by HEH[EHP] from nitric acid is suppressed as the mole ratio of xylenes approaches one in a mixture of dodecane and xylenes (Figure 2.1).
Figure 2.1. The extraction efficiency of radiotracer Eu-152/154 from nitric acid media with 0.2 M HEH [EHP] as diluent character progresses from only dodecane to only xylenes.
A wide range of diluents was chosen as a first study of how the diluent impacts the extraction behavior of radiotracer 152/154Eu. Table 2.1 below, depicts all the diluents chosen. In support of this section of the investigation, pH dependence and ligand dependence experiments on iso-octane, dodecane, decane, cyclohexane, cyclohexene, benzene, xylenes, decalin, toluene, and 1,3-diisopropylbenzene were completed. Slope analysis is in principle reflective of the average stoichiometry of the final extracted metal complex. Until now the reaction equilibrium has been considered to be the following, with lines indicating species present in the organic phase:
Eu 3 HL ⇌ Eu L ∙ HL 3H
If the pH is held constant, the slope of a log D vs. log [(HL)2] should be 3; the same should hold true when the ligand concentration is held constant, with a slope of 3 for a log D vs. pH plot.
∙

DE-NE0000674 – Final report
29 of 49
∙
log 3 log 3 log
Three protons are lost no matter which diluent was chosen in the concentration range studied. The number of ligands in the extracted complex however, appears to decrease as the diluent becomes more aromatic in character. This has been vaguely attributed to “diluent effects”. It is difficult to definitively say whether these differences result from genuine shifts in complex stoichiometry or due to changes in activity of the extractant aggregates, extracted complex, or extractant monomers.
Comparing all the diluents in the study it became clear that HEH[EHP] extracts more efficiently (higher D values) when dissolved in diluents that have analogous structures to its 2-ethylhexyl tails. The addition of polar substituents to the benzene ring does not alleviate this behavior in aromatics. Increasing the length of alkyl substituents drastically improves efficiency but at the same time decreases the apparent stoichiometry of the complex. It is possible that the deviation from ‘ideality’ is an additive effect seen from changes in stoichiometry, activity of organic species, phase mixing, interfacial behavior of extractant, and the fluctuation of the dimerization constant.
At this point it was desirable to probe the subtleties of the thermodynamics in several of these diluent systems. This was achieved with biphasic isothermal calorimetric titrations. Zalupski has previously studied the thermodynamics of HDEHP extraction of Eu(NO3)3 into n-dodecane from nitric acid media.4 Replicate titrations of Tb(NO3)3 into a biphasic system of pH 3 nitric acid media and HDEHP/dodecane were performed in order to determine the appropriate stirrer and syringe height. The best results were achieved with the stirrer in the organic phase positioned just above the interfacial region. The literature value for enthalpy of reaction for Tb(NO3)3 quantitative extraction was -20.2 ± 1.0 kJ/mol, while experimental values were -20.9 ± 0.7 kJ/mol and -20.2 ± 1.5 kJ/mol, respectively for replicate attempts. Blank experiments accounting for aqueous dilution of metal, aqueous dilution of protons, and complex dilution in the organic phase were all performed prior to the biphasic attempt and all values were in agreement with Zalupski’s results.

DE-NE0000674 – Final report
30 of 49
Table 2.1. Organic phase conditions and slope analysis results; the slope is the result of plotting log D against log [HEH[EHP]] according to Eq. 4. The range of HEH[EHP] concentrations was chosen to keep the log D values between -2.5 and 2.5; this is to minimize uncertainty in γ counting statistics for low activity.
Diluent pH Dependence Ligand Dependence pH range [HEHEHP]
(M) Slope y-Intercept [HEH[EHP]]
range (M) Slope y-Intercept
n-Decane 1.2-2.6 0.05 3.01 ± 0.06 -4.70 ± 0.11 0.05 – 0.15 2.64 ± 0.03 3.25 ± 0.03 Cyclohexane 1.2-2.6 0.05 3.02 ± 0.05 -5.12 ± 0.08 0.025 – 0.15 2.68 ± 0.02 2.85 ± 0.02 n-Octane 1-1.9 0.02 3.02 ± 0.07 -8.12 ± 0.16 0.01 – 0.1 2.60 ± 0.05 3.00 ± 0.06 n-Dodecane 1.2-2.6 0.05 2.97 ± 0.01 -4.48 ± 0.01 0.05 – 0.15 2.62 ± 0.02 3.29 ± 0.02 Isooctane 1-2 0.02 3.03 ± 0.06 -5.20 ± 0.09 0.01 – 0.1 2.66 ± 0.04 3.46 ± 0.06 Nitrobenzene 1.25-2.75 0.02 2.92 ± 0.03 -6.95 ± 0.03 0.01 – 0.1 2.69 ± 0.05 3.34 ± 0.08 Decalin 1.2-2.6 0.1 3.02 ± 0.02 – 0.06 2.71 ± 0.02 4.75 ± 0.03 Tetrachloroethylene 1-2 0.2 3.01 ± 0.05 -3.74 ± 0.07 0.02 – 0.2 2.79 ± 0.02 3.67 ± 0.03 o-Dichlorobenzene 1-2 0.1 3.02 ± 0.04
-5.23 ± 0.06 0.02 – 0.2 2.76 ± 0.02 3.04 ± 0.03
Cyclohexene 1-2 0.2 2.85 ± 0.14 -3.27 ± 0.20 0.01 – 0.15 2.83 ± 0.05 2.29 ± 0.05 1,3 Diisopropylbenzene
1.2-2.6 0.15 3.06 ± 0.02 -4.79 ± 0.03 0.025 – 0.15 2.84 ± 0.01 4.23 ± 0.02
Benzene 1.2-2.6 0.25 3.02 ± 0.02 -5.16 ± 0.04 0.1 – 0.2 2.96 ± 0.01 2.85 ± 0.09 Toluene 1.2-2.6 0.25 3.03 ± 0.03 -4.90 ± 0.05 0.05 – 0.15 2.96 ± 0.01 3.13 ± 0.01 Xylenes (mix of 3 isomers)
1.2-2.6 0.25 2.97 ± 0.03
-4.81 ± 0.05 0.01 – 0.1 2.98 ± 0.07 3.57 ± 0.08
Tetralin 1-2 0.1 3.02 ± 0.09 -4.43 ± 0.07 0.02 – 0.2 3.03 ± 0.06 3.36 ± 0.05

DE-NE0000674 – Final report
31 of 49
1 2 3 4-40
-35
-30
-25
-20
-15
-10
-5
0
dH (
kJ/m
ol)
Diluent
La Eu Yb Tb
Figure 2.2. Enthalpy of extraction of various rare earths from nitric acid media at constant ionic strength of 1.0 M with sodium nitrate at 25.0° Celsius. The diluents were 1) dodecane, 2) isooctane, 3) 1,3-diisopropylbenzene, and 4) toluene.
Biphasic calorimetry experiments were attempted with Eu nitrate extraction by HEH[EHP], however heats were too low for reproducible results without introducing too much extractant (1.0 M) or complicating the extraction by adding pH 4 acetate buffer to the system. The extractant was therefore changed back to HDEHP in order to increase observed heats while maintaining extraction conditions similar to those implemented by Zalupski. This was ideal because HDEHP and HEH[EHP] behave similarly in extraction of rare earths and actinides; so observed trends should be almost identical with HDEHP producing larger exothermic heats per addition since it is the stronger extractant. Shown in Figure 2.2 are the heats of extraction for a select number of rare earth elements, La, Eu, Tb, and Yb. The La enthalpies were surprisingly close to Eu. Unfortunately La suffered from little to no heat once the diluent was changed to aromatic diluents, toluene and 1, 3-diisopropylbenzene. Since La was impossible to measure in aromatic diluents, Tb was chosen to complete a lanthanide trend since it was previously used to test the method with HDEHP. The strength of the metal-extractant interaction increases down the series, a trend generally observed with extractants as the heavier lanthanides increase in Lewis acidity. Further experiments are planned for Eu and Tb to fill out Figure 2.2. Solvent extraction experiments to measure Kex of metal partitioning under these conditions will be conducted in order to calculate the entropy of extraction.
The impact of diluents on the partitioning of lanthanides by HDEHP or HEH[EHP] is not solely limited to the bulk phase. Since these extractants have a hydrophilic head and lipophilic tail, they are interfacially active species, making them effective surfactants, allowing them to spontaneously arrange at the interfacial boundary between aqueous and organic phases. Changes in the interfacial behavior of these organophosphorus extractants has been previously characterized.5 The agreement between authors on HEH[EHP] behavior, however, is poor and it has not been as extensively characterized as HDEHP.
Interfacial tension studies using the Du Noüy ring method indicated changes in the number of molecules adsorbed to the interface, the average area one molecule occupies, and the propensity the molecule has for adsorption to the surface in each diluent. Shown below in Figure 2.3 are results describing a typical experiment probing the interfacial behavior of HEH[EHP] at the interface in toluene. At very low concentrations of ligand there is little to no change in the surface tension between toluene and water. Once

DE-NE0000674 – Final report
32 of 49
there is enough HEH[EHP] at the interface the surface tension begins to decrease exponentially until saturation is achieved.
10-8 10-7 10-6 10-5 10-4 10-3 10-2 10-1 100
5
10
15
20
25
30
35
Inte
rfac
ial T
ensi
on (
mN
/m)
Log [HEHEHP] (M)
Figure 2.3. Interfacial tension measured between toluene and degassed, deionized water with increasing ligand concentration
Included below in Table 2 are the maximum surface concentration of HEH[EHP] at the interface (Γ), the minimum statistical area of an adsorbed molecule (Amin), and the free energy of adsorption (Gads). In dodecane HEH[EHP] has a lower surface concentration than either toluene or xylenes while exhibiting a larger surface area per molecule. This is likely due to the 2-ethylhexyl tails of the molecule branching outwards to interact with the aliphatic diluent; allowing fewer HEH[EHP] molecules access to the interfacial region. The tails in the aromatic diluents are likely forced vertically away from the interface since pi-electron cloud stacking are favorable at the interface. This allows more extractant molecules to have access to the interface increasing the surface excess. More experiments are necessary in order to completely characterize HEH[EHP]’s behavior at the interface. Future experiments include adding phase modifiers like TBP, octanol, cyclohexanone, and cyclohexanol in order to determine the types of interactions between competing surfactants.
Table 2. The maximum surface concentration of HEH[EHP] at the interface (Γ), the minimum statistical area of an adsorbed molecule (Amin), and the free energy of adsorption (Gads) for several diluents in contact with water at 20 °C.
Diluent Γ E+6 (mol/sq m) -Gads Amin
Dodecane 0.99 ± 0.07 34.49 ± 1.40 1.68± 0.12
Toluene 1.84 ± 0.16 17.50 ± 0.87 0.90 ± 0.08
Xylenes 2.08± 0.23 16.81± 1.05 0.80± 0.09

DE-NE0000674 – Final report
33 of 49
References
(1) Dyrssen, D.; Hay, L. Acta Chem. Scand. 1960, 14, 1100–1111. (2) Ferraro, J. R.; Mason, G. W.; Peppard, D. F. J. Inorg. Nucl. Chem. 1969, 22, 285. (3) Peppard, D. F.; Mason, G. W.; Griffin, G. J. Inorg. Nucl. Chem. 1965, 27, 1683. (4) Zalupski, P. R.; Nash, K. L. Solvent Extr. Ion Exch. 2008, 26 (5), 514–533. (5) Prochaska, K. Adv. Colloid Interface Sci. 2002, 95 (1), 51–72. (6) Guo-Xin, S.; Yu, C.; Si-Xiu, S.; Yong-Hui, Y.; Yan-Zhao, Y. Solvent Extraction and Ion Exchange.
2000, pp 517–531.
Section 3. Additional insights into the effect of octanol/octanol on the extraction by HEH[EHP] and HDEHP
Solvent extraction processes are often accompanied with other organic species into the organic diluent beside the extractant themselves. The modifier is added to alter the solvating properties of the organic diluent, preventing the formation of a third phase when the metal concentration extracted into the organic diluent exceeds a certain value. Third phases are, in general, a separate heavier organic phase that contains an enhanced concentration of extractant and metal ion aggregates. Third phase formation must be avoided due to its unpredictable physical properties and in fissile material separations, to minimize the risk of accidental criticality events. The precise role of a phase modifier in altering third phase formation characteristics of the organic phase has not been well characterized for TALSPEAK-like processes. However, it has been described as being due to increasing diluent polarity. One of the main phase modifier types that have been used for decades is the aliphatic alcohols such as 1-octanol, 1-dodecanol, etc.
This portion of the study targeted understanding the impact of the concentration of 1-octanol in n-octane on simple extraction equilibrium. Following the M:L ratio found by DOSY-NMR (3 ligands strongly attached per metal) along with basic charge balance between the acidic organophosphorus extractant and the aqueous phase during the extraction (3 protons released into the aqueous phase per trivalent lanthanide), the extraction equilibria equations between trivalent metals (M) and an acidic organophosphorus extractant (HA) can be written as:
32
⇋ . 3
D .
K DH
HA
log log D logH
HA
Where 3 2⁄ is the slope of a ligand dependence analysis and x is the number of protonated ligands (HA) aggregated around the MA3 metal ligand complex ( 2 3 . The europium extracting properties of HEH[EHP] in octane for differing concentrations of ligand and differing percentages of octanol in octane are compared in this section of the report. First, the extraction of europium without octanol was investigated to create a “background” for the subsequent studies in the presence of 1-octanol. For comparison, the more acidic phosphoric analogous HDEHP has been studied in the same conditions.

DE-NE0000674 – Final report
34 of 49
0.1
1E-4
1E-3
0.01
0.1
1
10
100
1000
concentration of1-octanol in n-octane
0 mmol.L-1 63 mmol.L-1 250 mmol.L-1 950 mmol.L-1
DE
u
[HEH[EHP]] (mol.L-1)
Figure 3.1.Selected example of ligand dependences slope analysis with different amount of 1-octanol in n-octane demonstrating the impact of the 1-octanol concentration on the slopes and efficiency of the extractions at pH=2 , RT and μ=1 mol.L-1.
0.0 0.5 1.0 1.5 2.00.0
0.5
1.0
1.5
2.0
2.5
3.0
3.5
4.0
4.5
5.0
5.5
6.0
HEH[EHP] HDEHP
Slo
pe (
ligan
d de
p)
1-octanol in octane (mol.L-1)
Figure 3.2. Slope obtained for a extractant dependence slope analysis of extraction of europium by HEH[EHP] (black square) and HDEHP (red circles) from nitric acid at pH=2 , RT and μ=1 mol.L-1.

DE-NE0000674 – Final report
35 of 49
0.0 0.5 1.0 1.5 2.0
-4
-3
-2
-1
0
HEH[EHP] HDEHP
log(
Kex
)
1-octanol in octane (mol.L-1)
Figure 3.3. Calculated log Kex in function of the concentration of 1-octanol in n-octane for HEH[EHP] (black square) and HDEHP (red circles) at pH=2 , RT and μ=1 mol.L-1.
Results shown in Figure 3.1 and Figure 3.2 demonstrate that the number of protonated extractant molecules in the final complex is a fractional x=1.5 if HEH[EHP] or HDEHP is dissolved in n-octane in absence of 1-octanol, so a mix between EuA3.HA1 and EuA3.HA2 with a K1.2 of 1.
. ∙∙
Increasing the concentration of 1-octanol in octane increases the number of protonated extractants in the final complex. Below 0.5 mol.L-1 for HEH[EHP] and 1 mol.L-1 for HDEHP, the number of HA increased up to 6 for HEH[EHP] and 5 for HDEHP. With increased concentrations, the number of HA decrease to 4 for both extractants. However, the evolution of the log Kex values are constantly decreasing while increasing the concentration of 1-octanol in n-octane, with Kex of HEH[EHP] around 50-100 times lower than HDEHP, whatever the 1-octanol concentration. Figure 3.2 shows that the 1-octanol has a solvation effect on the number of HA aggregated on the extracted metal, and the Figure 3.3 show that the 1-octanol concentration has a pseudo linear negative effect on the Kex itself. Figure 3.4, Figure 3.6, and Figure 3.6 show the results from Eu extraction slopes analysis with a HEH[EHP] concentration dependence while keeping the [1-octanol]/[HEH[EHP]] ratio constant for each individual slope analysis. Those results show solid slopes of two when 1-octanol is present and are proportional to the extractant concentration. Also it is interesting to note that the Kex constantly decreases when the concentration of 1-octanol increases, which is similar to the results presented in Figure 3.3 (increasing the amount of 1-octanol decreases the Kex).
To study a potential hydrogen bonding from 1-octanol to HEH[EHP] that could act as a “parasite” to the extraction process, the DEu for the iso-polar equivalent of 1-octanol without the OH group, 1-octanal, has been investigated to identify the effect of this OH group. Figure3.7 shows that the DEu presents the same behavior with 1-octanal that with 1-octanol, showing that the source of the decreasing of extraction capacity of HEH[EHP] and HDEHP in function of the polar phase modifier is due to a polarity effect and not to extra equilibria between the ligand and the phase modifier.
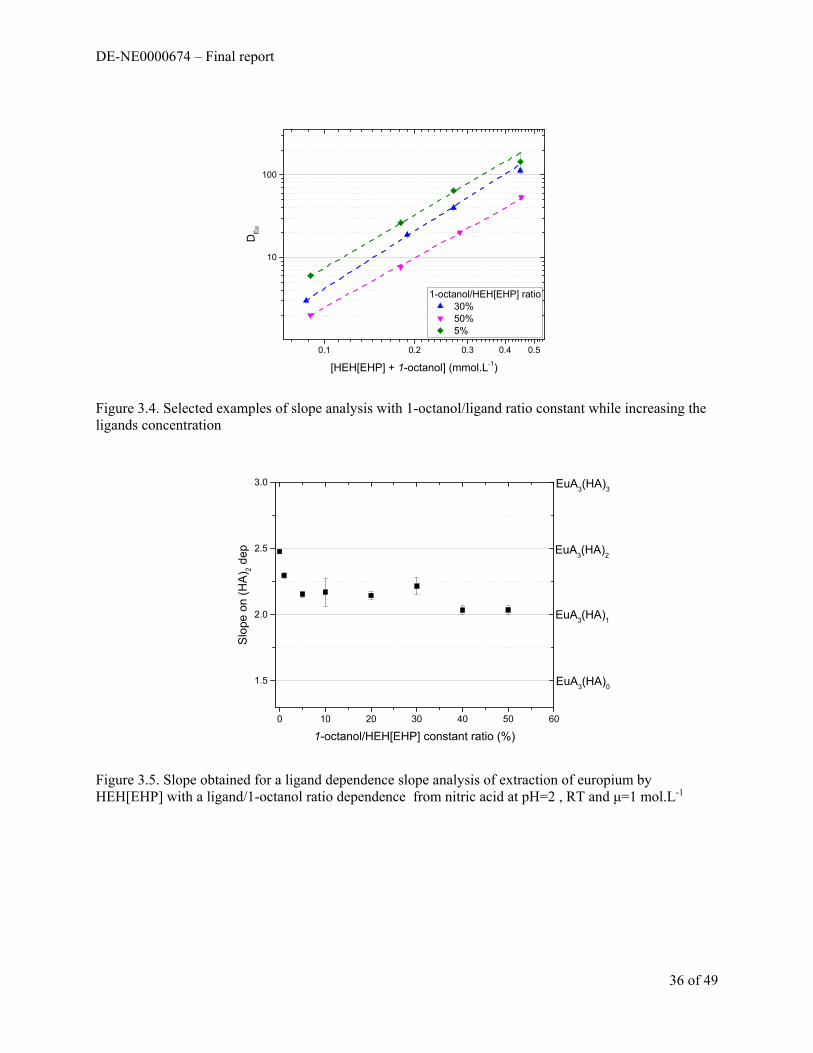
DE-NE0000674 – Final report
36 of 49
0.1 0.2 0.3 0.4 0.5
10
100
1-octanol/HEH[EHP] ratio 30% 50% 5%
DE
u
[HEH[EHP] + 1-octanol] (mmol.L-1)
Figure 3.4. Selected examples of slope analysis with 1-octanol/ligand ratio constant while increasing the ligands concentration
0 10 20 30 40 50 60
1.5
2.0
2.5
3.0
EuA3(HA)
0
EuA3(HA)
1
EuA3(HA)
2
Slo
pe
on (
HA
) 2 d
ep
1-octanol/HEH[EHP] constant ratio (%)
EuA3(HA)
3
Figure 3.5. Slope obtained for a ligand dependence slope analysis of extraction of europium by HEH[EHP] with a ligand/1-octanol ratio dependence from nitric acid at pH=2 , RT and μ=1 mol.L-1

DE-NE0000674 – Final report
37 of 49
0 10 20 30 40 50-4.2
-4.0
-3.8
-3.6
-3.4
-3.2
-3.0
-2.8
-2.6
-2.4
-2.2
log
Ke
x
1-octanol/HEH[EHP] constant ratio (%)
Figure 3.6. Calculated log Kex in function of a ligand/1-octanol ratio dependence at pH=2 , RT and μ=1 mol.L-1.
0.000 0.002 0.004 0.006 0.008 0.010 0.012 0.014
0
20
40
60
80
100
120
DE
u
[1-Octanal] mol.L-1
Figure3.7. DEu values for europium extraction at [HEH[EHP]] = 200 mmol.L-1 in function of 1-octanal at pH=2 , RT and μ=1 mol.L-1.
Section 4. Probing Molecular Interactions in the Organic Phase of TALSPEAK-like Systems Using NMR Spectroscopy
In this section, the results of an investigation of the effect of diluent properties and the presence of phase modifiers on extractant exchange dynamics in solvent-extraction media are reported. Nuclear Magnetic Resonance (NMR) spectroscopy is recognized as a technique that can provide useful insights into ligand exchange reaction dynamics in the apolar organic phase.1 The results of a study of the ligand exchange rate

DE-NE0000674 – Final report
38 of 49
and mechanism for (2-ethylhexyl) phosphonic acid mono (2-ethylhexyl) ester (HEH[EHP]) interactions with lanthanide ions in an aromatic diluent are reported. The study begins with a comparison of the phosphonic acid system with previously reported data for di-2-ethylhexylphosphoric acid (HDEHP). Through collection of NMR spectra as a function of temperature, exchange rate constants and activation parameters for ligand-exchange reactions can be calculated. Varying the concentration of free HEH[EHP] in the reaction aids in the definition of the rate law. Additional changes in the organic phase, such as varying apolar diluents and increasing the polarity, can further increase our knowledge of the nature of HEH[EHP] exchange dynamics and possible changes in complex lability with lanthanide ions. NMR spectroscopy, coupled with the above approach of varying several parameters, is used in this work to enhance insights into the mechanism of HEH[EHP] exchange on lanthanide centers.
The initial characterization of the organic phases was to determine the water content – both before and after contact with an aqueous phase of 8.5 mmol L-1 La(NO3)3, 8.5 mmol L-1 Sm(NO3)3 or no metal in 0.1 mol L-1 acetate buffer, pH 4 (Table 2.6). Only water content of HEH[EHP] in n-octane or 1,3-dipb was studied with metal. Since there was no appreciable increase in water content when the metal was present in the aqueous phase, the other diluents (n-dodecane, isooctane, toluene and TCE) were contacted with an aqueous phase containing no metal. There was an increase in water content after extraction in the diluents with the most aromatic character, 1,3-dipb and toluene. However, based on the trends observed in the exchange rate constants and activation parameters presented in this section, it was determined that water was not influencing the HEH[EHP] exchange on the metal complexes.
Table 2.6. Determination of water content (mmol L-1) of a 0.1 mol L-1 HEH[EHP] organic phase in different diluents before and after contact with an aqueous phase of 0.1 mol L-1 acetate buffer, pH 4 with or without metal (8.5 mmol L-1 La3+, Sm3+, or Lu3+).
Organic Phase Aqueous Phase [H2O]before mmol L-1
[H2O]after mmol L-1
n-dodecane no metal 3.0 ± 0.2 3.9 ± 0.1
n-octane La3+
2.7 ± 0.1 3.8 ± 0.1
Sm3+ 1.9 ± 0.1 no metal 5.6 ± 0.4
isooctane no metal 2.8 ± 0.2 2.9 ± 0.1
1,3-dipb
La3+
4.7 ± 0.1
14.4 ± 0.3 Sm3+ 10.6 ± 0.4 Lu3+ 10.9 ± 1.7
no metal 11.4 ± 0.2 toluene no metal 7.4 ± 0.4 20.1 ± 1.7
TCE no metal 3.9 ± 0.2 7.4 ± 0.5
Variable temperature NMR spectra were collected for 0.1 mol L-1 HEH[EHP] in equilibrium with La3+ with about 50% of HEH[EHP] free (Figure 4.1). CBS analyses were completed on the experimental results to determine the exchange rate constants and apply the Eyring law to determine activation parameters (Figure 4.2). Switching between apolar diluents in the La3+- HEH[EHP] system has very little effect on the exchange rate constant – all parameters overlap at the ±2σ uncertainty level (Table 4.1). There may be a statistically significant shift in the activation parameters; an increase in ΔH‡ and increasingly negative ΔS‡
is seen as the diluents become more aromatic in nature, though the effect is not dramatic.

DE-NE0000674 – Final report
39 of 49
Figure 4.1. Representative variable temperature 31P NMR experimental (solid grey traces) and CBS calculated (colored dotted traces) spectra of 0.1 mol L-1 HEH[EHP] in equilibrium with La3+ in n-octane (A), isooctane (B), 1,3-dipb (C) or toluene (D).
Figure 4.2. Eyring plots for determination of the exchange rate constants and activation parameters for HEH[EHP] exchange on La(EH[EHP]∙HEH[EHP])3 complexes in n-octane (■), isooctane (●), 1,3-dipb (▲) or toluene (▼).

DE-NE0000674 – Final report
40 of 49
Table 4.1. Exchange rate constants and activation parameters for 0.1 mol L-1 HEH[EHP] exchange on La(AHA)3 complexes at 25°C in the different diluents studied. Diluent [HEH[EHP]]free
mmol L-1 kex s-1
H‡ kJ mol-1
S‡ J mol-1 K-1
M:L stoichiometry
n-octane 50.5 ± 0.1 1.80 (± 0.13) x 104 27.9 ± 2.3 -70 ± 9 1:6.9 (± 0.6) isooctane 51.9 ± 0.2 1.69 (± 0.15) x 104 30.2 ± 2.6 -63 ± 10 1:6.9 (± 0.6) 1,3-dipb 48.5 ± 0.3 1.63 (± 0.09) x 104 31.8 ± 1.7 -58 ± 6 1:6.5 (± 0.3) toluene 49.4 ± 0.2 1.58 (± 0.07) x 104 33.9 ± 1.2 -51 ± 5 1:6.1 (± 0.2) Quoted errors for exchange rate constants and activation parameters correspond to standard deviations obtained from the linear regression fit of experimental data to the Eyring plot.
Similar variable temperature NMR experiments were done with HEH[EHP] in equilibrium with Sm3+ in different diluents at about 50-60% free HEH[EHP] (Figures 4.3 and 4.4). For HEH[EHP] exchange on Sm(AHA)3 complexes, there is very little change observed in the exchange rate constant between the aliphatic diluents, or the diluents with some aliphatic character (n-octane, n-dodecane, isooctane, and 1,3-dipb, Table 4.2). However, for toluene and TCE, the two diluents studied that are structurally least similar to the extractant molecule, the exchange rate constants are three to six times slower. This difference suggests that the similarity between the structure of the diluent and the extractant molecule might have an effect of the exchange rate. This change in the exchange rate constant for the diluents, suggests a diluent effect. It’s possible that these diluents cause a second sphere solvation around the complex. Furthermore, the fact that the exchange rate is slower in toluene and TCE supports the hypothesis of a monomer of the HEH[EHP] dimer exchanging on the complex, as follows. The aromatic diluent and diluent with bulky chlorine atoms are least like the HEH[EHP] molecule which could make it more difficult for the molecule to move through the solution. The Hildebrand solubility parameter for toluene is about 18.4, for n-dodecane it is 16.0. The higher value for toluene suggest that toluene is more solvating than n-dodecane and further supports the hypothesis that toluene, and perhaps TCE, interact more with the bulky chains on the HEH[EHP] molecule.

DE-NE0000674 – Final report
41 of 49
Figure 2.14. Representative variable temperature 31P NMR experimental (solid grey traces) and CBS calculated (colored dotted traces) spectra of 0.1 mol L-1 HEH[EHP] in equilibrium with Sm3+ in n-octane (A), isooctane (B), 1,3-dipb (C), toluene (D), n-dodecane (E) or TCE (F).
Figure 2.15. Eyring plots for determination of rate constants and activation parameters for HEH[EHP] exchange on Sm(EH[EHP]∙HEH[EHP])3 complexes in n-octane (■), isooctane (●), 1,3-dipb (▲), toluene (▼), n-dodecane (♦) or TCE (◄).
Table 4.2. Exchange rate constants and activation parameters for 0.1 mol L-1 HEH[EHP] exchange on Sm(AHA)3 complexes at 25°C in the different diluents studied. Diluent [HEH[EHP]]free
mmol L-1 kex s-1
H‡ kJ mol-1
S‡ J mol-1 K-1
M:L stoichiometry
n-octane 56.5 ± 0.2 1.71 (± 0.15) x 103 16.8 ± 0.7 -127 ± 2 1:5.0 (± 0.3) isooctane 50.0 ± 0.1 1.59 (± 0.26) x 103 14.6 ± 1.3 -135 ± 4 1:6.0 (± 0.2) 1,3-dipb 54.5 ± 0.3 1.22 (± 0.08) x 103 11.1 ± 0.5 -149 ± 2 1:6.4 (± 0.3) n-dodecane 50.5 ± 0.1 1.12 (± 0.14) x 103 17.7 ± 0.9 -127 ± 3 1:6.1 (± 0.2) toluene 52.7 ± 0.3 5.50 (± 0.50) x 102 15.6 ± 0.8 -139 ± 2 1:7.0 (± 0.3) TCE 58.6 ± 0.2 3.22 (± 0.16) x 102 22.0 ± 1.8 -123 ± 6 1:6.1 (± 0.1) Quoted errors for exchange rate constants and activation parameters correspond to standard deviations obtained from the linear regression fit of experimental data to the Eyring plot.
Interestingly, the activation parameters for HEH[EHP] exchange on Sm(AHA)3 complexes are similar for all of the diluents, all suggesting the mechanism of exchange proceeding via an associative reaction. The stronger interactions between the O-donor ligands of the HEH[EHP] molecule and Sm3+ cause the Sm(AHA)3 complexes to be less labile than the La(AHA)3 complexes and, therefore, the mechanism of exchange would be altered with greater difficulty as the organic environment is shifted.
To investigate the role of octanol First of all, room temperature 31P NMR spectra were collected or 0.1 mol L-1 HEH[EHP] in equilibrium with La3+, Sm3+, and Lu3+ in a series of diluents containing increasing concentrations of 1-octanol, from 2-10%, in n-octane (Figure 4.5). A qualitative look at 0.1 mol L-1 HEH[EHP] in equilibrium with La3+ in such media, is characterized by a single broad peak indicating fast exchange in n-octane that becomes significantly sharper as the 1-octanol concentration increases, which is consistent with very fast HEH[EHP] exchange on La3+ in 10% 1-octanol, n-octane (Figure 4.5A). This

DE-NE0000674 – Final report
42 of 49
increase in exchange rate is more evident in the 0.1 mol L-1 HEH[EHP] in equilibrium with Sm3+ (Figure 4.5B). The top spectrum is the system in equilibrium in n-octane and shows two not completely resolved peaks representing the slower exchange on Sm3+. As the concentration of 1-octanol increases in the system, these peaks begin to coalesce at room temperature, until at 10% octanol there is one broad peak representing the fast exchange between HEH[EHP] in the bulk phase and the metal coordinated HEH[EHP]. This increase in room temperature ligand exchange could make it possible to study exchange dynamics for the heavier lanthanides, like Lu3+. When 0.1 mol L-1 HEH[EHP] is in equilibrium with Lu3+, there appears to be an increase in exchange rate as well, with the free HEH[EHP] peak becoming more broad with the addition of 1-octanol (Figure 4.5 C), FWHM is 66 Hz at 0% 1-octanol versus 125 Hz at 10% 1-octanol). Based on the room temperature data, a solvent mixture of n-octane with up to 10% 1-octanol causes the ligand exchange reaction to speed up at room temperature.
Figure 4.5. 31P NMR spectra of 0.1 mol L-1 HEH[EHP] in varying concentrations of 1-octanol, n-octane in at 22°C after equilibration with La3+ (A), Sm3+ (B) or Lu3+ (C). This more polar system can be investigated using variable temperature NMR in the Sm:HEH[EHP] system. The increased exchange rate could be difficult to investigate in the La:HEH[EHP] because the slow exchange regime of the La:HEH[EHP] was already close to the freezing point of n-octane. To this end, Sm3+ was extracted by 0.1 mol L-1 HEH[EHP] in 2% 1-octanol, n-octane. Variable temperature NMR spectra were collected between -30°C and 30°C to perform CBS analysis. After determination of the kex values at the various temperatures, the Eyring law was applied to determine the activation parameters of the system (Figure 4.6 and Table 4.3). The concentration of free HEH[EHP] was also slightly varied to understand whether there is any change of the mechanism of exchange as the free extractant concentration increases.
A comparison of HEH[EHP] exchange on Sm3+ in 2% 1-octanol, n-octane versus 100% n-octane shows that the exchange rate constant increases by almost factor of three (from about 1.5 (± 0.2) x 103 s-1 in n-octane to about 4.0 (± 0.4) x 103 s-1) in 2% 1-octanol, n-octane (Figure 4.7, Table 4.3). This increase in the exchange rate constant supports the hypothesis that as the diluent becomes more polar (like the extractant molecule), the exchange rate increases. As the free HEH[EHP] concentrations changes in the 1-octanol system, the exchange rate constants remain similar. In contrast, for the n-octane only system, the exchange rate constant increases as the concentration of free ligand increases. Interestingly, the activation parameters remain similar between the two systems; ΔH‡ = 16.2 ± 0.4 kJ mol-1, ΔS‡ -122 ± 2 J mol-1 K-1 for 2% 1-octanol, n-octane and ΔH‡ = 16.9 ± 0.6 kJ mol-1, ΔS‡ = -127 ± 2 J mol-1 K-1 for n-octane. A concept that is likely for this system would be that the 1-octanol could coordinate to an intermediate to increase the exchange rate.
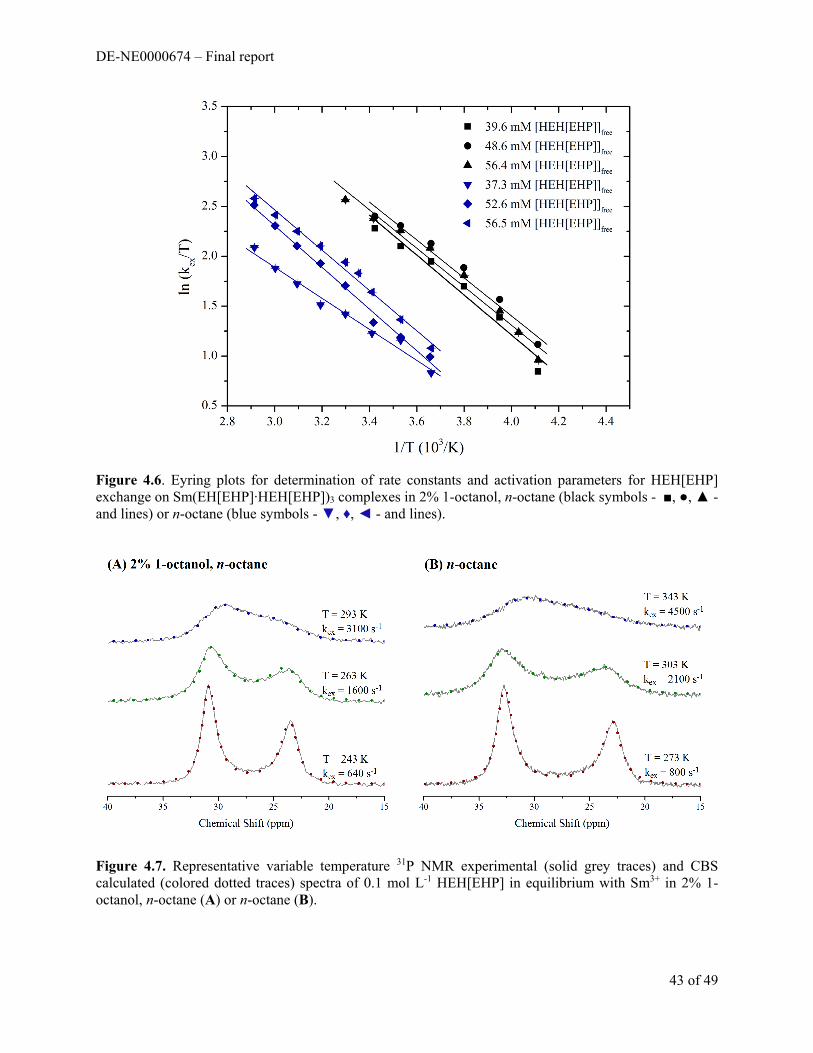
DE-NE0000674 – Final report
43 of 49
Figure 4.6. Eyring plots for determination of rate constants and activation parameters for HEH[EHP] exchange on Sm(EH[EHP]∙HEH[EHP])3 complexes in 2% 1-octanol, n-octane (black symbols - ■, ●, ▲ - and lines) or n-octane (blue symbols - ▼, ♦, ◄ - and lines).
Figure 4.7. Representative variable temperature 31P NMR experimental (solid grey traces) and CBS calculated (colored dotted traces) spectra of 0.1 mol L-1 HEH[EHP] in equilibrium with Sm3+ in 2% 1-octanol, n-octane (A) or n-octane (B).
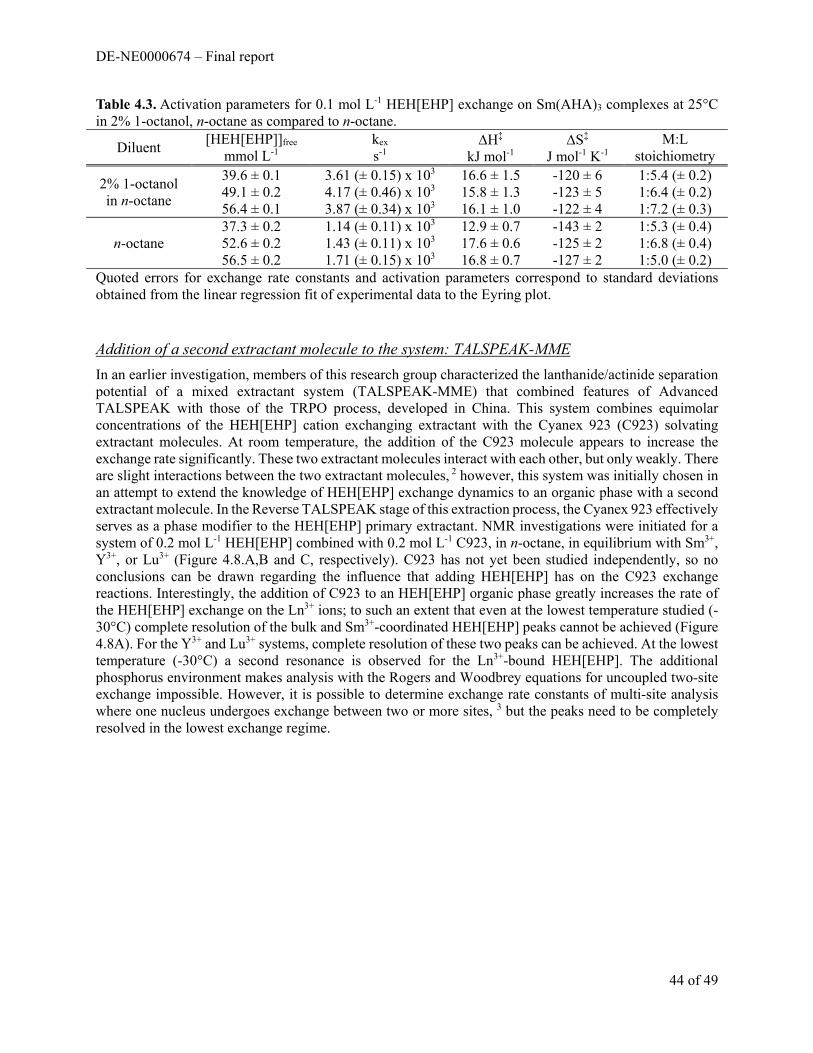
DE-NE0000674 – Final report
44 of 49
Table 4.3. Activation parameters for 0.1 mol L-1 HEH[EHP] exchange on Sm(AHA)3 complexes at 25°C in 2% 1-octanol, n-octane as compared to n-octane.
Diluent [HEH[EHP]]free
mmol L-1 kex s-1
H‡ kJ mol-1
S‡ J mol-1 K-1
M:L stoichiometry
2% 1-octanol in n-octane
39.6 ± 0.1 3.61 (± 0.15) x 103 16.6 ± 1.5 -120 ± 6 1:5.4 (± 0.2) 49.1 ± 0.2 4.17 (± 0.46) x 103 15.8 ± 1.3 -123 ± 5 1:6.4 (± 0.2) 56.4 ± 0.1 3.87 (± 0.34) x 103 16.1 ± 1.0 -122 ± 4 1:7.2 (± 0.3)
n-octane 37.3 ± 0.2 1.14 (± 0.11) x 103 12.9 ± 0.7 -143 ± 2 1:5.3 (± 0.4) 52.6 ± 0.2 1.43 (± 0.11) x 103 17.6 ± 0.6 -125 ± 2 1:6.8 (± 0.4) 56.5 ± 0.2 1.71 (± 0.15) x 103 16.8 ± 0.7 -127 ± 2 1:5.0 (± 0.2)
Quoted errors for exchange rate constants and activation parameters correspond to standard deviations obtained from the linear regression fit of experimental data to the Eyring plot.
Addition of a second extractant molecule to the system: TALSPEAK-MME
In an earlier investigation, members of this research group characterized the lanthanide/actinide separation potential of a mixed extractant system (TALSPEAK-MME) that combined features of Advanced TALSPEAK with those of the TRPO process, developed in China. This system combines equimolar concentrations of the HEH[EHP] cation exchanging extractant with the Cyanex 923 (C923) solvating extractant molecules. At room temperature, the addition of the C923 molecule appears to increase the exchange rate significantly. These two extractant molecules interact with each other, but only weakly. There are slight interactions between the two extractant molecules, 2 however, this system was initially chosen in an attempt to extend the knowledge of HEH[EHP] exchange dynamics to an organic phase with a second extractant molecule. In the Reverse TALSPEAK stage of this extraction process, the Cyanex 923 effectively serves as a phase modifier to the HEH[EHP] primary extractant. NMR investigations were initiated for a system of 0.2 mol L-1 HEH[EHP] combined with 0.2 mol L-1 C923, in n-octane, in equilibrium with Sm3+, Y3+, or Lu3+ (Figure 4.8.A,B and C, respectively). C923 has not yet been studied independently, so no conclusions can be drawn regarding the influence that adding HEH[EHP] has on the C923 exchange reactions. Interestingly, the addition of C923 to an HEH[EHP] organic phase greatly increases the rate of the HEH[EHP] exchange on the Ln3+ ions; to such an extent that even at the lowest temperature studied (-30°C) complete resolution of the bulk and Sm3+-coordinated HEH[EHP] peaks cannot be achieved (Figure 4.8A). For the Y3+ and Lu3+ systems, complete resolution of these two peaks can be achieved. At the lowest temperature (-30°C) a second resonance is observed for the Ln3+-bound HEH[EHP]. The additional phosphorus environment makes analysis with the Rogers and Woodbrey equations for uncoupled two-site exchange impossible. However, it is possible to determine exchange rate constants of multi-site analysis where one nucleus undergoes exchange between two or more sites, 3 but the peaks need to be completely resolved in the lowest exchange regime.
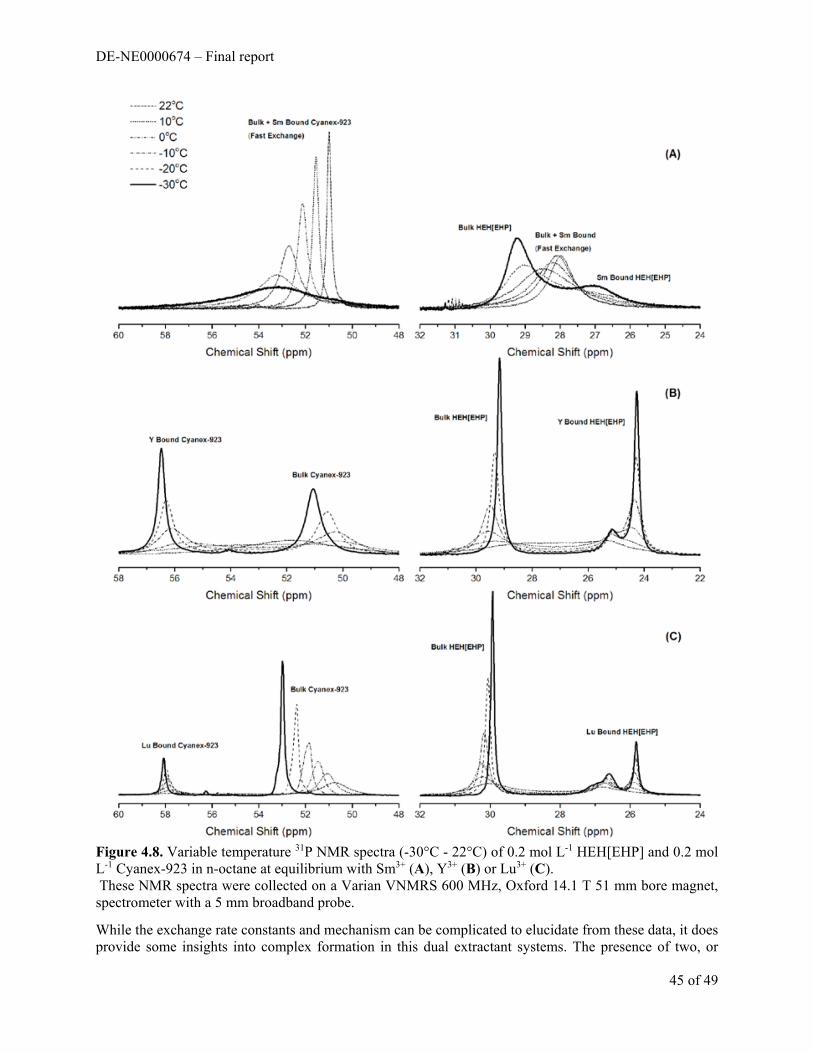
DE-NE0000674 – Final report
45 of 49
Figure 4.8. Variable temperature 31P NMR spectra (-30°C - 22°C) of 0.2 mol L-1 HEH[EHP] and 0.2 mol L-1 Cyanex-923 in n-octane at equilibrium with Sm3+ (A), Y3+ (B) or Lu3+ (C). These NMR spectra were collected on a Varian VNMRS 600 MHz, Oxford 14.1 T 51 mm bore magnet, spectrometer with a 5 mm broadband probe.
While the exchange rate constants and mechanism can be complicated to elucidate from these data, it does provide some insights into complex formation in this dual extractant systems. The presence of two, or
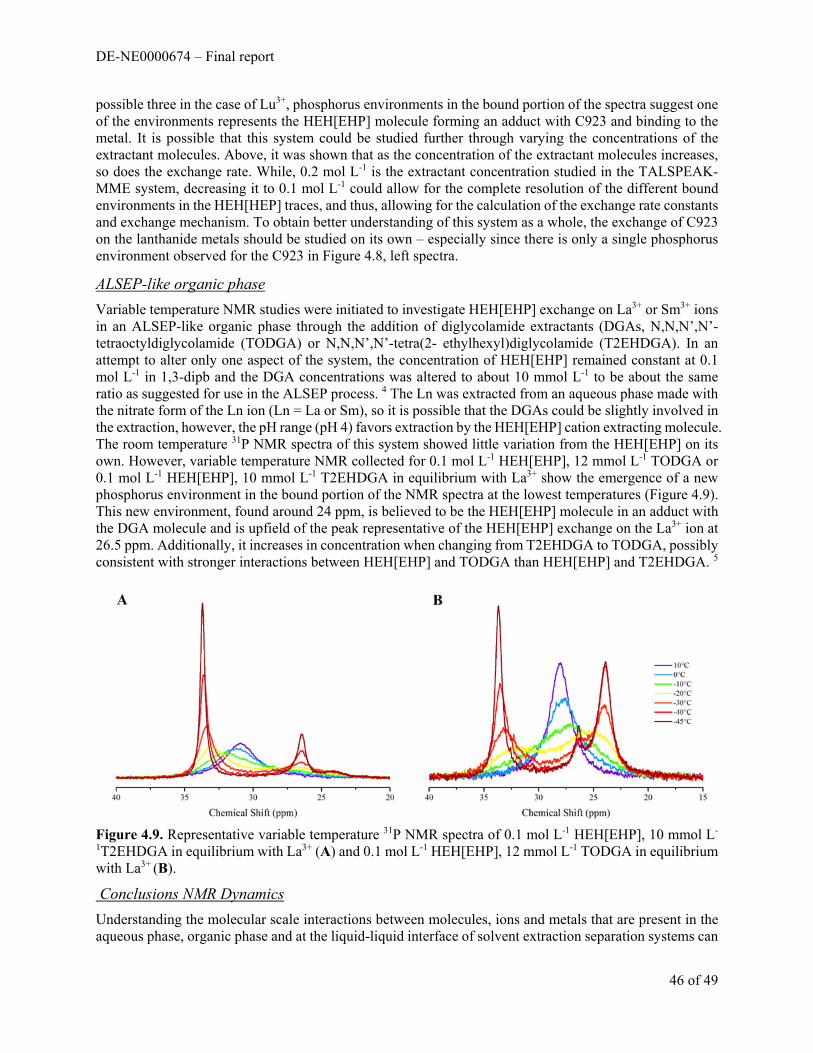
DE-NE0000674 – Final report
46 of 49
possible three in the case of Lu3+, phosphorus environments in the bound portion of the spectra suggest one of the environments represents the HEH[EHP] molecule forming an adduct with C923 and binding to the metal. It is possible that this system could be studied further through varying the concentrations of the extractant molecules. Above, it was shown that as the concentration of the extractant molecules increases, so does the exchange rate. While, 0.2 mol L-1 is the extractant concentration studied in the TALSPEAK-MME system, decreasing it to 0.1 mol L-1 could allow for the complete resolution of the different bound environments in the HEH[HEP] traces, and thus, allowing for the calculation of the exchange rate constants and exchange mechanism. To obtain better understanding of this system as a whole, the exchange of C923 on the lanthanide metals should be studied on its own – especially since there is only a single phosphorus environment observed for the C923 in Figure 4.8, left spectra.
ALSEP-like organic phase
Variable temperature NMR studies were initiated to investigate HEH[EHP] exchange on La3+ or Sm3+ ions in an ALSEP-like organic phase through the addition of diglycolamide extractants (DGAs, N,N,N’,N’-tetraoctyldiglycolamide (TODGA) or N,N,N’,N’-tetra(2- ethylhexyl)diglycolamide (T2EHDGA). In an attempt to alter only one aspect of the system, the concentration of HEH[EHP] remained constant at 0.1 mol L-1 in 1,3-dipb and the DGA concentrations was altered to about 10 mmol L-1 to be about the same ratio as suggested for use in the ALSEP process. 4 The Ln was extracted from an aqueous phase made with the nitrate form of the Ln ion (Ln = La or Sm), so it is possible that the DGAs could be slightly involved in the extraction, however, the pH range (pH 4) favors extraction by the HEH[EHP] cation extracting molecule. The room temperature 31P NMR spectra of this system showed little variation from the HEH[EHP] on its own. However, variable temperature NMR collected for 0.1 mol L-1 HEH[EHP], 12 mmol L-1 TODGA or 0.1 mol L-1 HEH[EHP], 10 mmol L-1 T2EHDGA in equilibrium with La3+ show the emergence of a new phosphorus environment in the bound portion of the NMR spectra at the lowest temperatures (Figure 4.9). This new environment, found around 24 ppm, is believed to be the HEH[EHP] molecule in an adduct with the DGA molecule and is upfield of the peak representative of the HEH[EHP] exchange on the La3+ ion at 26.5 ppm. Additionally, it increases in concentration when changing from T2EHDGA to TODGA, possibly consistent with stronger interactions between HEH[EHP] and TODGA than HEH[EHP] and T2EHDGA. 5
Figure 4.9. Representative variable temperature 31P NMR spectra of 0.1 mol L-1 HEH[EHP], 10 mmol L-
1T2EHDGA in equilibrium with La3+ (A) and 0.1 mol L-1 HEH[EHP], 12 mmol L-1 TODGA in equilibrium with La3+ (B).
Conclusions NMR Dynamics
Understanding the molecular scale interactions between molecules, ions and metals that are present in the aqueous phase, organic phase and at the liquid-liquid interface of solvent extraction separation systems can

DE-NE0000674 – Final report
47 of 49
drive continued development and refinement of such extraction processes. Investigations into solvent extraction kinetics and complex formation in the two phases can offer fresh insights into the overall mechanism for extraction. Nuclear magnetic resonance (NMR) spectroscopy has been recognized as a technique that provides useful insights into ligand exchange dynamics in the apolar organic phase in solvent extraction separations through enhanced understanding of molecular interactions.1
Surprisingly, NMR spectroscopy has rarely been applied to study ligand exchange reactions of solvent extraction systems, especially in the case of cation exchangers. 6-9 Yet, 31P NMR studies offer the potential for improving the understanding of the interactions of important organophosphorus extractant molecules with cations in an apolar organic phase. The properties of the 31P nucleus, including the 100% abundance of this isotope with spin ½, qualifies organophosphorus extractants as attractive probes of metal-ligand exchange dynamics in several important solvent extraction systems. Development of more sophisticated analytical procedures, along with improved instrumentation, offers the promise of additional method development and increased understanding of the fundamental interactions that drive, or limit, metal complexation reactions of importance in solvent extraction-based separations. This project investigated the nature of complex interactions in the organic phase of solvent extraction systems— predominantly through the application of NMR spectrometry. A parallel goal of this dissertation is to continue to develop NMR spectroscopy as an important tool for understanding the complex ligand exchange dynamics involved in An3+ and Ln3+ partitioning. Towards this end, an in depth analysis of HEH[EHP] ligand exchange dynamics was devised, and, where applicable, results were compared to the more acidic phosphoric acid extractant, HDEHP.
This investigation began by observing the chemical shifts of complexation of HDEHP and HEH[EHP] with each of the lanthanides, using room temperature 31P NMR spectra. In general, the qualitative rate of ligand exchange decreases at room temperature as the cation radius decreases – fast exchange of ligands onto a La3+ is observed by the single, broad peak and Lu3+ is seen to be substitution inert by the two sharp peaks representing free and metal-coordinated ligand. For the paramagnetic lanthanides, the lighter lanthanides (Ce to Nd) induce a downfield chemical shift while the heavier lanthanides induce an upfield shift (Sm to Tm) in both the HDEHP and HEH[EHP] system.
The initial investigation into ligand exchange dynamics began by comparing HEH[EHP] ligand exchange dynamics on the Ln3+ center to the HDEHP exchange dynamics studied by Marie et al. 7 The calculated activation parameters suggest that the HDEHP exchange on La3+ proceeds via a dissociative interchange mechanism, while HDEHP exchanges via an associative mechanism on Sm3+. 7 While the suggested HEH[EHP] exchange on Sm3+ also proceeds via an associative mechanism, the activation parameters for the exchange on La3+ suggest an exchange mechanism of interchange with more associative character. The
trend observed in the exchange rate constants (kLa:HDEHP > kLa:HEH[EHP] > kSm:HDEHP ≈ kSm:HEH[EHP]) suggests the stronger electrostatic interactions correlate inversely with the rate of observable ligand exchange (on the NMR time scale). Additionally, it is observed that the exchange of extractants from Lu3+ is substitution inert (on the NMR time scale) in both systems.
Investigation of the system with varying [HEH[EHP]]free offers insights into the overall exchange rate law for the mechanism of exchange. The exchange of HEH[EHP] on Sm3+ seemingly proceeds via a dissociative mechanism, with a dissociation rate constant of kD = 1210 ± 50 s-1; however, the activation parameters determined for this reaction (ΔH‡ = 10.8 ± 0.2 kJ mol-1 and ΔS‡ = -150 ± 2 J mol-1 K-1) are not consistent with a dissociative mechanism. This inconsistency suggests there is something further happening, such as solvation effect on the system, monomers of HEH[EHP] exchanging, or the formation of an organized second sphere solvation shell around the exchange complex. The HEH[EHP] exchange on La3+ appears to occur via a more complex process – perhaps due to the more labile complex formed with HEH[EHP]. The activation parameters presented suggest there could be a shift in mechanism throughout the studied systems. However, the isokinetic relationship, with an isokinetic temperature of 250 (± 32) K, would suggest a single

DE-NE0000674 – Final report
48 of 49
mechanism being dominant in that temperature range. Changing the nature/structure of the diluent, from an aliphatic diluent (n-octane) to one with more aromatic character (toluene), offers insights into how the solvation environment could change the HEH[EHP] ligand exchange dynamics. These changes have different effects in the La3+ system as compared to the Sm3+ system. For HEH[EHP] exchange on La(AHA)3 complexes, the exchange rate constants were barely affected by the change in diluent. Yet, the activation parameters shifted suggesting that the mechanism changes. The HEH[EHP] exchange on the Sm3+ complexes remains suggestive of an associative mechanism, regardless of diluent used. However, in the case of the diluents least like the extractant molecule (toluene and TCE) the exchange rate constants decrease by 20 – 50%.
Extending the HEH[EHP] exchange studies to a more polar organic phase, with clear relevance to solvent extraction systems for nuclear fuel separations purposes, allows for understanding how additional polar molecules affect the exchange. Octanol is often used to prevent the formation of a third phase in solvent extraction systems, and it’s addition to the organic phase (2% 1-octanol, n-octane) increased HEH[EHP] exchange on Sm(AHA)3 by approximately a factor of three while the activation parameters remained the same – as compared to the system with only n-octane as the diluent. Increasing the concentration of HEH[EHP] also increases the exchange rate in both the La3+ and Sm3+ systems. Interestingly, the activation parameters for HEH[EHP] exchange on Sm(AHA)3 with the higher concentration of extractant suggested no change in exchange mechanism; whereas, the exchange on La(AHA)3 complexes – a more labile complex – showed changes in the activation parameters suggesting an altered mechanism of exchange. Overall, data on exchange reactions rates and mechanisms for these systems with increased polarity suggest that the new polar molecules increases the exchange rate from the second coordination sphere, possibly allowing a new site for the HEH[EHP] molecules to coordinate with to exchange more quickly.
NMR spectroscopy was also used to investigate two dual extractant systems, TALSPEAK-MME and ALSEP, in which one of the two extractants was HEH[EHP]. The addition of the second molecule offers a situation where possible binary complexes could be probed to understand if the study of exchange between the extractant-adducts and metal complexes could be probed. In the TALSPEAK-MME system, the addition of Cyanex-923 to HEH[EHP] qualitatively increases the exchange rate. However, due to the multiple phosphorus environments and incomplete resolution of the peaks, the exchange dynamics in the complex system could not be determined. In the ALSEP-like organic phase, a new phosphorus environment is observed for the HEH[EHP] exchange on the La3+ complexes, suggesting not only the HEH[EHP] dimers exchanging but also HEH[EHP] adducts with the respective DGA molecules. The investigation of the ALSEP-like organic phase extractants in equilibrium with Sm3+, suggests the DGAs in the solution do not effect HEH[EHP] exchange on Sm(AHA)3 complexes – when the metals are extracted from a Ln(NO3)3 pH 4 aqueous phase.
References
1. Krahn, E. O.; Marie, C.; Nash, K. L., Probing organic phase ligand exchange kinetics of 4f/5f solvent extraction systems with NMR spectroscopy. Coord. Chem. Rev. 2016, 316, 21-35.
2. Johnson, A. T.; Nash, K. L., Mixed Monofunctional Extractants for Trivalent Actinide/Lanthanide Separations: TALSPEAK-MME, Solvent Extr. Ion Exch., 2015, 33 (7), 642-655.
3. Sandström, J., Dynamic NMR Spectroscopy, Academic Press Inc. (London) Ltd., 1982. 4. Gelis, A. V.; Lumette, G. J., Actinide Lanthanide Separation Process – ALSEP. Ind. Eng.
Chem. Res. 2014, 53 (4), 1624-1631. 5. Gullekson, B. J.; Gelis, A. V.; Paulenova, A., Trans-Lanthanide Comparison of Metal Organic
Complexes in an Actinide Lanthanide Partitioning System, Proceedings of Global 2015, Paris, France, September 20-24, 2015, Paper 5415.

DE-NE0000674 – Final report
49 of 49
6. Lafferty, F. L.; Jensen, R. C.; Sheppard, J. C., Bis(2-ethylhexyl)phosphoric acid exchange in dilute solutions of copper(II) complexes by nuclear magnetic resonance spectroscopy. Inorg. Chem. 1969, 8 (9), 1875-1878.
7. Marie, C.; Hiscox, B.; Nash, K. L., Characterization of HDEHP-lanthanide complexes formed in a non-polar phase using 31P NMR and ESI-MS. Dalton Trans. 2012, 41, 1054-1064.
8. Fujiwara, N.; Tomiyasu, H.; Fukutomi, H., Kinetics of the Ligand-exchange Reactions in Th(tta)4 and Th(tta)4dmso in organic solvents. Bull. Chem. Soc. Jpn. 1985, 58 (5), 1386-1391.
9. Szabó, Z.; Vallet, V.; Grenthe, I., Structure and dynamics of binary and ternary lanthanide(III) and actinide(III) tris[4,4,4-trifluoro-1-(2-thienyl)-1,3-butanedione] (TTA) complexes. Part 2, the structure and dynamics of binary and ternary complexes in the Y(III)/Eu(III)-TTA-tributylphosphate (TBP) system in chloroform as studied by NMR. Dalton Trans. 2010, 39 (45), 10944-10952.