managing the global mobility function - oakwood …€™s eighth annual managing the global...
TRANSCRIPT
THIS RESEARCH HAS BEEN GENEROUSLY SPONSORED BY
www.forum-expat-management.com
A BENCHMARKING STUDY 2017
managing the global mobility
function
Fragomen_FP_MGMF_010817_FP.ps 2 31/07/2017 10:53
3
Contents
INTRODUCTION 5
EXECUTIVE SUMMARY 6
PARTICIPANT DEMOGRAPHICS 8
GLOBAL MOBILITY STRUCTURE AND REPORTING 10
OUTSOURCED SERVICES AND SPECIALISMS 16
RESPONDING TO GLOBAL CHANGE 22
CONCLUSION 24
Appendix A: Survey participants 25
Appendix B: Survey sponsors 26

Global Living SolutionsThat Exceed Your Expectations
SM
With locations in more than 95 countries, 24/7/365 customer care and
local market knowledge, Oakwood Worldwide® is the premier choice for all
business mobility and relocation housing needs.
+1.877.388.7170
OakwoodWorldwide.com
© Copyright 2017 Oakwood Worldwide All Rights Reserved
Oakwood_FP_FEM_MGMF_2017.ps 4 08/08/2017 09:49
5
introduction
Welcome to the Forum for Expatriate Management’s eighth annual Managing the Global Mobility Function report.
This year, mindful that our members’ workloads do not get any lighter, we revised and edited the survey, restricting it to just 20 questions. However, we kept the focus on the same key issues and retained the format of many of last year's questions so that we could make a reasonable comparison with 2016.
This report is compiled from the results of the survey, which was completed by 166 senior global mobility professionals worldwide. The aim here is to provide a snapshot of the industry – and to offer useful insights into current practice.
In 2016, the expectation was that global mobility teams would continue to grow in size and influence, and that the number of assignments would also increase to keep pace with what then seemed to be the unstoppable force of globalisation. However, this year’s results reveal a rather different
emerging pattern – and one that seems to be occurring in each of the world’s major regions when we consider the diverse locations of those who have taken part in this research.
The report throws up a number of surprises and much of what looked like an industry trend 12 months ago now seems to have altered course.
Business is undoubtedly operating in a more turbulent climate, but several results of the survey show also that global mobility has achieved a greater level of recognition as a valuable part of an organisation’s strategy. We also note what appears to be increasing satisfaction with the industry’s service providers, again pointing towards a more mature and established sector.
We hope that you find this report a useful and interesting read. FEM would like to thank all those who took part in the survey – and, of course, the report’s sponsors, Fragomen and Oakwood Worldwide.
Claire Tennant-ScullHead of Content Forum for Expatriate Management
76
executivesummaryFor this year’s MGMF survey we streamlined the number and length of the questions we set but, in order to be able to make useful comparisons, essentially we asked about the same key issues as in 2016.
Of course, we have many respondents who take part every year but we acquire new ones too. While this means that the conditions in which the survey is conducted change from year to year, it also indicates how the industry is changing as a whole.
The key findings of our survey:
Defining roles:• Compared with the 2016 MGMF survey, this year’s research reveals a slight decline in the number of Global Heads of global mobility and a small rise in the number of Regional Heads, which perhaps is a sign of increasing decentralisation. • Of those who replied that their title was ‘other’ than those listed, the majority identified themselves as consultants or specialists, which mirrors the overall employment trend towards more freelance workers and may be a reflection of the continuing emphasis on keeping down costs.• Two of the most interesting points are that the dominant roles all include the label ‘global mobility’, and those with ‘HR’ in their title are in the minority.
Company headquarters:• In 2016's survey, 46% of companies
that responded were headquartered in North America, but in 2017 that figure has dropped to 29.5%. • By contrast, the number of companies based in either Continental Europe, Australia/New Zealand or Asia has increased in each case.
Industry sectors: • Certain industries posted fewer responses this year, which may reflect the mixed fortunes of economies worldwide, in turn affecting the numbers and types of assignment. For example, there were more participants from the manufacturing, pharmaceutical/bio-tech, leisure, hospitality and tourism sectors in 2016. • Energy, oil & gas, however, which has been going through difficult times, shows a slight increase in participation
since 2016, rising from 10.5% to 12.1% in 2017.• The biggest increase in participation comes from the banking and finance sector, which has grown from 12% in 2016 to 22.3% in 2017.
Global mobility structure and reporting:• In stark contrast to the current enthusiasm for linking global mobility to talent management, only 8.8% of respondents reported to Talent – a figure that has also decreased from 9.9% in 2016. • Those reporting to Compensation and Benefits/Reward still account for the largest share, at 45.3%, with HR at 23.3%. • When asked to which department they thought GM should report, 37.6%
76
executive summary
thought it should be Compensation & Benefits, while 26.2% chose HR and 21.8% chose Talent.
Centralisation vs regionalisation, team size and resourcing:• When asked if they were centrally or locally managed, 38.5% of respondents said they were centrally located, which was down from 42% in 2016.• There has been a distinct increase in those who are centrally managed but in many locations, from 14% in 2016 to 22.4% this year. • Central centres of excellence with regional hubs have declined in popularity, from 25% in 2016 to 16.7% in 2017. Meanwhile the figures for decentralised functions have barely altered over the year.• There has been a clear change in the size of GM teams: in 2016 just over 20% of companies had teams of between one and five people; in 2017 that figure has jumped to more than half (54.7%) of companies. • There has also been a slight increase in organisations with GM teams of six to 10 people, and those with teams of 11 to 20 staff, but among those with teams of between 21 and 50 people there has been virtually no change. • The number of respondents who think GM is properly resourced has fallen from 59.2% in 2016 to 51.3% in 2017.• Meanwhile, those who think it is under-resourced have increased in proportion from 37.7% to 43.5%.
Numbers and types of assignment: • The headline figure here applies to companies with fewer than 50 assignees, which have increased from 27.1% of respondents in 2016 to 30.2% this year.• However, the percentage of long-term assignments has not changed from 44%, nor have extended business trips altered in popularity from 16%.• Short-term assignments have seen a slight increase, from 21% to 23%, while commuter assignments have increased from 12% in 2016 to 18% in 2017.• Local transfers have similarly risen, from 25% to 29%.
Outsourced services and specialisms• The proportion of organisations that outsource immigration work is unchanged from 79.4%. • There has been a slight decline in specialist tax outsourcing (to 81.6% from 87.3% in 2016), which, in the context of increased data sharing and changing regulations, is perhaps surprising. But it may be that the volume and complexity of the issues has led organisations to recruit their own in-house specialists instead.• Overall, there has been little movement in the number of organisations planning to change provider, albeit the percentage of respondents who intend to change their tax provider has increased, from 9.3% in 2016 to 14% in 2017. • Other categories with an increase in companies that may change provider are: assignment/vendor management, relocation/destination services and removals and household goods. However, in these cases, plans to change may reflect a corporate policy to review, or cost-cutting measures.
Managing vendor performance: • The trend seems to be towards an informal approach, with 43% saying they did not conduct a formal survey but tended to rely on assignee and informal feedback – a figure that has increased from 34.1% in 2016.• Just 26.6% carried out formal surveys and only 3.1% said they benchmarked.
Formal RFPs:• Clearly, there is little appetite (or time) for changing vendor more often than every three years, with almost every function being reviewed at that point. • Although the Global Mobility Director is still most involved in such decisions, their participation has fallen from 75.9% in 2016 to 64% in 2017. • The involvement of Procurement has also decreased, from 64.4% in 2016 to 58.4% this time, while HR’s participation has increased from 33.3% in 2016 to its current 44%.
Responding to global change:In 2016 we asked our respondents if they thought the Brexit result would change the willingness of multinationals to do business in Britain. Opinion was evenly divided, with 35% saying Yes, 30% saying No and 35% saying Don't Know). This time we broadened the question beyond the UK to incorporate the many global changes in politics and economics.
To what extent have changes in the geopolitical landscape affected international moves over the past 12 months? • The answers show clearly that geopolitical changes are having an impact, with 15.3% reporting a great effect and 41.2% reporting an impact 'To some extent'. Overall, therefore, a clear majority (approximately 56%) judged that international moves were being influenced.
8
Participant demographics
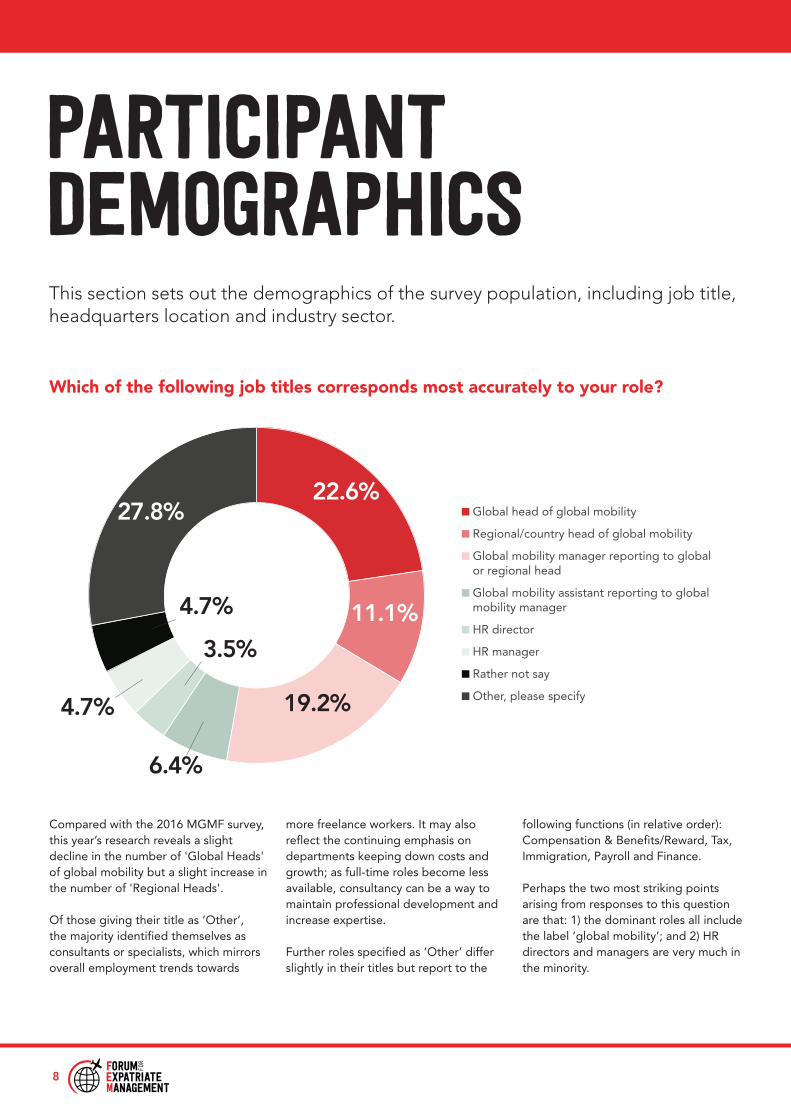
Compared with the 2016 MGMF survey, this year’s research reveals a slight decline in the number of 'Global Heads' of global mobility but a slight increase in the number of 'Regional Heads'.
Of those giving their title as ‘Other’, the majority identified themselves as consultants or specialists, which mirrors overall employment trends towards
more freelance workers. It may also reflect the continuing emphasis on departments keeping down costs and growth; as full-time roles become less available, consultancy can be a way to maintain professional development and increase expertise.
Further roles specified as ‘Other’ differ slightly in their titles but report to the
following functions (in relative order): Compensation & Benefits/Reward, Tax, Immigration, Payroll and Finance.
Perhaps the two most striking points arising from responses to this question are that: 1) the dominant roles all include the label ‘global mobility’; and 2) HR directors and managers are very much in the minority.
Which of the following job titles corresponds most accurately to your role?
This section sets out the demographics of the survey population, including job title, headquarters location and industry sector.
Global head of global mobility
Regional/country head of global mobility
Global mobility manager reporting to global or regional head
Global mobility assistant reporting to global mobility manager
HR director
HR manager
Rather not say
Other, please specify
22.6%
11.1%
19.2%
6.4%
3.5%
4.7%
4.7%
27.8%
9
SECTIOn heading hereparticipant demographics
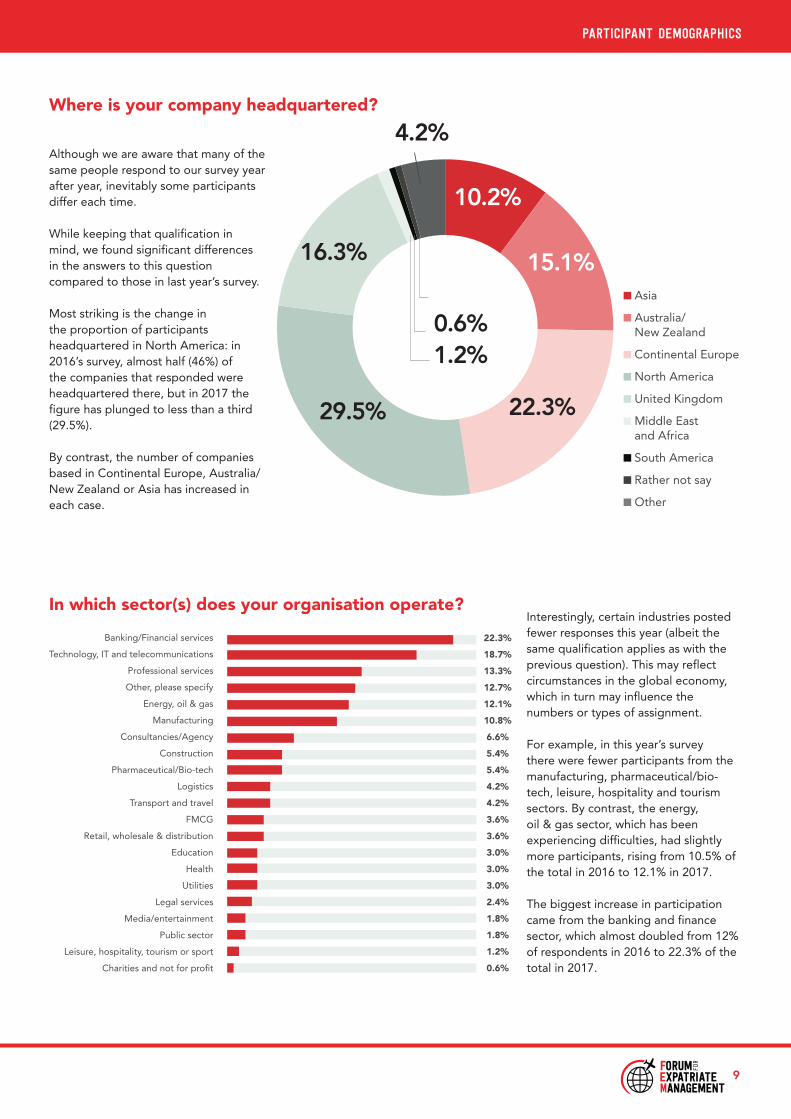
Although we are aware that many of the same people respond to our survey year after year, inevitably some participants differ each time.
While keeping that qualification in mind, we found significant differences in the answers to this question compared to those in last year’s survey.
Most striking is the change in the proportion of participants headquartered in North America: in 2016’s survey, almost half (46%) of the companies that responded were headquartered there, but in 2017 the figure has plunged to less than a third (29.5%).
By contrast, the number of companies based in Continental Europe, Australia/New Zealand or Asia has increased in each case.
Where is your company headquartered?
Interestingly, certain industries posted fewer responses this year (albeit the same qualification applies as with the previous question). This may reflect circumstances in the global economy, which in turn may influence the numbers or types of assignment.
For example, in this year’s survey there were fewer participants from the manufacturing, pharmaceutical/bio-tech, leisure, hospitality and tourism sectors. By contrast, the energy, oil & gas sector, which has been experiencing difficulties, had slightly more participants, rising from 10.5% of the total in 2016 to 12.1% in 2017.
The biggest increase in participation came from the banking and finance sector, which almost doubled from 12% of respondents in 2016 to 22.3% of the total in 2017.
In which sector(s) does your organisation operate?
Asia
Australia/ New Zealand
Continental Europe
North America
United Kingdom
Middle East and Africa
South America
Rather not say
Other
10.2%
15.1%
22.3%29.5%
16.3%
1.2%
4.2%
0.6%
22.3%
18.7%
13.3%
12.7%
12.1%
10.8%
6.6%
5.4%
5.4%
4.2%
4.2%
3.6%
3.6%
3.0%
3.0%
3.0%
2.4%
1.8%
1.8%
1.2%
0.6%
Banking/Financial services
Technology, IT and telecommunications
Professional services
Other, please specify
Energy, oil & gas
Manufacturing
Consultancies/Agency
Construction
Pharmaceutical/Bio-tech
Logistics
Transport and travel
FMCG
Retail, wholesale & distribution
Education
Health
Utilities
Legal services
Media/entertainment
Public sector
Leisure, hospitality, tourism or sport
Charities and not for profit
10
global mobility structure and
reporting
FEM_MGMF_010817 10FEM_MGMF_010817 10 08/08/2017 11:1308/08/2017 11:13
11
global mobility structure and reporting
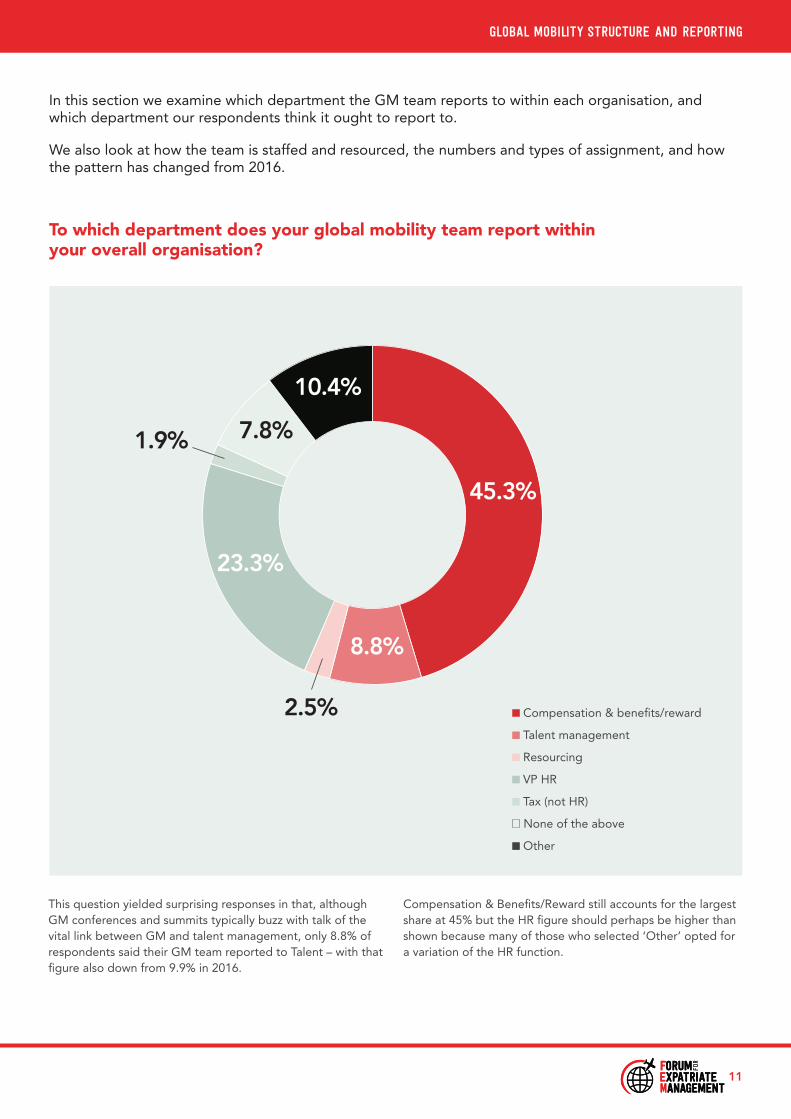
In this section we examine which department the GM team reports to within each organisation, and which department our respondents think it ought to report to.
We also look at how the team is staffed and resourced, the numbers and types of assignment, and how the pattern has changed from 2016.
This question yielded surprising responses in that, although GM conferences and summits typically buzz with talk of the vital link between GM and talent management, only 8.8% of respondents said their GM team reported to Talent – with that figure also down from 9.9% in 2016.
Compensation & Benefits/Reward still accounts for the largest share at 45% but the HR figure should perhaps be higher than shown because many of those who selected ‘Other’ opted for a variation of the HR function.
Compensation & benefits/reward
Talent management
Resourcing
VP HR
Tax (not HR)
None of the above
Other
To which department does your global mobility team report within your overall organisation?
45.3%
8.8%
2.5%
23.3%
10.4%
7.8%1.9%
12
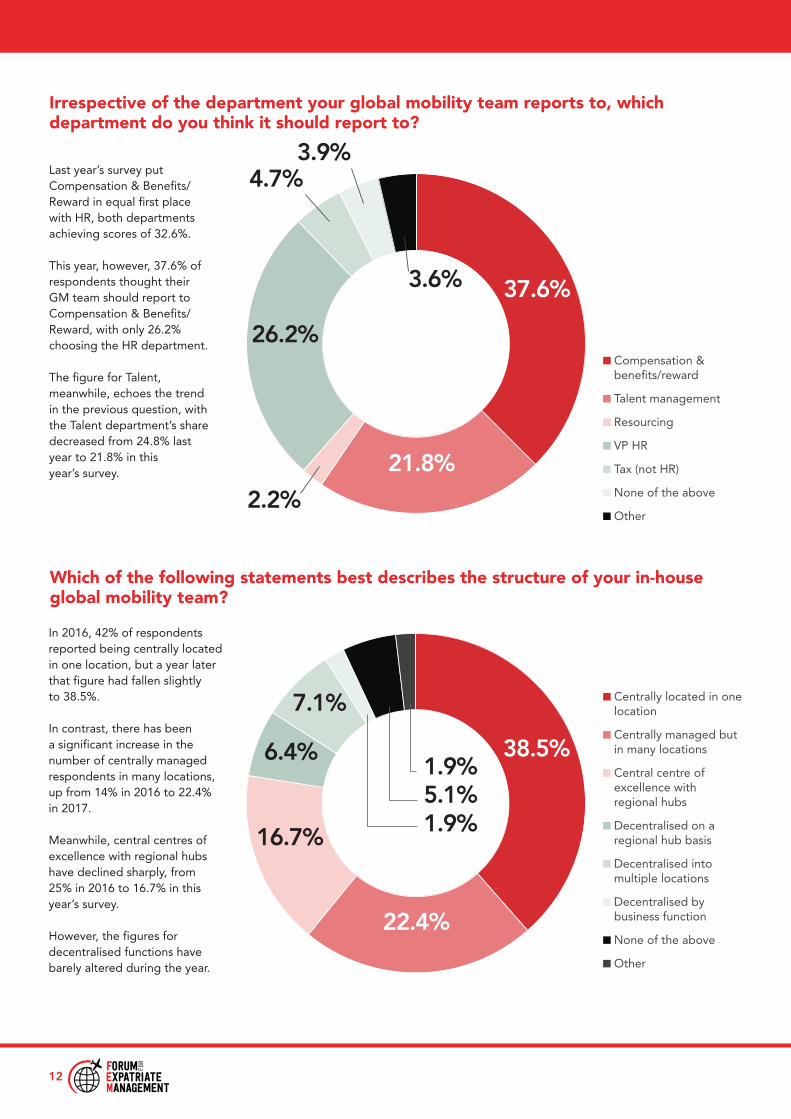
Irrespective of the department your global mobility team reports to, which department do you think it should report to?
Last year’s survey put Compensation & Benefits/Reward in equal first place with HR, both departments achieving scores of 32.6%.
This year, however, 37.6% of respondents thought their GM team should report to Compensation & Benefits/Reward, with only 26.2% choosing the HR department.
The figure for Talent, meanwhile, echoes the trend in the previous question, with the Talent department’s share decreased from 24.8% last year to 21.8% in this year’s survey.
Which of the following statements best describes the structure of your in-house global mobility team?
In 2016, 42% of respondents reported being centrally located in one location, but a year later that figure had fallen slightly to 38.5%.
In contrast, there has been a significant increase in the number of centrally managed respondents in many locations, up from 14% in 2016 to 22.4% in 2017.
Meanwhile, central centres of excellence with regional hubs have declined sharply, from 25% in 2016 to 16.7% in this year’s survey.
However, the figures for decentralised functions have barely altered during the year.
Centrally located in one location
Centrally managed but in many locations
Central centre of excellence with regional hubs
Decentralised on a regional hub basis
Decentralised into multiple locations
Decentralised by business function
None of the above
Other
Compensation & benefits/reward
Talent management
Resourcing
VP HR
Tax (not HR)
None of the above
Other
37.6%
21.8%
2.2%
26.2%
4.7%3.9%
3.6%
38.5%
22.4%
16.7%
6.4%
7.1%
1.9%5.1%1.9%
13
global mobility structure and reporting
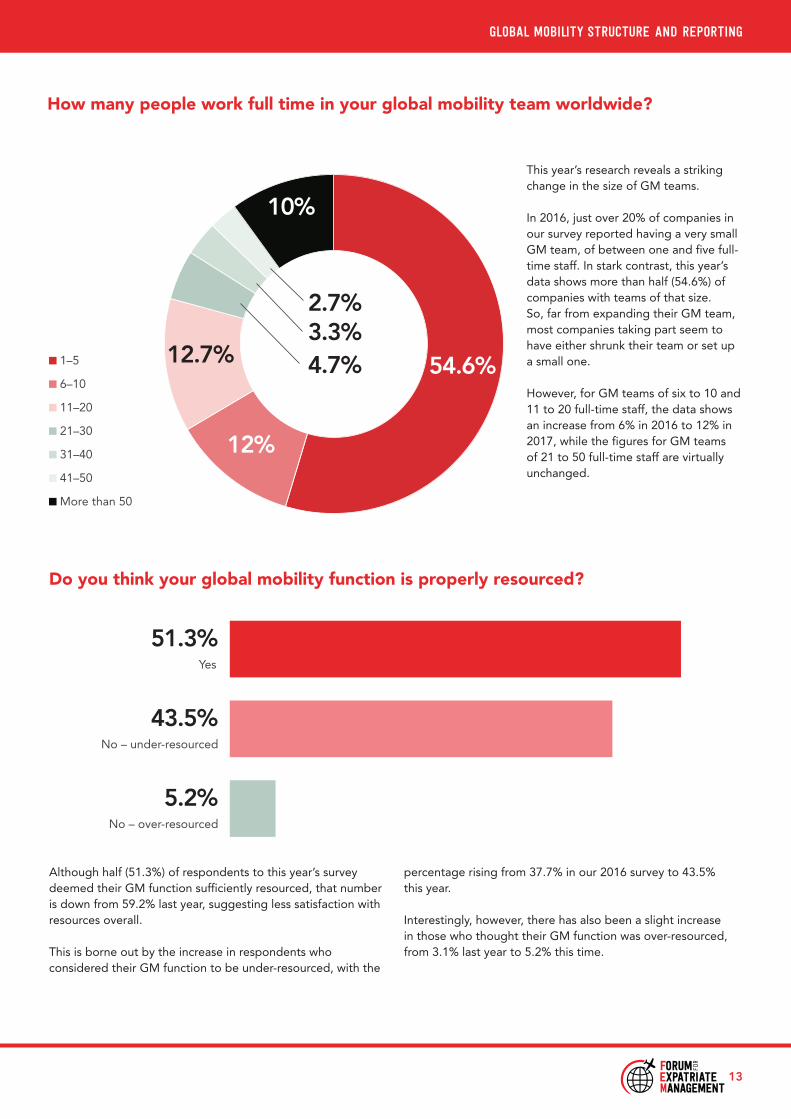
How many people work full time in your global mobility team worldwide?
This year’s research reveals a striking change in the size of GM teams.
In 2016, just over 20% of companies in our survey reported having a very small GM team, of between one and five full-time staff. In stark contrast, this year’s data shows more than half (54.6%) of companies with teams of that size. So, far from expanding their GM team, most companies taking part seem to have either shrunk their team or set up a small one.
However, for GM teams of six to 10 and 11 to 20 full-time staff, the data shows an increase from 6% in 2016 to 12% in 2017, while the figures for GM teams of 21 to 50 full-time staff are virtually unchanged.
Do you think your global mobility function is properly resourced?
Although half (51.3%) of respondents to this year’s survey deemed their GM function sufficiently resourced, that number is down from 59.2% last year, suggesting less satisfaction with resources overall.
This is borne out by the increase in respondents who considered their GM function to be under-resourced, with the
percentage rising from 37.7% in our 2016 survey to 43.5% this year.
Interestingly, however, there has also been a slight increase in those who thought their GM function was over-resourced, from 3.1% last year to 5.2% this time.
1–5
6–10
11–20
21–30
31–40
41–50
More than 50
54.6%
12%
12.7%
10%
2.7%3.3%4.7%
51.3%Yes
43.5%No – under-resourced
5.2%No – over-resourced
14
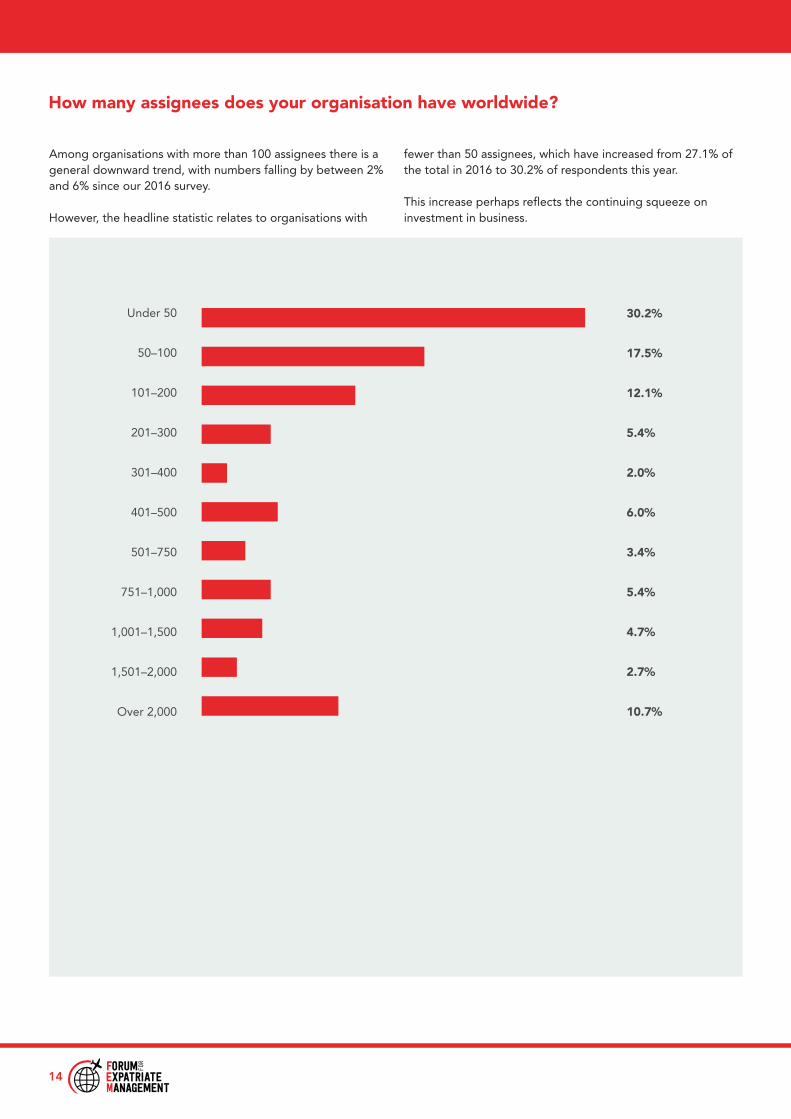
How many assignees does your organisation have worldwide?
Among organisations with more than 100 assignees there is a general downward trend, with numbers falling by between 2% and 6% since our 2016 survey.
However, the headline statistic relates to organisations with
fewer than 50 assignees, which have increased from 27.1% of the total in 2016 to 30.2% of respondents this year.
This increase perhaps reflects the continuing squeeze on investment in business.
30.2%
17.5%
12.1%
5.4%
2.0%
6.0%
3.4%
5.4%
4.7%
2.7%
10.7%
Under 50
50–100
101–200
201–300
301–400
401–500
501–750
751–1,000
1,001–1,500
1,501–2,000
Over 2,000
15
global mobility structure and reporting
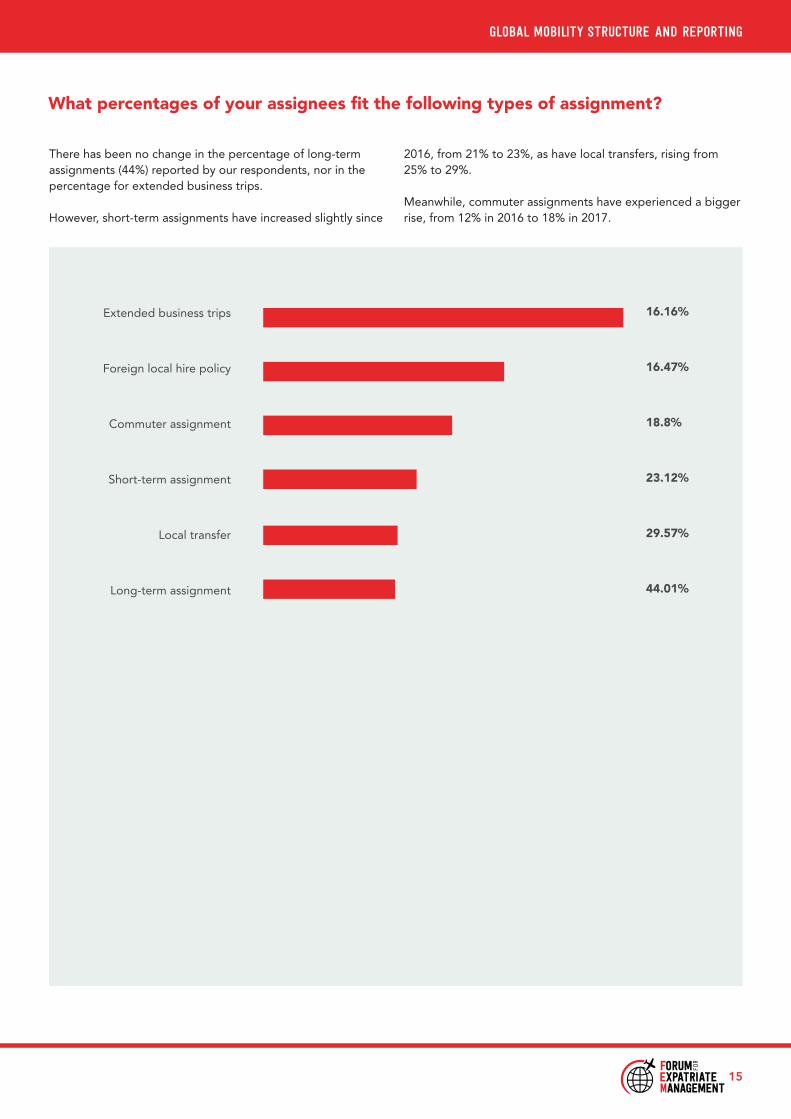
What percentages of your assignees fit the following types of assignment?
There has been no change in the percentage of long-term assignments (44%) reported by our respondents, nor in the percentage for extended business trips.
However, short-term assignments have increased slightly since
2016, from 21% to 23%, as have local transfers, rising from 25% to 29%.
Meanwhile, commuter assignments have experienced a bigger rise, from 12% in 2016 to 18% in 2017.
16.16%
16.47%
18.8%
23.12%
29.57%
44.01%
Extended business trips
Foreign local hire policy
Commuter assignment
Short-term assignment
Local transfer
Long-term assignment

outsourced services and specialisms
16
FEM_MGMF_010817 16FEM_MGMF_010817 16 08/08/2017 11:1608/08/2017 11:16
17
outsourced services and specialisms
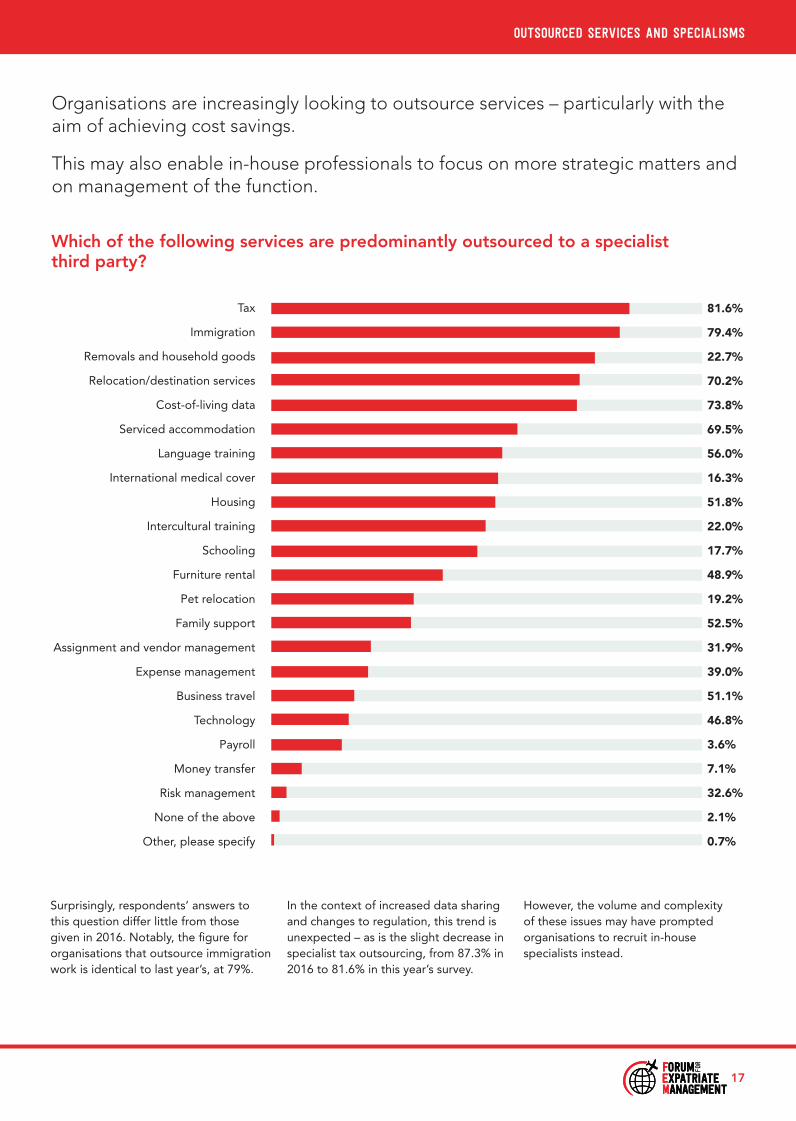
Organisations are increasingly looking to outsource services – particularly with the aim of achieving cost savings.
This may also enable in-house professionals to focus on more strategic matters and on management of the function.
Which of the following services are predominantly outsourced to a specialist third party?
Surprisingly, respondents’ answers to this question differ little from those given in 2016. Notably, the fi gure for organisations that outsource immigration work is identical to last year’s, at 79%.
In the context of increased data sharing and changes to regulation, this trend is unexpected – as is the slight decrease in specialist tax outsourcing, from 87.3% in 2016 to 81.6% in this year’s survey.
However, the volume and complexity of these issues may have prompted organisations to recruit in-house specialists instead.
81.6%
79.4%
22.7%
70.2%
73.8%
69.5%
56.0%
16.3%
51.8%
22.0%
17.7%
48.9%
19.2%
52.5%
31.9%
39.0%
51.1%
46.8%
3.6%
7.1%
32.6%
2.1%
0.7%
Tax
Immigration
Removals and household goods
Relocation/destination services
Cost-of-living data
Serviced accommodation
Language training
International medical cover
Housing
Intercultural training
Schooling
Furniture rental
Pet relocation
Family support
Assignment and vendor management
Expense management
Business travel
Technology
Payroll
Money transfer
Risk management
None of the above
Other, please specify
FEM_MGMF_010817 17FEM_MGMF_010817 17 08/08/2017 15:0908/08/2017 15:09
18
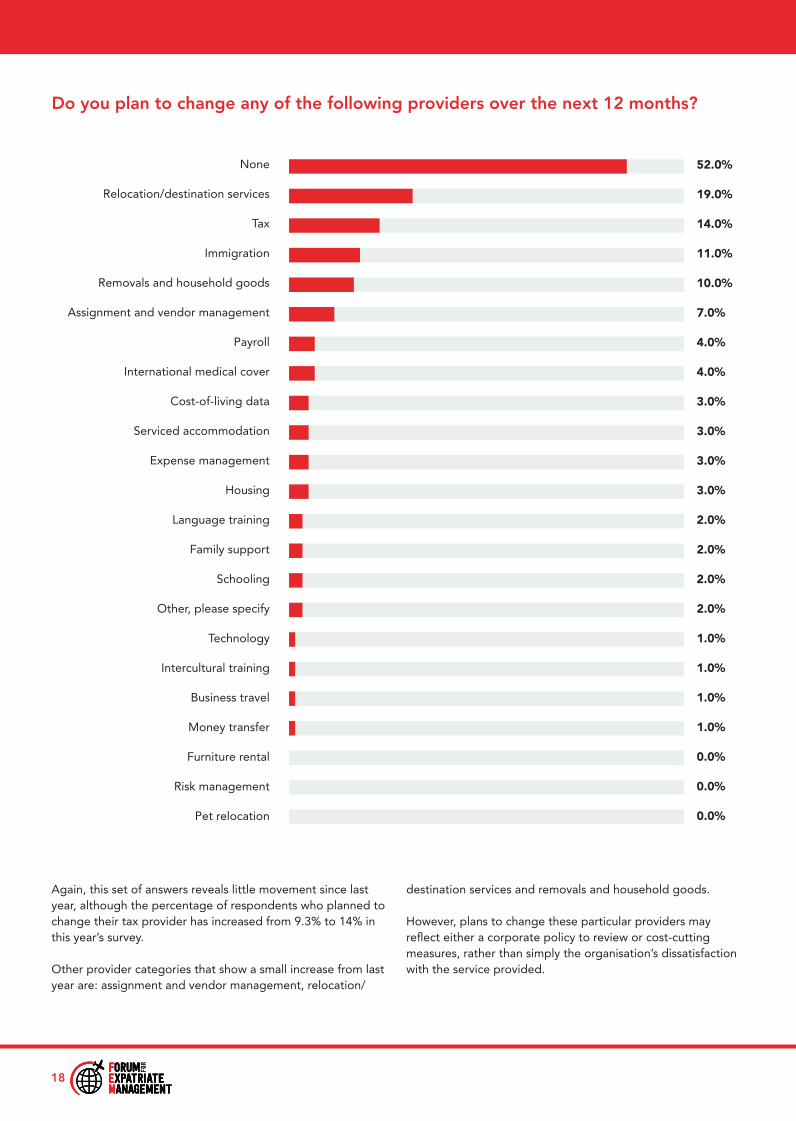
Do you plan to change any of the following providers over the next 12 months?
Again, this set of answers reveals little movement since last year, although the percentage of respondents who planned to change their tax provider has increased from 9.3% to 14% in this year’s survey.
Other provider categories that show a small increase from last year are: assignment and vendor management, relocation/
destination services and removals and household goods.
However, plans to change these particular providers may refl ect either a corporate policy to review or cost-cutting measures, rather than simply the organisation’s dissatisfaction with the service provided.
52.0%
19.0%
14.0%
11.0%
10.0%
7.0%
4.0%
4.0%
3.0%
3.0%
3.0%
3.0%
2.0%
2.0%
2.0%
2.0%
1.0%
1.0%
1.0%
1.0%
0.0%
0.0%
0.0%
None
Relocation/destination services
Tax
Immigration
Removals and household goods
Assignment and vendor management
Payroll
International medical cover
Cost-of-living data
Serviced accommodation
Expense management
Housing
Language training
Family support
Schooling
Other, please specify
Technology
Intercultural training
Business travel
Money transfer
Furniture rental
Risk management
Pet relocation
FEM_MGMF_010817 18FEM_MGMF_010817 18 08/08/2017 15:0908/08/2017 15:09
19
the global mobility functionoutsourced services and specialisms
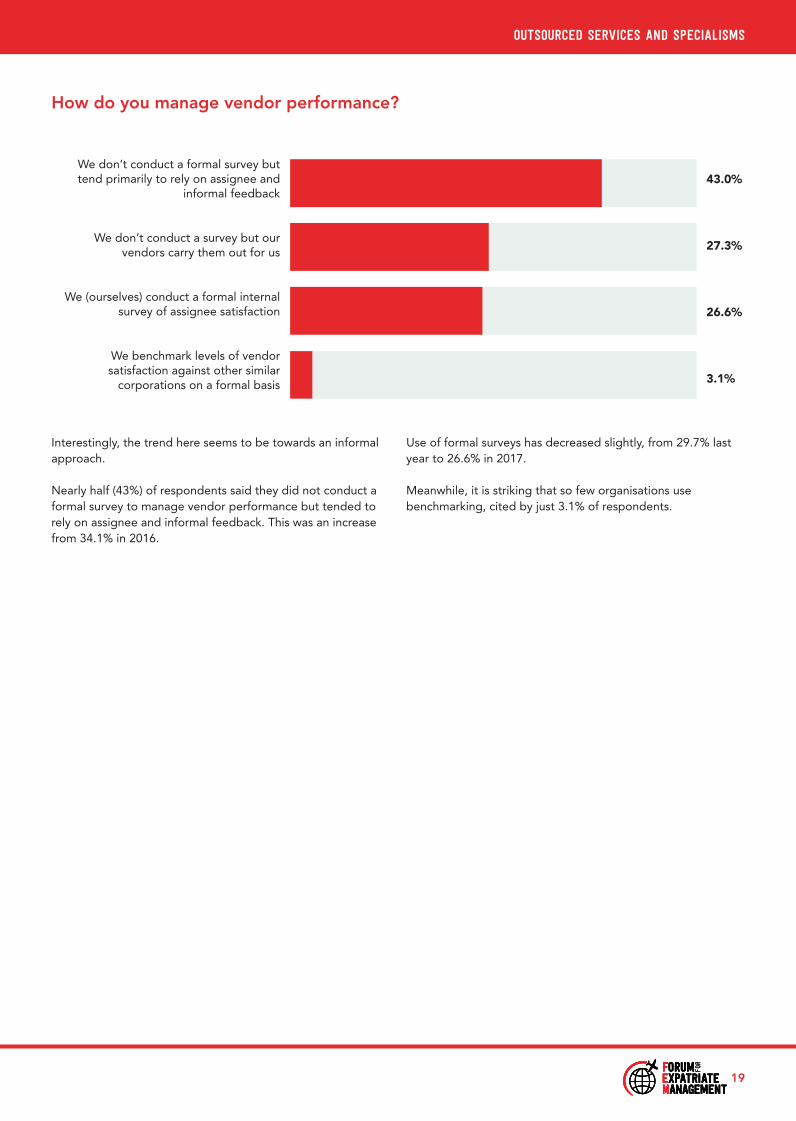
How do you manage vendor performance?
Interestingly, the trend here seems to be towards an informal approach.
Nearly half (43%) of respondents said they did not conduct a formal survey to manage vendor performance but tended to rely on assignee and informal feedback. This was an increase from 34.1% in 2016.
Use of formal surveys has decreased slightly, from 29.7% last year to 26.6% in 2017.
Meanwhile, it is striking that so few organisations use benchmarking, cited by just 3.1% of respondents.
43.0%
27.3%
26.6%
3.1%
We don’t conduct a formal survey but tend primarily to rely on assignee and
informal feedback
We don’t conduct a survey but our vendors carry them out for us
We (ourselves) conduct a formal internal survey of assignee satisfaction
We benchmark levels of vendor satisfaction against other similar
corporations on a formal basis
FEM_MGMF_010817 19FEM_MGMF_010817 19 08/08/2017 15:0908/08/2017 15:09
20
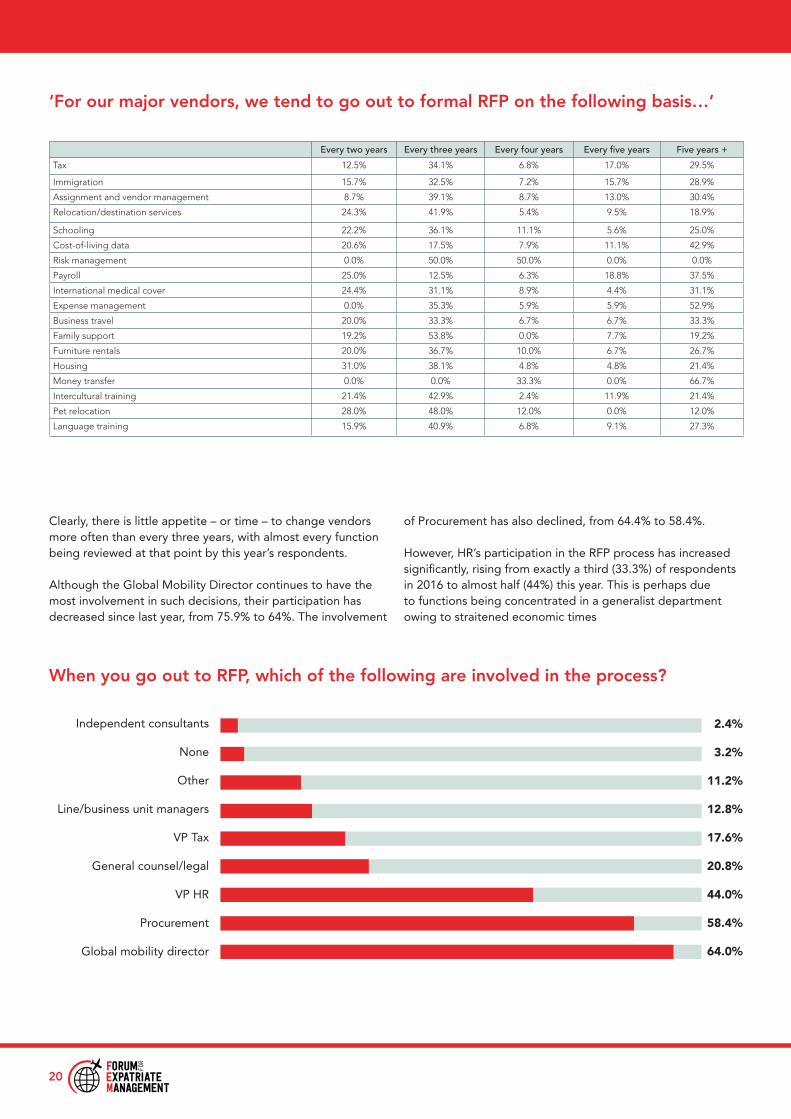
‘For our major vendors, we tend to go out to formal RFP on the following basis…’
Clearly, there is little appetite – or time – to change vendors more often than every three years, with almost every function being reviewed at that point by this year’s respondents.
Although the Global Mobility Director continues to have the most involvement in such decisions, their participation has decreased since last year, from 75.9% to 64%. The involvement
of Procurement has also declined, from 64.4% to 58.4%.
However, HR’s participation in the RFP process has increased significantly, rising from exactly a third (33.3%) of respondents in 2016 to almost half (44%) this year. This is perhaps due to functions being concentrated in a generalist department owing to straitened economic times
When you go out to RFP, which of the following are involved in the process?
Every two years Every three years Every four years Every five years Five years +
Tax 12.5% 34.1% 6.8% 17.0% 29.5%
Immigration 15.7% 32.5% 7.2% 15.7% 28.9%
Assignment and vendor management 8.7% 39.1% 8.7% 13.0% 30.4%
Relocation/destination services 24.3% 41.9% 5.4% 9.5% 18.9%
Schooling 22.2% 36.1% 11.1% 5.6% 25.0%
Cost-of-living data 20.6% 17.5% 7.9% 11.1% 42.9%
Risk management 0.0% 50.0% 50.0% 0.0% 0.0%
Payroll 25.0% 12.5% 6.3% 18.8% 37.5%
International medical cover 24.4% 31.1% 8.9% 4.4% 31.1%
Expense management 0.0% 35.3% 5.9% 5.9% 52.9%
Business travel 20.0% 33.3% 6.7% 6.7% 33.3%
Family support 19.2% 53.8% 0.0% 7.7% 19.2%
Furniture rentals 20.0% 36.7% 10.0% 6.7% 26.7%
Housing 31.0% 38.1% 4.8% 4.8% 21.4%
Money transfer 0.0% 0.0% 33.3% 0.0% 66.7%
Intercultural training 21.4% 42.9% 2.4% 11.9% 21.4%
Pet relocation 28.0% 48.0% 12.0% 0.0% 12.0%
Language training 15.9% 40.9% 6.8% 9.1% 27.3%
Independent consultants
None
Other
Line/business unit managers
VP Tax
General counsel/legal
VP HR
Procurement
Global mobility director
2.4%
3.2%
11.2%
12.8%
17.6%
20.8%
44.0%
58.4%
64.0%
21
outsourced services and specialisms
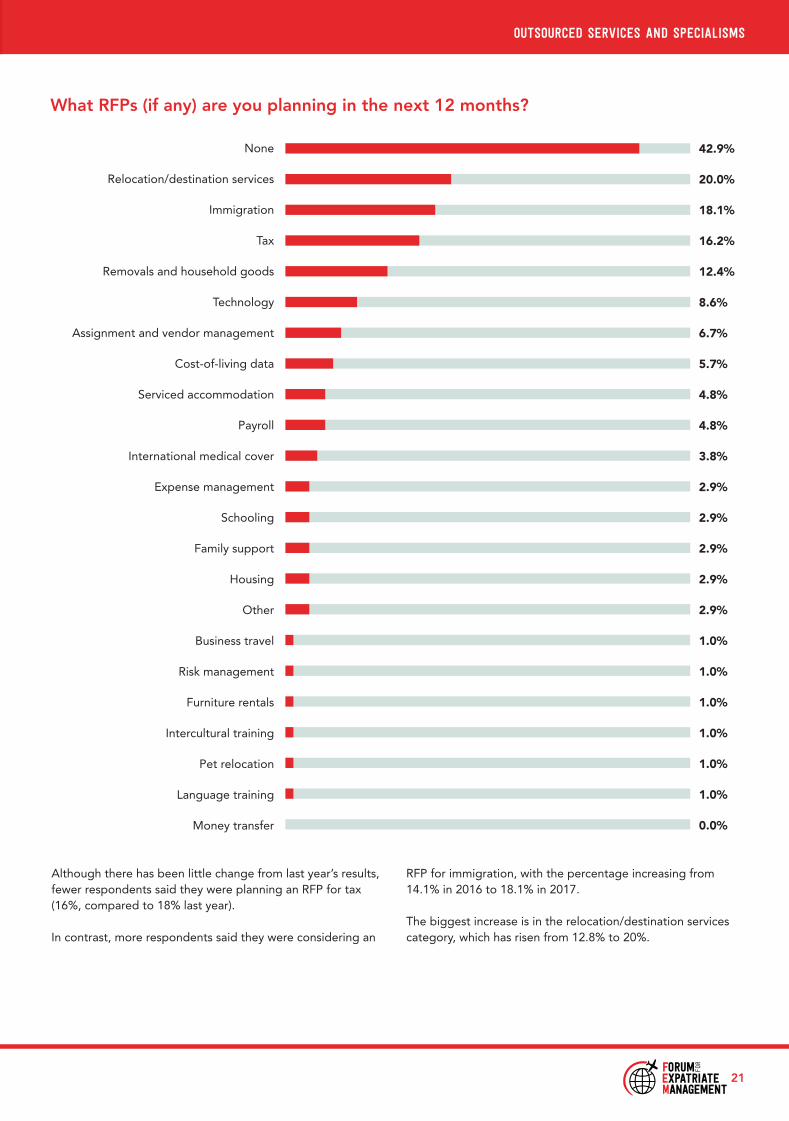
What RFPs (if any) are you planning in the next 12 months?
Although there has been little change from last year’s results, fewer respondents said they were planning an RFP for tax (16%, compared to 18% last year).
In contrast, more respondents said they were considering an
RFP for immigration, with the percentage increasing from 14.1% in 2016 to 18.1% in 2017.
The biggest increase is in the relocation/destination services category, which has risen from 12.8% to 20%.
42.9%
20.0%
18.1%
16.2%
12.4%
8.6%
6.7%
5.7%
4.8%
4.8%
3.8%
2.9%
2.9%
2.9%
2.9%
2.9%
1.0%
1.0%
1.0%
1.0%
1.0%
1.0%
0.0%
None
Relocation/destination services
Immigration
Tax
Removals and household goods
Technology
Assignment and vendor management
Cost-of-living data
Serviced accommodation
Payroll
International medical cover
Expense management
Schooling
Family support
Housing
Other
Business travel
Risk management
Furniture rentals
Intercultural training
Pet relocation
Language training
Money transfer
FEM_MGMF_010817 21FEM_MGMF_010817 21 08/08/2017 15:0908/08/2017 15:09
responding to global
change
22
FEM_MGMF_010817 22FEM_MGMF_010817 22 08/08/2017 11:1808/08/2017 11:18
23
responding to global change
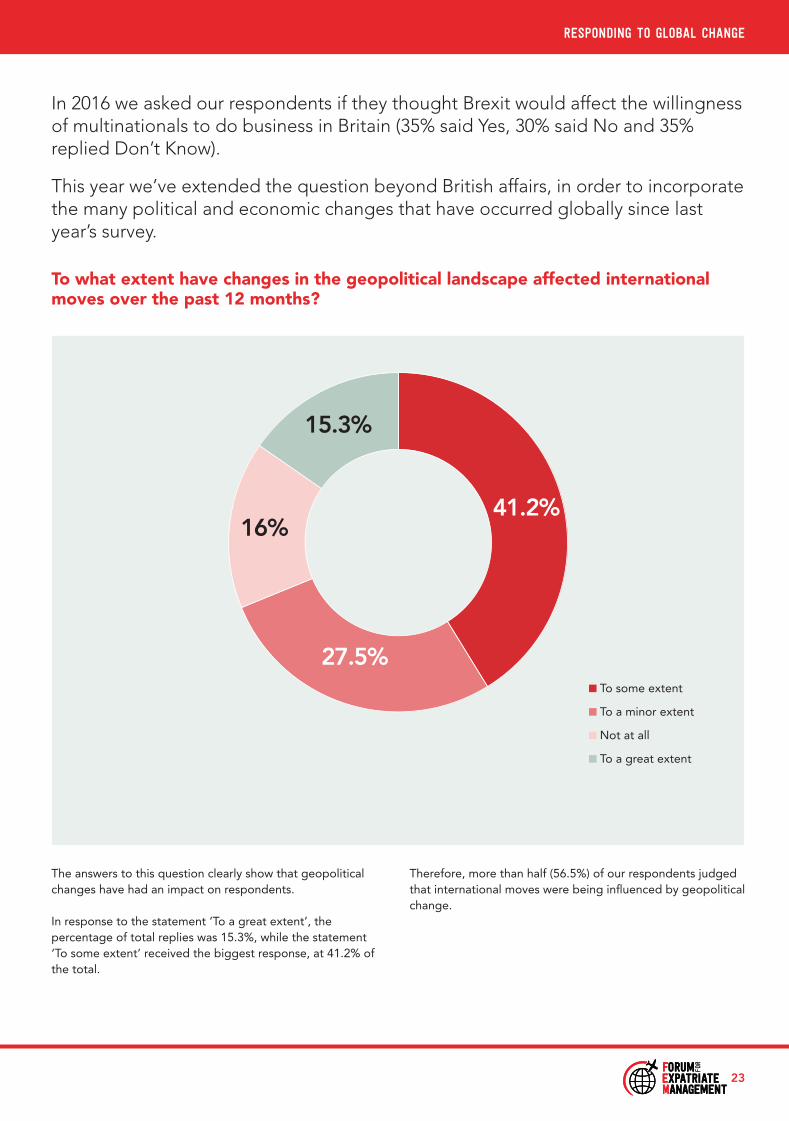
In 2016 we asked our respondents if they thought Brexit would affect the willingness of multinationals to do business in Britain (35% said Yes, 30% said No and 35% replied Don’t Know).
This year we’ve extended the question beyond British affairs, in order to incorporate the many political and economic changes that have occurred globally since last year’s survey.
To what extent have changes in the geopolitical landscape affected international moves over the past 12 months?
The answers to this question clearly show that geopolitical changes have had an impact on respondents.
In response to the statement ‘To a great extent’, the percentage of total replies was 15.3%, while the statement ‘To some extent’ received the biggest response, at 41.2% of the total.
To some extent
To a minor extent
Not at all
To a great extent
41.2%
27.5%
16%
15.3%
Therefore, more than half (56.5%) of our respondents judged that international moves were being infl uenced by geopolitical change.
FEM_MGMF_010817 23FEM_MGMF_010817 23 08/08/2017 11:2008/08/2017 11:20
Conclusion
While a few countries are seeing something of a boom in their fortunes, many areas of the world are experiencing economic challenges and political instability – factors that inevitably impact upon both business confidence and operations.
The fortunes of various industries and sectors also wax and wane, so it is impossible to recreate the same conditions for this survey every year. Nevertheless, while keeping in mind qualifying factors such as this, we can use the results to make some broad comparisons – and draw some conclusions from what we see.
Among respondents whose job title didn’t readily fit the traditional types, there was a marked increase in those who, although working on the corporate side of global mobility, defined themselves as either Consultant or Specialist. This would seem to mirror the overall shift across all sectors towards self-employment, but it is important to remember that this may be as much about corporate cost-cutting as about entrepreneurship or choosing to work as a contractor.
Among the more traditional roles, the decline in the number of Global Heads of Global Mobility, alongside an increase in the number who identified themselves as Regional Head, is particularly interesting and may point to an increasing trend towards decentralisation – which seems borne out by the shifts in company headquartering – away from the
traditional hotspots of the USA and the UK and instead more evenly spread across Continental Europe, Australasia and Asia. Perhaps the most striking point about the majority of job titles given in our respondents’ answers is that most of them include the label ‘global mobility’ – surely a clear sign that, as a distinct discipline, GM has achieved a certain level of maturity within business.
Although there was little significant change in respondents' views on the department to which GM should report, there was a definite increase in the number of those who thought that GM was under-resourced. GM teams too, according to these results, appear to be remaining small or even shrinking, with an increase in those that are centrally managed but regionally located.
The number of assignees being managed by GM professionals has also dropped in the past year and, although the percentage of long-term assignments has not decreased significantly, there are more short-term and ‘commuter’ assignments being managed.
The answers on outsourcing and vendor management revealed a surprisingly small appetite for change. There was little difference in the percentage of organisations that planned to outsource further – or to review their provider more often than every three years. Taken with the fact that almost half of respondents said they did not carry out formal surveys on vendor performance
but relied instead on assignee and informal feedback, this suggests a positive level of satisfaction with vendor performance.
Finally, following 2016’s question about the potential impact of Brexit, we broadened this year’s topic to ask respondents to what extent they thought geopolitical changes had affected international moves in the past 12 months. A clear majority thought there had been a definite impact (with 15% saying 'To a great extent').
The world is constantly changing, of course, but the overall results of this year's survey, along with our Policy in Practice Report – Risk Management and Compliance in an Uncertain World – published earlier in 2017, suggest a commonly held perception that business is operating in a more unpredictable environment.
There’s little that any of us can do to immediately change this situation. But at FEM we can at least bring together GM professionals to pool their knowledge and experience – whether face to face at our global and local events, online via our website and social media, or, of course, through reports such as this one, which can provide a useful way to 'take the temperature’ of the industry as a whole.
Once again, FEM is grateful to all those who took part in our survey.
Forum for Expatriate ManagementSeptember 2017
24
25
Appendix ASurvey ParticipantsABBAccentureAdvent International CorpAIA Company LimitedAIRINCAkamai TechnologiesAktis StrategyAllianzAmec Foster WheelerAmerican Bureau of ShippingAmerican ExpressANZANZ Banking Group LtdArdaghArthur J Gallagher & CompanyArupAspen InsuranceAT KearneyAtkinsAtosAustralian Embassy – DefenceAustralianSuperAvaloq Evolution AGAviva
BAE Systems IncBAI CommunicationsBanco Bradesco SABank of China BrazilBayerBeam SuntoryBHP BillitonBooking.comBorgWarner IncBPBurckhardt Compression AG
Cabot CorporationCardnoCerberusCGIChanelChatham FinancialChubbCignaCisco International LimitedCNA FinancialCoca-Cola European PartnersComputacenterComscoreContinental AutomotiveCrown World MobilityCSG InternationalCS Mobility
Damco Belgium NVDeloitteDeloitte Tohmatsu Tax CoDTCCDwellworks
Electronic ArtsErnst & YoungEtex NVEY
Fakhoury Global ImmigrationFederal ExpressFellowes BrandsFirmenich Asia Pte LtdFluxysFonterraFord Motor CompanyFujitsuFujitsu Technology Solutions
GileadGilead SciencesGmailGrainCorp Operations LimitedGrant Thornton Australia Limited
Honeywell
IFDSIHRDCITWImprobableInfineon Technologies AGInnogy Business Services UK LtdInsurance Australia GroupInternational SOSInternational SOS P/LIntuit
JetstarJohn Holland Group Pty LtdJohnson & JohnsonJPMorgan Chase & Co
LazardLearningonline.xyzLeyyn ConsultingLion
MacquarieMaples and CalderMercer
MFS Investment ManagementMichael PageMicron Technology IncMonadelphous Group LimitedMTU Aero EnginesMünchener Rückversicherung AG
NES Global TalentNovartisNTT DATA Services
OceaneeringOnefinestay
PearsonPfizerPinsent Masons LLPPon Holdings BVPublicis CommunicationsPullmantur
QBE Insurance Group Ltd
REHAU AG + CoRolls-Royce PlcRWE Generation
SabreSaint-GobainSanta FeSAPSavillsSembcorp Marine LtdShield GEOShireSika AGSkyscannerSoftware AGSulzer Management AGSwisscom Ltd
Takeda Pharmaceuticals USA, IncTDWilliamson sprlTechnipTescoThe Capital Group Companies IncToyota Motor North AmericaTTK Services Private Limited
UniGroup Worldwide Moving – Hong KongUniversity of Pennsylvania
Westpac
WiproWoodside EnergyWoolworths
Yazaki North America
SECTIOn heading here
appendix Bsurvey sponsors
To contact Fragomen in over 40 offi ces located worldwide, please visit www.fragomen.com
Fragomen is widely recognized as the world’s leading global corporate immigration services provider. The fi rm’s exclusive focus on immigration counseling and services and its strong global presence allow Fragomen to provide clients with high-quality, innovative, sustainable and cost-effective worldwide immigration services. Fragomen represents a broad range of companies, organizations, emerging businesses and individuals utilizing a sophisticated, centralizedand high-touch service delivery model.
Founded in 1951 in the United States, Fragomen has developed into a truly global presence, with more than 40 offi ces in 24 countries across every region of the world. Today, it has over 3,450 immigration and support staff dedicated to anticipating and proactively meeting client needs. The fi rm’s growth has been bolstered by its
eye towards technological and strategic solutions, hiring of creative problem-solvers and focus on meeting clients on their terms.
Fragomen’s innovative technologies and methodologies to optimize the value of its services are a cornerstone of its service excellence. By building teams of professionals to meet client needs, resources are focused on key issues such as government strategies and relations, worldwide standards and knowledge and best practices. The fi rm also utilizes a proprietary case management and reporting tool to enable case processing effi ciencies and management information reporting, and remains at the cutting edge of information sourcing and delivery techniques.
Fragomen7 Hanover SquareNew York, NY 10004United States of America T: +1 212 688 8555E: [email protected]
26
FEM_MGMF_010817 26FEM_MGMF_010817 26 08/08/2017 11:2908/08/2017 11:29
27
Oakwood Worldwide® is the premier provider of furnished and serviced apartments through its well-known brands, Oakwood®, ExecuStay® and Insurance Housing Solutions™. With a presence in all 50 United States and more than 95 countries, the company provides move-in-ready accommodations to meet the needs of global organizations and business travelers alike.
Oakwood Worldwide is based in Los Angeles with a Worldwide Sales and Service Center in Phoenix and regional headquarters in London and Singapore.
Contact: Elizabeth HotzeT: 843.640.1425E: [email protected]: www.OakwoodWorldwide.com
FEM_010817 27FEM_010817 27 08/08/2017 09:5008/08/2017 09:50

www.forum-expat-management.com
FEM_MGMF_010817 28FEM_MGMF_010817 28 08/08/2017 11:0408/08/2017 11:04