managing the epidemic of ckd the uk model - nephro … · managing the epidemic of ckd the uk model...
TRANSCRIPT

Managing the Epidemic of CKDThe UK Model
Dr Donal O’DonoghueNational Clinical Director for Kidney Care
Actualités Néphrologiques Jean HamburgerHôpital Necker, Paris
29 April 2008

UK Modality Trends 1982 – December 2006
UK Renal Registry 10th Annual Report 2007
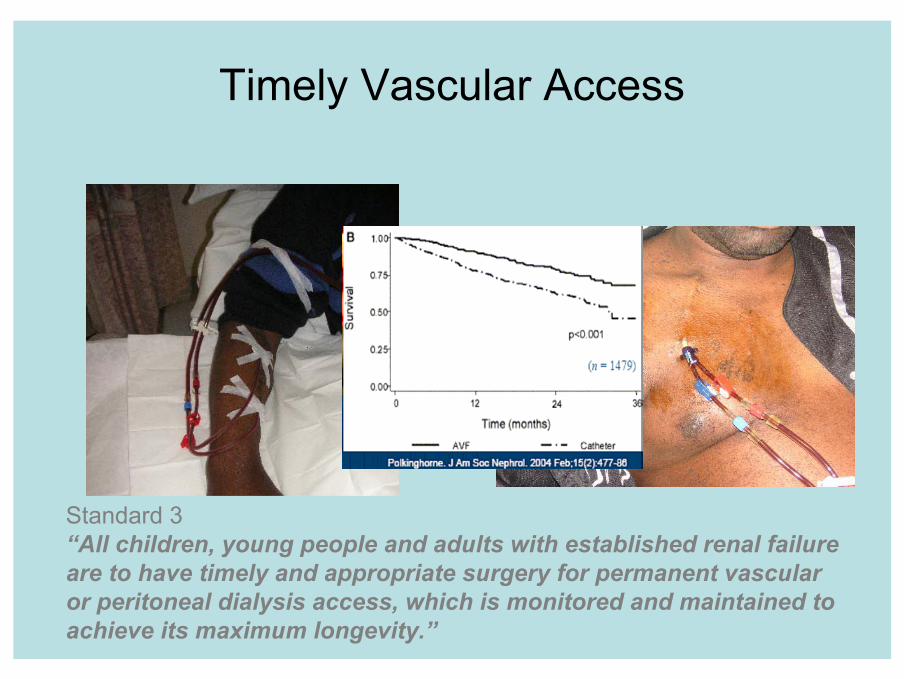
Timely Vascular Access
Standard 3“All children, young people and adults with established renal failure are to have timely and appropriate surgery for permanent vascular or peritoneal dialysis access, which is monitored and maintained to achieve its maximum longevity.”

Accelerated processes for Acute Uraemic Accelerated processes for Acute Uraemic EmergenciesEmergencies


• Prevention and detection of early CKD• A patient centred service that supports the
person in managing their condition to achieve the best possible quality of life
• Minimising the consequences of CKD• Prompt identification of AKI• Preparation and choice for RRT
National Service Framework for Renal Services 2004-5
National Service Framework Standards
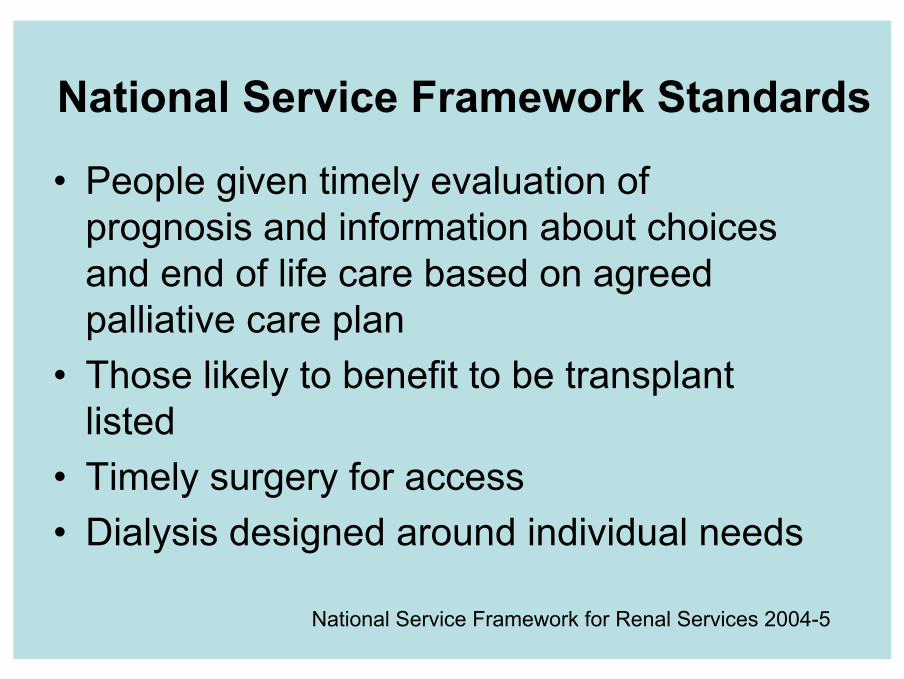
• People given timely evaluation of prognosis and information about choices and end of life care based on agreed palliative care plan
• Those likely to benefit to be transplant listed
• Timely surgery for access• Dialysis designed around individual needs
National Service Framework for Renal Services 2004-5
National Service Framework Standards


Provision and commissioning of kidney care
EOL Care
Supportive & palliative care
Modified from Levey AS et Al . KI 2005:2089-2100
Public HealthPrimary Care
Specialist Kidney Care
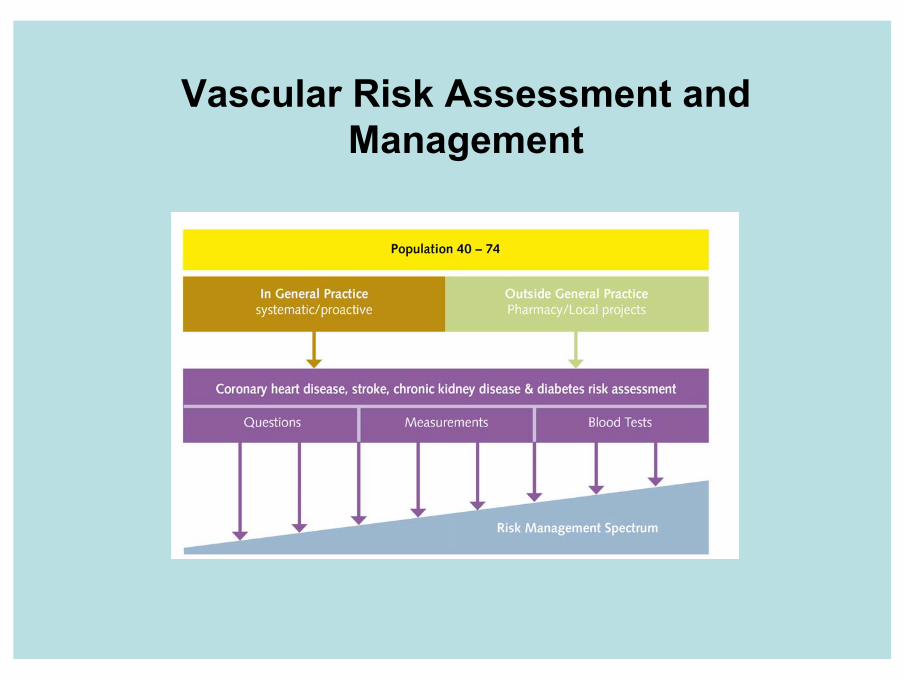
Vascular Risk Assessment and Management

Vascular Risk Assessment and Management
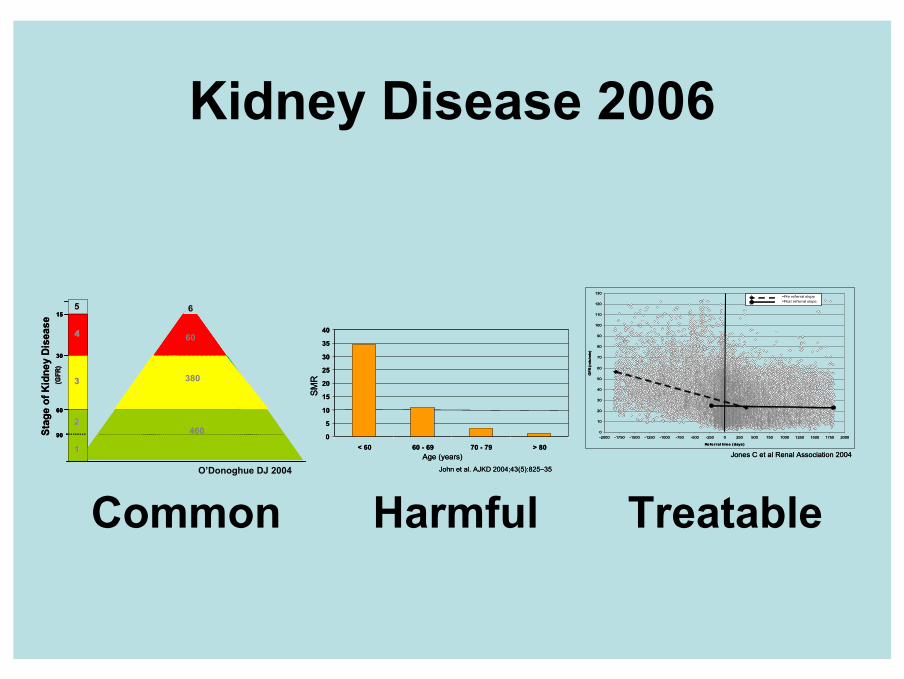
Kidney Disease 2006St
age
of K
idne
y D
isea
se
90 460
60
6
380
60
15
30
(GFR
)(G
FR)
11
22
33
44
55
Stag
e of
Kid
ney
Dis
ease
90 460
60
6
380
60
15
30
(GFR
)(G
FR)
11
22
33
44
55
90 460
60
6
380
60
15
30
(GFR
)(G
FR)
11
22
33
44
55SM
R
Age (years)John et al. AJKD 2004;43(5):825–35
0
5
10
15
20
25
30
35
40
< 60 60 - 69 70 - 79 > 80
SMR
Age (years)John et al. AJKD 2004;43(5):825–35
0
5
10
15
20
25
30
35
40
< 60 60 - 69 70 - 79 > 80
0
10
20
30
40
50
60
70
80
90
100
110
120
130
-2000 -1750 -1500 -1250 -1000 -750 -500 -250 0 250 500 750 1000 1250 1500 1750 2000
Referral time (days)
GFR
(mls
/min
)
=Pre referral slope=Post referral slope
Jones C et al Renal Association 2004
0
10
20
30
40
50
60
70
80
90
100
110
120
130
-2000 -1750 -1500 -1250 -1000 -750 -500 -250 0 250 500 750 1000 1250 1500 1750 2000
Referral time (days)
GFR
(mls
/min
)
=Pre referral slope=Post referral slope
Jones C et al Renal Association 2004
Common Harmful TreatableO’Donoghue DJ 2004
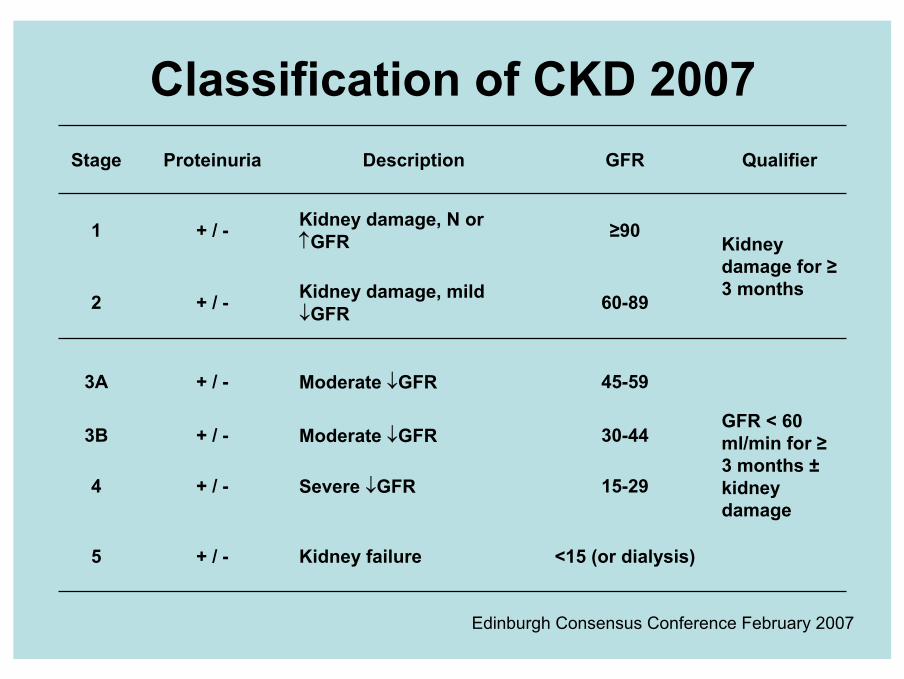
+ / -
+ / -
+ / -
+ / -
+ / -
+ / -
Proteinuria
<15 (or dialysis)Kidney failure5
15-29Severe ↓GFR4
GFR < 60 ml/min for ≥3 months ±kidney damage
45-59
30-44
Moderate ↓GFR
Moderate ↓GFR
3A
3B
60-89Kidney damage, mild ↓GFR2
Kidney damage for ≥3 months
≥90Kidney damage, N or ↑GFR1
QualifierGFRDescriptionStage
Edinburgh Consensus Conference February 2007
Classification of CKD 2007

SCr 120, eGFR 30 ml/min SCr 120, eGFR 130 ml/min
eGFR = % Kidney Function

0
20
40
60
80
100
ReciprocalSCr
Cockroft-Gault
24-HourCreatinineClearance
ReciprocalSCr [C]
Cockroft-Gault [C]
24-HourCreatinineClearance
[C]
MDRD 6Parameter
MDRD 4Parameter
Accu
racy
, %Percent of estimates within 30% of the measured GFR in theMDRD Study validation sample (n = 558)
Redrawn from: K/DOQI Clinical practice guidelines for chronic kidney disease, Am J Kidney Dis 2002;39:S1-S266
Evolution of GFR Estimation
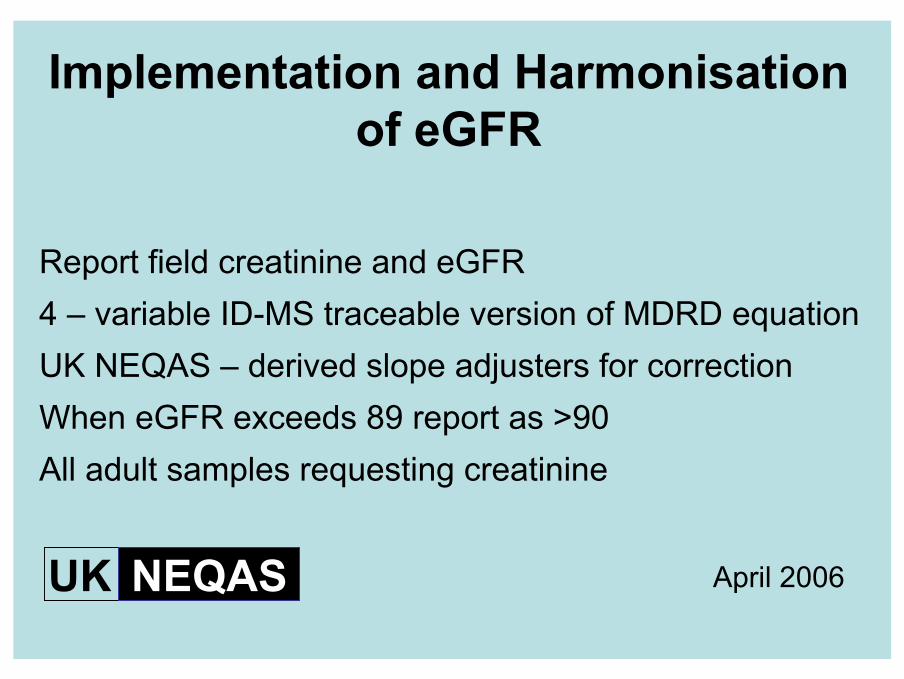
Report field creatinine and eGFR4 – variable ID-MS traceable version of MDRD equationUK NEQAS – derived slope adjusters for correctionWhen eGFR exceeds 89 report as >90All adult samples requesting creatinine
UK NEQAS
Implementation and Harmonisation of eGFR
April 2006

40-80%4CKD 4: Percentage of patients who are treated with an ACEi and ARB (unless a contraindication)
40-70%11CKD 3Percentage of patients with a BP of 140/85 or less
40-90%6CKD 2Percentage of patients with a record of blood pressure in the previous 15 months
6CKD 1A register of patients aged 18 years and over with CKD (Stage 3-5 CKD)
PaymentStages
Points
The CKD Domain of QOF
April 2006

11 May 2006
GPs to Shoulder the Burden of CKD
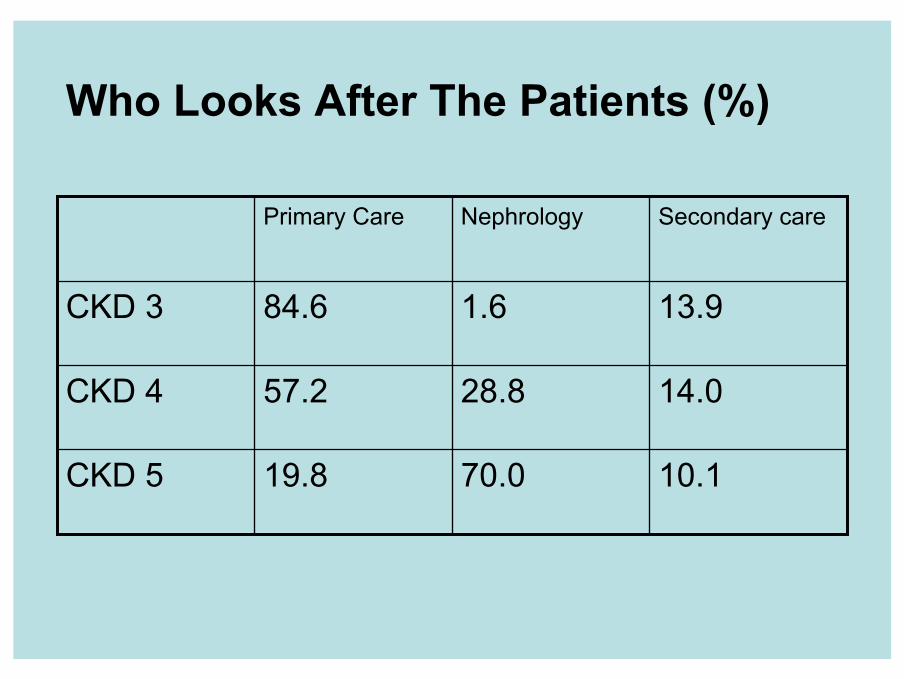
Who Looks After The Patients (%)
10.170.019.8CKD 5
14.028.857.2CKD 4
13.91.684.6CKD 3
Secondary careNephrologyPrimary Care

Impact of eGFR Reporting on Referrals – Lincolnshire PCT
Mar Apr
May Jun
Jul
Aug
Sep
Oct
Nov
Dec Jan
Feb
Mar Apr
May Jun
Jul
Aug
Sep
Oct
Nov
Dec Jan
Feb
Mar Apr
May Jun
Jul
Aug
Patie
nt n
umbe
rs
10
20
30
40
50
60
70
80
90
eGFR reporting
2004 20062005

0.0%
0.5%
1.0%
1.5%
2.0%
2.5%
3.0%
3.5%
4.0%
CKD QOF Prev CKD Prev 18+
CKD QOF Prev 3.0% 2.6% 2.6% 2.6% 2.5% 2.4% 2.4% 2.4% 2.4% 2.3% 1.7%
CKD Prev 18+ 3.8% 3.3% 3.2% 3.2% 3.2% 3.1% 3.0% 3.0% 3.0% 2.8% 2.1%
EAST MIDLANDS
SOUTH WEST
NORTH EAST
YORKSHIRE & HUMBER
SOUTH EAST
COAST
WEST MIDLANDS
SOUTH CENTRAL ENGLAND NORTH
WESTEAST OF ENGLAND LONDON
Org Level NATIONAL National Practice Code (All) Old SHA (All) PCT Short (All)
SHA Short
Data
Chronic Kidney Disease – QOF Prevalence & Age Specific Prevalence Aged 18+ - 2006/7 – By SHA
0.0%
0.5%
1.0%
1.5%
2.0%
2.5%
3.0%
3.5%
4.0%
4.5%
Dor
set &
Som
erse
t
Tren
t
Han
ts &
IoW
Sout
h Yo
rksh
ire
Surr
ey &
Sus
sex
NEY
NL
Cum
bria
& L
ancs
Co
Dur
ham
& T
ees
Valle
y
Nor
thum
b Ty
ne &
Wea
r
Leic
s, N
orth
ants
& R
utla
nd
Nor
folk
, Suf
folk
& C
ambs
Che
shire
& M
erse
y
Shro
pshi
re &
Sta
ffs
Birm
ingh
am/B
lack
Cou
ntry
Avon
, Glo
s &
Wilt
s
Wes
t Mid
land
s So
uth
Sout
h W
est P
enin
sula
Wes
t Yor
kshi
re
Kent
& M
edw
ay
Befo
rdsh
ire &
Her
tfors
hire
Esse
x
Gre
ater
Man
ches
ter
Tham
es V
alle
y
SE L
ondo
n
NE
Lond
on
SW
Lon
don
NW
Lon
don
NC
Lon
don
CKD QOF Prev CKD Prev 18+
Org Level Old SHA National Practice Code (All) SHA Name (All) SHA Short (All) PCT Short (All) SHA Code (All)
Old SHA
Data
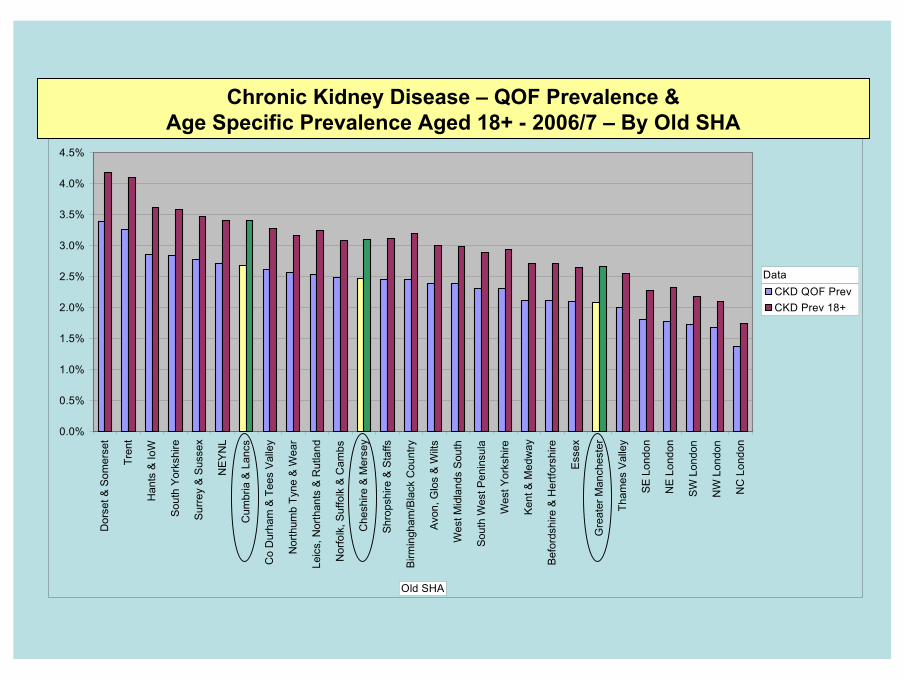
Chronic Kidney Disease – QOF Prevalence & Age Specific Prevalence Aged 18+ - 2006/7 – By Old SHA

0.0%
0.5%
1.0%
1.5%
2.0%
2.5%
3.0%
3.5%
4.0%
CKD QOF Prev CKD Prev 18+
CKD QOF Prev 2.8% 2.4% 2.4% 2.3% 2.2% 2.2% 2.2% 1.8% 1.6% 1.6%
CKD Prev 18+ 3.7% 3.0% 3.1% 2.9% 2.8% 2.8% 2.9% 2.3% 2.1% 2.0%
OLDHAM BURY SALFORD TRAFFORDASHTON LEIGH & WIGAN
HEYWOOD/MIDDLETON/R
OCHDALE
TAMESIDE & GLOSSOP STOCKPORT MANCHESTE
R BOLTON
Org Level SHA National Practice Code (All) Old SHA Greater Manchester SHA Short (All)
PCT Short
Data
Chronic Kidney Disease – QOF Prevalence & Age Specific Prevalence Aged 18+ - 2006/7 – By PCT
Greater Manchester

0.0%
2.0%
4.0%
6.0%
8.0%
10.0%
12.0%
14.0%
16.0%
N85
034
N85
008
N85
056
N85
032
N85
616
N85
018
N85
629
N85
041
N85
009
N85
059
N85
028
N85
007
N85
620
N85
058
N85
648
N85
619
N85
029
N85
015
N85
021
N85
046
N85
019
N85
040
N85
017
N85
038
N85
012
N85
023
N85
643
N85
002
N85
031
N85
053
N85
005
N85
024
N85
640
N85
016
N85
013
N85
054
N85
051
N85
617
N85
625
N85
014
N85
022
N85
011
N85
052
N85
020
N85
006
N85
048
N85
633
N85
614
N85
044
N85
624
N85
003
N85
634
N85
057
N85
004
N85
025
N85
635
N85
027
N85
037
N85
047
N85
001
N82
621
N82
050
N82
039
N82
087
N82
018
N82
106
N82
092
N82
109
N82
041
N82
657
N82
095
N82
086
N82
048
N82
070
N82
077
N82
024
N82
037
N82
033
N82
091
N82
646
N82
004
N82
081
N82
669
N82
090
N82
110
N82
647
N82
003
N82
115
N82
645
N82
093
N82
655
N82
679
N82
066
N82
084
N82
083
N82
104
N82
011
N82
053
N82
650
N82
651
N82
035
N82
100
N82
097
N82
663
N82
062
Y00
110
N82
641
N82
662
N82
059
N82
073
N82
113
N82
049
N82
633
N82
108
N82
014
N82
116
N82
060
N82
659
N82
082
N82
022
N82
052
N82
678
N82
046
N82
002
N82
058
N82
671
N82
019
N82
034
N82
103
N82
094
N82
117
N82
664
N82
001
N82
105
N82
670
N82
065
N82
054
N82
078
N82
026
N82
051
N82
623
N82
074
N82
649
N82
648
N82
089
N82
668
N82
107
N82
099
N82
076
N82
617
N82
079
N82
009
N82
676
N82
619
N82
665
N82
036
N82
067
N82
101
N82
021
N82
642
P81
742
P81
037
P81
073
P81
210
P81
086
P81
737
P81
091
P81
129
P81
079
P81
157
P81
077
P81
624
P81
149
P81
056
P81
775
P81
087
P81
031
P81
011
P81
089
P81
762
P81
059
P81
150
P81
745
Y01
008
P81
085
P81
092
P81
006
P81
128
P81
133
P81
191
P81
029
P81
064
P81
688
P81
013
P81
002
P81
668
P81
153
P81
190
P81
690
P81
125
P81
061
P81
214
P81
607
P81
694
P81
058
P81
155
P81
734
P81
704
P81
633
P81
707
P81
005
P81
721
P81
051
P81
167
P81
724
P81
622
P81
719
P81
643
P81
709
P81
712
P81
717
P81
683
P81
198
P81
204
P81
771
P81
022
P81
109
P81
140
P81
673
P81
752
P85
007
P85
017
P85
619
P85
008
P85
028
P85
002
P85
607
P85
011
P85
608
P85
010
P85
029
P85
012
P85
016
Y01
124
P85
605
P85
614
P85
005
Y00
473
P85
606
P85
006
P85
021
P85
026
P85
620
P85
018
P85
013
P85
601
P85
020
P85
615
P85
004
P85
019
P85
022
P89
006
P85
014
P85
003
P85
025
P85
009
P85
613
P85
612
P85
622
P85
603
P85
015
P85
610
P85
621
P85
602
P85
001
P85
024
P82
628
P82
022
P82
016
P82
013
P82
008
P82
626
P82
011
P82
001
P82
021
P82
019
P82
607
P82
634
P82
631
P82
652
P82
029
P82
004
P82
020
P82
633
P82
007
P82
613
P82
036
P82
609
P82
629
P82
009
P82
002
P82
037
P82
643
P82
003
P82
025
P82
005
P82
012
P82
627
P82
006
P82
624
P82
033
P82
030
P82
641
P82
014
P82
637
Y00
186
P82
034
P82
625
P82
010
P82
031
P82
642
P82
640
P82
650
P82
023
P82
615
P82
657
P82
015
P82
606
P82
660
P82
616
P82
018
P82
617
Y00
199
WIRRAL LIVERPOOL NORTH LANCS BLACKBURN/ DARWEN
OLDHAM BOLTON
Cheshire & Mersey Cumbria & Lancs Greater Manchester
CKD QOF Prev CKD Prev 18+
Org Level PCT SHA Short (All)
Old SHA PCT Short National Practice Code
Data
Chronic Kidney Disease – QOF Prevalence & Age Specific Prevalence Aged 18+ - 2006/7 – By General Practice
PCT with Lowest CKD
Prevalence In Greater
Manchester
PCT with Highest CKD Prevalence In
Greater Manchester
PCT with Highest CKD Prevalence In
Cheshire &Mersey
PCT with Lowest CKD
Prevalence In Cheshire &
Mersey
PCT with Highest CKD Prevalence In
Cumbria &Lancs
PCT with Lowest CKD
Prevalence In Cumbria &
Lancs

0%
10%
20%
30%
40%
50%
60%
70%
80%
90%
100%
% BP Last 15 mths % BP 140/85 or less % on ACE/ARB
% BP Last 15 mths 98.5% 98.3% 98.2% 98.2% 98.2% 98.2% 98.2% 98.1% 98.1% 98.0% 97.8%
% BP 140/85 or less 88.1% 87.5% 87.5% 90.1% 87.3% 84.2% 85.5% 86.9% 87.3% 87.1% 86.0%
% on ACE/ARB 83.9% 84.6% 83.3% 86.6% 83.8% 84.4% 83.3% 84.3% 84.2% 85.9% 83.8%
NORTH EAST
NORTH WEST
YORKSHIRE & HUMBE
SOUTH CENTR
AL
EAST OF
ENGLA
WEST MIDLAN
DS
EAST MIDLAN
DS
ENGLAND
SOUTH WEST
SOUTH EAST
COAST
LONDON
Org Level NATIONAL SHA Code (All) SHA Name (All) Old SHA (All) PCT Short (All) National Practice Code (All)
SHA Short
Data
Chronic Kidney Disease – QOF Performance - CKD2: Blood Pressure Measured in the Last 18 Months, CKD3: Blood Pressure 140/85 or Less &
CKD4: Hypertensives on ACE/ARB – QOF Results by SHA
BUTThe denominators For CKD2, CKD3& CKD4 are lower than the no. of
people on the CKD RegisterSEE NEXT SLIDE
SHAs
0%
10%
20%
30%
40%
50%
60%
70%
80%
90%
100%
NO
RTH
EA
ST
YOR
KSH
IRE
&H
UM
BER
WE
ST M
IDLA
ND
S
NO
RTH
WES
T
SOU
TH W
EST
EN
GLA
ND
EAS
T M
IDLA
ND
S
SO
UTH
EA
STC
OAS
T
EAST
OF
EN
GLA
ND
SO
UTH
CEN
TRAL
LON
DO
N
BP Measured as % of Register BP 140/85 or less as % of Register ACE/ARB as % of Register
Org Level NATIONAL SHA Code (All) SHA Name (All) Old SHA (All) SHA Short (All) National Practice Code (All)
PCT Short
Data
Chronic Kidney Disease – QOF – CKD2: Blood Pressure Measured in the Last 18 Months, CKD3: Blood Pressure 140/85 or Less & CKD4: Hypertensives on
ACE/ARB – As a % of those on the CKD Register
SHAs
This slide showsthe QOF Results
As a % of People on the CKD Register
QOF Results as reported
QOF Results as a % of peopleon the CKD
Register

Education
and System Redesign
EducationEducation


Iseki et al; Am J Kidney Dis 2006
eGFR and dipstick proteinuria add to predictend stage renal disease
n=95.252, follow-up: 17 years
0.01
0.1
1.0
10
100
1000
eGFR (mL/min)0 30 60 90 120
proteinuria negativeInci
denc
eof
ESR
D p
er 1
000
15
5 4 3 2 1 CKD stages

Iseki et al; Am J Kidney Dis 2006
eGFR and dipstick proteinuria add to predictend stage renal disease
n=95.252, follow-up: 17 years
0.01
0.1
1.0
10
100
1000
proteinuria positive
eGFR (mL/min)0 30 60 90 120
proteinuria negativeInci
denc
eof
ESR
D p
er 1
000
15
5 4 3 2 1 CKD stages
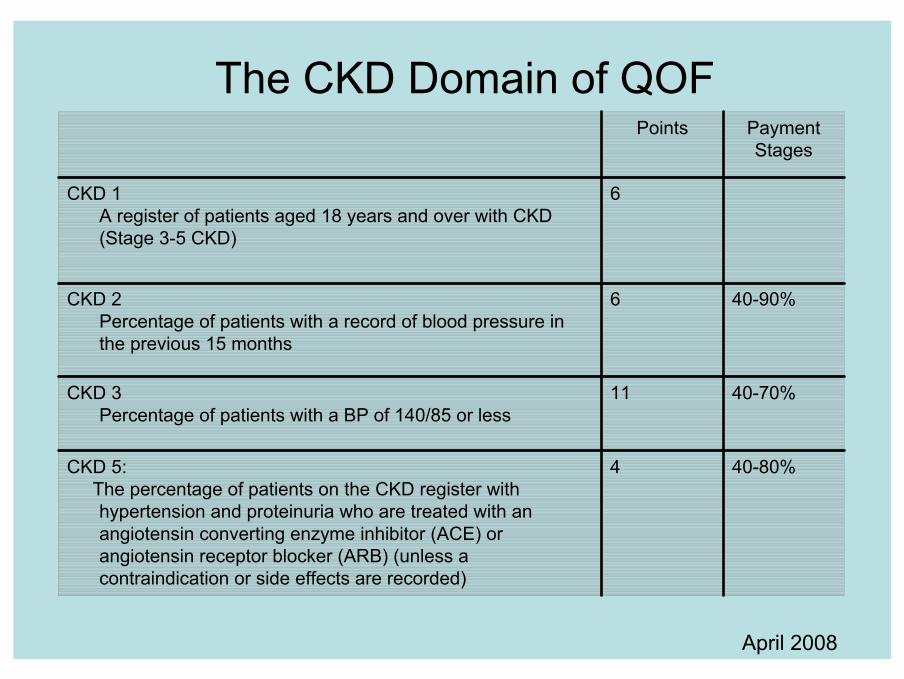
40-80%4CKD 5:The percentage of patients on the CKD register with hypertension and proteinuria who are treated with an angiotensin converting enzyme inhibitor (ACE) or angiotensin receptor blocker (ARB) (unless a contraindication or side effects are recorded)
40-70%11CKD 3Percentage of patients with a BP of 140/85 or less
40-90%6CKD 2Percentage of patients with a record of blood pressure in the previous 15 months
6CKD 1A register of patients aged 18 years and over with CKD (Stage 3-5 CKD)
PaymentStages
Points
The CKD Domain of QOF
April 2008

Impact of eGFR Reporting on Identification of CKD Stage 4
0
5
10
15
20
25
30
1 5 9 13 17 21 25 29 33 37 41 45 49 53 57 61 65 69
Weeks
Num
ber o
f new
pa
tient
s
Lincolnshire PCT

Timely initiation of RRT
Neuropathy/Retinopathy
AcidosisSmoking cessation
Timely access placement/
Transplant Listing
Drug interactionsCalcium Phosphate PTH
Glucose control
Informed choice of RRT/conservative
management
Vascular diseaseAnaemiaBP control
EducationCardiac diseaseMalnutritionACE inhibitors
Prepare for RRTModify co morbiditiesPrevent uraemic complications
Delay progression & reduce CVS Risk
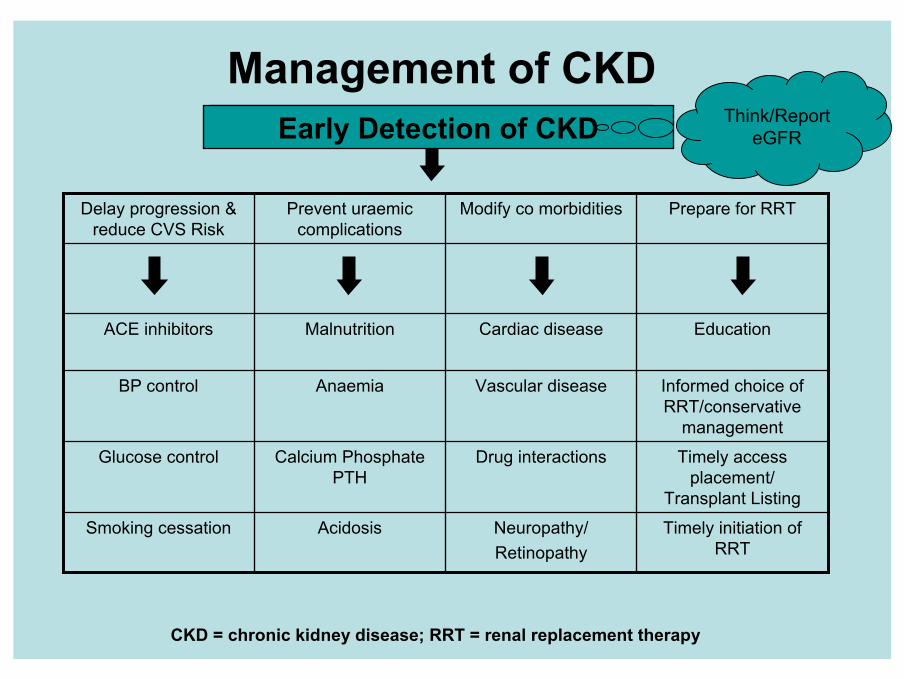
Management of CKD
CKD = chronic kidney disease; RRT = renal replacement therapy
Early Detection of CKD

Timely initiation of RRT
Neuropathy/Retinopathy
AcidosisSmoking cessation
Timely access placement/
Transplant Listing
Drug interactionsCalcium Phosphate PTH
Glucose control
Informed choice of RRT/conservative
management
Vascular diseaseAnaemiaBP control
EducationCardiac diseaseMalnutritionACE inhibitors
Prepare for RRTModify co morbiditiesPrevent uraemic complications
Delay progression & reduce CVS Risk
Management of CKD
CKD = chronic kidney disease; RRT = renal replacement therapy
Early Detection of CKDEarly Detection of CKD
Timely initiation of RRT
Neuropathy/Retinopathy
AcidosisSmoking cessation
Timely access placement/
Transplant Listing
Drug interactionsCalcium Phosphate PTH
Glucose control
Informed choice of RRT/conservative
management
Vascular diseaseAnaemiaBP control
EducationCardiac diseaseMalnutritionACE inhibitors
Prepare for RRTModify co morbiditiesPrevent uraemic complications
Delay progression & reduce CVS Risk
Management of CKD
CKD = chronic kidney disease; RRT = renal replacement therapy
Early Detection of CKDEarly Detection of CKD Think/Report eGFR

Education
Empowerment
Encouragement
Registration
Recall
Review
Individual
Care
Plans
Proteinuria = Risk
The Principles of Managed Kidney Care
Integration
Information Technology
Information
eGFR = % Kidney Function