managing seasonal hydrology with pv and battery storage in
TRANSCRIPT

Electricity Supply to Africa and Developing Economies: Challenges and Opportunities
Managing Seasonal Hydrology with PV and Battery Storage in an Asian
Country – Case Study
by Paul Tuson and Jacques de la Bat, Mott MacDonald Africa (Pty) Ltd
Introduction - Case Study
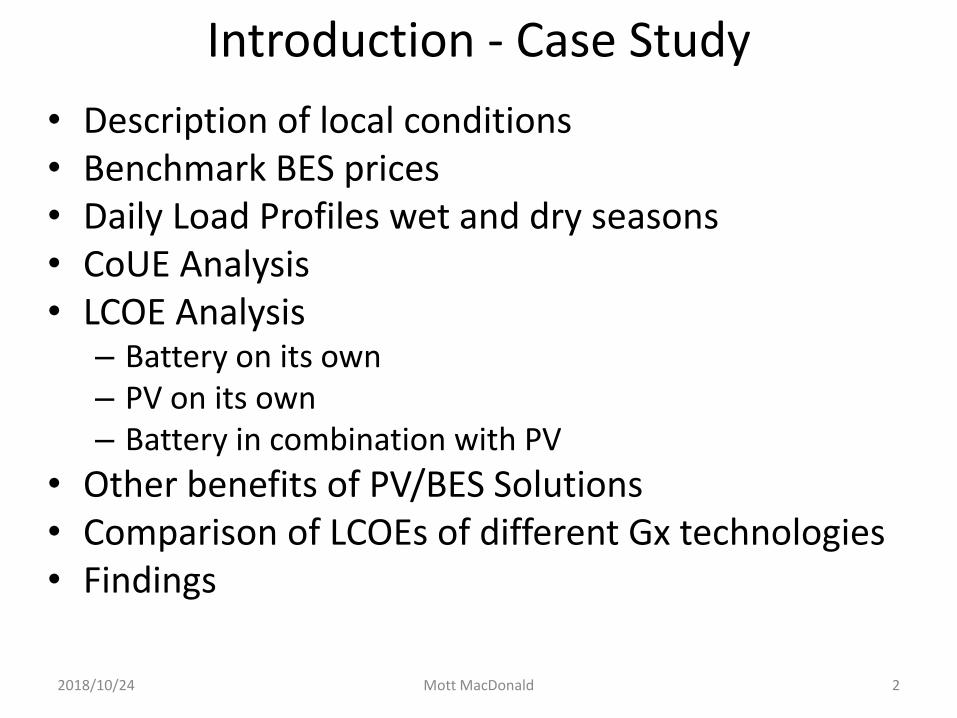
• Description of local conditions• Benchmark BES prices• Daily Load Profiles wet and dry seasons• CoUE Analysis• LCOE Analysis
– Battery on its own– PV on its own– Battery in combination with PV
• Other benefits of PV/BES Solutions• Comparison of LCOEs of different Gx technologies• Findings
2018/10/24 Mott MacDonald 2
Description of Local Country
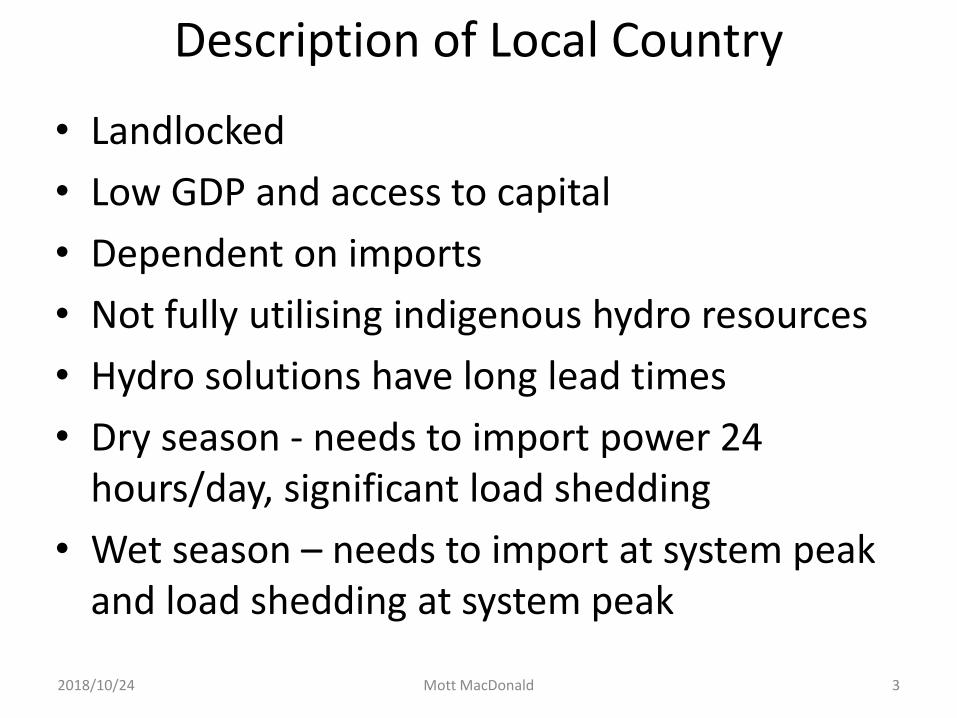
• Landlocked
• Low GDP and access to capital
• Dependent on imports
• Not fully utilising indigenous hydro resources
• Hydro solutions have long lead times
• Dry season - needs to import power 24 hours/day, significant load shedding
• Wet season – needs to import at system peak and load shedding at system peak
2018/10/24 Mott MacDonald 3

Daily Demand – 2018 – Wet Season
2018/10/24 Mott MacDonald 4

Daily Demand – 2018 – Dry Season
2018/10/24 Mott MacDonald 5
0,00
200,00
400,00
600,00
800,00
1000,00
1200,00
1400,00
1600,00
1 2 3 4 5 6 7 8 9 10 11 12 13 14 15 16 17 18 19 20 21 22 23 24
DEM
AN
D/S
UP
PLY
(MW
)
HOURS IN DAY
Daily Demand/Supply Curve
IPP Generation RoR Generation Peak RoR Storage Import
PV Generation Battery Storage Load Shedding Demand
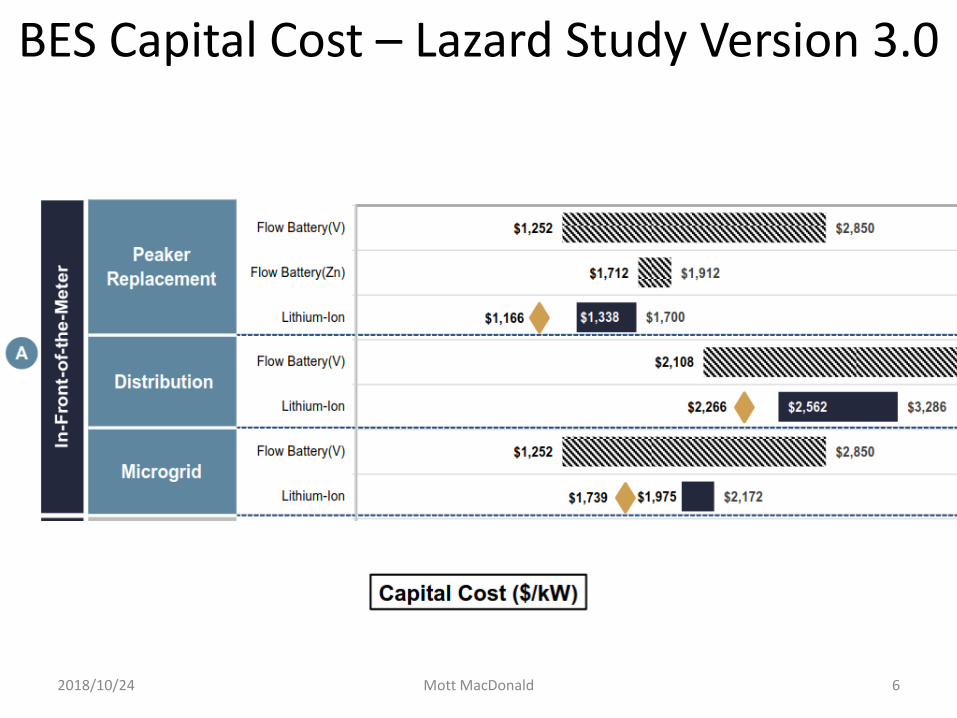
BES Capital Cost – Lazard Study Version 3.0
2018/10/24 Mott MacDonald 6

BES LCOE – Lazard Study Version 3.0
2018/10/24 Mott MacDonald 7

BES LCOE – Lazard Study Version 3.0
2018/10/24 Mott MacDonald 8

Benefits of PV/Battery Storage
• As per the LDC’s above, in the dry season, PV and Battery systems result in a direct reduction of load shedding.
• In wet season, the PV displaces imported power and the batteries reduce load shedding at system peak.
2018/10/24 Mott MacDonald 9

CoUE Calculations
2018/10/24 Mott MacDonald 10
• Country GDP = USD21.14bn• Annual energy consumption = 8.8TWh• COUE = GDP/Energy Consumed = USD2.4/kWh• Electricity shed annually = 1 204 000MWh• Annual Cost of load shedding = USD2.89bn
CoUE Savings from PV/BES Solution
2018/10/24 Mott MacDonald 11
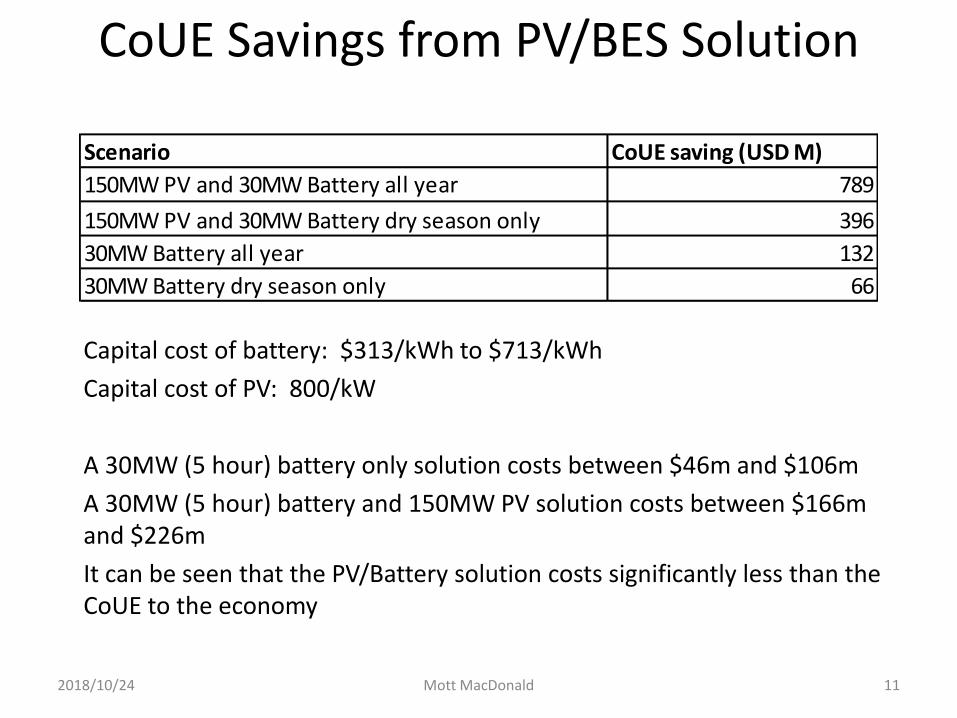
Scenario CoUE saving (USD M)
150MW PV and 30MW Battery all year 789
150MW PV and 30MW Battery dry season only 396
30MW Battery all year 132
30MW Battery dry season only 66
Capital cost of battery: $313/kWh to $713/kWh
Capital cost of PV: 800/kW
A 30MW (5 hour) battery only solution costs between $46m and $106m
A 30MW (5 hour) battery and 150MW PV solution costs between $166m and $226m
It can be seen that the PV/Battery solution costs significantly less than the CoUE to the economy

2018/10/24 Mott MacDonald 12
LCOE of PV+BES solution
Scenario Vanadium Flow (USD/kWh)Lithium Ion (USD/kWh)
150MW PV only 0.067 0.067
150MW PV and 30MW Battery with additional 30MW PV charging 0.114 0.101
150MW PV and 30MW Battery with Utility charging 0.116 0.104
30 MW Battery with 30MW PV charging 0.295 0.229
30MW Battery with NEA charging 0.305 0.243
2018/10/24 Mott MacDonald 13
Other Benefits of PV Battery Solution
• India import replacement (self-reliance/security)
• Peak replacement
• Capex deferral
• Local employment
• Diversification of energy supply
• Engineering capacity building
• Self-sufficiency in electricity supply

2018/10/24 Mott MacDonald 14
India Import Replacement
• India tariffs compared with 150MW PV and 30MW BES tariff
• India import tariffs
– 132kV import tariff = USc8.1/kWh
– 33kV import tariff = USc8.7/kWh
– 11kV import tariff = USc9.4/kWh
• India tariff currently cheaper by USD1.1m/annum
• India tariffs annual increase trajectory

2018/10/24 Mott MacDonald 15
Utility Tariff Peak Replacement
• Utility tariffs compared with 150MW PV and 30MW BES tariff
– Utility dry season tariff = USc12/kWh
– Utility monsoon season tariff = USc7/kWh
• Utility tariff currently cheaper by USD0.3m/annum
• Utility tariffs have an increase trajectory

2018/10/24 Mott MacDonald 16
Capital Deferral
• Assumption is the deferral of 1 x 50km 132kV line
• Interest on debt deferral benefits:
– 1 year deferral = USD1.7m
– 2 year deferral = USD2.1m
– 3 year deferral = USD2.6m
– 4 year deferral = USD2.8m
– 5 year deferral = USD2.9m

Comparison of LCOEs
• Hydro Generation: USc6/kWh
• PV generation: USc6.7/kWh
• Utility tariff: USc7/kWh to USc12/kWh
• Coal Generation: USc10/kWh
• Nuclear Generation: USc10/kWh
• India import tariff: USc8.1/kWh to USc9.4/kWh
• Battery Storage with PV: USc11.4/kWh
• Battery only: USc30/kWh
• Diesel/HFO generation: USc40/kWh
2018/10/24 Mott MacDonald 17

Conclusions
• The Asian country has a typical morning and evening peak demand profile
• Power supply from indigenous hydrology is very seasonal• Large amounts of load shedding takes place annually = 1 204 000
MWh• Load-shedding is costing the Asian country economy
$2.89bn/year• 150MW (30MW/150MWh) BES solutions can save the country
$789bn/year• The cost of a 150MW (30MW (5 hour)) PV/battery solution is less
than the cost of unserved energy displaced• LCOEs of different PV/BES solutions range from USc6.7/kWh to
USc30.5/kWh, however as PV and BES prices continue to drop, the LCOEs will improve
2018/10/24 Mott MacDonald 18

Conclusions
• PV/BES solutions provide other benefits:– System security (reduced reliance on India imports)– Utility peak replacement and related loss savings– Capital deferral– Local employment– Diversification of energy supply– Capacity building of engineering skills in the country– Self-sufficiency in electricity supply
• PV/BES solutions LCOEs begin at USc 11.4/kWh which is higher than current utility or India import electricity solutions however PV/BES prices are dropping and the utility tariffs are not cost-reflective and the utility and import tariffs are increasing annually
• PV/BES solutions have LCOEs significantly lower than back-up diesel generation
• Solar/PV solutions can be installed in under 12 months with min
2018/10/24 Mott MacDonald 19

Thank you
2018/10/24 Mott MacDonald 20