managing scope changes for cellular network-level …sanneck.net/research/publications/papers/iwson...
TRANSCRIPT
Managing Scope Changes for CellularNetwork-level Anomaly Detection
Gabriela F. Ciocarlie∗, Chih-Chieh Cheng∗, Christopher Connolly∗,Ulf Lindqvist∗, Szabolcs Novaczki†, Henning Sanneck†, Muhammad Naseer-ul-Islam†
∗SRI International{gabriela.ciocarlie,chih-chieh.cheng,christopher.connolly,ulf.lindqvist}@sri.com
†NSN Research{szabolcs.novaczki,henning.sanneck,muhammad.naseer-ul-islam}@nsn.com
Abstract—The Self-Organizing Networks (SON) concept isincreasingly being used as an approach for managing complex,dynamic mobile radio networks. In this paper we focus on the ver-ification component of SON, which is the ability to automaticallydetect problems such as performance degradation or networkinstability stemming from configuration management changes. Inprevious work, we have shown how Key Performance Indicators(KPIs) that are continuously collected from network cells can beused in an anomaly detection framework to characterize the stateof the network. In this study, we introduce new methods designedto handle scope changes. Such changes can include the addition ofnew KPIs or cells in the network, or even re-scoping the analysisfrom the level of a cell or group of cells to the network level.Our results, generated using real cellular network data, suggestthat the proposed network-level anomaly detection can adapt tosuch changes in scope and accurately identify different networkstates based on all types of available KPIs.
Index Terms—network automation, self-organized networks(SON), SON verification, anomaly detection, diagnosis
I. INTRODUCTION
Modern radio networks for mobile broadband (voice anddata) are complex and dynamic, not only in terms of behaviorand mobility of users and their devices, but also in terms ofthe many elements that make up the network infrastructure.Effective management of such networks requires some formof automated detection of problems such as performancedegradation or network instability. In order to prevent network-level degradation, either the actions that change network-element configurations must be coordinated a priori, or theireffects must be verified by a SON verification framework.
A. SON Verification
In previous work [5], we proposed a novel SON verifi-cation framework that uses anomaly detection and diagnosistechniques and operates within a certain spatial scope largerthan an individual cell, e.g., a small group of cells or cellcluster being in scope for a SON optimization, an existingadministrative network domain, etc. Key Performance Indica-tors (KPIs) are continuously collected from network cells andused as indicators (e.g., call-drop statistics, channel-quality-indicator statistics, handover statistics, throughput, etc.) fornetwork performance.
The first component of the SON verification framework [5]was the network-level anomaly detection component, which
Cluster(1(
Cluster(2(
Cluster(m(
Illustra(on+of+Topic+Modeling+
Types(of((network(states(
Features(((raw(KPIs)(
Codebooks+
KPI+1+
KPI+2+
KPI+n+
…..+
KPI+1+
KPI+n+
…..+
KPI+1+
KPI+n+
…..+KPI+2+ KPI+2+
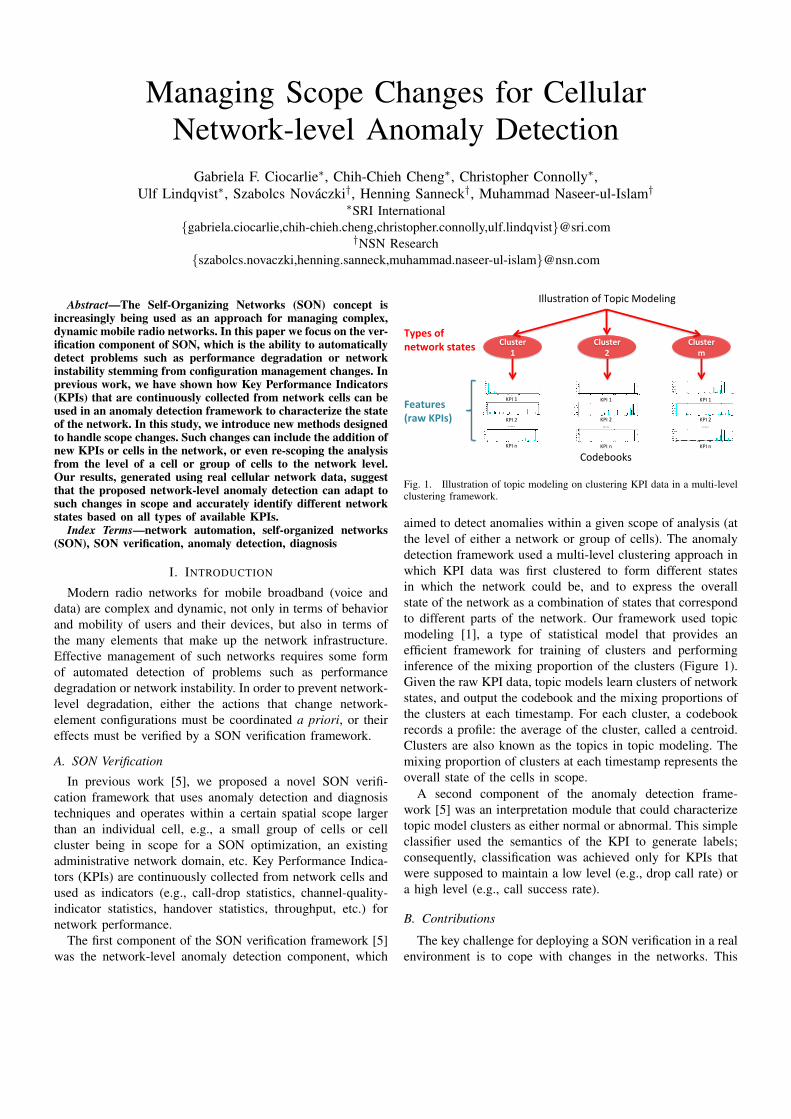
Fig. 1. Illustration of topic modeling on clustering KPI data in a multi-levelclustering framework.
aimed to detect anomalies within a given scope of analysis (atthe level of either a network or group of cells). The anomalydetection framework used a multi-level clustering approach inwhich KPI data was first clustered to form different statesin which the network could be, and to express the overallstate of the network as a combination of states that correspondto different parts of the network. Our framework used topicmodeling [1], a type of statistical model that provides anefficient framework for training of clusters and performinginference of the mixing proportion of the clusters (Figure 1).Given the raw KPI data, topic models learn clusters of networkstates, and output the codebook and the mixing proportions ofthe clusters at each timestamp. For each cluster, a codebookrecords a profile: the average of the cluster, called a centroid.Clusters are also known as the topics in topic modeling. Themixing proportion of clusters at each timestamp represents theoverall state of the cells in scope.
A second component of the anomaly detection frame-work [5] was an interpretation module that could characterizetopic model clusters as either normal or abnormal. This simpleclassifier used the semantics of the KPI to generate labels;consequently, classification was achieved only for KPIs thatwere supposed to maintain a low level (e.g., drop call rate) ora high level (e.g., call success rate).
B. Contributions
The key challenge for deploying a SON verification in a realenvironment is to cope with changes in the networks. This
paper proposes novel methods for managing scope changeswhich are prevalent in real cellular networks. Our implemen-tation and experiments focus on the problem of adapting tochanges in the types of KPIs and cells, and also changes inthe analysis scope that span smaller to larger group of cells.The work described here provides several contributions by:
• proposing a novel approach that uses cell-level degra-dation information as features for the topic modeling toadapt to all KPIs,
• applying an incremental topic modeling approach thatcan adapt to changes in the analysis scope, and operatesacross all KPIs,
• building a system to implement the algorithms, applyingthe system to a real KPI dataset, and analyzing theperformance of the proposed framework.
II. NETWORK-LEVEL ANOMALY DETECTION AND SCOPECHANGES
Due to the dynamic nature of cellular networks, the scopeof anomaly detection analysis can change with the additionof new KPIs or cells in the network, or from the levelof a cell or group of cells up to the network. The firststep towards addressing scope changes was to consider theneutral KPIs (e.g., throughput), which were not included inthe original framework. Neutral KPIs exhibit an operatingarea, which is deployment-specific with both a lower andupper bound. Hence, they cannot be directly used by thetopic modeling component because the interpretation modulecannot interpret them. To address this, we propose to combineanomaly detection capabilities applied at different scopes: celllevel and group/network levels.
Another important aspect of our SON verification frame-work is adaptability to different cell scopes (increased ordecreased number of cells in the scope). With the previousapproach [5], clustering is first applied for the largest scope(the largest number of cells) and then, the state of the networkcan be determined for subsets of the largest number of cells.However, in a real deployment, if the scope needs to beenlarged (e.g., when new cells are added to the network), wewould require an incremental approach for topic modeling,which will gradually update the clusters with information fromthe larger scope. Consequently, we propose an incrementalapproach for topic modeling.
A. Topic Modeling Using Neutral KPIs
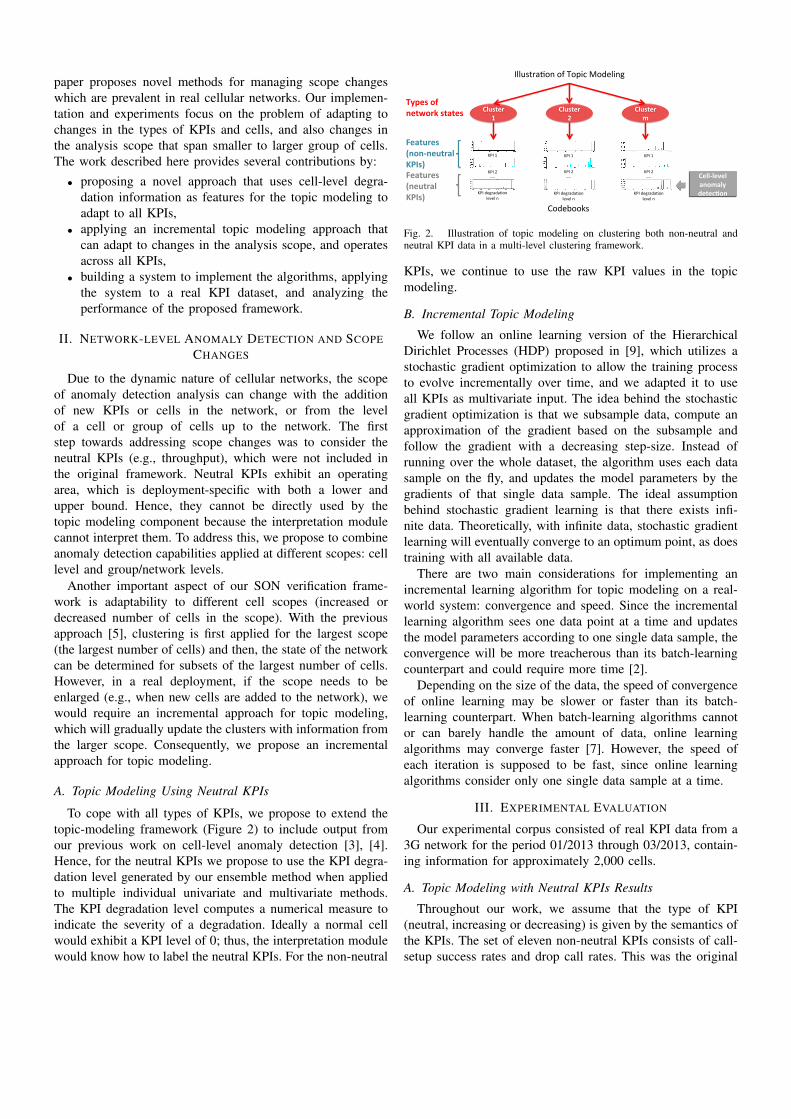
To cope with all types of KPIs, we propose to extend thetopic-modeling framework (Figure 2) to include output fromour previous work on cell-level anomaly detection [3], [4].Hence, for the neutral KPIs we propose to use the KPI degra-dation level generated by our ensemble method when appliedto multiple individual univariate and multivariate methods.The KPI degradation level computes a numerical measure toindicate the severity of a degradation. Ideally a normal cellwould exhibit a KPI level of 0; thus, the interpretation modulewould know how to label the neutral KPIs. For the non-neutral
Cluster(1(
Cluster(2(
Cluster(m(
Illustra(on+of+Topic+Modeling+
Types(of((network(states(
Features(((non7neutral((KPIs)(
Codebooks+
KPI+1+
KPI+2+
KPI+degrada(on+level+n+
…..+
KPI+1+
KPI+degrada(on+level+n+
…..+
KPI+1+
KPI+degrada(on+level+n+
…..+KPI+2+ KPI+2+Features((
(neutral((KPIs)(
Cell7level(anomaly(detec?on(
Fig. 2. Illustration of topic modeling on clustering both non-neutral andneutral KPI data in a multi-level clustering framework.
KPIs, we continue to use the raw KPI values in the topicmodeling.
B. Incremental Topic Modeling
We follow an online learning version of the HierarchicalDirichlet Processes (HDP) proposed in [9], which utilizes astochastic gradient optimization to allow the training processto evolve incrementally over time, and we adapted it to useall KPIs as multivariate input. The idea behind the stochasticgradient optimization is that we subsample data, compute anapproximation of the gradient based on the subsample andfollow the gradient with a decreasing step-size. Instead ofrunning over the whole dataset, the algorithm uses each datasample on the fly, and updates the model parameters by thegradients of that single data sample. The ideal assumptionbehind stochastic gradient learning is that there exists infi-nite data. Theoretically, with infinite data, stochastic gradientlearning will eventually converge to an optimum point, as doestraining with all available data.
There are two main considerations for implementing anincremental learning algorithm for topic modeling on a real-world system: convergence and speed. Since the incrementallearning algorithm sees one data point at a time and updatesthe model parameters according to one single data sample, theconvergence will be more treacherous than its batch-learningcounterpart and could require more time [2].
Depending on the size of the data, the speed of convergenceof online learning may be slower or faster than its batch-learning counterpart. When batch-learning algorithms cannotor can barely handle the amount of data, online learningalgorithms may converge faster [7]. However, the speed ofeach iteration is supposed to be fast, since online learningalgorithms consider only one single data sample at a time.
III. EXPERIMENTAL EVALUATION
Our experimental corpus consisted of real KPI data from a3G network for the period 01/2013 through 03/2013, contain-ing information for approximately 2,000 cells.
A. Topic Modeling with Neutral KPIs Results
Throughout our work, we assume that the type of KPI(neutral, increasing or decreasing) is given by the semantics ofthe KPIs. The set of eleven non-neutral KPIs consists of call-setup success rates and drop call rates. This was the original

Fig. 3. Comparison between the cluster weights when using only the non-neutral KPIs (left) and when using all KPIs (right). Each row represents the weightsfor one cluster over time, where the x-axis denotes the time, and the y-axis denotes the weight. There are different numbers of clusters (6, respectively 7)and the order in which the clusters were number does not imply a one-to-one mapping. The mid-February anomaly is circled in red.
set of KPIs that was used in the previous work [5]. The neutralKPIs set includes throughput KPIs. These are the new KPIsfor which topic modeling uses the KPI degradation level basedon the ensemble method for cell anomaly detection [3], [4]instead of the raw KPI values.
For our initial experiments, we considered 100 handpickedcells and analyzed them for the period January 2013 to March2013. The goal was to first determine if the KPI levels provideuseful information on the network status before expending toa larger number of cells.
Figure 3 presents a comparison between the cluster weightsthat were generated using only the non-neutral KPIs (left) andusing all KPIs (right). Each row represents the weights forone cluster over time, where the x-axis denotes the time, andthe y-axis denotes the weight. Note that there are differentnumbers of clusters for the two cases (6, respectively 7) andthe order in which clusters were numbered does not imply aone-to-one mapping, i.e., if Cluster 2 corresponds to a normalstate in one case, Cluster 2 might not correspond to the samestate for the other case. However, in both cases, we notice themid-February anomaly that we referred to in the previous work(for Cluster 2, respectively Cluster 5) [5]. We recall that thenumber of clusters can be different because the topic modelingimplementation uses an HDP [8] approach, which determinesthe number of topics automatically.
Table I summarizes the analysis of the 6 and 7 clusters,respectively. The analysis included a manual investigationof the histograms of each cluster (which lead to detailedcharacteristics), and has been confirmed by the automatedcluster interpretation module (which provided either normalor abnormal labels for each cluster). We notice that Cluster2 for the baseline case and Cluster 5 for the case with allKPIs correspond to strong anomalies across all 11 raw KPIs
Baseline: 11 raw KPIs 11 raw KPIs + KPI degradationlevels of new KPIs
Cluster 0 Normal NormalCluster 1 Periodicity of some KPIs Minor anomalyCluster 2 Strong anomaly Normal, shows some periodicityCluster 3 Bad DCR cs voice Normal, shows some periodicityCluster 4 Minor anomaly, Anomaly conditions in the new
periodicity of some KPIs 9 KPIs (11 raw KPIs are normal)Cluster 5 Bad cell availability Strong anomaly in 11 raw KPIsCluster 6 N/A Bad DCR cs voice
TABLE ISUMMARY OF THE ANALYSIS FOR EACH CLUSTER AND FOR EACH CASE.
NOTE THAT THERE IS NO ONE-TO-ONE MAPPING BETWEEN THE CLUSTERSGENERATED FOR THE TWO CASES.
Fig. 4. Cluster weights for Cluster 12 for February. We notice thepredominant anomaly in mid February.
exhibited in mid-February. Overall, the KPI levels seem toprovide some discrimination on the network status, given theappearance of Cluster 4, which is characterized by abnormali-ties in the neutral KPIs. The rest of the clusters correspond tovery similar states without a one-to-one mapping (i.e., differenttypes of clusters were generated in different order for the twocases).
Given that the results on the small sample of cellsindicated that the neutral KPIs could discriminate evenbetter the network state, we further performed our analysison the 2,000 cells. The total number of timestamps was
Cluster(#(12:(histograms(of(KPIs(
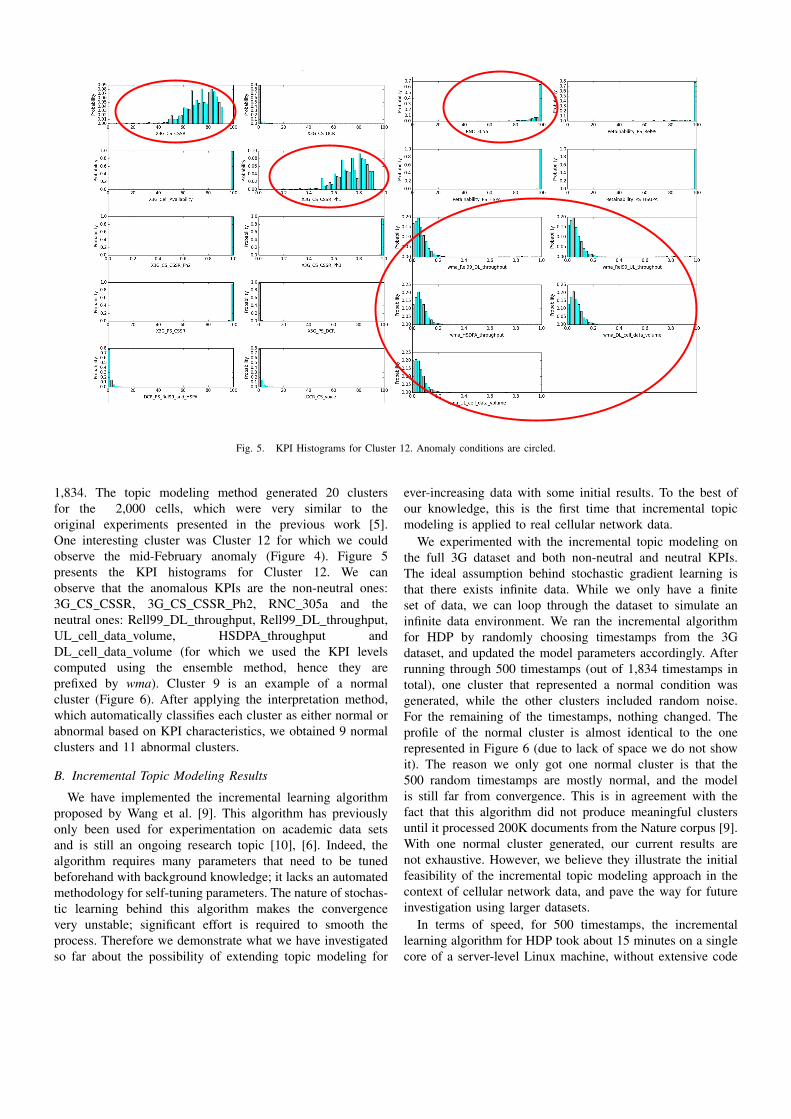
Anomaly conditions are circled. Normal KPIs and KPI levels are supposed to be 0 or 1 (100). Fig. 5. KPI Histograms for Cluster 12. Anomaly conditions are circled.
1,834. The topic modeling method generated 20 clustersfor the 2,000 cells, which were very similar to theoriginal experiments presented in the previous work [5].One interesting cluster was Cluster 12 for which we couldobserve the mid-February anomaly (Figure 4). Figure 5presents the KPI histograms for Cluster 12. We canobserve that the anomalous KPIs are the non-neutral ones:3G CS CSSR, 3G CS CSSR Ph2, RNC 305a and theneutral ones: Rell99 DL throughput, Rell99 DL throughput,UL cell data volume, HSDPA throughput andDL cell data volume (for which we used the KPI levelscomputed using the ensemble method, hence they areprefixed by wma). Cluster 9 is an example of a normalcluster (Figure 6). After applying the interpretation method,which automatically classifies each cluster as either normal orabnormal based on KPI characteristics, we obtained 9 normalclusters and 11 abnormal clusters.
B. Incremental Topic Modeling Results
We have implemented the incremental learning algorithmproposed by Wang et al. [9]. This algorithm has previouslyonly been used for experimentation on academic data setsand is still an ongoing research topic [10], [6]. Indeed, thealgorithm requires many parameters that need to be tunedbeforehand with background knowledge; it lacks an automatedmethodology for self-tuning parameters. The nature of stochas-tic learning behind this algorithm makes the convergencevery unstable; significant effort is required to smooth theprocess. Therefore we demonstrate what we have investigatedso far about the possibility of extending topic modeling for
ever-increasing data with some initial results. To the best ofour knowledge, this is the first time that incremental topicmodeling is applied to real cellular network data.
We experimented with the incremental topic modeling onthe full 3G dataset and both non-neutral and neutral KPIs.The ideal assumption behind stochastic gradient learning isthat there exists infinite data. While we only have a finiteset of data, we can loop through the dataset to simulate aninfinite data environment. We ran the incremental algorithmfor HDP by randomly choosing timestamps from the 3Gdataset, and updated the model parameters accordingly. Afterrunning through 500 timestamps (out of 1,834 timestamps intotal), one cluster that represented a normal condition wasgenerated, while the other clusters included random noise.For the remaining of the timestamps, nothing changed. Theprofile of the normal cluster is almost identical to the onerepresented in Figure 6 (due to lack of space we do not showit). The reason we only got one normal cluster is that the500 random timestamps are mostly normal, and the modelis still far from convergence. This is in agreement with thefact that this algorithm did not produce meaningful clustersuntil it processed 200K documents from the Nature corpus [9].With one normal cluster generated, our current results arenot exhaustive. However, we believe they illustrate the initialfeasibility of the incremental topic modeling approach in thecontext of cellular network data, and pave the way for futureinvestigation using larger datasets.
In terms of speed, for 500 timestamps, the incrementallearning algorithm for HDP took about 15 minutes on a singlecore of a server-level Linux machine, without extensive code

Cluster(#(9:(An(example(of(normal(cluster(
Fig. 6. Example of a normal cluster: Cluster 9
optimization. As a comparison, when the original HDP istrained, it takes 1-2 hours for one sweep of the same dataset onthe same machine; convergence is usually achieved in about 20iterations (sweeps of data). On a real deployment system, theincremental algorithm would update the model incrementally,whenever a new set of KPIs is collected from the cells. Thisaction will take only a few seconds.
IV. CONCLUSIONS
This paper proposes novel extensions to a SON verificationframework, designed to manage scenarios where the scopechanges with the addition of new KPIs or cells in the network,or from the level of a cell or group of cells to the networklevel. The design was implemented and applied to a datasetconsisting of KPI data collected from a real operational cellnetwork. The experimental results suggest that the augmentednetwork-level anomaly detection accurately identifies differentnetwork states based on all types of KPIs and can adapt tochanges in scope. We are currently planning to apply theincremental topic modeling to a larger dataset (when available)and to explore techniques for tuning relevant parameters suchas model priors, learning rate and annealing temperature, toachieve convergence.
ACKNOWLEDGMENT
We thank Lauri Oksanen, Kari Aaltonen, Michael Freed andKenneth Nitz for valuable feedback.
REFERENCES
[1] David Blei, Lawrence Carin, and David Dunson. Probabilistic TopicModels. IEEE Signal Processing Magazine, 27(6): 5565. 2010.
[2] Leon Bottou, Online Algorithms and Stochastic Approximations, OnlineLearning and Neural Networks, Edited by David Saad, Cambridge Uni-versity Press, Cambridge, UK, 1998.
[3] Gabriela F. Ciocarlie, Ulf Lindqvist, Szabolcs Novaczki, and HenningSanneck, Detecting Anomalies in Cellular Networks Using an EnsembleMethod, 9th International Conference on Network and Service Manage-ment (CNSM), 2013.
[4] Gabriela F. Ciocarlie, Ulf Lindqvist, Kenneth Nitz, Szabolcs Novaczkiand Henning Sanneck, On the Feasibility of Deploying Cell AnomalyDetection in Operational Cellular Networks , IEEE/IFIP Network Opera-tions and Management Symposium (NOMS), Experience Session, 2014.
[5] Gabriela F. Ciocarlie, Christopher Connolly, Chih-Chieh Cheng, UlfLindqvist, Szabolcs Novaczki, Henning Sanneck, MuhammadNaseer-ul-Islam, Anomaly Detection and Diagnosis for Automatic Radio NetworkVerification , Submitted to the 6th International Conference on MobileNetworks and Managemen (MONAMI), 2014.
[6] D. Kim, P. Gopalan, D. Blei, and E. Sudderth, Efficient online infer-ence for Bayesian nonparametric relational models, Neural InformationProcessing Systems, 2013.
[7] Yann Le Cun, Leon Bottou, Genevieve B. Orr and Klaus-Robert Muller,Efficient Backprop, Neural Networks, Tricks of the Trade, Lecture Notesin Computer Science LNCS 1524, Springer Verlag, 1998.
[8] Yee Whye Teh, Michael I. Jordan, Matthew J. Beal and David M. Blei,Hierarchical Dirichlet Processes., Journal of the American StatisticalAssociation 101, 476: 1566-1581, 2006.
[9] Chong Wang, John Paisley and David M. Blei. Online variational infer-ence for the hierarchical Dirichlet process, In AISTATS 2011.
[10] C. Wang and D. Blei, Truncation-free stochastic variational inference forBayesian nonparametric models, Neural Information Processing Systems,2012.