managing quality 12 july 2001. introduction what: quality in operations management where: quality...
Post on 21-Dec-2015
218 views
TRANSCRIPT

Managing Quality
12 July 2001

Introduction What: quality in operations
management Where: Quality affects all goods
and services Why: Customers demand quality

What is Quality High quality products Low quality products What does quality mean to you?
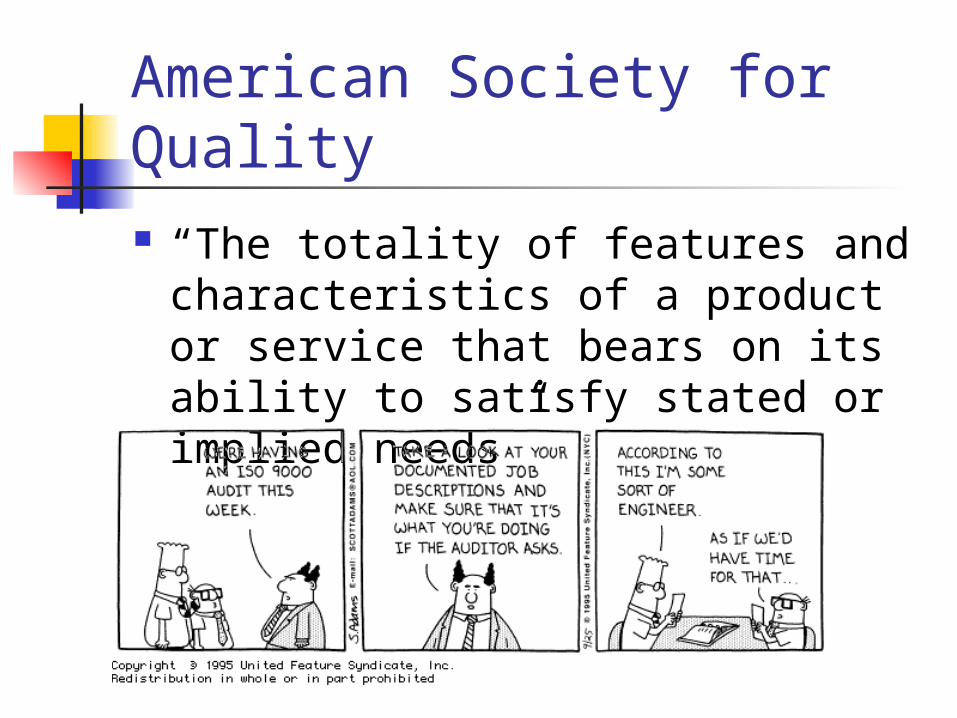
American Society for Quality “The totality of features and
characteristics of a product or service that bears on its ability to satisfy stated or implied needs”

User-Based Definition “Quality lies in the eye of the
beholder” Higher quality = better
performance Higher quality = nicer features
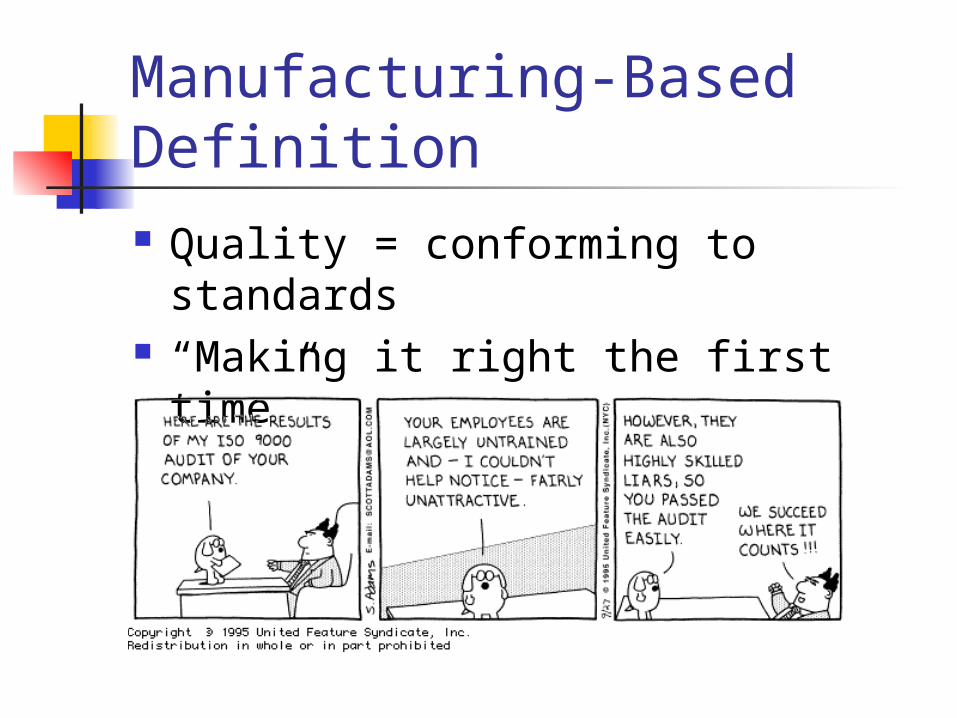
Manufacturing-Based Definition Quality = conforming to standards “Making it right the first time”

Product-Based Definition Quality = a measurable variable

Our Definition Quality: The ability of a product or
service to meet customer needs

Implications of Quality Company Reputation Product Liability Global Implications

Global Implications National Quality Awards: US: Malcolm Baldridge National
Quality Award Japan: Deming Prize Canada: National Quality Institute
Canada Awards for Excellence

Canada Award Winners 2000 Aeronautical and Technical
Services British Columbia Transplant
Society Delta Hotels Honeywell Water Controls Business
Unit

Quality and Strategy Differentiation Cost Leader Response

Quality and Profitability
Improved Quality Increased Profits
Sales Gains•Improved Response•Higher Prices•Improved Reputation
Reduced Costs•Increased Productivity•Lower Rework, Scrap•Lower Warranty Costs

Costs of Quality Prevention Costs Appraisal Costs Internal Failure External Costs
International Standards ISO 9000 Establish quality management
procedures Documented processes Work Instructions Record Keeping
Does NOT tell you how to make a product!
Total Quality Management TQM – Total Quality Management Quality emphasis throughout an
organization From suppliers through to
customers
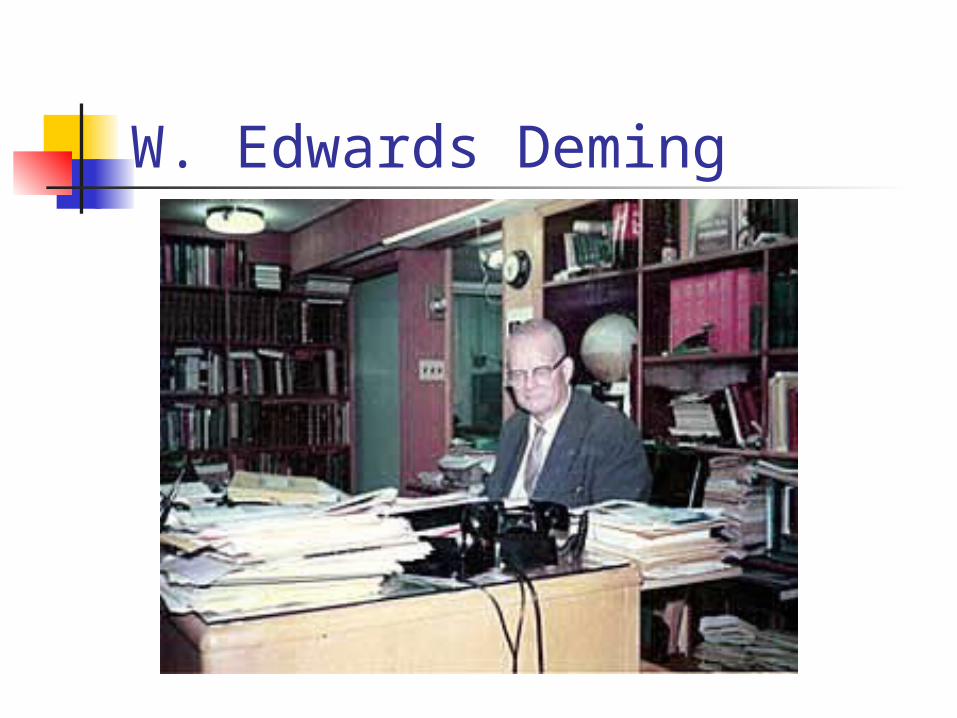
W. Edwards Deming
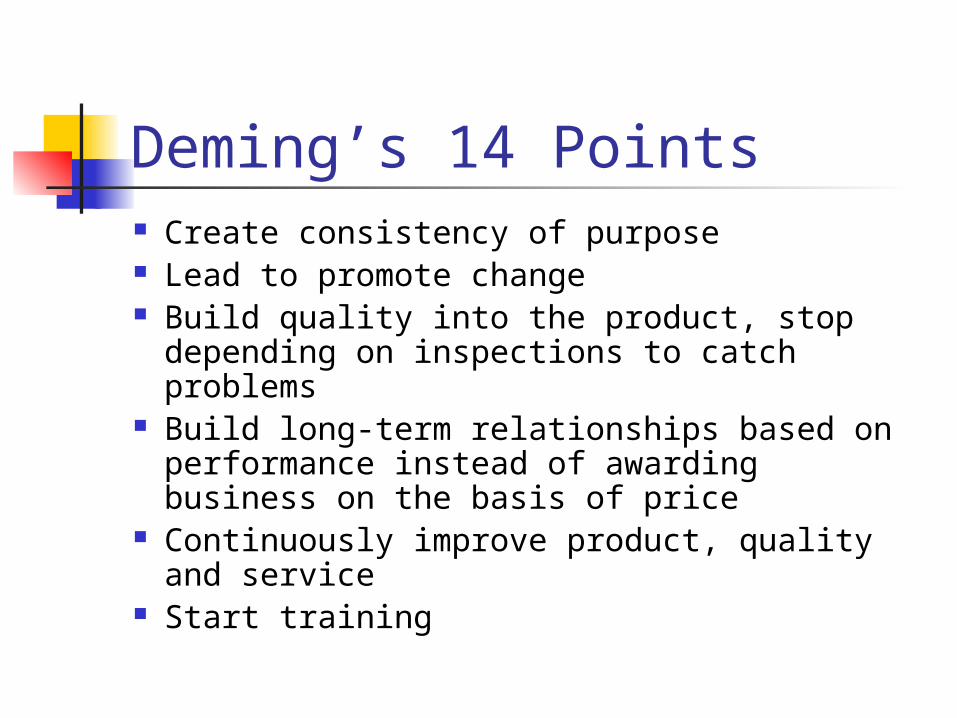
Deming’s 14 Points Create consistency of purpose Lead to promote change Build quality into the product, stop
depending on inspections to catch problems Build long-term relationships based on
performance instead of awarding business on the basis of price
Continuously improve product, quality and service
Start training

Deming’s 14 Points Emphasize leadership Drive out fear Break down barriers between departments Stop haranguing workers Support, help and improve Remove barriers to pride in work Institute a vigorous program of education
and self-improvement Put everybody in the company to work on
transformation

TQM Concepts Continuous Improvement Employee Empowerment Benchmarking Just-In-Time Taguchi Knowledge of Tools
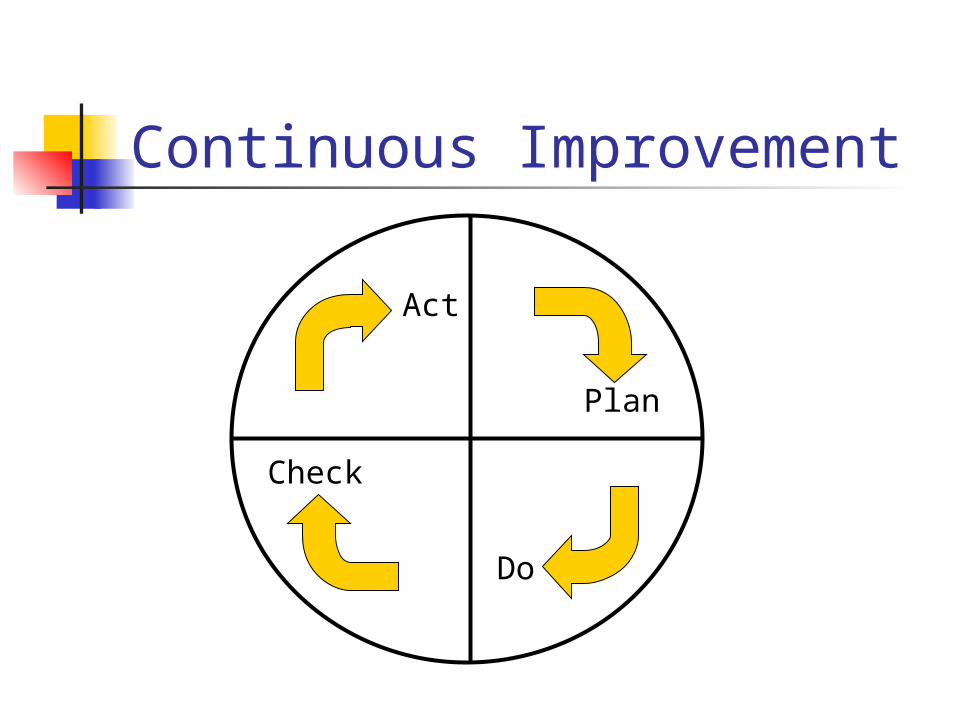
Continuous Improvement
Plan
Do
Check
Act

Continuous Improvement Kaizen Zero Defects Six Sigma

Employee Empowerment Involve employees in every step of
production High involvement by those who
understand the shortcomings of the system
Quality circle
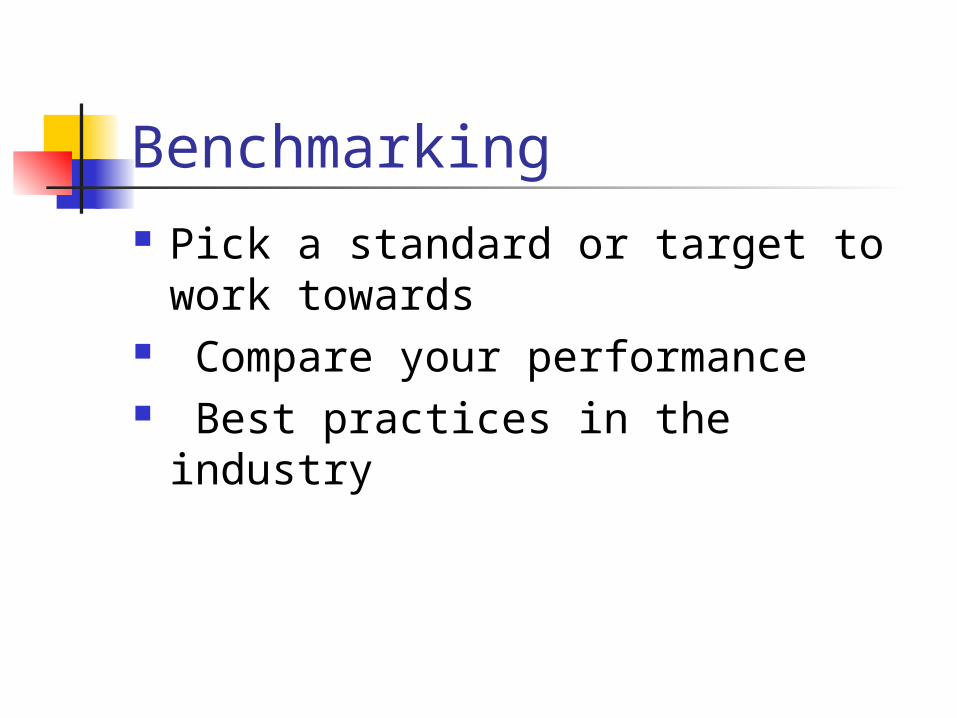
Benchmarking Pick a standard or target to work
towards Compare your performance Best practices in the industry
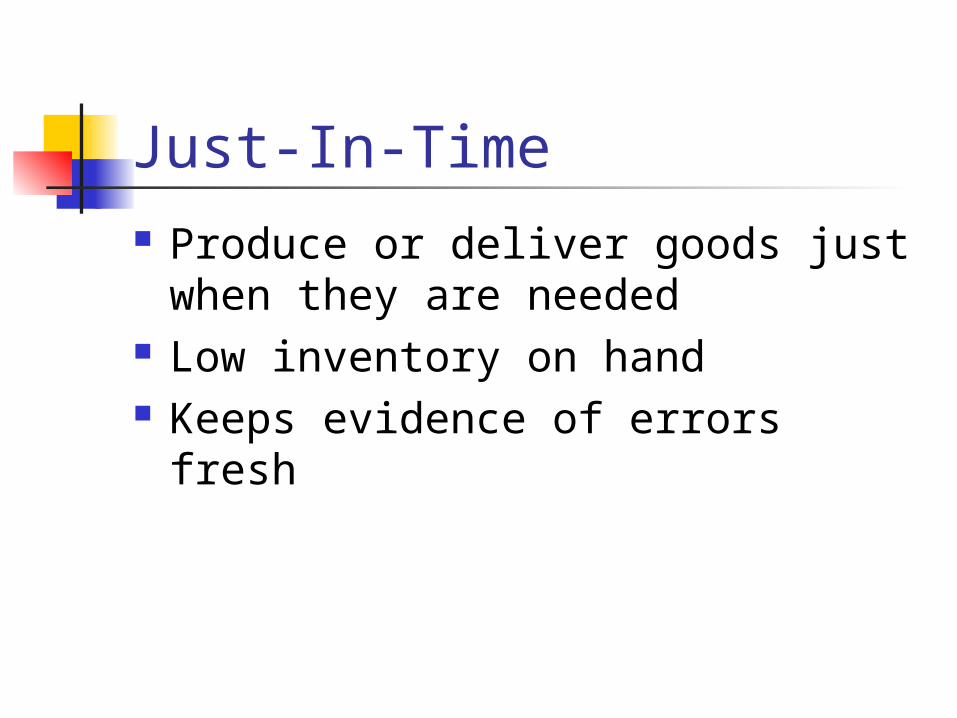
Just-In-Time Produce or deliver goods just when
they are needed Low inventory on hand Keeps evidence of errors fresh

Taguchi Concepts Quality robustness Quality Loss Function Target-oriented Quality

TQM Tools Check Sheet Scatter Diagram Cause and effect diagram (fishbone) Pareto Chart – 80-20 Rule Flow Charts Histogram Statistical Process Control

Inspection Attribute Inspection Variable Inspection
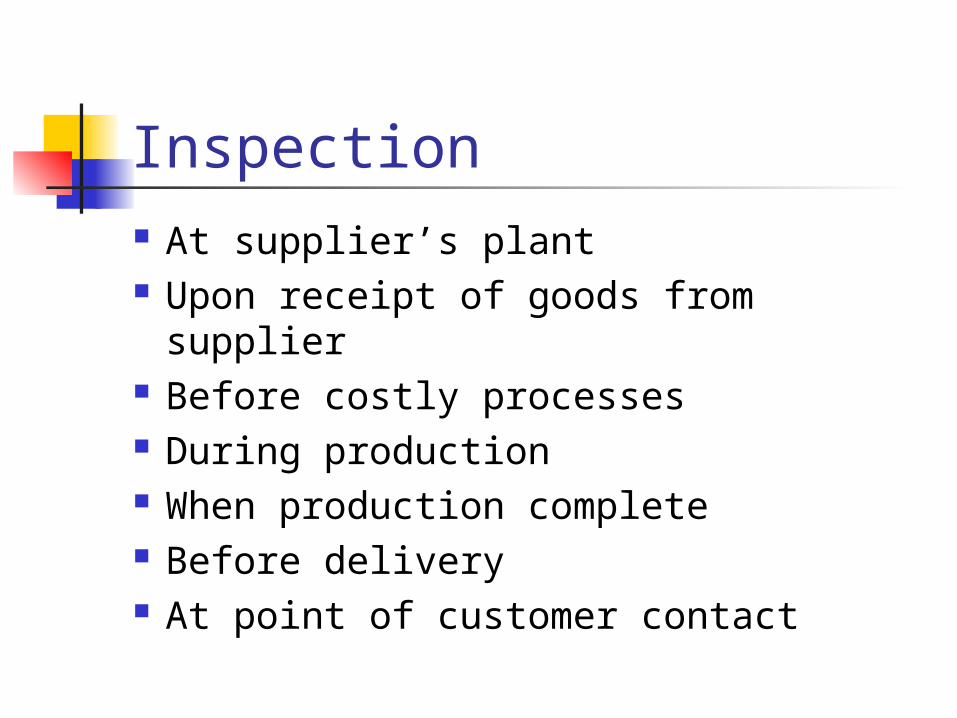
Inspection At supplier’s plant Upon receipt of goods from supplier Before costly processes During production When production complete Before delivery At point of customer contact
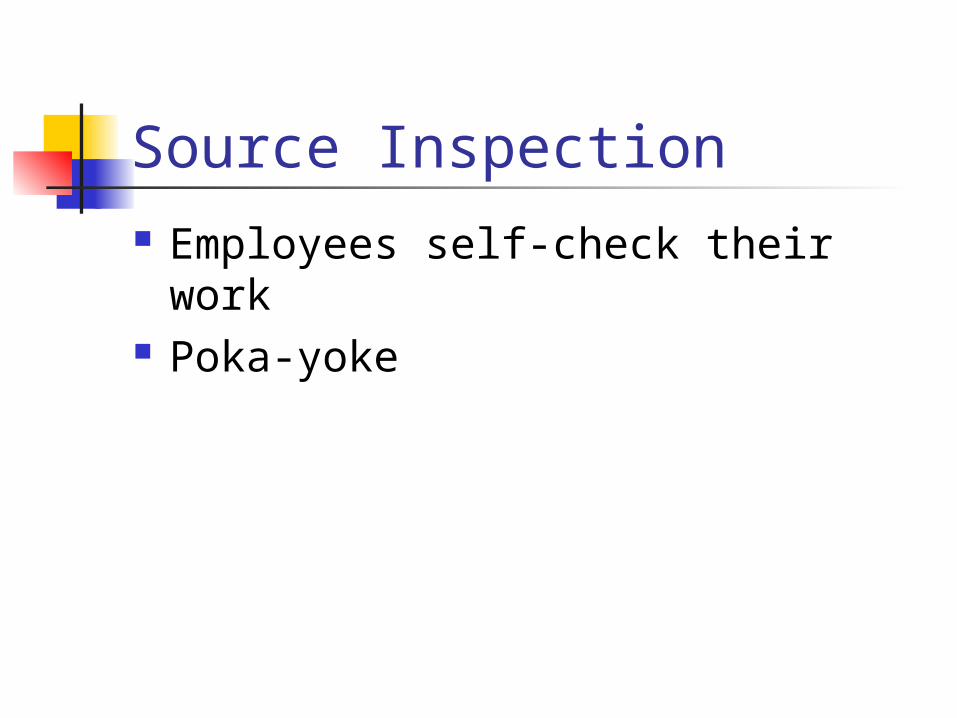
Source Inspection Employees self-check their work Poka-yoke
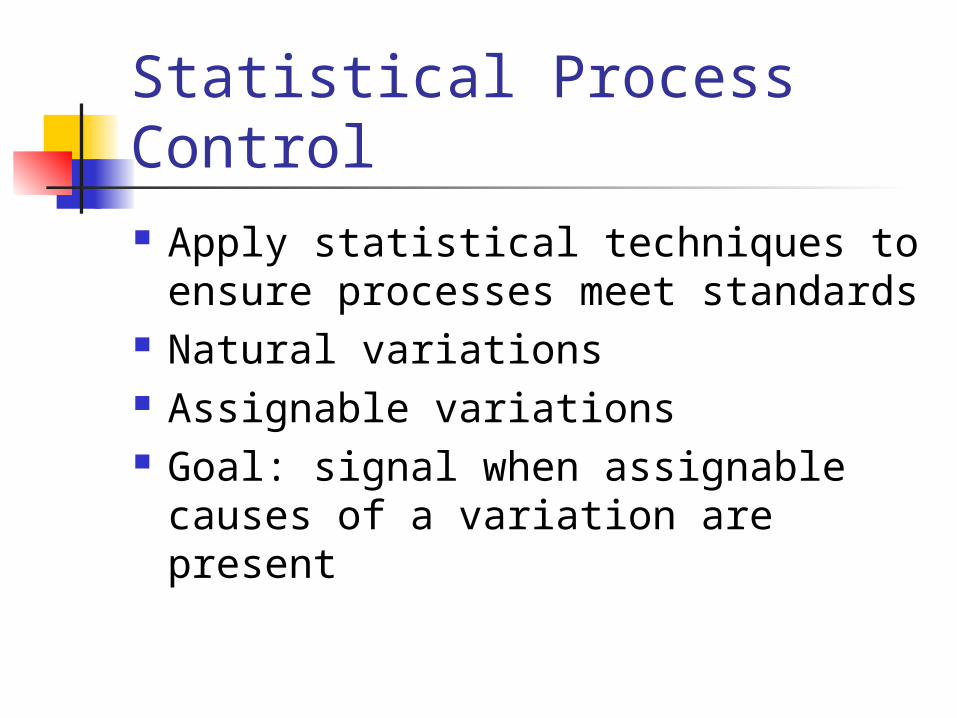
Statistical Process Control Apply statistical techniques to
ensure processes meet standards Natural variations Assignable variations Goal: signal when assignable
causes of a variation are present
Statistics Mean Standard deviation Natural variation Assignable variation
Control Charts X Bar Chart R Chart

In Control vs Out Of Control In control and producing within
control limits In control, but not producing within
control limits Out of control

Central Limit Theorem Mean Standard Deviation 95.5% 99.73% Control Limits

Using Control Charts Mean changing – Range changing