managing operating costs and credit risk · · loan payments tracking how much of what is being...
TRANSCRIPT

Managing Operating Costs and Credit Risk
Session 4
July 12, 10:45-12:15pm
1

Credit costs from a budgetary view
• Subsidy Rate Calculation
– Subsidy Rate = (NPV outflows - NPV inflows) / gross loan amount
• In addition to economic assumptions needed for NPV analysis,
must develop technical assumptions:
– Cash flows specified in loan contract
– Deviations from contract terms such as defaults, recoveries, prepayments,
forgiveness
– Management assumptions about future business or legislative authority
2

Estimating direct loan subsidy costs
3

Estimating loan guaranty subsidy costs
4

Data elements used to populate subsidy calculator
Illustrative example
Year 1 Year 2 Year 3 Year 4 Year 5
Name Section 502 loans
Program type Direct loan
Obligations 1,238,295,563$
Disbursements 1,057,311,433$ 152,384,782$ 15,062,406$ 7,170,335$ 3,903,427$
Principal payments, scheduled 4,798,244$ 10,843,855$ 12,919,103$ 13,964,966$ 14,955,592$
Interest payments, scheduled 31,839,380$ 69,318,033$ 77,360,794$ 77,696,847$ 77,159,022$
Prepayments, net 1,410,597$ 5,397,157$ 10,484,994$ 14,910,515$ 19,645,788$
Default effect on cash flows 304,675-$ 1,500,893-$ 3,014,195-$ 3,768,513-$ 3,916,205-$
Losses other than defaults 9,948,988-$ 24,777,547-$ 30,853,466-$ 30,905,966-$ 29,625,912-$
Recoveries -$ -$ 3,090,306$ 10,310,645$ 11,195,526$
Other outflows 615,991$ 1,568,316$ 2,416,707$ 3,423,361$ 3,970,961$
Other inflows 2,608$ 6,928$ 66,126$ 172,663$ 371,358$
End
* 1st five years; cash flows continue for life of loan cohort
5

Adjusting for actuals - reestimates
Illustrative example
6

Integrating performance & budgeting
• Monitor performance from budgetary & programmatic POV – Assess past performance; take action
– Adjust budgeted amounts (looking back but, importantly, going forward)
and/or risk thresholds
– Key is to balance policy goals with risks and taxpayer costs
• Inform policies, practices, underwriting standards & budgeting with
performance metrics tied to statutory purpose
• Develop oversight/control functions sufficiently independent of
program management
– Develop expertise within agency to identify emerging issues using real-
time information re outstanding portfolio, including credit & operational
risks
7

Monitoring loan performance
• Monitor, diagnose & report
– Include regular collections, analysis & reporting of information/trends on
aggregate and cohort basis
– Flexible to deliver analysis necessary to identify & respond to developing issues
– Coordinate closely with budget staff and enable virtuous feedback loop
within agency
• Use dashboards, watch-lists, pipeline reports & other tools to track
performance in real-time and to serve as early-warning indicators
• See Appendix D in A-129 for templates of various dashboards and other
reports
8

Shared services
• Shared services gaining traction in other areas
– Federal financial management (payroll, financial systems)
– Procurement (strategic sourcing)
– Information technology (category management)
• Is there an opportunity for shared services across federal credit
community?
– Subsidy rate estimation
– Loan servicing
– Lender monitoring
– Debt collection
– Asset disposition
9

Interesting to ponder a centralized credit unit
• Assess budgetary impacts of credit programs
• Ensure uniformity of approach in planning/evaluation
• Consider need for loan programs / assist in design
• Develop analytically rigorous risk management practices
• Establish automated and consistent underwriting systems
• Recommend policies aimed at improving program cost efficiency
• Develop consistent performance measures across credit agencies
• Design ways to close out programs that become irrelevant or no
longer justify public subsidization
10

Analyzing the Five Staff Functions Involved
in the Extension of Credit
What are (five of) the seven essential functions in the extension of credit that all lenders must perform or cause to have performed? The configuration of these functions for any program or portfolio will define the cost of the credit instrument as well as its effectiveness in achieving its purpose.
1. Marketing
· Message What it is. Why you need it. Why us?
· Medium The full range of communications: signage, billboards, media, personal networks, social networks
· Location International, national, state, local, community
2. Origination
· Advisory Interface with the client that ends in a "go" or "no-go" decision
· Application The commitment of time in assisting the borrower and ensuring the information is complete
· Due diligence Vetting the data submitted by the applicant, obtaining data from relevant sources
· Credit analysis Evaluating the borrower data, assessing feasibility and the capacity to pay, structuring the transaction
· Approval Approving the transaction in line with the standards, authorities, and procedures of the institution
· Documentation Assembling complete and consistent documents of the agreement, obtaining signatures
· Closing Funding the loan or the grant; commiting the credit of the institution
3. Servicing
· Billing and collections Calculating the proper amounts of principal and interest due, invoicing and collection payments
· Customer service Questions about the transaction, institutional policies and procedures, the client relationship
4. Monitoring
· Loan payments Tracking how much of what is being paid and when, relative to the agreement is the first and most important indicator
· Borrower Performing routine due diligence, through contact and available data on the client is key to anticipating risk
· Lender Performing portfolio reviews, and where pertinent, field audits of lending partners, implementing remedial steps
· Service provider Performing work and contract reviews, implementing remedial steps
5. Default
· Maturity Deferral, modification, rewrites: altering the credit to suit the borrower's needs
· Termination Payment and/or payment capacity is sufficiently impaired to warrant termination of the agreement
· Asset Sale/Liquidation The loan and/or assets securing the loan are sold
11

Calculating Operating Costs by Function
Breakdown of Expenses (using the numbers from the most recent year)
Marketing $250,000 $750,000 $1,000,000 $300,000 $1,300,000
Origination $5,920,000 $2,250,000 $8,170,000 $2,451,000 $10,621,000
$0 $0 $0 $0 $0
$0 $0 $0 $0 $0
Servicing $3,600,000 $6,000,000 $9,600,000 $2,880,000 $12,480,000
Monitoring $750,000 $1,200,000 $1,950,000 $585,000 $2,535,000
Default Management $750,000 $900,000 $1,650,000 $495,000 $2,145,000
Totals $11,270,000 $11,100,000 $22,370,000 $6,711,000 $29,081,000
Total
Expenses
Administrativ
e Allocation
Indirect Staff
and
Resources
Direct Staff
Expenses
Total Direct
and Indirect
12

The Unit Cost Analysis
(Activity-Based Costing)
Agency Cost Per Unit of providing a loan
Average Size of the Loans Originated $350,000 Annual Loans
Closed $ $175,000,000
Annual Loans
Closed #500
Marketing $1,000,000 2,000 $500 0.14% 0.57%
Origination $3,950,000 1,000 $3,950 1.13% 2.26%
Underwriting $2,900,000 600 $4,833 1.38% 1.66%
Closing $1,320,000 500 $2,640 0.75% 0.75%
Subtotal: Providing the Loan $9,170,000 $11,923 3.41% 5.24%
Total CostsTotal Number
of Loans
$ Cost per
Loan by
Function
% Cost per
Loan by
Function
% Cost per
Loan Closed
to Annual
The Cost per Loan by Function is the amount the agency pays on average for any
individual loan. The Cost per Loan Closed is derived from the total expense for each
function divided by the actual number of loans closed. The differences in the amounts
reflects: (i) all loans that are originated do not generate a complete application; and (ii) all
loans that generate a complete application do not go to closing. If all loans originated
generated applications, all applications were approved and all went to closing the numbers
would be the same. The difference indicates the cost of all of the activities that are
performed that do not produce a loan.
13

The Unit Cost Analysis (cont.)
Agency Cost Per Unit of keeping and managing the loan
Average Size of the Loans Serviced $350,000 Annual Loans
Serviced3,000
Servicing $9,600,000 3,000 $3,200 0.91% 0.91%
Monitoring $1,950,000 3,000 $650 0.19% 0.19%
Exit $1,650,000 300 $5,500 1.57% 0.16%
Subtotal: Managing the Loan $13,200,000 $9,350 2.67% 1.26%
Total Operating Cost $22,370,000
Allocation of General Agency Costs to the Loan
Agency allocation 30% The Agency allocation covers all of the institutional costs, including management, rent, communications, etc.
Total Operating Cost $29,081,000 Per loan $9,693.67 To Total Loans 2.77%
Cost per Loan
by Function
$1,050,000,000
Total CostsTotal Number
of Loans
Cost per Loan
by Function
Cost per Loan
Serviced to
Total Loans
Serviced
14

Staff Productivity
Staff Productivity
Loans per Marketing FTE 2 2,000 1,000 10,000 (9,000)
Loans per Originating FTE 60 1,000 17 150 (133)
Loans per Servicing FTE 40 3,000 75 500 (425)
Loans per Monitoring FTE 10 3,000 300 750 (450)
Loans per Loan Default FTE ** 8 300 38 100 (63)
120 9,300
Total # of FTE
Number of
Loans
Handled
Loans per FTENational
Benchmarks*
Benchmark
Performance
* National Benchmarks. There is no one source for benchmarks at this level of specificity. However, general indicators are
available from trade associations such as the Mortgage Bankers Association or the Consumer Bankers Association. These can
be used to help determine whether a function can be or should be outsourced.
** Loans per loan exit are loans that are delinquent and/or have defaulted, and which require elevated levels of due diligence and
management. They are generally under 10% of the portfolio
15

Shared Services
There is no need to wait months or years to award a contract for outside services, or
to "reinvent the wheel." Among the federal credit agencies, there is a wide range of
specialties and capabilities that can be tapped cheaply (and without a profit margin)
and quickly (without a formal bidding process). This is allowed by the Economy Act
of 1932.
The Economy Act of 1932, as amended, 31 U.S.C. § 1535,
permits Federal Government agencies to purchase goods or
services from other Federal Government agencies or other major
organizational units within the same agency. An Economy Act
purchase is permitted only if: (1) amounts for the purchase are
actually available, (2) the purchase is in the best interest of the
Government, (3) the ordered goods or services cannot be
provided by contract from a commercial enterprise, i.e., the private
sector, as conveniently or cheaply as could be by the
Government, and (4) the agency or unit to fill the order is able to
provide or get by contract the ordered goods or services.
16

Lowering Costs Through
Technology and Outsourcing
Loan Volume $175,000,000
$1,050,000,000
Before Credit
Scoring
After Credit
Scoring
Before
Automated
Application
After
Automated
Application
Before
Outsourcing
Servicing
After
Outsourcing
Servicing
Revenues to Total Assets 4.47% 4.47% 4.47% 4.47% 4.47% 4.10%
Interest Expense to Total Assets 0.28% 0.28% 0.28% 0.28% 0.28% 0.28%
Operating Expense to Total Assets 2.77% 2.50% 2.77% 2.30% 2.77% 1.55%
Credit Losses to Total Assets 0.27% 0.27% 0.27% 0.27% 0.27% 0.27%
Total Expenses to Total Assets 3.32% 3.05% 3.32% 2.85% 3.32% 2.10%
Profit/Surplus to Total Assets 1.15% 1.42% 1.15% 1.62% 1.15% 2.00%
Capital (same % as Small Bank in Chart
1.6)14.00%
14.00% 14.00%
Capital $147,000,000 $147,000,000 $147,000,000
ROE 8.22% 10.18% 8.22% 11.59% 8.22% 14.25%
WAY HOME BANKLoans Outstanding
17

What kind of risk are we supposed to be
preparing for?
Overarching issues
Points of view that often
guide or govern the level
of credit risk
18
• The banks aren't lending in my District
• The government ought not to be in the lending business: if
borrowers aren't bankable they shouldn't borrow
• The government is not taking enough risk
• The government should keep credit losses under 2 %
• The program should be budget neutral
• The government should never lend to make a profit
• The government is here to help me: concessionary rates,
modifications, waivers, less paperwork burden
• The government will (or should) never foreclose on me
• I have a right to participate in this credit program
• The government should never take a subordinate position
• The government should always take a subordinate
position
• Risk-based pricing
• Usury begins at 9%
• All Other

Key Problem: The Loss Curve
0
.00
1.0
02
.00
3.0
04
defa
ult r
ate
0 50 100 150months
4 outliers trimmed for perspective - see above chart
age in months at default
# defaults/# loans
default rate Q1 2006 30 year single family mortgages
0
.00
1.0
02
.00
3.0
04
defa
ult
rate
0 50 100 150 200months
age in months at default
# defaults/# loans
default rate Q1 2000 30 year single family mortgages
0
.00
05
.00
1.0
015
defa
ult r
ate
0 50 100 150months
age in months at default
# defaults/# loans
default rate Q1 2003 30 year single family mortgages
19
Credit Scoring
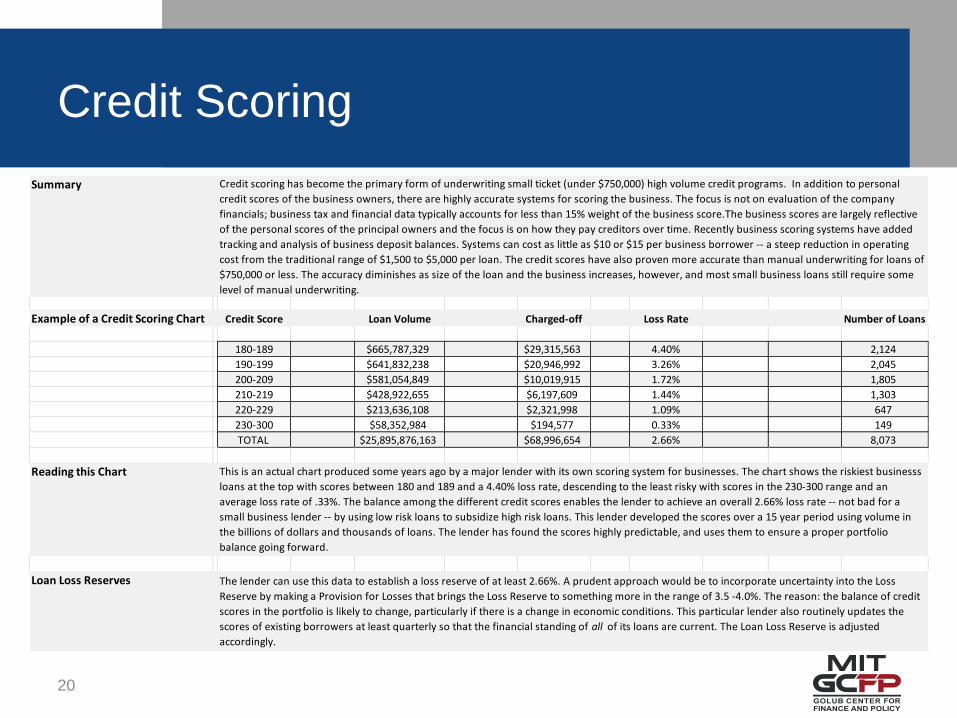
Summary
Example of a Credit Scoring Chart Credit Score Loan Volume Charged-off Loss Rate Number of Loans
180-189 $665,787,329 $29,315,563 4.40% 2,124
190-199 $641,832,238 $20,946,992 3.26% 2,045
200-209 $581,054,849 $10,019,915 1.72% 1,805
210-219 $428,922,655 $6,197,609 1.44% 1,303
220-229 $213,636,108 $2,321,998 1.09% 647
230-300 $58,352,984 $194,577 0.33% 149
TOTAL $25,895,876,163 $68,996,654 2.66% 8,073
Reading this Chart
Loan Loss Reserves
Credit scoring has become the primary form of underwriting small ticket (under $750,000) high volume credit programs. In addition to personal
credit scores of the business owners, there are highly accurate systems for scoring the business. The focus is not on evaluation of the company
financials; business tax and financial data typically accounts for less than 15% weight of the business score.The business scores are largely reflective
of the personal scores of the principal owners and the focus is on how they pay creditors over time. Recently business scoring systems have added
tracking and analysis of business deposit balances. Systems can cost as little as $10 or $15 per business borrower -- a steep reduction in operating
cost from the traditional range of $1,500 to $5,000 per loan. The credit scores have also proven more accurate than manual underwriting for loans of
$750,000 or less. The accuracy diminishes as size of the loan and the business increases, however, and most small business loans still require some
level of manual underwriting.
This is an actual chart produced some years ago by a major lender with its own scoring system for businesses. The chart shows the riskiest businesss
loans at the top with scores between 180 and 189 and a 4.40% loss rate, descending to the least risky with scores in the 230-300 range and an
average loss rate of .33%. The balance among the different credit scores enables the lender to achieve an overall 2.66% loss rate -- not bad for a
small business lender -- by using low risk loans to subsidize high risk loans. This lender developed the scores over a 15 year period using volume in
the billions of dollars and thousands of loans. The lender has found the scores highly predictable, and uses them to ensure a proper portfolio
balance going forward.
The lender can use this data to establish a loss reserve of at least 2.66%. A prudent approach would be to incorporate uncertainty into the Loss
Reserve by making a Provision for Losses that brings the Loss Reserve to something more in the range of 3.5 -4.0%. The reason: the balance of credit
scores in the portfolio is likely to change, particularly if there is a change in economic conditions. This particular lender also routinely updates the
scores of existing borrowers at least quarterly so that the financial standing of all of its loans are current. The Loan Loss Reserve is adjusted
accordingly.
20

Standard Banking Definitions
Definitions
Delinquency
Default
Charge-off
Recovery
This is the amount of principal that the lender estimates will be written off on a delinquent loan. It is a non-cash item that is a debit to the Loss
Reserve and a Credit to the Loan balance.
This is the amount of principal that is recovered after all or a portion of a loan has been charged-off. It is often, but not always, the product of
liqudating or foreclosing on the loan. Standard practice is to (i) credit the loss reserve and debit the Loan balance; and then (ii) credit the loan
balance and debit cash. The ratio of recoveries to charge-offs is a critical indicator of (i) the type of loans; (ii) the level of risk being taken; and (iii)
management discipline.
A delinquent loan is a loan that has missed at least one scheduled payment. Therefore, a "30-day" delinquent loan is past due by one payment as of
the report date; a "60-day" is past due by two payments, etc. When a loan is delinquent, the full principal is accounted as delinquent, not just the
missed monthly payment. There are no hard rules on when foreclosure should begin and practice can differ from one asset class to the next. But
generally foreclosure proceedings aren't started before a loan is 90 days past due, and many don't start until a loan is 120 days. Agencies are
directed to send loans that are delinquent 180 days to Treasury for collection. The term delinquency is used by agencies for programs involving
direct lending. All lenders have discretion in remedying delinquency.
In the context of mortgage pools, a defaulted loan is one that "no longer pays principal and interest, and then remains delinquent until liquidated.
Federal agency programs that guarantee loans made by private sector lenders use the term "default" to indicate a loan has been purchased from the
lending partner or on which a claim has been paid. There can be a time lapse between the time a loan goes delinquent at the lending partner and
the time the loan is purchased or a claim is paid.
Challenge for the agencies: standardizing definitions
21

Key Operating Data Points:
Expanding on A-129
Volume Dollar # or % Dollar # or % Dollar # or % Dollar # or % Dollar # or % Dollar # or %
Loans Originated
New Customers
Percentage Increase (Decrease) vs prior
period
Existing Customers
Percentage Increase (Decrease) vs prior
period
Total Approvals
Percentage Increase (Decrease) vs prior
period
New Applications Declined
Renewals Declined
Processing
New Customer Applications Submitted
Approvals of New Applications
Percentage to Total New Applications
Closings
Percentage to total Applications
New Applications in process
Percentage to total New Applications
Renewals
Percentage to total Loan Approvals
Renewals Scheduled for Next Period
Loan Approvals outstanding
Percentage Increase (Decrease)
Disbursements outstanding
Percentage Increase (Decrease)
Amendment/Waiver
Amended Loans Outstanding
Percentage to total loans outstanding
This Month Year to Date Annual BudgetYTD Prior Year Annual Prior Year Annual 2nd Prior Year
22

Key Operating Data Points:
Expanding on A-129 (cont.)
Staff Dollar # or % Dollar # or % Dollar # or % Dollar # or % Dollar # or % Dollar # or %
Total Op Expenses / Number of Operating
Staff
Credit Providing FTE (Origination, etc.)
Credit Managing FTE (Servicing,
monitoring, etc.)
Number of Applications Processed per
Providing FTE
Number of Renewals Processed per
Providing FTE
Number of Amendments Processed per
Managing FTE
Number of Loans in Workout per
Managing FTE
Operating Services provided by 3rd
Parties
3rd Party cost per loan originated
3rd Party cost per loan underwritten
3rd Party cost per loan serviced
Other 3rd Party costs to total loans
Backlog
Beginning Applications on Hand
Applications Submitted
Applications Approved
Applications Declined
Commitments Made
Ending Applications on Hand
Percentage Increase (Decrease) over
prior period
THIS MONTH YEAR TO DATE ANNUAL BUDGETYTD PRIOR YEAR ANNUAL PRIOR YEAR ANNUAL 2ND PRIOR YEAR
23

MIT OpenCourseWarehttp://ocw.mit.edu
RES.15-002 Mission and Metrics: Finance Training for Federal Credit Program Professionals Summer 2016
For information about citing these materials or our Terms of Use, visit: http://ocw.mit.edu/terms.