managing acid soils for reclaiming livelihoods in ethiopia
TRANSCRIPT

Managing acid soils for reclaiming livelihoods in Ethiopia
Managing acid soils for reclaiming livelihoods in Ethiopia
How it can be addressed
41% of cultivated land In Ethiopia is affected by soil acidity1
Increased yield
Healthier soils and crops
28% of cultivated land is highly acidic (3.5 million ha)1
9 billion birr* per year is lost in foregone wheat production i.e. 17,000 birr every single minute2 3 complementary approaches are often
employed in the management of acid soils:
Liming – application of calcium and magnesium-rich materials from local sources
Integrated Soil Fertility Management (ISFM)
Acid-tolerant crops and varieties
Crop diversity is reduced as farmers restrict to acid-tolerant crops such as barley and potatoes
Abandoning of land and migration has been observed in areas of extreme acidity
Cost of inaction can be high impacting food security and income of smallholder farmers adversely.
(Source: 1. Getachew Agegnehu et al. 2018; 2. James Warner et al. 2018)
*1birr= 0.035 USD
What are the benefits
(In cereals)
30-40% increase with liming alone
50-100% increase when combined with ISFM
The approach is dictated by rainfall patterns, soil properties as well as economic considerations.
Why it is critical
Increased nutrient availability
Improved grain quality
Reduced fertilizer costs
Greater pesticide effectiveness
Decreased Aluminum and Magnesium toxicity
Improved soil microbial activity
Citation: Amede Tilahun, Schulz S, Warner J and Tefera Solomon. 2019. Managing acid soils for reclaiming livelihoods in Ethiopia. ICRISAT-GIZ, Addis Ababa.
Picture above shows the difference between farmers’ practice with no lime (left) compared to ISFM with lime (right). Photo: GIZ-ISFM
Implemented by
2 3
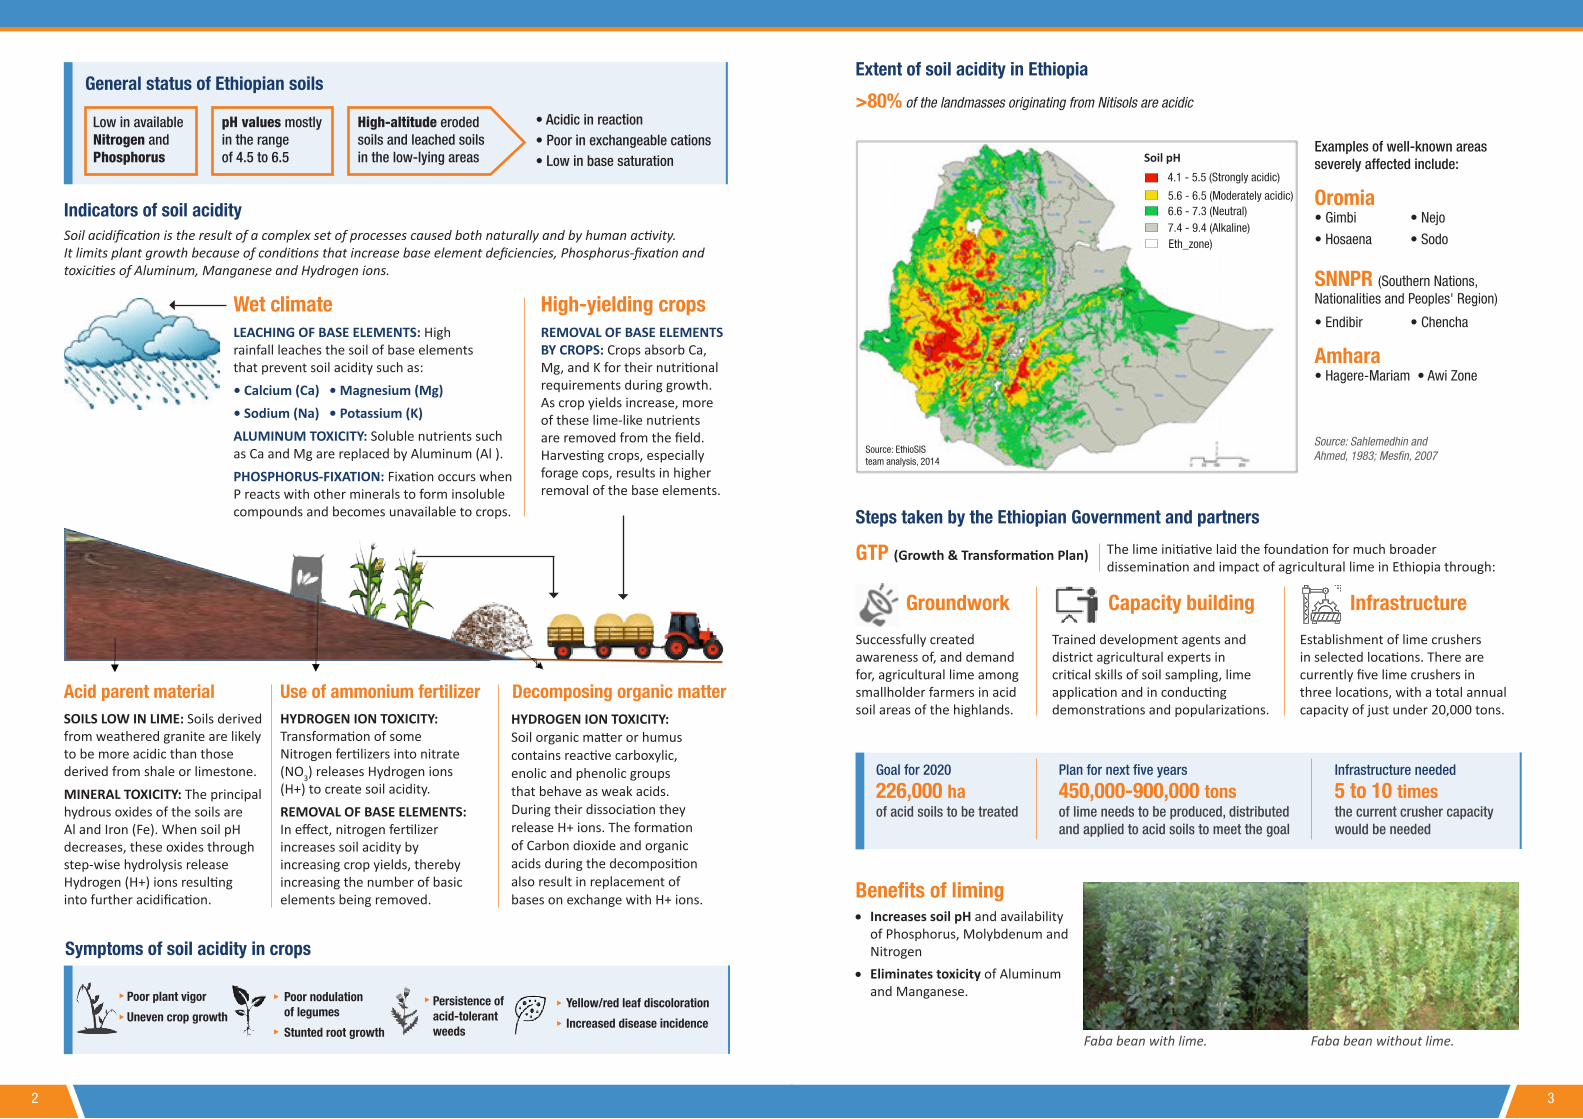
Extent of soil acidity in Ethiopia
Steps taken by the Ethiopian Government and partners
>80% of the landmasses originating from Nitisols are acidic
Examples of well-known areas severely affected include:
Oromia• Gimbi • Nejo
• Hosaena • Sodo
SNNPR (Southern Nations, Nationalities and Peoples' Region)
• Endibir • Chencha
Amhara• Hagere-Mariam • Awi Zone
GTP (Growth & Transformation Plan) The lime initiative laid the foundation for much broader dissemination and impact of agricultural lime in Ethiopia through:
Groundwork Capacity building Infrastructure
Successfully created awareness of, and demand for, agricultural lime among smallholder farmers in acid soil areas of the highlands.
Goal for 2020
226,000 ha of acid soils to be treated
Benefits of liming • Increases soil pH and availability
of Phosphorus, Molybdenum and Nitrogen
• Eliminates toxicity of Aluminum and Manganese.
Plan for next five years
450,000-900,000 tons of lime needs to be produced, distributed and applied to acid soils to meet the goal
Infrastructure needed
5 to 10 times the current crusher capacity would be needed
Trained development agents and district agricultural experts in critical skills of soil sampling, lime application and in conducting demonstrations and popularizations.
Establishment of lime crushers in selected locations. There are currently five lime crushers in three locations, with a total annual capacity of just under 20,000 tons.
General status of Ethiopian soils
• Acidic in reaction• Poor in exchangeable cations • Low in base saturation
Low in available Nitrogen and Phosphorus
pH values mostly in the range of 4.5 to 6.5
High-altitude eroded soils and leached soils in the low-lying areas
Indicators of soil acidity
High-yielding crops REMOVAL OF BASE ELEMENTS BY CROPS: Crops absorb Ca, Mg, and K for their nutritional requirements during growth. As crop yields increase, more of these lime-like nutrients are removed from the field. Harvesting crops, especially forage cops, results in higher removal of the base elements.
Acid parent materialSOILS LOW IN LIME: Soils derived from weathered granite are likely to be more acidic than those derived from shale or limestone. MINERAL TOXICITY: The principal hydrous oxides of the soils are Al and Iron (Fe). When soil pH decreases, these oxides through step-wise hydrolysis release Hydrogen (H+) ions resulting into further acidification.
Symptoms of soil acidity in crops
Use of ammonium fertilizerHYDROGEN ION TOXICITY: Transformation of some Nitrogen fertilizers into nitrate (NO3) releases Hydrogen ions (H+) to create soil acidity. REMOVAL OF BASE ELEMENTS: In effect, nitrogen fertilizer increases soil acidity by increasing crop yields, thereby increasing the number of basic elements being removed.
Decomposing organic matter
Poor plant vigor
Uneven crop growthPersistence of acid-tolerant weeds
Yellow/red leaf discoloration
Increased disease incidence
Poor nodulation of legumes
Stunted root growth
Soil acidification is the result of a complex set of processes caused both naturally and by human activity. It limits plant growth because of conditions that increase base element deficiencies, Phosphorus-fixation and toxicities of Aluminum, Manganese and Hydrogen ions.
Source: Sahlemedhin and Ahmed, 1983; Mesfin, 2007
Faba bean with lime. Faba bean without lime.
Soil pH4.1 - 5.5 (Strongly acidic)
5.6 - 6.5 (Moderately acidic)6.6 - 7.3 (Neutral)7.4 - 9.4 (Alkaline)Eth_zone)
Source: EthioSIS team analysis, 2014
HYDROGEN ION TOXICITY: Soil organic matter or humus contains reactive carboxylic, enolic and phenolic groups that behave as weak acids. During their dissociation they release H+ ions. The formation of Carbon dioxide and organic acids during the decomposition also result in replacement of bases on exchange with H+ ions.
Wet climateLEACHING OF BASE ELEMENTS: High rainfall leaches the soil of base elements that prevent soil acidity such as:• Calcium (Ca) • Magnesium (Mg)• Sodium (Na) • Potassium (K) ALUMINUM TOXICITY: Soluble nutrients such as Ca and Mg are replaced by Aluminum (Al ). PHOSPHORUS-FIXATION: Fixation occurs when P reacts with other minerals to form insoluble compounds and becomes unavailable to crops.

4 5
Soil acidity management approaches
Diagnosing soil acidity How to apply lime
What the pH score says
Complementary strategies
For effective reclamation of acid soils:
Periodical soil testing is needed when growing high-yielding crops. Testing identifies soil acidity early enough to change the pH
Steps include: 1. Soil sampling
2. Monitoring soil pH
3. Reaching target pH
Liming acidic soils calls for application of calcium- and magnesium-rich materials to soil in the form of:
Marl | Chalk | Limestone | Hydrated lime
Determine the amount of lime: Application of 2-5 tons of lime per hectare annually has been reported to be adequate to maintain the level of Ca and Mg in the soil under continuous cropping.
Determine the frequency of liming At higher rates, residual effects of liming are expected to last for five to seven years. When a high rate of lime is recommended, (>6 tons/ha) biennial application may suffice.
Purity determines rate of applicationIf the purity of liming material is 80%, then recommendation rate must be adjusted by multiplying by 100 and dividing by 80.
Smaller-size material acts fasterThe finer the lime material the faster is the correction of soil pH.
Soil type determines the lime amount Clay soils, particularly nitisols, need more lime to correct the pH. Due to high organic matter they have a larger reservoir than sandy soils.
There are options available to incorporate lime ranging from surface application and deep rip to direct injection and shallow incorporation. The choice depends on the farm. Raw application of lime reduced the lime demand significantly.
Photo: Dept. of Primary Industries and Regional Development, Govt. of Western Australia
Integrated soil fertility management: In acid soils, where Phosphorus (P) fixation is a problem, application of Farm Yard manure (FYM) releases a range of organic acids that can form stable complexes with Aluminum and Iron thereby blocking the P retention sites and releasing P.
Tolerant crop and pasture speciesIn extreme acidic soils Triticale rye with hybrid wheat was found to be producing a good crop.
Photo: GIZ-ISFM
Decision guide for soil acidity managementFarms in high rainfall
areas can be
Indicators checklist
What can be done
Type of farm
ACIDIC NEUTRAL ALKALINE
System shift
Abandoned farms
Shift to pasture/livestock systems
Low-yielding agricultural farms Productive farm
Rarely grows barley, potato or wheat; only weeds like Rumex spp grow
Liming with high rate ( >6 ton / ha) (To be done after all the other interventions)
Grows coffee, teff, wheat, barley and potatoes
Whole farm application of lime (4-5 t/ha), repeat every 5 years, OR rotational application of lime, row application (about 2.5 t/ha)
Grows coffee, teff, wheat, barley and potatoes
Maintenance, rotational application of lime (about 2.5 t/ha)
Predominantly, crops dry up quickly, very poor yield
Fallowing with deep-rooted legume trees (e.g. Acacia decurrens; Erythrina spp; Sesbania spp)
Stunted crops with low-yield
Short season fallow with deep rooted legumes (e.g. Alfalfa, Lupin)
Short season fallow with deep rooted legumes (e.g. Alfalfa, Lupin)
Productive with amendments
Excessive toxicity: Al (stunted roots) Mn (pale/yellow leaves) Fe (brown spots on leaves)
Proper drainage
Leaf discoloration (purple or dark green) caused by P-deficiency
Proper drainage
Leaf discoloration (purple or dark green) caused by P-deficiency
Proper drainage
Shallow and hardpan (Degraded Nitisols, Luvisols, Acrisols, Alisols and Ferralsols)
Moderately fertile and wet (Nitisols, Luvisols, Acrisols, Alisols and Ferralsols)
Avoid ammonium-based fertilizers
Deep clay or loam (Mostly Nitisols; Alisols, Gleysols, Cambisols, Planosols and Ferralsols are also found)
Avoid ammonium-based fertilizers
Crop system
Liming
State of crop
Fallowing + legumes
Crop symptoms
Water guide
Extremely acidic (<4.5pH)
Reverse the condition by:
Moderately acidic (4.5-5.5 pH)
Manage the soil by:
Slightly acidic (5.5-6.5 pH)
Maintain and improve the soil by:
Soil indicators
Fertilizer usage
7pH
Lime

GTP II targets: Reclaim 226,000 hectares of acidic soilFor every 1birr invested today, a NPV* return of 5.2 birr is projected
Production
Public/private lime crushing: 452,000 tons
Cost 339 million birr
Cost 475 million birr
Unit cost per ton 750 birr
Developed private transportation networks
Unit cost per ton 1,050 birr
Unit cost per ton 100 birr
1 ton lime per 1/2 hectare plot for 452,000 farmers
Total lime cost 859 million birr
Total lime 1,900 birr
Total application 900 birr
40% yield increase with lime (ISFM needed)
Benefit 1st Year production 3.8 q wheat Net income: 1,000 birr
NPV 5 year production Net income: 11,849 birr Total returns: 523%
5 year production 8.5 M q wheat
Benefit NPV 5 year production 8.5 M q wheat 6.6 billion birr sold
Public/private agro-dealers & cooperatives
Lime cost 45 million birr
Distribution to sellers Sale of lime + ISFM Application & planting Harvesting National benefits
Improve soil health
Increase production
Achieve GTP II
2. Soil test
• Efficient; precise
• Portable PH test kit
• De
mon
stra
tions
• Tr
aini
ngs
1. A
war
enes
sDe
man
d
3. Agri Demand
Demand
Supply
4. Adoption
• All inputs
• Proper application
• Actual• Conveyed
5. Source
• Public/private
• Quality/Gate price
6. Transport• Scale• Logistics
7. Price/sale
8. L
ast M
ile
• Public/private
• Subsidy; credit
• An
imal
car
t•
Trac
tor
M&E
Micro level pilots
Macro level
adoption
Modified from: James Warner et al. 2018
James Warner et al. 2018
Five-year plan for achieving GTP II targets
* Net present value
Incentives for scaling up • Strong lime production capacity of Ethiopian
Cement Industry
• Farmers willing to pay for lime (EIAR, IFPRI, 2016)
• Employment of Youth (loading, local transport, application, retailing…)
• Increasing demand for lime from various regions and their communities
2,000 ha
2,000 ha40,000 ha
60,000 ha
90,000 ha
25,000 ha
10, 000 ha
5000q
5000q
250,000q
200,000q
500,000q
800,000q1,200,000q
1,800,000q
1,800,000q
1,200,000q800,000q
550,000q
10M birr
10M birr
100M birr
160M birr250M birr
360M birr
60%GTP II
15%GTP II
4%GTP II
2,750 trips
4,000 trips6,000 trips
9,000 trips
1,250 trips
40M birr
Year 1Year 2
Year 3Year 4
Year 5
Assumption:
Cost to Government: 300 million birrDemonstration Costs: 20 million birrSubsidy to achieve GTP II targets: 273 million birr
Lime: 1/[email protected]: 200birr/qTransport: 200q per trip
ISFM demonstration
Farmers’ fields
Transportation
33%GTP II
100%GTP II
Lime Production and Supply Chain Options(Task Force Report, 2018)
Lime Supply Options Production Transport Distribution
3 m
illio
n ha
Ac
idic
Soi
l Cov
erag
e
Direct sale
Credit
Project
Private cement factories
Private sector Transport
Unions/public associations, woreda* agriculture office, agro-dealers
Private cement factories and public lime crushers through government support
Private cement factories through project support
Government supported private sector transport
Project supported private sector transport
Woreda agriculture office, public mobilization, with the support of partner institutions
Unions/public associations, woreda agriculture office, agro-dealers*District
880-339 million (production costs)270 million (1/2 transport costs)Average subsidized price per q: 140 birr
Business model for acid soil management
Faba bean
Year N*
Grain yield (t/ha) Stover yields (t/ha)
ISMF + lime
Minus lime
Increase (%)
ISFM + lime
Minus lime
Increase (%)
2016 45 2.2 1.3 78 4 2.5 602017 31 2.9 1.3 115 4.9 2.7 802018 9 4.6 2.6 80 5.4 2.5 121
Total/ weighted average
85 2.7 1.4 88 4.5 2.6 74
Results of farmer field demonstrations across the Ethiopian Highlands (Amhara, Oromia, SNNPR and Tigray)
*Number of experiments
Wheat
Year N*
Grain yield (t/ha) Residue yields (t/ha)
ISMF + lime
Minus lime
Increase (%)
ISFM + lime
Minus lime
Increase (%)
2016 100 4.4 2.5 80 7.5 4.7 592017 66 5.4 3.3 63 8.8 5.7 552018 58 5.0 2.9 73 8.7 4.8 80
Total/ weighted average
224 4.9 2.8 71 8.2 5.0 63
Teff
Year N*
Grain yield (t/ha) Residue yields (t/ha)
ISMF + lime
Minus lime
Increase (%)
ISFM + lime
Minus lime
Increase (%)
2016 63 2.2 1.3 70 5.6 3.8 462017 25 1.7 1.0 69 4.6 3.4 342018 8 1.9 1.2 56 4.3 2.4 75
Total/ weighted average
96 2.0 1.2 68 5.2 3.6 46
Maize
Year N*
Grain yield (t/ha) Residue yields (t/ha)
ISMF + lime
Minus lime
Increase (%)
ISFM + lime
Minus lime
Increase (%)
2016 72 8.3 4.5 86 14.2 8.4 692017 47 9.1 5.7 59 17.6 12.4 422018 18 8.0 5 61 13.7 9 52
Total/ weighted average
137 8.5 5 71 15.3 9.9 55
Minus lime=farmer practice (without lime)
1birr= 0.035 USD
6 7

ReferencesGetachew Agegnehu, Chilot Yirga and James Warner. 2018. Soil acidity in Ethiopia, cause, effects, management and policy consideration. IFPRI, EIAR.James Warner, Chilot Tizale, Sam Gameda, and Tadiwos Zewdie. 2018. A pilot program to rehabilitate and enhance the productivity of acid soils in Ethiopia. IFPRI, GIZ, EIAR and CIMMYT.Mesfin Abebe. 2007. Nature and Management of Acid Soils in Ethiopia, Addis Ababa, Ethiopia, pp 89.Sahle Medhin Sertsu and Ahmed Ali. 1983. Phosphorus sorption characteristics of some Ethiopian soils. Ethiopian Journal of Agricultural Science 5: 1-12.
Conceptualization and editing: Jemima Mandapati; Design: Meeravali SK; Strategic Marketing & Communication, ICRISAT
Contact:Dr Tilahun Amede ([email protected])Address: ICRISAT-Ethiopia(c/o ILRI) PO. Box 5689
Recommendations • Need for a National Movement in
Reclaiming Acid Soil: This mission needs to be taken up with urgency as part of the solution for wheat import replacement and enhanced productivity.
• Lime Production, Supply and Distribution: Excavation, production, distribution and application of lime should be more consistent with current GTP II targets and the need for greater supply to meet the needs of the full acid soil problem should be developed (public-private partnership is strongly recommended).
• Farmer Awareness and Support: Development of enhanced government services that facilitate farmer awareness, acid soil diagnosis, access to local acid soil experts and availability of training packages and local demonstrations, assistance with last-mile delivery and the availability of financing and credit to smallholder farmers for lime procurement and application.
• The Need for Targeted Application: Refinement of a comprehensive acid soil treatment and management package (lime, improved seeds, fertilizers, organic matter management, improved agronomy).
• Comprehensive Acid Soil Policy: Beyond just targets (as included in GTP II), a fully developed government policy that addresses the needs of an efficient and sustainable acid soils reclamation strategy as well as complimentary services (research support, inputs, credit, etc.) is needed.
• Lime Delivery Business Model: Develop an efficient and sustainable lime delivery system that balances cost effectiveness with widespread farmer adoption and job creation.
Suggested next steps • National campaign for lime promotion • Minimize free distribution of lime, except for
demonstrations • Continue farmer demand creation for lime,
particularly in the most-affected regions • Develop sustainable lime delivery mechanisms
(Proactive Task Force) • Agree on pricing mechanism (subsidy/credit for
lime) – Policy decision is needed.
Limestone quarry at Guder, Oromia.
Photo: GIZ-ISFM
May 2019
Implemented by