managing a mammography center: a model to thrive ... · angiography (mra) to evaluate aortoiliac...
TRANSCRIPT

Journal of the American Society of Radiologic Technologists Vol. 82, No. 1 September/October 2010
RADIOLOGIC®
American Society ofRadiologic Technologists
Managing a Mammography Center: A Model To Thrive
Tuberculosis: A Review and Update
Self-stress vs Manual Stress in Talar Tilt Radiography
Breast Biopsy Targeting Techniques
MAMMOGRAPHY AND BREAST SONOGRAPHY EDiTiON

Our scholarship recipients have different backgrounds and a variety of goals. Some seek bachelor’s degrees and
others pursue master’s degrees. Many want to obtain specialty certification in MR or CT. But they do have one thing
in common — they are dedicated to academic achievement and willing to jump into action to reach their goals.
Jump Into Action
With a Siemens Clinical Advancement Scholarship
ASRTEducation and
Research Foundation
®
If you are an R.T. professional pursuing higher education, you can apply
for a $5,000 Siemens Clinical Advancement Scholarship.
Visit www.asrtfoundation.org to learn more.
©2010 ASRT Education and Research Foundation. All rights reserved.
ERF10_SCH_Ads.indd 1 8/25/10 7:11:38 AM

INDICATIONS: ABLAVAR® is indicated for use as a contrast agent in magnetic resonance angiography (MRA) to evaluate aortoiliac occlusive disease (AIOD) in adults with known or suspected peripheral vascular disease.
CONTRAINDICATIONS: History of a prior allergic reaction to a gadolinium-based contrast agent.
IMPORTANT SAFETY INFORMATION:
WARNING: NEPHROGENIC SYSTEMIC FIBROSIS (NSF) Gadolinium-based contrast agents increase the risk of nephrogenic systemic fi brosis (NSF) in patients with:• acute or chronic severe renal insuffi ciency (glomerular fi ltration rate <30 mL/min/1.73m2), or
• acute renal insuffi ciency of any severity due to the hepato-renal syndrome or in the perioperative liver transplantation period.
In these patients, avoid use of gadolinium-based contrast agents unless the diagnostic information is essential and not available with non-contrast enhanced magnetic resonance imaging (MRI). NSF may result in fatal or debilitating systemic fi brosis affecting the skin, muscle, and internal organs. Screen all patients for renal dysfunction by obtaining a history and/or laboratory tests. When administering a gadolinium-based contrast agent, do not exceed the recommended dose and allow a suffi cient period of time for elimination of the agent from the body prior to any re-administration.
ABLAVAR® Injection: As with other contrast media: the possibility of serious or life-threatening anaphylactic or anaphylactoid reactions, including cardiovascular, respiratory and/or cutaneous manifestations, should always be considered. As with other paramagnetic contrast agents, caution should be exercised in patients with renal insuffi ciency due to the possibility of further deterioration in renal function.
In clinical trials, a small increase (2.8 msec) in the average change from baseline in QTc was observed at 45 minutes. These QTc prolongations were not associated with arrhythmias or symptoms. Caution should be used in patients at high risk for arrhythmias due to baseline QTc prolongation.
Have emergency resuscitative equipment available prior to and during ABLAVAR® administration.
Please see brief summary, including boxed WARNING regarding Nephrogenic Systemic Fibrosis (NSF), on the following page.
A wide new window of opportunity1,2
References: 1. ABLAVAR® [package insert]. North Billerica, MA: Lantheus Medical Imaging, Inc.; 2009. 2. U.S. Food and Drug Administration Web site. http://www.fda.gov/drugs. Accessed February 1, 2010. 3. Goyen M. Gadofosveset-enhanced magnetic resonance angiography. Vasc Health Risk Manag. 2008;4(1):1-9. 4. Goyen M, Edelman M, Perreault P, et al. MR angiography of aortoiliac occlusive disease: a phase III study of the safety and effectiveness of the blood-pool contrast agent MS-325. Radiology. 2005;236(3):825-833. 5. Rapp JH, Wolff SD, Quinn SF, et al. Aortoiliac occlusive disease in patients with known or suspected peripheral vascular disease: safety and effi cacy of gadofosveset-enhanced MR angiography–multicenter comparative phase III study. Radiology. 2005;236(1):71-78. 6. Data on fi le, Lantheus Medical Imaging, Inc.
To order, call 1-800-299-3431www.ABLAVAR.com
Introducing ABLAVAR®: the fi rst and only blood-pool contrast agent for MRA1,2
A low-dose MRA contrast agent with the unique benefi ts of albumin binding3
• Time to acquire high-resolution fi rst-pass and steady-state images3
• Imaging window up to 1 hour with a single, low-dose (0.12 mL/kg body weight [0.03 mmol/kg]) IV bolus1,3
• Diagnostic accuracy comparable to conventional X-ray angiography4,5 • Documented safety and tolerability with no reported cases of NSF*6
*No reported cases of nephrogenic systemic fi brosis (NSF) to date in clinical use with nearly 90,000 patients.
ABLAVAR is a registered trademark of Lantheus Medical Imaging, Inc.© 2010 Lantheus Medical Imaging, Inc. All rights reserved. Printed in USA. AB-JA-Aug 2010
AD pageRADIOLOGIC
TECHNOLOGY PALIO Date: 8.11.10 • Client: Lantheus • Product: Ablavar • File Name: 17720_planth_radiologic_technology_fi .indd • Trim: 8” x 10.5” • Bleed: 8.25” x 10.75” • Safety: 7” x 9.5” • Due: 8.18.10
17720_planth_radiologic_technology_fi.indd 1 8/11/10 10:03:07 AM

BS pageRADIOLOGIC
TECHNOLOGY PALIO Date: 8.11.10 • Client: Lantheus • Product: Ablavar • File Name: 17720_planth_radiologic_technology_fi .indd • Trim: 8” x 10.5” • Bleed: 8.25” x 10.75” • Safety: 7” x 9.5” • Due: 8.18.10
WARNING: NEPHROGENIC SYSTEMIC FIBROSIS (NSF)Gadolinium-based contrast agents increase the risk of nephrogenic systemic fi brosis (NSF) in patients with:• acute or chronic severe renal insuffi ciency (glomerular fi ltration
rate <30 mL/min/1.73m2), or• acute renal insuffi ciency of any severity due to the hepato-renal
syndrome or in the perioperative liver transplantation period. In these patients, avoid use of gadolinium-based contrast agents unless the diagnostic information is essential and not available with non-contrast enhanced magnetic resonance imaging (MRI). NSF may result in fatal or debilitating systemic fi brosis affecting the skin, muscle, and internal organs. Screen all patients for renal dysfunction by obtaining a history and/or laboratory tests. When administering a gadolinium-based contrast agent, do not exceed the recommended dose and allow a suffi cient period of time for elimination of the agent from the body prior to any re-administration [see Warnings and Precautions]
INDICATIONS AND USAGEAblavar is indicated for use as a contrast agent in magnetic resonance angiography (MRA) to evaluate aortoiliac occlusive disease (AIOD) in adults with known or suspected peripheral vascular disease.
DOSAGE AND ADMINISTRATIONDosing GuidelinesAdminister Ablavar as an intravenous bolus injection, manually or by power injection, at a dose of 0.12 mL/kg body weight (0.03 mmol/kg) over a period of time up to 30 seconds followed by a 25-30 mL normal saline fl ush. (See Table 1 for weight-adjusted dose volumes).
TABLE 1. Weight-Adjusted Volumes for the 0.03 mmol/kg Dose
Body Weight VolumeKilograms (kg) Pounds (lb) Milliliters (mL)
40 88 4.850 110 6.060 132 7.270 154 8.480 176 9.690 198 10.8100 220 12.0110 242 13.2120 264 14.4130 286 15.6140 308 16.8150 330 18.0160 352 19.2
Inspect the Ablavar vial visually for particulate matter and discoloration prior to administration. Do not use the solution if it is discolored or particulate matter is present.Ablavar is intended for single use only and should be used immediately upon opening. Discard any unused portion of the Ablavar vial.Do not mix intravenous medications or parenteral nutrition solutions with Ablavar. Do not administer any other medications in the same intravenous line simultaneously with Ablavar.Imaging GuidelinesAblavar imaging is completed in two stages: the dynamic imaging stage and the steady-state imaging stage. Both stages are essential for adequate evaluation of the arterial system, and dynamic imaging always precedes steady-state imaging. During interpretation of the steady-state images, Ablavar within the venous system may limit or confound the detection of arterial lesions. To assess the initial distribution of Ablavar within the arterial system, begin dynamic imaging immediately upon injection. Begin steady state imaging after dynamic imaging has been completed, generally 5 to 7 minutes following Ablavar administration. At this time point, Ablavar is generally distributed throughout the blood. In clinical trials, steady-state imaging was completed within approximately one hour following Ablavar injection.
DOSAGE FORMS AND STRENGTHSAblavar is a sterile solution for intravenous injection containing 244 mg/mL (0.25 mmol/mL) gadofosveset trisodium [see How Supplied/Storage and Handling]
CONTRAINDICATIONSHistory of a prior allergic reaction to a gadolinium-based contrast agent.
WARNINGS AND PRECAUTIONSNephrogenic Systemic Fibrosis Gadolinium-based contrast agents increase the risk for nephrogenic systemic fi brosis (NSF) in patients with acute or chronic severe renal insuffi ciency (glomerular fi ltration rate <30 mL/min/1.73m2) and in patients with acute renal insuffi ciency of any severity due to the hepato-renal syndrome or in the perioperative liver transplantation period. In these patients, avoid use of gadolinium-based contrast agents unless the diagnostic information is essential and not available with non-contrast enhanced MRA. For patients receiving hemodialysis, physicians may consider the prompt initiation of hemodialysis following the administration of a gadolinium-based contrast agent in order to enhance the contrast agent’s elimination. Ablavar binds to blood albumin and use of a high-fl ux dialysis procedure is essential to optimize Ablavar elimination in patients receiving chronic hemodialysis. The usefulness of hemodialysis in the prevention of NSF is unknown [see Boxed Warning and Clinical Pharmacology].Among the factors that may increase the risk for NSF are repeated or higher than recommended doses of a gadolinium-based contrast agent and the degree of renal function impairment at the time of exposure.Post-marketing reports have identifi ed the development of NSF following single and multiple administrations of gadolinium-based contrast
agents. These reports have not always identifi ed a specifi c agent. Prior to marketing of Ablavar, where a specifi c agent was identifi ed, the most commonly reported agent was gadodiamide (Omniscan™), followed by gadopentetate dimeglumine (Magnevist®) and gadoversetamide (OptiMARK®). NSF has also developed following sequential admin-istrations of gadodiamide with gadobenate dimeglumine (MultiHance®) or gadoteridol (ProHance®). The number of post-marketing reports is subject to change over time and may not refl ect the true proportion of cases associated with any specifi c gadolinium-based contrast agent.The extent of risk for NSF following exposure to any specifi c gadolinium-based contrast agent is unknown and may vary among the agents. Published reports are limited and predominantly estimate NSF risks with gadodiamide. In one retrospective study of 370 patients with severe renal insuffi ciency who received gadodiamide, the estimated risk for development of NSF was 4% (J Am Soc Nephrol 2006; 17:2359). The risk, if any, for the development of NSF among patients with mild to moderate renal insuffi ciency or normal renal function is unknown.Screen all patients for renal dysfunction by obtaining a history and/or laboratory tests. When administering a gadolinium-based contrast agent, do not exceed the recommended dose and allow a suffi cient period of time for elimination of the agent prior to any re-administration. NSF was not reported in clinical trials of Ablavar [see Clinical Pharmacology and Dosage and Administration].Hypersensitivity ReactionsAblavar may cause anaphylactoid and/or anaphylactic reactions, including life-threatening or fatal reactions. In clinical trials, anaphylactoid and/or anaphylactic reactions occurred in two of 1676 subjects. If anaphylactic or anaphylactoid reactions occur, stop Ablavar Injection and immediately begin appropriate therapy. Observe patients closely, particularly those with a history of drug reactions, asthma, allergy or other hypersensitivity disorders, during and up to several hours after Ablavar administration. Have emergency resuscitative equipment available prior to and during Ablavar administration.
Acute Renal FailureIn patients with renal insuffi ciency, acute renal failure requiring dialysis or worsening renal function have occurred with the use of other gadolinium agents. The risk of renal failure may increase with increasing dose of gadolinium contrast. Screen all patients for renal dysfunction by obtaining a history and/or laboratory tests. Consider follow-up renal function assessments for patients with a history of renal dysfunction. No reports of acute renal failure were observed in clinical trials of Ablavar [see Clinical Pharmacology]. QTc Prolongation and Risk for ArrhythmiasIn clinical trials, a small increase (2.8 msec) in the average change from baseline in QTc was observed at 45 minutes following Ablavar administration; no increase was observed at 24 and 72 hours. A QTc change of 30 to 60 msec from baseline was observed in 39/702 (6%) patients at 45 min following Ablavar administration. At this time point, 3/702 (0.4%) patients experienced a QTc increase of > 60 msec. These QTc prolongations were not associated with arrhythmias or symptoms. In patients at high risk for arrhythmias due to QTc prolongation (e.g., concomitant medications, underlying cardiac conditions) consider obtaining baseline electrocardiograms to help assess the risks for Ablavar administration. If Ablavar is administered to these patients, consider follow-up electrocardiograms and risk reduction measures (e.g., patient counseling or intensive electrocardiography monitoring) until most Ablavar has been eliminated from the blood. In patients with normal renal function, most Ablavar was eliminated from the blood by 72 hours following injection [see Clinical Pharmacology].
ADVERSE REACTIONSBecause clinical studies are conducted under widely varying conditions, adverse reaction rates observed in the clinical studies of a drug cannot be directly compared to rates in the clinical studies of another drug and may not refl ect the rates observed in practice. Clinical Studies ExperienceAnaphylaxis and anaphylactoid reactions were the most common serious reactions observed following Ablavar injection administration [see Warnings and Precautions].In all clinical trials evaluating Ablavar with MRA, a total of 1,676 (1379 patients and 297 healthy subjects) were exposed to various doses Ablavar. The mean age of the 1379 patients who received Ablavar was 63 years (range 18 to 91 years); 66% (903) were men and 34% (476) were women. In this population, there were 80% (1100) Caucasian, 8% (107) Black, 12% (159) Hispanic, 1% (7) Asian, and < 1% (6) patients of other racial or ethnic groups. Table 2 shows the most common adverse reactions (≥1%) experienced by subjects receiving Ablavar at a dose of 0.03 mmol/kg.
Table 2 Common Adverse Reactions in 802 SubjectsReceiving Ablavar at 0.03 mmol/kg
Preferred Term n (%)
Pruritis 42 (5) Headache 33 (4) Nausea 33 (4) Vasodilatation 26 (3) Paresthesia 25 (3) Injection site bruising 19 (2) Dysgeusia 18 (2) Burning sensation 17 (2) Venipuncture site bruise 17 (2) Hypertension 11 (1) Dizziness (excluding vertigo) 8 (1) Feeling cold 7 (1)
Post-marketing ExperienceBecause post-marketing reactions are reported voluntarily from a population of uncertain size, it is not always possible to reliably estimate their frequency or establish a causal relationship to drug exposure. The profi le of adverse reactions identifi ed during the post-marketing experience outside the United States was similar to that observed during the clinical studies experience.
DRUG INTERACTIONSFollowing injection, Ablavar binds to blood albumin and has the potential to alter the binding of other drugs that also bind to albumin. No drug interaction reactions were observed in clinical trials. Consider the possibility of Ablavar interaction with concomitantly administered medications that bind to albumin. An interaction may enhance or decrease the activity of the concomitant medication [see Clinical Pharmacology].WarfarinIn a clinical trial of 10 patients receiving a stable dose of warfarin, a single dose of Ablavar (0.05 mmol/kg) did not alter the anticoagulant activity of warfarin as measured by the International Normalized Ratio (INR).
USE IN SPECIFIC POPULATIONSPregnancyPregnancy Category CThere are no adequate and well-controlled studies of Ablavar in pregnant women. In animal studies, pregnant rabbits treated with gadofosveset trisodium at doses 3 times the human dose (based on body surface area) experienced higher rates of fetal loss and resorptions. Because animal reproduction studies are not always predictive of human response, only use Ablavar during pregnancy if the diagnostic benefi t justifi es the potential risks to the fetus. In reproductive studies, pregnant rats and rabbits received gadofosveset trisodium at various doses up to approximately 11 (rats) and 21.5 (rabbits) times the human dose (based on body surface area). The highest dose resulted in maternal toxicity in both species. In rabbits that received gadofosveset trisodium at 3 times the human dose (based on body surface area), increased post-implantation loss, resorptions, and dead fetuses were observed. Fetal anomalies were not observed in the rat or rabbit offspring. Because pregnant animals received repeated daily doses of Ablavar, their overall exposure was signifi cantly higher than that achieved with a single dose administered to humans.Nursing MothersIt is not known whether gadofosveset is secreted in human milk. Because many drugs are excreted in human milk, caution should be exercised when Ablavar is administered to a woman who is breast-feeding. The risks associated with exposure of infants to gadolinium-based contrast agents in breast milk are unknown. Limited case reports indicate that 0.01 to 0.04% of the maternal gadolinium dose is excreted in human breast milk. Studies of other gadolinium products have shown limited gastrointestinal absorption. These studies were conducted with gadolinium products with shorter half-lives than Ablavar. Avoid Ablavar administration to women who are breastfeeding unless the diagnostic information is essential and not obtainable with non-contrast MRA.In animal studies, less than 1% of gadofosveset at doses up to 0.3 mmol/kg was secreted in the milk of lactating rats. Pediatric UseThe safety and effectiveness of Ablavar in patients under 18 years of age have not been established. The risks associated with Ablavar administration to pediatric patients are unknown and insuffi cient data are available to establish a dose. Because Ablavar is eliminated predominantly by the kidneys, pediatric patients with immature renal function may be at particular risk for adverse reactions.Geriatric UseIn clinical trials, no overall differences in safety and effi cacy were observed between subjects 65 years and older and younger subjects. Whereas current clinical experience has not identifi ed differences in responses between elderly and younger patients, greater susceptibility to adverse experiences of some older individuals cannot be ruled out.
NONCLINICAL TOXICOLOGYCarcinogenesis, Mutagenesis, Impairment of FertilityLong-term animal studies have not been performed to evaluate the carcinogenic potential of gadofosveset. Gadofosveset was negative in the in vitro bacterial reverse mutation assay, CHO chromosome aberration assay, and the in vivo mouse micronucleus assay. Administration of up to 1.5 mmol/kg (8.3 times the human dose) to female rats for 2 weeks and to male rats for 4 weeks did not impair fertility [see Use in Specifi c Populations].
HOW SUPPLIED/STORAGE AND HANDLINGAblavar Injection is a sterile, clear, colorless to pale yellow solution containing 244 mg/mL (0.25 mmol/mL) of gadofosveset trisodium in rubber-stoppered glass vials with an aluminum seal. Ablavar Injection is supplied as follows: NDC 11994-012-01 - 10 mL fi lls in 10 mL single use vials packages of 10 vialsNDC 11994-012-02 - 15 mL fi lls in 20 mL single use vials in packages of 10 vialsStore Ablavar Injection up to 25°C (77°F: excursions permitted to 15 to 30°C [59 to 86°F]). Protect from light and freezing.
PATIENT COUNSELING INFORMATIONInstruct patients receiving Ablavar Injection to inform their physician or healthcare provider if they:
• are pregnant or breast feeding• have a history of allergic reaction to contrast media, a history of
bronchial asthma or allergic respiratory disorder• have a history of kidney and/or liver disease • have recently received a gadolinium-based contrast agent• have a history of heart rhythm disturbances, or cardiac disease• are taking any prescription or over-the counter medications
Gadolinium-based contrast agents, including Ablavar, increase the risk for NSF in patients with severe renal insuffi ciency or acute renal insuffi ciency of any severity due to the hepato-renal syndrome or in the perioperative setting of liver transplantation. Patients with less severe renal insuffi ciency who receive repetitive administrations of a gadolinium-based contrast agent may have an increased risk for the development of NSF, especially if the time interval between the administrations precludes clearance of the previously administered contrast agent from the body. If Ablavar is administered in these situations, instruct patients to contact their physician or healthcare provider if they develop signs or symptoms of NSF, such as burning, itching, swelling, scaling, hardening and tightening of the skin, red or dark patches on the skin, stiffness in joints with trouble moving, bending or straightening of the arms, hands, legs, or feet, pain deep in the hip bones or ribs, or muscle weakness [see Warnings and Precautions (5.1)].Inform patients that they may experience:
• reactions at the injection site, such as: redness, mild and transient burning or pain or feeling of warmth or coldness
• side effects of itching or nausea
To report SUSPECTED ADVERSE REACTIONS, contact Lantheus Medical Imaging, Inc. at 1-978-667-9531/1-800-362-2668 or FDA at 1-800-FDA-1088 or www.fda.gov/medwatch
Distributed by Lantheus Medical Imaging, Inc., 331 Treble Cove Road, North Billerica, MA 01862, United StatesUS Patents: 7,060,250; 7,229,606; and 5,919,967
BRIEF SUMMARY
515903-1009 October 2009
17720_planth_radiologic_technology_fi.indd 2 8/11/10 10:03:12 AM

CT Basics A New Interactive Series
essentialeducation©2009 ASRT. All rights reserved.
CT Basics:Module 1 – FundamentalsModule 2 – Equipment
and InstrumentationModule 3 – Data AcquisitionModule 4 – Image Processing
and ReconstructionModule 5 – Patient Safety
www.asrt.org/CTBasics
Module 6 – Image QualityModule 7 – ProceduresModule 8 – Cross-sectional Anatomy
of the Head and NeckModule 9 – Cross-sectional Anatomy
of the Chest, Abdomen and PelvisModule 10 – Additional Applications
Update Your
Skill SetProfessional
Earn CE credit with these popular and animated courses and keep up with the expanding influence of computed tomography.
Complete all 10 for-credit modules and receive a document from the ASRT recognizing your achievement!Also available: Institutional version licensed for education and staff trainings.

5RADIOLOGIC TECHNOLOGY September/October 2010, Vol. 82/No. 1
An Offi cial JournalRadiologic Technology (ISSN 0033-8397) is the
offi cial scholarly/professional journal of the American Society of Radiologic Technologists. It is published bimonthly at 15000 Central Ave SE, Albuquerque, NM 87123-3909. Months of issue are January/February, March/April, May/June, July/August, September/October and November/De-cember. Periodical class postage paid at Albuquer-que, NM, and at additional mailing offi ces. Printed in the United States. ©2010 American Society of Radiologic Technologists.
The research and information in Radiologic Technology are generally accepted as factual at the time of publication. However, the ASRT and authors disclaim responsibility for any new or contradictory data that may become available after publication. Opinions expressed in the Journal are those of the authors and do not necessarily refl ect the views or policies of the ASRT.
PostmasterPostmaster: Send change of address to
Radiologic Technology, c/o the American Society of Radiologic Technologists, 15000 Central Ave SE, Albuquerque, NM 87123-3909.
EditorialRadiologic Technology is a peer-reviewed journal
produced by the American Society of Radiologic Technologists for the benefi t and advancement of all technological disciplines within medical imaging and radiation therapy. Editorial correspondence should be addressed to Radiologic Technology Editor, 15000 Central Ave SE, Albuquerque, NM 87123-3909. Phone 505-298-4500, 8 a.m. to 4:30 p.m. Mountain time; e-mail [email protected]. Letters of inquiry prior to fi nished manuscript production are encouraged and frequently will be reviewed by both the editor and the chairman of the Editorial Review Board.
The initials “R.T.” following proper names in this journal refer to individuals certifi ed by the American Registry of Radiologic Technologists.
Subscriptions, Change of AddressASRT member change of address: Address
correspondence to the American Society of Radiologic Technologists, Attention: Member Services, 15000 Central Ave SE, Albuquerque, NM 87123-3909. Call the ASRT offi ce from 8 a.m. to 4:30 p.m. Mountain time at 800-444-2778; fax 505-298-5063. ASRT members also can submit changes of address online at www.asrt.org/myinfo.
Nonmember subscriber change of address: Send an old mailing label and the new address, including ZIP code, at least 6 weeks in advance to ASRT, Attention: Member Services, 15000 Central Ave SE, Albuquerque, NM 87123-3909. Claims are not allowed for issues lost as a result of insuffi cient notice of change of address. The publisher cannot accept responsibility for unde-livered copies.
Subscription rates and order processing: Member subscription is $7.03 per year, included in ASRT member dues. Nonmember subscription of one volume of 6 issues is $70 within the United States for individuals; foreign, $105, including Canada. Institutional rates also are available. Dis-counted rates apply to 2- and 3-year subscriptions and subscription agencies. Single issues, both cur-rent and back, exist in limited quantities and are offered for sale. For prices and availability, phone ASRT Member Services at 800-444-2778. Journal orders must be paid in advance by check, money order or credit card drawn on a U.S. bank in U.S. funds only. Send payment to ASRT, PO Box 27447, Albuquerque, NM 87125-7447. Prices are subject to change.
AdvertisingAll commercial display advertising and classifi ed
advertising is handled by the ASRT Corporate Rela-tions Department, 15000 Central Ave SE, Albuquer-que, NM 87123-3909. For information on rates and deadlines, contact JoAnne Quirindongo at 800-444-2778, Ext. 1317, or e-mail [email protected].
Radiologic Technology reserves the right to reject or revise any advertising copy that it considers objectionable, either because said copy is not consistent with usual professional standards of propriety or for any other reason deemed material. In any event, the advertiser assumes full liability for the content of all advertising copy printed.
All advertising materials submitted become the property of ASRT. Advertisements submitted beyond the deadline for proof service are done so at the advertiser’s risk. Publication of an advertise-ment in Radiologic Technology does not imply en-dorsement of its claims by the editor or publisher. For advertising specifi cally related to educational programs, ASRT does not guarantee, warrant, claim or in any way express an opinion relative to the accreditation status of said program.
Rights ReservedAll articles, illustrations and other materials
carried herein are pending copyright under U.S. copyright laws, and all rights thereto are reserved by the publisher, the American Society of Radiologic Technologists. Any and all copying or reproduction of the contents herein for general distribution, for advertising or promotion, for creating new collective works or for resale is expressly forbidden without prior written approval by the publisher and, in some cases, the authors.
Copying for personal use only through appli-cation and payment of a per-copy fee as required by the Copyright Clearance Center Inc, under permission of Sections 107 and 108 of the U.S. copyright laws. Violators will be prosecuted.
Member ofBPA International
CT Basics A New Interactive Series
essentialeducation©2009 ASRT. All rights reserved.
CT Basics:Module 1 – FundamentalsModule 2 – Equipment
and InstrumentationModule 3 – Data AcquisitionModule 4 – Image Processing
and ReconstructionModule 5 – Patient Safety
www.asrt.org/CTBasics
Module 6 – Image QualityModule 7 – ProceduresModule 8 – Cross-sectional Anatomy
of the Head and NeckModule 9 – Cross-sectional Anatomy
of the Chest, Abdomen and PelvisModule 10 – Additional Applications
Update Your
ProfessionalEarn CE credit with these popular and animated courses and keep up with the expanding influence of computed tomography.
Complete all 10 for-credit modules and receive a document from the ASRT recognizing your achievement!Also available: Institutional version licensed for education and staff trainings.

6 September/October 2010, Vol. 82/No. 1 RADIOLOGIC TECHNOLOGY
RadiologicTechnologyEditorialReview Board
ASRT Journal Staff Kathryn Faguy, ELS, publications managerEllen Lipman, director of professional developmentJulie James-Griego, art director Marge Montreuil, graphic designer
Laura Reed, graphic designerLoren Stacks, graphic designerJoAnne Quirindongo, advertising and sponsorship manager
ASRT Offi ce 15000 Central Ave SEAlbuquerque, NM 87123-3909Phone: 800-444-2778; Fax: 505-298-5063
For questions regarding subscriptions or missing issues, phone Member Services at 800-444-2778 or e-mail [email protected].
For advertising information, phone JoAnne Quirindongo, advertising and sponsorship manager, at Ext. 1317, or e-mail [email protected].
For questions about submitting an article, e-mail [email protected].
ChairmanNina K Kowalczyk, PhD, R.T.(R)(CT)(QM), FASRTThe Ohio State University Columbus, Ohio Vice ChairmanJames Johnston, PhD, R.T.(R)(CV)Midwestern State UniversityWichita Falls, Texas MembersLaura Carwile Aaron, PhD, R.T.(R)(M)(QM)Northwestern State UniversityShreveport, Louisiana
Melissa B Jackowski, EdD, R.T.(R)(M)University of North CarolinaChapel Hill, North Carolina
Jeffrey S Legg, PhD, R.T.(R)(CT)(QM)Virginia Commonwealth UniversityRichmond, Virginia
Tricia Leggett, DHEd, R.T.(R)(QM)Zane State CollegeZanesville, Ohio
Michael E Madden, PhD, R.T.(R)(CT)(MR)Fort Hays State UniversityHays, Kansas
Kimberly Metcalf, EdD, R.T.(R)(T)Massachusetts General HospitalInstitute of Health ProfessionsBoston, Massachusetts
Dwayne Richardson, MSN, R.T.(R), RNHahnemann University HospitalPhiladelphia, Pennsylvania
Diane Scutt, PhDUniversity of LiverpoolLiverpool, United Kingdom
Joan E Siederer, MPH, R.T.(R)SureWay Marketing ServicesPrinceton, New Jersey
Christina A Truluck, PhD, R.T.(N), CNMTThomas Jefferson UniversityPhiladelphia, Pennsylvania
Bettye G Wilson, MEd, R.T.(R)(CT), RDMS, FASRTUniversity of Alabama at BirminghamBirmingham, Alabama
Ben D Wood, MSRS, R.T.(R)Northwestern State UniversityShreveport, Louisiana
Fluoroscopyessentialeducation
©2010 ASRT. All rights reserved.
www.asrt.org/fluoroscopy
Protect Your Patients.Focus on Fluoroscopy
Protect Yourself.Protect Your Patients.Protect Yourself.
Protect Your Patients.Expand your technical skills, limit radiation risks and improve your knowledge with these essential fluoroscopy courses.
self-directed L E A R N I N G
Earn Category A+ CE credit!
Available now! Radiation Protection and Safety
Operation and Safety of Fixed
Fluoroscopy Units
Regulation and Radiation Protection
More fluoroscopy courses coming soon!

With an Elekta Radiation Therapy Educators Scholarship
With an Elekta Radiation Therapy Educators Scholarship
ASRTEducation and
Research Foundation
®
ASRTEducation and
Research Foundation
Get a Jump on Your Education
Get a Jump on Your Education
www.asrtfoundation.org
www.asrtfoundation.org
For the fifth year in a row, Elekta has helped radiation
therapy educators jump new heights and attain
advanced degrees. If you are ready to jump into
action, apply for a $5,000 Elekta Radiation
Therapy Educators Scholarship at
www.asrtfoundation.org beginning Nov. 1.
Other entry-level and professional scholarships also
are available online for non-educators.
©2010 ASRT Education and Research Foundation. All rights reserved.
©2010 ASRT Education and Research Foundation. All rights reserved.

RADIOLOGIC TECHNOLOGY September/October 2010, Vol. 82/No. 1
. . . . . . . . . . . . . . . . . . . . . . . . . . . . . . . . . . . . . . . . . . . . . . . . . . . . . . . . . . . . . . . . . . .
EDITOR’S NOTE
A Mix of Old and NewKatie Faguy, ELS, is ASRT publications manager.
As Radiologic Technology begins its 82nd volume year, we are pleased to introduce a new cover artist, radiologist Kai-hung Fung of Hong Kong.
Dr Fung is a self-taught new media artist who creates digital artworks using computed tomography and magnetic resonance images and a 3-D computer rendering program. He pioneered a tech-nique that uses contour lines rendered in a rainbow of colors to define 3-D forms and space.
Dr Fung’s artwork has been featured on many websites and in magazines and journals, as well as in several museum exhibitions, both in Hong Kong and the U.S. In 2007, he was the first place winner in the International Science and Engineering Visualization Challenge sponsored by Science and the National Science Foundation.
This issue’s cover artwork, based on a lung scan, is titled “Tropical Rainforest.” The patient has interstitial lung disease, and in this image the terminal branches of the lungs resemble the top of the rain-forest’s canopy at twilight, Dr Fung said.
As for this issue’s content, it combines the ancient and the modern: Directed Reading author Bryant Furlow updates readers on tuberculosis, which may have plagued even our proto-human ancestors and is evolving today into dangerously drug-resistant strains. Readers also will learn the latest on molecular imaging’s role in the war on cancer or cutting-edge techniques for targeting breast biopsies, depending on their area of interest.
In the peer-reviewed section of this issue, researchers examine the best way to image an injury as old as humankind — sprained ankles — and the best way to run a modern mammography center in light of federal requirements and new technology designed to streamline patient throughput.
We hope you enjoy this issue and, as always, welcome your comments and sug-gestions. E-mail us at communications @asrt.org. ◆
AD #: ICT01053E-9 (1/3 pg.)CLIENT: pHILIpSpRODUCT: ICTSIzE: 2.75” x 9.5” (1/3 pg.)COLOR: 4CSCREEN: DATE: jULy/AUg 2010pUbLICATION: RADIOLOgIC TECHNOLOgy
Right side Pg. 1
Now an 80% dose reduction can mean...
_ART_00_PHN_1-3 Pg Ads_P01053E-9.indd 1 16/06/10 2:00 PM
Dr Kai-hung Fung

September/October 2010, Vol. 82/No. 1 RADIOLOGIC TECHNOLOGY
CONTENTS
PEER-REVIEWED ARTICLES
COLUMNS & DEPARTMENTS
DIRECTED READING ARTICLES
Self-stress vs Manual Stress in Talar Tilt RadiographyGary Lentell, Robert J Desch, Susan M Tracz, Lisa M Nyberg . . . . . . . . . . . . . . 14
Managing a Mammography Center: A Model To ThriveStephanie Johnston, James Johnston . . . . . . . . . . . . . . . . . . . . . . . . . . . . . . . . . 22
Tuberculosis: A Review and UpdateBryant Furlow . . . . . . . . . . . . . . . . . . . . . . . . . . . . . . . . . . . . . . . . . . . . . . . . 33
Breast Biopsy Targeting TechniquesPat Baldwin . . . . . . . . . . . . . . . . . . . . . . . . . . . . . . . . . . . . . . . . . . . . . . . 59M
Editor’s Note . . . . . . . . . . . . . . . . . . . . . . . . . . . . . . . . . . . . . . . . . . . . . . . . .9 Open Forum . . . . . . . . . . . . . . . . . . . . . . . . . . . . . . . . . . . . . . . . . . . . . . . . 11 My Perspective . . . . . . . . . . . . . . . . . . . . . . . . . . . . . . . . . . . . . . . . . . . . 87 RE: Registry . . . . . . . . . . . . . . . . . . . . . . . . . . . . . . . . . . . . . . . . . . . . . . . . 89 Literature Review . . . . . . . . . . . . . . . . . . . . . . . . . . . . . . . . . . . . . . . . . . 91On the Job . . . . . . . . . . . . . . . . . . . . . . . . . . . . . . . . . . . . . . . . . . . . . . . . . 93 Teaching Techniques . . . . . . . . . . . . . . . . . . . . . . . . . . . . . . . . . . . . . . 96 Writing & Research . . . . . . . . . . . . . . . . . . . . . . . . . . . . . . . . . . . . . . . . 98Patient Page . . . . . . . . . . . . . . . . . . . . . . . . . . . . . . . . . . . . . . . . . . . . . . 104
. . . . . . . . . . . . . . . . . . . . . . . . . . . . . . . . . . . . . . . . . . . . . . . . . . . . . . . . . . . . . . . . . . . . . . . . . . . . . . . . . . . . . . . . . . . . . . . . . . . . .
On the Cover: “Tropical Rainforest,” based on a lung scan, is the first of 6 cover images by radiologist Kai-hung Fung. For more on Dr Fung’s artwork, see the Editor’s Note on Page 9.
Volume 82/Number 1September/October 2010
10M

RADIOLOGIC TECHNOLOGY September/October 2010, Vol. 82/No. 1
. . . . . . . . . . . . . . . . . . . . . . . . . . . . . . . . . . . . . . . . . . . . . . . . . . . . . . . . . . . . . . . . . . .
OPEN FORUM
Editor:I am concerned about an error in
the July/August 2010 issue of Radiologic Technology. In the Directed Reading “Bleeding Risks in Interventional Radiology,” on page 552 there is a dis-cussion of heparin therapy.
Fractionated and unfractionated hep-arin are confused in this section. Low molecular weight heparin (LMWH) is referred to as unfractionated when in fact the opposite is correct. LMWH should be properly referred to as frac-tionated heparin. The article also refers to the delivery methods of fractionated and unfractionated heparins. The typi-cal method of delivery for LMWH is subcutaneous and for unfractionated heparin by IV. The entire section on heparin is very confusing and mislead-ing due to these errors. It also should be noted that it is unfractionated heparin that is usually given in emergencies or during invasive procedures.
Marvin Mullin, BSRT, R.T.(R)(CV)(via e-mail)
The editor responds: Thank you for clarifying this matter.
Our apologies for the confusion the error caused. ◆
…a cleaner image with the patient in mind.
AD #: ICT01053E-9 (1/3 pg.)CLIENT: pHILIpSpRODUCT: ICTSIzE: 2.75” x 9.5” (1/3 pg.)COLOR: 4CSCREEN: DATE: jULy/AUg 2010pUbLICATION: RADIOLOgIC TECHNOLOgy
Right side Pg. 2
_ART_00_PHN_1-3 Pg Ads_P01053E-9.indd 2 16/06/10 2:00 PM
Heparin ConfusionOpen Forum is open to all individuals interested in com-menting on matters of concern to the radiologic sciences. Writers should e-mail their letters to [email protected]. Letters may be edited to conform with the Journal’s space or style requirements.
Views expressed in this column do not necessarily reflect the views of the ASRT.

©2009 ASRT. All rights reserved.
l Search and apply for jobs online.
l Job Alerts e-mailed to you when job postings match your preferences.
l ASRT Salary Estimator provides a salary comparison to other R.T.s in your state who work in the same specialty as you do.
l Résumé Builder allows you to upload an existing résumé or create a new one.
l My Site lets you highlight your academic and professional accomplishments in a personalized, professional Web site.
www.asrt.org/jobs
An R.T.’s Best Friend!ASRT’s JobBank® is the source for job seekers in the radiologic sciences.
Unique courses to meet speciality needs
❖ Bone Densitometry 3-24 A/A+ CEUs
❖ Cardio / Pulmonary 12-24 A/A+ CEUs
❖ CT Central 3-24 A/A+ CEUs
❖ Fluoro & Rad Management 12 A CEUs
❖ 3-24 A/A+ CEUs
Imaging (Orthopedics, Chest, Spine,
Abuse, Obesity, Drug Abuse)
◆ Courses by mail or ebook◆ Test online 24/7◆ Order online 24/7◆ Free e-mail certificate
X-Ray Lady CE SM
6511 Glenridge Park Place, Suite 6Louisville, KY 40222
Phone: 502-425-0651 Fax: 502-327-7921
❖ Digital Mammography 5-12 A CEUs
❖ Image Guided / Stereo 5-6 A CEUs
❖ 3-16 A/A+ CEUs Mammography (Breast Cancer, Males, Children/Adolescents, At-Risk, Implants, Quality)
e-mail: [email protected] www.x-raylady.com
X-Ray Lady CE SM
Since 1973
All courses are ASRT approved A or A+Over 80 courses to choose from online
www.x-raylady.com
CESM FOR IMAGING PROFESSIONALSX
Join X-Ray Lady e-mail list. Receive advance notice of CE sales OR click on the sale icon on our home page at www.x-raylady.com
©2007 ASRT. All rights reserved.
CE opportunities to suit your needs.
Can be an area other than your primary
sphere of practice.
Select Your Area of Interest.
Get MoreMembership!
From Your ASRT
Edit your member information at
www.asrt.org or call 800-444-2778, Press 5.

AD #: ICT01053E-9CLIENT: PHILIPSPRODUCT: ICTSIzE: 8” X 10.5” (FP)COLOR: 4CSCREEN: DATE: jULy/AUg 2010PUbLICATION: RADIOLOgIC TECHNOLOgy
Right side
Lower radiation dose levels don’t have to mean lower image quality. The Philips iDose feature reduces the noise
and artifacts that result from a lower radiation dose. Now, you can reduce the dose by up to 80% and still maintain
diagnostic image quality. It is our latest evolution of DoseWise radiation management, our
commitment to high image quality at a low dose. To see
for yourself, take the challenge at www.philips.com/iDoseAd.
*Because our innovations are inspired by you.
What inspired our high-quality, low-dose Ct innovation? exposing less and revealing more.
_ART_00_PHN_iDose Ad_P01053E-9.indd 1 16/06/10 2:02 PM

PEER REVIEW
14 September/October 2010, Vol. 82/No. 1 RADIOLOGIC TECHNOLOGY
. . . . . . . . . . . . . . . . . . . . . . . . . . . . . . . . . . . . . . . . . . . . . . . . . . . . . . . . . . . . . . . . . . . . . . . . . . . . . . . . . . . . . . . . . . . . . . . . . . .
Background Radiographic study following inversion ankle sprain commonly is used to determine the presence of anatomic laxity across the talocrural joint.Purpose To compare the degree of talar tilt derived from a radiographic ankle stress exam under 2 conditions: self-stress vs manual stress applied by the clinician. Methods Twenty-four subjects seeking medical care following ankle sprain underwent talar tilt stress exams of both ankles. The involved ankle was imaged with self-stress by use of a strap and with the clinician providing manual stress during the imaging exam. Mean talar tilt for the self-stress method was 2.2°, compared with 5.9° for the manual stress method (P < .001).Results Significantly greater and clinically meaningful differences in talar tilt angle were found when manual stress was provided by the clinician. To avoid false negative findings of anatomic laxity in stress talar tilt studies at the ankle, a standardized procedure in which the clinician provides manual stress may be necessary.
GARY LENTELL, DPTROBERT J DESCH, MA, R.T.(R)SUSAN M TRACZ, PhD LISA M NYBERG, PhD
Self-stress vs Manual StressIn Talar Tilt Radiography
Ankle sprains are one of the most common complaints managed in the musculoskele-tal practice setting. It is estimated that 25 000 sprains occur daily in the United States,1 and these can account for up to 1
in 10 emergency department visits.2 Many people with past acute ankle sprains report frequent recurrence and a sense of instability.3,4
It is accepted that standardized and reproducible radiographic procedures, along with the medical his-tory and physical examination, are vital components of the diagnostic process involving the musculoskeletal system.5 In both acute and chronic conditions of ankle instability, radiographic study with applied inversion stress, promoting a talar tilt to the ankle, is used to determine the presence and magnitude of anatomic laxity. In many settings, this protocol calls for the radiologic technologist or other medical professional to manually place and hold the patient’s ankle in a position of inversion stress when obtaining the radio-graph. In other settings, the patient self-positions and holds the ankle in inversion stress by use of a strap. Self-positioning protocols are less demanding of resources and result in less radiation exposure to
radiographic department personnel than manual posi-tioning protocols.
It is not known whether the results of talar tilt radiographs of the ankle performed using the patient self-stress method produce similar findings compared with the manual-stress exam method. Therefore, the purpose of this study was to determine whether there were significant differences in the outcome of the talar tilt stress radiographs using the 2 different methods in patients with suspected anatomic laxity of the ankle.
Literature Review While the use of talar tilt stress radiography is com-
monly identified in the literature for the assessment of ankle instability following a history of sprain, very little is found comparing the outcome between manual stress and self-stress techniques. A search utilizing the CINAHL Plus, Google Scholar and Science Digest data-bases found no articles directly comparing outcomes between these 2 procedures. Therefore, the research question addressed by this study was whether the radiographic outcome from a stress radiograph talar tilt carried out manually by the clinician would be com-parable to that obtained when self-stress was applied

. . . . . . . . . . . . . . . . . . . . . . . . . . . . . . . . . . . . . . . . . . . . . . . . . . . . . . . . . . . . . . . . . . . . . . . . . . . . . . . . . . . . . . . . . . . . . . . . . . . . . . . . . . .
15RADIOLOGIC TECHNOLOGY September/October 2010, Vol. 82/No. 1
LENTELL, DESCH, TRACZ, NYBERG
Improper evaluation and management of an acute ankle sprain may lead to chronic ankle instability, pain, swelling, giving way and repetitive injury. Up to 40% of those with a substantial episode of acute ankle sprain may develop functional instability at the ankle, defined as giving way of the ankle under normal activities of daily living.17 In addition to mild anatomic laxity, con-tributing factors to this condition can include chronic strength deficits and deficits in proprioception, as defined by loss of passive movement awareness involv-ing the ankle joint complex.18
Stress radiographs of the ankle are a vital tool for identifying the degree of anatomic instability associ-ated with the inversion injury in both acute injury and chronic complaint. A common radiographic study is an anteroposterior radiograph of the talocrural joint with inversion stress applied across the ankle complex. This study assesses the relationship between the talocrural joint mortise proximally and the dome of the talus dis-tally.19 Talar tilt under radiographic study is operation-ally defined as the angle created by the intersection of the reference lines parallel to the articular surface of the tibial-fibular articulation and the proximal surface of the talus.9,18,20,21
In the healthy ankle, the lateral ligaments of the ankle complex fully constrain the dome of the talus within the mortise, leading to a minimal talar tilt angle of less than 3° to 5° (see Figure 1).22 Breitenseher et al found that 1 in 3 patients with a talar tilt of 6° to
to the ankle by the patient presenting with a history of inversion ankle sprain.
Ankle sprains occur when excessive external forces are applied to the joint, typically owing to unexpected movement initiated by body segments above the ankle, over the planted foot.4,6-8 Although sprained ankles occur across many activities of daily living and work, sports frequently are associated with ankle sprains. The most common of these are basketball, football and cross-county running.1
Between 80% and 90% of all ankle sprains are due to an inversion injury, which sprains the lateral ligamentous complex of the ankle.8-10 The ankle joint is constrained laterally by the anterior and posterior talofibular ligaments, the large calcaneofibular liga-ment centrally and the joint capsule. Inaba reported that of the 3 lateral ligaments, the anterior talofibular ligament is the weakest and most subject to injury. As a result, 65% of ankle sprain injuries are confined to the anterior talofibular ligament; an additional 20% also involve tearing of the calcaneofibular ligament.11
Following standard radiographs to rule out frac-ture,12 the clinical severity of ligament damage follow-ing an acute inversion sprain generally is assessed as 1 of 3 grades.1,8,13 Grade I sprains usually are marked clinically by minimal pain, swelling or loss of func-tional ability. Grade II sprains tend to be accompanied by moderate pain and swelling, with difficultly in bear-ing weight. In Grade III sprains, there is a complete rupture of soft tissue constraints with substantial pain, swelling, bruising and inability to bear weight.
Patients with Grade I injuries, which may involve a minor anatomic tear, present with pain, but no abnor-mal movement in the ankle joint under stress. Grade II injuries are characterized by pain and some degree of abnormal excessive movement upon clinical examina-tion. Integrity of both the calcaneofibular ligament and the anterior talofibular ligament are questionable if there is abnormal movement caused by talar tilt stress.10,11,14 Grade III injuries show gross laxity under stress, without a discernible end point.
Grading the severity of the acute ankle sprain assists in establishing a prognosis and provides a guide for management interventions. Grade II ankle injuries typi-cally remain symptomatic more than a month following injury, with residual edema, loss of mobility, strength and function.15 Documenting the presence of major ana-tomic instability following a grade III ankle injury in a high-demand athlete traditionally leads to consideration of surgical reconstruction of the torn ligaments.16
Figure 1. Stress inversion radiograph of the healthy ankle, demonstrating minimal talar tilt within the ankle mortise.
. . . . . . . . . . . . . . . . . . . . . . . . . . . . . . . . . . . . . . . . . . . . . . . . . . . . . . . . . . . . . . . . . . . . . . . . . . . . . . . . . . . . . . . . . . . . . . . . . . . . . . . . . . .TALAR TILT RADIOGRAPHY
16 September/October 2010, Vol. 82/No. 1 RADIOLOGIC TECHNOLOGY
Although medical facilities currently use either the manual stress or the patient self-stress method when performing ankle stress exams, there is lack of con-sensus concerning the relative effectiveness of these 2 methods. A literature review found no studies directly comparing the findings of the 2 procedures. Therefore, the purpose of this study was to determine whether the patient self-stress method created a similar amount of talar tilt as the manual stress method.
Methodology A convenience sample of 24 subjects, 12 men and 12
women, aged 18 to 46 years (22.4 � 6.5) participated
14° had ruptured lateral ligaments, while almost half presented with ligament rupture when talar tilt angles were greater than 15°.23 In the presence of a major, acute ankle sprain, fully rupturing all lateral con-straints, tilt angles up to 50° have been reported in the literature.14
Chronic conditions of functional ankle instability may reveal only subtle changes in talar tilt.18 When only one ankle is functionally unstable, the magnitude of talar tilt is determined for both ankles and compared, using the contralateral ankle to establish a normal baseline measurement.
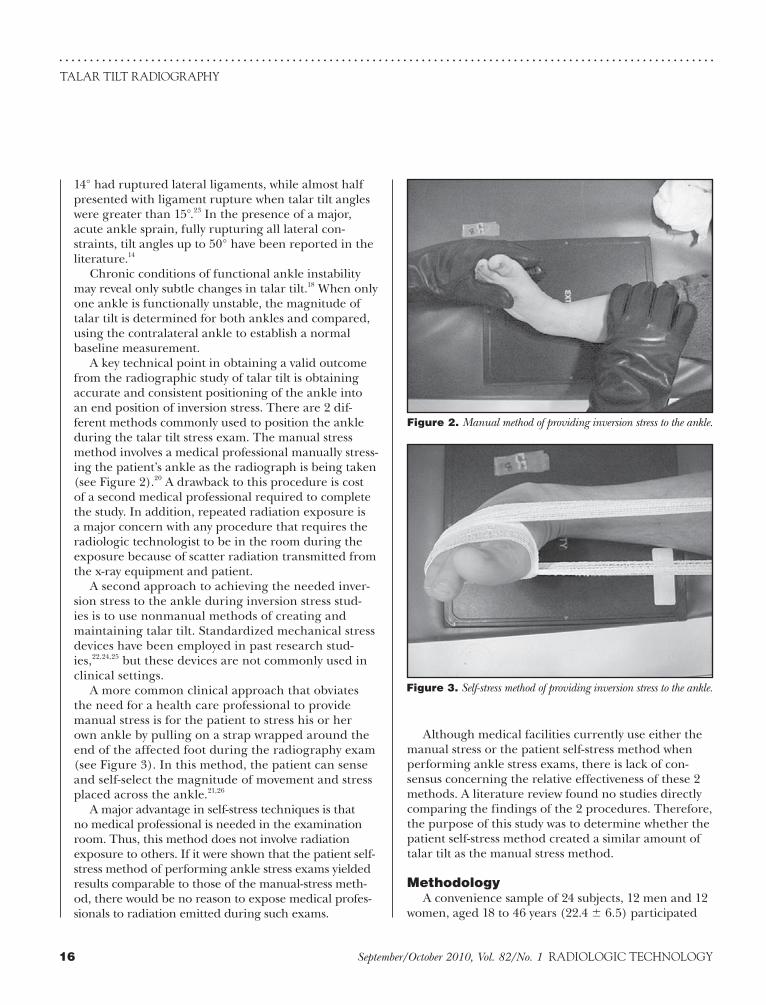
A key technical point in obtaining a valid outcome from the radiographic study of talar tilt is obtaining accurate and consistent positioning of the ankle into an end position of inversion stress. There are 2 dif-ferent methods commonly used to position the ankle during the talar tilt stress exam. The manual stress method involves a medical professional manually stress-ing the patient’s ankle as the radiograph is being taken (see Figure 2).20 A drawback to this procedure is cost of a second medical professional required to complete the study. In addition, repeated radiation exposure is a major concern with any procedure that requires the radiologic technologist to be in the room during the exposure because of scatter radiation transmitted from the x-ray equipment and patient.
A second approach to achieving the needed inver-sion stress to the ankle during inversion stress stud-ies is to use nonmanual methods of creating and maintaining talar tilt. Standardized mechanical stress devices have been employed in past research stud-ies,22,24,25 but these devices are not commonly used in clinical settings.
A more common clinical approach that obviates the need for a health care professional to provide manual stress is for the patient to stress his or her own ankle by pulling on a strap wrapped around the end of the affected foot during the radiography exam (see Figure 3). In this method, the patient can sense and self-select the magnitude of movement and stress placed across the ankle.21,26
A major advantage in self-stress techniques is that no medical professional is needed in the examination room. Thus, this method does not involve radiation exposure to others. If it were shown that the patient self-stress method of performing ankle stress exams yielded results comparable to those of the manual-stress meth-od, there would be no reason to expose medical profes-sionals to radiation emitted during such exams.
Figure 2. Manual method of providing inversion stress to the ankle.
Figure 3. Self-stress method of providing inversion stress to the ankle.

. . . . . . . . . . . . . . . . . . . . . . . . . . . . . . . . . . . . . . . . . . . . . . . . . . . . . . . . . . . . . . . . . . . . . . . . . . . . . . . . . . . . . . . . . . . . . . . . . . . . . . . . . . .
17RADIOLOGIC TECHNOLOGY September/October 2010, Vol. 82/No. 1
LENTELL, DESCH, TRACZ, NYBERG
for the first 12 subjects tested, and the order of the exams was reversed for the second half of the subjects in this study.
All manual stress exams were performed by a single radiologic technologist with 16 years of full-time prac-tice in the radiology department of the Student Health Center of California State University, Fresno. An anteroposterior projection of the ankle was taken with the technologist holding the patient’s lower one-third of the leg in the anterior position with one hand, while the other hand created and held the inversion stress position through the midfoot (see Figure 4).
The patient self-stress method to create talar tilt was carried out as follows: The patient was positioned in an upright seated position with the leg to be radiographed in the frontal plane. A Kendall bandage (Covidien, Dublin, Ireland) was wrapped once around the mid-foot, with the 2 equal ends of the bandage given to the patient to hold. Keeping the leg in the frontal position, the patient was instructed to pull on the inner strap as hard as he or she could tolerate to create inversion posi-tioning stress at the ankle. The procedure was explained to each patient once before he or she was asked to per-form it independently for the exposure, which used a 40 in source-to-image distance (see Figure 5).
All radiographs were obtained using a Trans-Continental radiographic high-frequency generator TM 40 unit (Trex Medical Corporation, Danbury, Connecticut). Cassettes used were rare earth detail screens with green sensitive film. The film processing system used was a Dupont 90-second processor (Dupont Imaging Systems, Bridgeport, Connecticut).
in this study. The use of subjects in this study received approval through the Committee for the Protection of Human Subjects at California State University, Fresno. Subjects were recruited from a patient popula-tion of the Student Health Center at California State University, Fresno. All patients presented with a prima-ry complaint of acute or chronic ankle pain or injury to one ankle, for which an inversion injury was medically suspected and a talar tilt stress radiograph was medi-cally indicated.
Following collection of demographic information, including mechanism of ankle injury and presence or absence of swelling (see Table 1), each subject underwent radiographic ankle stress exams. A manual stress talar tilt exam was performed on both ankles to allow comparison of findings between the involved and uninvolved ankles. Each subject in this study also underwent a self-stress exam of the involved ankle. To determine whether the order in which the 2 exams were performed influenced the results, the manual stress exam was performed before the self-stress exam
Table 1Subject Characteristics Related to Ankle
Injury (N = 24)
Variable n (%)
Recalled injury
YesNo
231
964
Twisted YesNo
195
7921
Fell YesNo
123
496
Kicked YesNo
123
496
Time since recalled injury
Less than 1 week 15 63
One week to 1 month 1 4
More than 1 month 8 33
Able to bear weight
YesNo
231
964
Swelling present
YesNo
195
7921
Figure 4. Talar tilt radiographs using the manual stress method.

. . . . . . . . . . . . . . . . . . . . . . . . . . . . . . . . . . . . . . . . . . . . . . . . . . . . . . . . . . . . . . . . . . . . . . . . . . . . . . . . . . . . . . . . . . . . . . . . . . . . . . . . . . .TALAR TILT RADIOGRAPHY
18 September/October 2010, Vol. 82/No. 1 RADIOLOGIC TECHNOLOGY
Finally, a 2 x 2 repeated measures ANOVA determined whether there were significant differences in talar tilt values based on the type of talar tilt and the order of stress testing. This analysis was conducted to compare differences in talar tilt between self-stress and manual stress exam procedures, to determine whether any differences occurred depending on the order of the self-stress and manual stress exams, and to test for the interaction between the type of exams and the order in which they were administered.
Results Seventy-nine percent of subjects recalled a specific
twisting injury to their ankle, and 4% recalled a kick or a fall as causing their injury. Ninety-six percent were able to bear weight or walk into the x-ray exam room, and 79% presented with observed swelling (see Table 1). The talar tilt values across the sample between the self-stress and manual stress methods are presented
One radiologist used a standard goniometer to measure the angle of talar tilt on all radiographs.18 This was done by placing the goniometer on the ankle radiograph with the midline fulcrum point on the outer point of the medial malleolus at the level slightly above the talus bone on the distal end of the tibia. A first line was drawn tangential to the superior talar surface, and a second line was drawn tangential to the tibia articular surface. The intersection of these 2 lines documented the talar tilt present, measured in degrees (see Figure 6).
Talar tilt values were documented across the sample as collected under manual stress of the involved ankle, manual stress of the uninvolved ankle and self-stress of the involved ankle. A paired t-test was calculated to determine whether significant differences were present in the talar tilt generated between the manual and self-stress methods of the involved ankle. Two independent t-tests were conducted to examine differences in mean talar tilt values by sex and the presence of swelling.
Figure 6. Documentation of talar tilt in degrees, using goniometer. Figure 5. Talar tilt radiograph using the self-stress method.

. . . . . . . . . . . . . . . . . . . . . . . . . . . . . . . . . . . . . . . . . . . . . . . . . . . . . . . . . . . . . . . . . . . . . . . . . . . . . . . . . . . . . . . . . . . . . . . . . . . . . . . . . . .
19RADIOLOGIC TECHNOLOGY September/October 2010, Vol. 82/No. 1
LENTELL, DESCH, TRACZ, NYBERG
greater, and presumably more accurate, talar tilt values than did the alternative method of stress supplied by the patient. In the sample of 24 subjects used in this study, the magnitude of difference in talar tilt value under manual vs self-stress in the same patient was as great as 10°.
The design of this study did not directly attempt to determine why manual vs patient-created talar tilt stress should yield measures so dissimilar. Sex differences were not a factor, as the differences in values between the 2
in Table 2. Across the 24 involved ankles in this study, a significant difference (P < .001) was found between the mean talar tilt value for the manual stress method (5.9°) compared with 2.2° for the self-stress method.
The variance of values generated between the 2 stress methods was nearly identical. However, the mean magnitude of talar tilt of 5.9° generated manually by the skilled practitioner was more than double the mean of 2.2° generated across the sample by the self-stress method. This difference in the amount of tilt gener-ated between the 2 methods was statistically significant and clinically meaningful.
Talar tilt values generated through the self-stress method are broken down by sex and presence of swell-ing in Table 3. Although the mean tilt of 3.0° generated across female subjects was more than double that gen-erated in male subjects, this was not a statistically sig-nificant (P < .05) finding. The presence of swelling in the subject’s ankle had no effect on the talar tilt values generated by self-stress for men vs women, with mean values equal between the 2 groups.
Three research questions were addressed in Table 4. First, a statistical test of the order in which the 2 stress tests were administered was calculated. In half of the patients, the manual test was administered first followed by the self-test. In the other half of the patients, the self-test was administered first followed by the manual test. However, there was no significant order differ-ence (F1,22 = 0.07, P = .79). The ANOVA test of type (manual vs self) duplicates the t test reported in Table 2, and therefore is also significant (F1,22 = 2.49, P < .01). The interaction of the combined effect of the test type (manual vs self) and the order in which the exams were administered was not significant (F1,22 = 0.23, P = .64).
Discussion The purpose of
this study was to determine whether there was a signifi-cant difference in talar tilt between the manual stress exam and the patient self-stress exam. Results of this study found the manual stress method of performing ankle stress radiography yielded significantly
Table 2Comparison of Talar Tilt Values for Manual
Stress vs Self-stress
(N = 24)
Mean SD t df P
Self-stress 2.2 3.1 -5.78 23 <.001
Manual stress 5.9 3.2
Table 3Talar Tilt Values Generated Through Self-stress
Method by Sex and Presence of Swelling
(N = 24)
n Mean SD t df P
Sex
Male 12 1.3 2.4 1.36 22 .19
Female 12 3.0 3.5
Swelling
Yes 19 2.2 3.1 -0.03 22 .98
No 5 2.2 3.5
Table 4 Summary for Repeated Measures ANOVA of Talar Tilt by Stress Test and
Order Sequence
Source SS df MS F P
Order 1.40 1 1.40 0.07 .79
Error (order) 413.52 22 18.80
Type 169.93 1 169.93 2.49 <.001
Type by order 1.18 1 1.18 0.23 .64
Error (type) 115.07 22 5.23
SS = self-stress method; MS = manual stress method.

. . . . . . . . . . . . . . . . . . . . . . . . . . . . . . . . . . . . . . . . . . . . . . . . . . . . . . . . . . . . . . . . . . . . . . . . . . . . . . . . . . . . . . . . . . . . . . . . . . . . . . . . . . .TALAR TILT RADIOGRAPHY
20 September/October 2010, Vol. 82/No. 1 RADIOLOGIC TECHNOLOGY
indentified when a self-stress protocol is routinely used in clinical practice. This practice could be associated with an unacceptable level of false negative findings in patients complaining of ankle sprains or instability. Falsely concluding that laxity is not present could con-tribute to inappropriate decisions regarding the need for surgery or rehabilitation for such a patient. This, in turn, could potentially contribute to chronic recur-rence and instability.
Conclusion This study suggests that for consistently optimal and
accurate results, manual inversion stress by a trained professional should be used in talar tilt radiographic studies of the ankle. As described in this study, rely-ing on the patient to determine and create adequate stress to the ankle during the radiographic examina-tion of talar tilt may not create the needed movement or end range stress to document anatomic instability. Radiographic protocols used to determine anatomic laxity at the ankle for this study will need to consider and balance the desire for optimal and accurate docu-mentation of suspected talar tilt laxity with the costs and with risks to the health care professional who pro-vides manual stress during the examination.
References 1. Wexler R. The injured ankle. Am Fam Physician.
1998;57(3):474-478.2. Birrer R, Fani-Salek M, Totten V, Herman L, Politi V.
Managing ankle injuries in the emergency department. J Emerg Med. 1999;17(4):651-660.
3. Hubbard T, Cordova M. Mechanical instability after an acute lateral ankle sprain. Arch Phys Med Rehabil. 2009;90(7):1142-1146.
4. Van Rijn R, van Os A, Bernsen R, Luijsterburg P, Koes B, Bierma-Zeinstra S. What is the clinical course of acute ankle sprains? A systematic literature review. Am J Med. 2008;121(4):324-331.
5. Van Dijk C, de Leeuw P. Imaging from an orthopedic point of view. What the orthopaedic surgeon expects from the radiologist? Eur J Radiol. 2007;62(1):2-5.
6. Widdington G, Shepherd R. Ankle injury in sports: role of motor control system and implications for prevention and rehabilitation. Phys Ther Rev. 1996;1(2):80.
7. Wilkerson G, Pinerola J, Caturano R. Invertor vs. ever-tor peak torque and power deficiencies associated with lateral ankle ligament injury. J Orthop Sports Phys Ther. 1997;26(2):78-86.
8. Cass JR, Morrey BF. Ankle instability: current con-cepts, diagnosis, and treatment. Mayo Clin Proc.
conditions were not significantly different when findings were compared between male and female subjects.
One possible reason for the patient not creating positions of full ankle instability though the self-stress positioning method may be hesitation, con-sciously or subconsciously, to fully move the joint in this manner when inflamed or swollen. Indirectly, this hypothesis was not supported through the study’s findings, as there were no significant differ-ences in mean values between subjects with edema compared to those with no swelling. Future studies documenting the magnitude of pain or discomfort present immediately before and after the 2 stress methods may clarify this concern.
Future studies would be beneficial to determine whether increasing the rigor of self-stress protocols may lead to similar results in talar tilt values between self-stress and manual stress protocols. Perhaps having the medical professional provide a greater focus in manually demonstrating to the patient the direction and magnitude of needed stress for the study, on the involved or uninvolved ankle as acuity allows, would lead to the self-stress exam more fully demonstrating the laxity. Another potential modification to the self-stress method may be to incorporate use of the move-ment strap positioned around the rear foot rather than midfoot, more directly promoting any abnormal talocrural motion.
Limitations of this study include a small sample size, as well as an inherent variability of subject pre-sentations by severity and acuity, associated with any study sample collected from a clinical population. The purpose and design of this study did not consider results obtained when talar tilt stress was provided by mechanical methods, which have been recently refined and presented as viable alternatives in the lit-erature.27,28 Protocols for the use of such devices rely on a predetermined, standardized amount of force to be administered across various subjects. In our study, manual handling, which incorporated the intuitive skill of the clinician in addressing reflexive responses of the patient, led to significant differences in the outcome of the test compared with the self-stress method. Similar manual handling influences also may substantially affect outcomes compared with those created by using manual devices to produce the inversion stress for an imaging study of an injured or unstable ankle.
The findings of this study suggest that if present, anatomic laxity of the ankle mortise is less likely to be

. . . . . . . . . . . . . . . . . . . . . . . . . . . . . . . . . . . . . . . . . . . . . . . . . . . . . . . . . . . . . . . . . . . . . . . . . . . . . . . . . . . . . . . . . . . . . . . . . . . . . . . . . . .
21RADIOLOGIC TECHNOLOGY September/October 2010, Vol. 82/No. 1
LENTELL, DESCH, TRACZ, NYBERG
Anatomy. St Louis, MO: Mosby-Year Book Inc; 2001. 27. Kirk T, Saha S, Bowman LS. A new ankle laxity tester and
its use in the measurement of the effectiveness of taping. Med Eng Phys. 2000;22(10):723-731.
28. Lohrer H, Nauck T, Arentz S, Schöll J. Observer reliabil-ity in ankle and calcaneocuboid stress radiography. Am J Sports Med. 2008;36(6):1143-1149.
Gary Lentell, DPT, is a professor in the physical therapy department at California State University, Fresno. Robert J Desch, MA, R.T.(R), is director of the radiologic technol-ogy program at the Central California School of Continuing Education in San Luis Obispo. Susan M Tracz, PhD, is coor-dinator of graduate programs and a professor in the Kremen School of Education and Human Development at California State University, Fresno. Lisa M Nyberg, PhD, is also a professor in the Kremen School of Education and Human Development at California State University, Fresno.
The authors wish to thank Eric Strom, MD, for his inter-pretation of all radiographs used in this study and Robert Paull, MD, and the staff of the University Health and Psychological Services of California State University, Fresno, for their support.
Reprint requests may be sent to the American Society of Radiologic Technologists, Communications Department, 15000 Central Ave SE, Albuquerque, NM 87123-3909, or e-mail [email protected].
©2010 by the American Society of Radiologic Technologists.
1984;59(3):165-170.9. Boruta PM, Bishop JO, Braly WG, Tullos HS. Acute
lateral ankle injuries: a literature review. Foot Ankle. 1990;11(2):107-113.
10. Heilman AE, Braly WG, Bishop JO, Noble PC, Tullos HS. An anatomic study of subtalar instability. Foot Ankle. 1990;10(4):224-228.
11. Inaba A. Ankle injuries: a sprained ankle? Radiology Cases in Pediatric Emergency Medicine. 1999;3(3):1-15.
12. Stiell IG, McKnight RD, Greenberg GH, et al. Implementation of the Ottawa ankle rules. JAMA. 1994;271(11):827-832.
13. Brukner P, Khan K. Clinical sports medicine: reliability and prediction of return to function. J Orthop Sports Phys Ther. 1993;27:276-281.
14. Staples O. Ruptures of the fibular collateral ligaments of the ankle. Result study of immediate surgical treatment. J Bone Joint Surg Am. 1975;57(1):101-107.
15. Aiken AB, Pelland L, Brison R, Pickett W, Brouwer B. Short-term natural recovery of ankle pain following dis-charge from emergency departments. J Orthop Sports Phys Ther. 2008;38(9):566-571.
16. Brostrom L. Sprained ankles. V. Treatment and prog-nosis in recent ligament ruptures. Acta Chir Scand. 1966;132(5):537-550.
17. Freeman M, Dean M, Hanham I. The etiology and preven-tion of functional instability of the foot. J Bone Joint Surg Br. 1965;47(4):678-685.
18. Lentell G, Baas B, Lopez D, McGuire L, Sarrels M, Snyder P. The contributions of proprioceptive deficits, muscle function, and anatomic laxity to functional instability of the ankle. J Orthop Sports Phys Ther. 1995;21(4):206-215.
19. Karlsson J, Eriksson BI, Renström PA. Subtalar ankle instability. A review. Sports Med. 1997;24(5):337-346.
20. Cox JS, Hewes TF. “Normal” talar tilt angle. Clin Orthop Relat Res. 1979;140:37-41.
21. Ballinger PW. Merrill’s Atlas of Radiographic Positions and Radiologic Procedures. 7th ed. St Louis, MO: Mosby-Year Book Inc; 2001.
22. Hertel J, Denegar CR, Monroe MM, Stokes WL. Talocrural and subtalar joint instability after lateral ankle sprain. Med Sci Sports Exerc. 1999;31(11):1501-1508.
23. Breitenseher MJ, Trattnig S, Kukla C, et al. MRI versus lateral stress radiography in acute lateral ankle ligament injuries. J Comput Assist Tomogr. 1997;21(2):280-285.
24. Ahovuo J, Kaartinen E, Slätis P. Diagnostic value of stress radiography in lesions of the lateral ligaments of the ankle. Acta Radiol. 1988;29(6):711-714.
25. Martin DE, Kaplan PA, Kahler DM, Dussault R, Randolph BJ. Retrospective evaluation of graded stress examination of the ankle. Clin Orthop Relat Res. 1996;328:165-170.
26. Bontrager K. Textbook of Radiographic Positioning and Related
PEER REVIEW
22 September/October 2010, Vol. 82/No. 1 RADIOLOGIC TECHNOLOGY
. . . . . . . . . . . . . . . . . . . . . . . . . . . . . . . . . . . . . . . . . . . . . . . . . . . . . . . . . . . . . . . . . . . . . . . . . . . . . . . . . . . . . . . . . . . . . . . . . . .
Background With the ever-increasing burdens of adhering to the Mammography Quality Standards Act (MQSA), it is important for mammography centers to use technology to work smarter and faster and capture as much revenue as possible. At the same time, patient satisfaction and employee satisfaction have a synergistic effect on the quality of patient care and the financial status of the clinic.Method This comprehensive literature review examines the effects of MQSA, technology and patient and employee satisfaction on the operations of a quality breast imaging center.Results A best practice model is offered that combines the best of these elements based on current literature.
Managing a Mammography Center: A Model To ThriveSTEPHANIE JOHNSTON, MSRS, R.T.(R)(M)(BS)JAMES JOHNSTON, PhD, R.T.(R)(CV)
TechnologyCommonly, facilities struggle with volume and
demand mismatches that lead to long delays in the patient care process.3 These challenges become obvious with long lines in the waiting room and delays in the emergency department or operating room.4
Technological solutions offer improved communi-cation and improved patient flow with a set cost and time frame for installation and training. Purchasing and installing new technology is a common approach to improving patient flow.4 The goals in upgrading to new technology are to reduce overcrowding, improve patient flow without losing quality care and increase physician and staff satisfaction.5
Reimbursement, Coding and CostsWith today’s economic environment, reimbursement
and coding and the costs of running a breast center are more challenging. The possibility of costs exceeding reimbursements is a constant concern.6 Even with those concerns, breast imaging centers continue to provide high-quality, efficient services. Striving for greatness is a journey, not a destination, and reaching excellence should be ongoing and relentless.7
Patient and Employee SatisfactionWomen’s experiences and satisfaction with breast
services are important factors influencing their atten-dance and participation in a clinic.8 Bairati et al showed that a patient care model that offers high levels
In today’s competitive health care environment there are a number of factors that must work together to optimize health care delivery. While these may vary by facility, in general there are 4 major focal areas that form the dynamics of a
breast center: the Mammography Quality Standards Act (MQSA), technology, reimbursement and costs, and patient and employee satisfaction. The following is a brief overview of each of these focal areas.
Overview of Focal AreasMQSA
Originally passed in 1992, the MQSA was enacted to ensure that women have access to quality mam-mography to detect breast cancer in its earliest, most treatable stages.1 The deadline for facility certifica-tion and compliance was in October 1994, and com-pliance with interim regulations and annual facility inspections began in January 1995.2 Between 1995 and 1997, there was a steady decrease in the severity of violations at mammography facilities, from approx-imately 55% in 1995 to 30% in 1997. Paralleling this improvement was the closing of a total of 163 facili-ties during the same time period. Most of these clo-sures involved low-volume or low-quality providers. In 1999, the MQSA Final Regulations became effective. Regulations and policy guidance were established in 2002 to include full-field digital mammography.1 Then in 2004, the second reauthorization of MQSA passed with minor changes.2

. . . . . . . . . . . . . . . . . . . . . . . . . . . . . . . . . . . . . . . . . . . . . . . . . . . . . . . . . . . . . . . . . . . . . . . . . . . . . . . . . . . . . . . . . . . . . . . . . . . . . . . . . . .
23RADIOLOGIC TECHNOLOGY September/October 2010, Vol. 82/No. 1
JOHNSTON, JOHNSTON
patient and employee satisfaction were determined, as were the effects of patient and employee satisfaction on the clinic setting. The literature then was synthe-sized and is presented here as it relates to each of the identified subtopics.
Effects of MQSABenefits of MQSA
Before the MQSA was passed, mammography screening exams varied greatly from facility to facil-ity. Radiation dose and image quality were quite different from site to site.13 Additionally, equipment was shoddy, physicians did not have proper training, and screening pioneers used terms like “horrific” and “desperately bad” to describe the state of mam-mography.14 Many improvements occurred in 1987, when the American College of Radiology introduced the Mammography Accreditation Program, but these efforts were voluntary and only supervised at the state level.1 MQSA provided a general framework for ensur-ing national quality standards in facilities performing mammography.2 Each facility must be accredited, certified and follow federal minimum standards. The accrediting bodies are responsible for reviewing equipment evaluations and quality control (QC) tests performed by the facility. They also are responsible for reviewing qualifications of mammography person-nel, including the interpreting physicians, medical physicists and radiologic technologists.2
Breast imagers agree that MQSA has greatly improved the quality of mammography. Screening mammography has been a major contributor to the 25% reduction in the breast cancer death rate in the United States.14 Birdwell and Wilcox indicated that the quality of mammography in the United States is bet-ter today than ever before.13 Quality mammography is still one of the most important weapons in the fight to decrease breast cancer deaths.15
Burdens of MQSACost, Compliance and Time
Cost, compliance and time are among the many burdens of MQSA, and the cost of maintaining compli-ance is of major concern. According to a 2007 issue of the Mammography Regulation and Reimbursement Report, the cost of an annual MQSA inspection was $1900 for the first unit and $250 per unit thereafter.16 The MQSA Regulations Quality Standards include an annual physicist survey, which has unknown fees attached.2 One estimate of the average annual cost of
of consistency and continuity has a positive effect on patients’ well-being.9 They also reported that 64% of women have at least one impeding event during their breast care. Almost 66% of these women stated that a waiting list at the clinic was the biggest hindrance. This included both waiting for an available appointment and waiting at the time of the appointment. Lorden et al reported that patient satisfaction is very important and is a fundamental part of an organization’s mission and culture.10 In addition, employee satisfaction, though complex, has been positively correlated to patient satis-faction, and therefore goes hand in hand with it. Some studies indicated that high turnover among health care workers is aggravated by the emotional demands of the work itself.11 Peluchette and Karl stated that if employ-ees are happy, patients will be happy too.12
MethodsAn electronic database search was conducted
through Midwestern State University’s Moffett Library. EBSCOHOST provided access to the following data-bases: Academic Search Complete, Alt HeathWatch, Business Source Complete, CINAHL Plus, Computer Source, Consumer Health Complete, ERIC, Health Source – Consumer Edition, Health Source: Nursing/Academic Edition, Information Science & Technology Abstracts (ISTA), Legal Collections, MEDLINE, Military and Government Collection, Professional Development Collection, Psychology and Behavioral Sciences Collection, PsycINFO, Public Administration Abstracts, Regional Business News and EBSCO’s Science and Technology Collection. The Health & Wellness Resource Center database also was searched.
The key search terms used were “MQSA,” “technol-ogy,” “patient flow,” “health care,” “mammography,” “reimbursement,” “coding,” “costs,” “patient satisfac-tion,” “employee satisfaction” and “clinic.” From the MQSA literature, 3 subtopics were identified: the benefits of MQSA, the burdens of MQSA and the evolution of breast imaging. Based on the technology literature, 4 subtopics were identified: quality care issues, increased staff satisfaction, new technologies and the consequences of new technologies. Through the reimbursement literature collected, a definition of reimbursement and description of coding were identi-fied. A brief history of reimbursement and some com-mon mistakes made in coding also were identified, as well as a summary of breast center costs. Literature on satisfaction yielded a definition of patient satisfac-tion and employee satisfaction. Contributors to both
. . . . . . . . . . . . . . . . . . . . . . . . . . . . . . . . . . . . . . . . . . . . . . . . . . . . . . . . . . . . . . . . . . . . . . . . . . . . . . . . . . . . . . . . . . . . . . . . . . . . . . . . . . .MANAGING A MAMMOGRAPHY CENTER
24 September/October 2010, Vol. 82/No. 1 RADIOLOGIC TECHNOLOGY
(FDA) may impose one or more of the following sanc-tions for noncompliance:
■ Directed plan of correction, which allows the facility to correct the violation.
■ Patient and physician notification, requiring the facility to inform both the physician and patients that the patient could be at risk for a negative effect on her health.
■ Follow-up inspection. ■ Certificate revocation or suspension.2 In addition, civil penalties up to $10 000 per exam
or per violation per day may be applied to a facility per-forming mammography without proper certification or for other violations.2
MQSA shifts the burden of proof from the plaintiff to prove that a standard of care was not met to the radiologist, mammography facility or both to prove that the standards were met.13 Dakins stated that only 3% of new radiology residents would like to spend any substantial amount of time interpreting mammograms, citing fear of lawsuits as the leading reason.14 Delays in diagnosing breast cancer lead to more malpractice claims than any other medical condition, and are sec-ond only to neurological impairment of newborns in terms of claims paid.2
Evolution of Breast ImagingDigital mammography has been incorporated into
the existing standards, but quality of digital mam-mograms varies widely because the quality assurance (QA) program is determined by the image receptor manufacturer.1 Dakins stated that the standards that exist reflect manufacturer recommendations and inspectors only check to see that a facility is following these recommendations.14 In July 2006, a Fuji com-puted radiography (CR) mammography system was approved for use by the FDA, further complicating the digital regulations.17 The Mammography Regulations and Reimbursement Report stated that the FDA will regulate CR mammography in the same manner as full-field digital systems.17
There are currently no standards mandated for image-guided breast biopsies or other breast imaging modalities such as ultrasound or magnetic resonance (MR) imaging.18 Breast imaging has gone beyond the standard 2-view mammogram that was common when MQSA was introduced. Currently, stereotactic biopsies, MR and ultrasound are used routinely in breast imaging, but the quality and accuracy of these techniques vary greatly.14 It has been suggested that
complying with MQSA is approximately $18 000,1 which equates to between $14 and $15.79 per mammogram.1,14
Those actively involved in breast imaging do not need to be reminded of the burdens of MQSA com-pliance with regard to paperwork, cost, time and frustration.13 Complying with MQSA audit regulations and preparing for the inspection can drain time and resources from a facility’s staff and budget.14 In one study, staff in 46% of facilities surveyed spent 0 to 4 hours preparing for an on-site inspection, 31% spent 4.5 to 8 hours and 23% spent 9 or more hours.13
Paperwork, Personnel and ReimbursementMQSA requires extensive records for QC tests, out-
comes and personnel qualifications.1 QC testing proto-cols must be used and maintained by each accredited facility. These include equipment evaluation records and an annual physicist survey. Documentation of the daily, weekly, monthly, quarterly and semiannual QC tests must be retained for the inspection.2 Personnel qualified to perform these tests include an interpreting physician, radiologic technologist and medical physicist who have met initial educational requirements and continuing education requirements. Documentation of these requirements must be available at the time of the inspection,2 and maintaining these records takes count-less hours.1
Added to the demands of MQSA is the dwindling number of personnel in the breast imaging field. According to Dakins, 16.4% of radiologists would with-draw from reading mammography, opting for the high-er revenue and lower stress of other areas of radiology.14 Trends for radiologic technologists seem to be the same, with approximately 30% of breast imaging prac-tices reporting unfilled mammography positions and citing lack of qualified personnel as the main reason.2
Reimbursement levels for mammography were not mandated to cover some of the costs incurred by MQSA.1 The profit margin is so low that mammogra-phy is a money loser in every radiology department.14 Increased reimbursement will need to be a key part of the solution in mammography or more low-volume facilities will be forced to close.13
Sanctions and LitigationThe MQSA represents federal statutory standards
and mammography facilities must comply to operate.13
There are 3 levels of noncompliance, with Level 1 rep-resenting the most serious and Level 3 considered only minor deviations.1 The Food and Drug Administration

. . . . . . . . . . . . . . . . . . . . . . . . . . . . . . . . . . . . . . . . . . . . . . . . . . . . . . . . . . . . . . . . . . . . . . . . . . . . . . . . . . . . . . . . . . . . . . . . . . . . . . . . . . .
25RADIOLOGIC TECHNOLOGY September/October 2010, Vol. 82/No. 1
JOHNSTON, JOHNSTON
the MQSA be renamed the Breast Imaging Quality Standards Act (BIQSA). Regulations for all of breast imaging should be included in MQSA and all breast imaging should be performed by individuals who have appropriate training and qualifications, who maintain high standards of care, and who participate in con-tinuing quality review.14,18 Accomplishing this could be the start of a new direction that provides universal consistency in breast imaging.18 Although there is no standardized QA for other breast imaging modali-ties, some voluntary accreditation programs guide breast ultrasound practice, stereotactic breast biopsies and general MR imaging and could be the basis for national standards.2 The positive side of agreeing to more regulations is that patients will receive the high-est quality breast imaging.14
The Table presents a best practices model, listing several elements and recommendations a breast center can implement. The first 3 elements correspond to MQSA requirements. A center that adheres to MQSA can be assured that it is abiding by the regulations and performing quality patient exams.
Effects of TechnologyQuality Care Issues
The goal of patient care is to perform procedures promptly, with good quality care provided to the patient.19 Over time, patient flow problems may become the norm for an organization and could lead to the loss of its key employees. The facility may suffer a reduction in referrals and ultimately develop a reputation in the community for poor patient service or quality of care.4 Often, a decision about patient flow may be made in response to physicians’ needs and usually has nothing to do with the quality of care. Bottlenecks in patient flow usually lead to the same results: waiting room delays, strained relationships with employees and inef-ficient use of resources in the organization.4
Technological advances eliminate the need for paper or board systems previously used for tracking patients. Technologic systems are more sensible in terms of clinical practice and workflow and they elimi-nate the need for paper-based systems.5 Moving to a paperless environment can help improve efficiency.3 Although the features of such systems vary from one manufacturer to the next, there are a few common features to look for. First is a system for electronic scheduling and billing. These systems can streamline and connect these elements of a practice. Second is a mammography information system. This system
can stand alone or tie to other electronic systems of the center, such as a radiology information system or health information system. This system tracks all patient exams and provides reports, follow-up letters and result letters. It is particularly desirable for the 2 broad categories of systems to “talk” to each other and be integrated. This greatly reduces duplication of data entry and opportunities for human error, stream-lining overall workflow.
Another positive aspect of any technological sys-tem is the ability to generate reports. Continuous QC reports can be generated from most programs and should become part of the standard operating proce-dures for mammography providers striving for better patient care.20
Increased Staff SatisfactionStresses and struggles with patients and person-
nel interactions can cause staff dissatisfaction.3 The primary cause of staff turnover is dissatisfaction and the second is workload or staffing issues.21 Staff satis-faction could increase with improved communication, improved morale and the sense of accomplishment that can occur after implementation of a good patient flow system and other technological advances.4 Patient flow systems give staff members a sense of accomplishment because they can easily see their workflow improve.21 Staff members are better equipped to handle delays and know where they can make adjustments.21 Before their technological upgrade, staff members at the Hospital of the University of Pennsylvania in Philadelphia would take 20 to 30 minutes to schedule a patient using the phone or fax or walking around trying to locate a physician. After the patient flow man-agement system was installed, adjustments to the sched-ule could be made in minutes and every department was alerted to the change.21
New TechnologiesSome patient flow systems are role-based, which
means a user may log in as a nurse, technologist, phy-sician or entry clerk.3 However, these individuals can only access the part of the chart that is significant to them, and make changes or add notes regarding their interactions with the patient. Wireless local area networks (WLANs) may be another consideration. They can hold small data files such as patient demo-graphics and electrocardiogram (ECG) data. WLANs are very attractive because there are no power cables, installation is easy and the technology is affordable.22
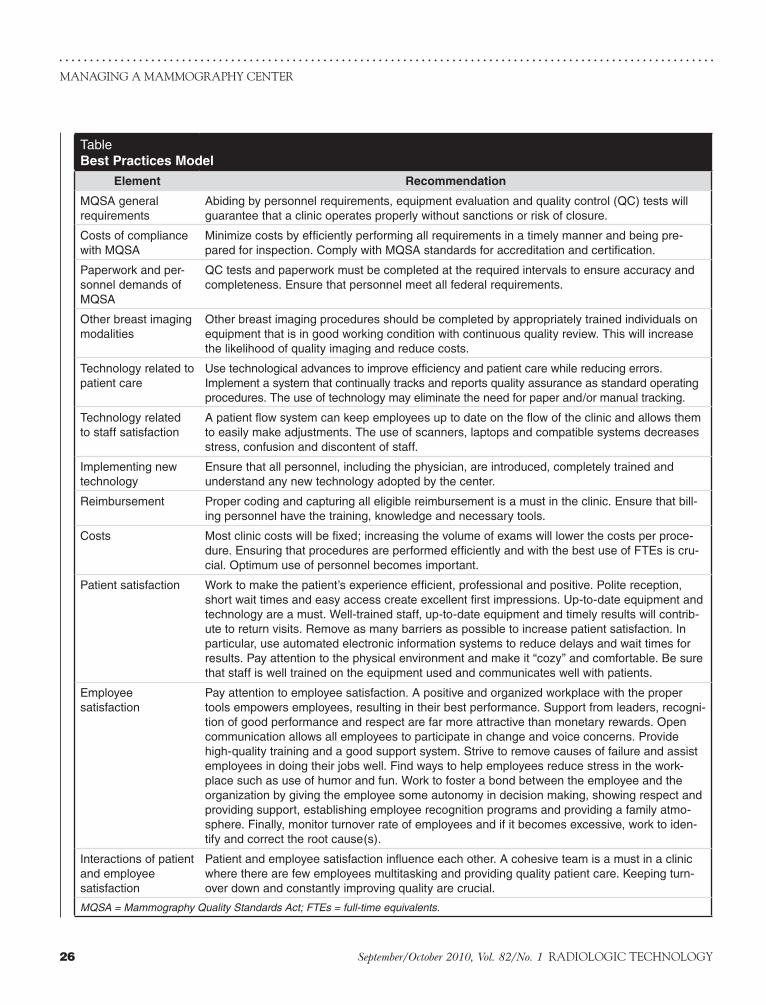
. . . . . . . . . . . . . . . . . . . . . . . . . . . . . . . . . . . . . . . . . . . . . . . . . . . . . . . . . . . . . . . . . . . . . . . . . . . . . . . . . . . . . . . . . . . . . . . . . . . . . . . . . . .MANAGING A MAMMOGRAPHY CENTER
26 September/October 2010, Vol. 82/No. 1 RADIOLOGIC TECHNOLOGY
TableBest Practices Model
Element Recommendation
MQSA general requirements
Abiding by personnel requirements, equipment evaluation and quality control (QC) tests will guarantee that a clinic operates properly without sanctions or risk of closure.
Costs of compliance with MQSA
Minimize costs by efficiently performing all requirements in a timely manner and being pre-pared for inspection. Comply with MQSA standards for accreditation and certification.
Paperwork and per-sonnel demands of MQSA
QC tests and paperwork must be completed at the required intervals to ensure accuracy and completeness. Ensure that personnel meet all federal requirements.
Other breast imaging modalities
Other breast imaging procedures should be completed by appropriately trained individuals on equipment that is in good working condition with continuous quality review. This will increase the likelihood of quality imaging and reduce costs.
Technology related to patient care
Use technological advances to improve efficiency and patient care while reducing errors. Implement a system that continually tracks and reports quality assurance as standard operating procedures. The use of technology may eliminate the need for paper and/or manual tracking.
Technology related to staff satisfaction
A patient flow system can keep employees up to date on the flow of the clinic and allows them to easily make adjustments. The use of scanners, laptops and compatible systems decreases stress, confusion and discontent of staff.
Implementing new technology
Ensure that all personnel, including the physician, are introduced, completely trained and understand any new technology adopted by the center.
Reimbursement Proper coding and capturing all eligible reimbursement is a must in the clinic. Ensure that bill-ing personnel have the training, knowledge and necessary tools.
Costs Most clinic costs will be fixed; increasing the volume of exams will lower the costs per proce-dure. Ensuring that procedures are performed efficiently and with the best use of FTEs is cru-cial. Optimum use of personnel becomes important.
Patient satisfaction Work to make the patient’s experience efficient, professional and positive. Polite reception, short wait times and easy access create excellent first impressions. Up-to-date equipment and technology are a must. Well-trained staff, up-to-date equipment and timely results will contrib-ute to return visits. Remove as many barriers as possible to increase patient satisfaction. In particular, use automated electronic information systems to reduce delays and wait times for results. Pay attention to the physical environment and make it “cozy” and comfortable. Be sure that staff is well trained on the equipment used and communicates well with patients.
Employee satisfaction
Pay attention to employee satisfaction. A positive and organized workplace with the proper tools empowers employees, resulting in their best performance. Support from leaders, recogni-tion of good performance and respect are far more attractive than monetary rewards. Open communication allows all employees to participate in change and voice concerns. Provide high-quality training and a good support system. Strive to remove causes of failure and assist employees in doing their jobs well. Find ways to help employees reduce stress in the work-place such as use of humor and fun. Work to foster a bond between the employee and the organization by giving the employee some autonomy in decision making, showing respect and providing support, establishing employee recognition programs and providing a family atmo-sphere. Finally, monitor turnover rate of employees and if it becomes excessive, work to iden-tify and correct the root cause(s).
Interactions of patient and employee satisfaction
Patient and employee satisfaction influence each other. A cohesive team is a must in a clinic where there are few employees multitasking and providing quality patient care. Keeping turn-over down and constantly improving quality are crucial.
MQSA = Mammography Quality Standards Act; FTEs = full-time equivalents.

. . . . . . . . . . . . . . . . . . . . . . . . . . . . . . . . . . . . . . . . . . . . . . . . . . . . . . . . . . . . . . . . . . . . . . . . . . . . . . . . . . . . . . . . . . . . . . . . . . . . . . . . . . .
27RADIOLOGIC TECHNOLOGY September/October 2010, Vol. 82/No. 1
JOHNSTON, JOHNSTON
CodingCurrent procedural terminology (CPT) codes were
first used in 1966 to create a more uniform and pre-cise way to identify physician services.6 Information from medical records and procedural notes could be applied to detailed billing information for the pay-ers using CPT codes. Coders must apply the most exact match when assigning a CPT code to an exam.6 The International Classification of Diseases, Clinical Modification (ICD-CM) assists providers with accu-rately defining a disease process and is the basis of the rationale for ordering an exam. ICD-CM codes are used to determine the appropriateness of an exam.6 Health care common procedure and coding system (HCPCS) codes are used to identify professional ser-vices, procedures and supplies for reimbursement. Most payers require these codes to report medical services and supplies.6 Evaluation and management (E/M) CPT codes are used for problem-oriented vis-its. Although there are many rules and guidelines for the use of E/M CPT codes, breast imaging facilities may use these to bill for E/M during certain diagnos-tic or biopsy procedures.6
MistakesSome mistakes in coding include up-coding, incor-
rectly billing the technical and professional component and billing for services not provided.6 Up-coding is billing for an exam that is more complex than the one performed or that has a higher reimbursement value. If a mammogram is performed on one day and dictated on another or the technical component and professional component are delivered in different loca-tions, payers will look upon those bills with suspicion. Deliberately billing for services not provided, such as patient no-shows, is a more obvious error.
HistoryIn 1990, the Omnibus Budget Reconciliation Act
established coverage for mammography services for Medicare-eligible women.6 In 1992, physicians and out-patient facilities began to receive reimbursement under the Medicare physician fee schedule.6 Instead of the pre-vious fee schedule of “usual, customary, and reasonable” fees, payment for services relied on the resource-based relative value system (RBRVS). This system is based on the resources needed to provide a service and is divided into 3 components: practice expenses, physician work and professional liability insurance costs. A complex numerical value is assigned to each component and the
Another positive side to the WLAN is the ability to use cell phones for internal communication in facili-ties.22 Cell phones are less disruptive than overhead pages or speakers.19
Adding new technology changes old habits and saves on operating costs. Clinical information systems can eliminate the use of all forms of paper records.5 Paper files can limit the clinic workflow, and breast imaging centers cannot achieve full efficiency until they com-pletely eliminate the physical files.7
Consequence of New TechnologiesThe ultimate acceptance or rejection of any new
technology depends on the level of use by staff.5 Inadequate training for new technologies is a primary concern of staff members.23 Failure to sufficiently pre-pare staff for new systems and inadequate leadership also may be problems.5 Mammography staff members do not want to look unqualified or unprepared to the patient. It is important to have strong leadership in the director or manager and involve all users, including physicians, in every stage of developing and implement-ing new processes.5 Dissatisfied staff may revert to using the old manual or paper-based system that was supposed to be replaced. This could result in expensive new technology being used inconsistently, inaccurately, or not at all.4
The Table has 3 elements and recommendations regarding technology, as it relates to patients and staff. In today’s more advanced environment, most staff welcome the use of technology and patients favor the efficiency of a center that takes advantage of technology.
Reimbursement and CostsReimbursement
Reimbursement does not equal revenue. It repre-sents the payment that is received for a procedure and is set by contract, regulation or both.7 Reimbursement for mammography is based on the facility location or site of service.6,7 Physician offices or nonfacility set-tings are considered different from hospital-owned facilities. Reimbursement for mammography exams in these settings is less than 80% of the Medicare physicians’ fee schedule (MPFS).6 Mammography and other breast imaging exams are highly valued by women, but less valued by payers.24 The current reim-bursement guidelines are not in line with the public’s expectations of mammography or other breast imag-ing procedures.6,7,24
. . . . . . . . . . . . . . . . . . . . . . . . . . . . . . . . . . . . . . . . . . . . . . . . . . . . . . . . . . . . . . . . . . . . . . . . . . . . . . . . . . . . . . . . . . . . . . . . . . . . . . . . . . .MANAGING A MAMMOGRAPHY CENTER
28 September/October 2010, Vol. 82/No. 1 RADIOLOGIC TECHNOLOGY
between personnel and patients is a quality care indica-tor in patient satisfaction. Patients expect a helpful and skilled staff in a breast clinic.27
Patients expect quick, efficient service in today’s fast-paced society,8 but many experience long wait times for their appointments.26 These long wait times for scheduled appointments must be addressed. Additionally, processes within the clinic should flow efficiently so patients can be taken care of quickly and at their appointed time.27
Many breast clinic patients today expect results promptly, even on the same day, if possible. If results are not communicated promptly, patients may become anxious and upset, especially if results are inconclu-sive or positive.27 Rust reported that 24.6 days was the average time for receiving results and some patients found it to be a 3 to 6 week ordeal.27 Timely reporting is a quality indicator of patient satisfaction because the discovery of an abnormality can be extremely traumatic for the patient.27
Many delays can be reduced and patient care and satisfaction improved by using automated informa-tion systems.28 The information system can be used for patient result letters, reminder letters and, most impor-tantly, to encourage follow-up. Improving the consis-tency of information transfer eliminates gaps in service delivery. The reminder letter or invitation letter func-tion of these systems should be used to prompt women to come to the clinic for screening.8
Contributors to Patient SatisfactionThere are several contributors to patient satisfaction.
The physical environment of the clinic is one. Women prefer an easily accessible clinic that is “cozy” and “per-sonal.” This helps alleviate anxiety and embarrassment associated with the exam.8 Women appreciate the pri-vacy and accessibility of a clinic compared with a hos-pital setting that is large and not as easily accessible.27 Another contributor to the physical environment is up-to-date technology. Patients expect a facility to have the latest equipment and technology.8 They also expect well-trained and competent personnel to perform their exam, reducing pain and uneasiness.8 Trained staff also reduce the need to call patients back for subop-timal exams. A detailed explanation of the exam and what will transpire decreases anxiety and allows the patient to interact with the technologist before, during and after the exam.8 Therefore, the physical environ-ment and technical quality are important components of patient satisfaction.
resulting value is called a resource value unit (RVU).6 Each RVU is adjusted further based on geographic dif-ferences in resource costs. The cost for either screening or diagnostic mammograms exceeds the Medicare and other insurers’ reimbursement rates.7,25
CostsCosts in mammography are fairly fixed. The costs
for a facility and the equipment are stationary, unless a new piece of equipment is purchased, and the costs for staff do not vary much.7 The costs associated with volume vary, however, with increased volume lower-ing the cost per procedure.7 Unfortunately, increased numbers of screening mammograms mean increased diagnostic mammograms and follow-up breast proce-dures. Screening mammography could be profitable; however, the subsequent diagnostic mammograms and other breast-related exams are not cost effective.24 Reimbursement for these exams does not cover costs.24 The problem of mammography costs outweighing reim-bursement began in the 1980s and became a barrier for patients who need screening mammography.25
ImprovementsMammography does not attract the staff needed to
meet the demand.24 To most outside of radiology, the belief is that mammography is a profitable and easy exam to perform.6 In reality it is highly specialized and time consuming. Mammography practice is com-plicated further by federal regulation through MQSA, litigation threats and low reimbursement.6
Reimbursement and cost are fairly straightforward. The best practice model presented in the Table out-lines the important factors relating to reimbursement, coding and costs. This aspect of a center relies heavily on the expertise of personnel who can accurately code and collect the maximum reimbursement and who con-tinually work to minimize costs.
Patient and Employee SatisfactionPatient Satisfaction
A patient’s satisfaction depends on his or her expe-rience at the clinic. Patients describe quality service as efficient, flexible and punctual.8 Behavior, profes-sionalism and the interpersonal skills of the staff are included in that perception of quality service.8 Being greeted at the front desk by friendly, courteous staff is very important, especially to the first-time patient, and politeness and proper communication with all staff are very important to patients.26 An excellent relationship

. . . . . . . . . . . . . . . . . . . . . . . . . . . . . . . . . . . . . . . . . . . . . . . . . . . . . . . . . . . . . . . . . . . . . . . . . . . . . . . . . . . . . . . . . . . . . . . . . . . . . . . . . . .
29RADIOLOGIC TECHNOLOGY September/October 2010, Vol. 82/No. 1
JOHNSTON, JOHNSTON
In one study, slightly less than half of the patients believed they were not given enough information.26 Another study reported that many women indicated information about breast self-examinations, the screen-ing process, or what to expect if called back could be emphasized more during the admission process.8
Some barriers that decrease patient satisfaction are excessive distance to the center, lack of signs and park-ing, perceived lack of privacy and lack of competent staff.8 Most patients consider the seamless process of having multidisciplinary care all in the same clinic a high-quality characteristic and very appealing.27 Most dislike having to travel to a regional hospital or another facility for these services.8 Trust in the clinic staff and the multidisciplinary approach assure patients that their needs will be met and that they will receive qual-ity care.27
Effects of Patient Satisfaction on the ClinicPatient dissatisfaction can have serious effects on a
clinic, affecting its standing in the community. Satisfied patients are more likely to return to the clinic and continue their relationship with that provider.8 They are also more likely to tell friends and family to use the facility if the experience was positive, vs dissuading them if the experience was substandard.8 An ineffi-cient and disorganized clinic can cause gaps in quality of care and patient follow-up, disappointing patients and prompting them to seek care elsewhere.28 Loss of market share and revenue adversely affect the clinic, and the dissatisfied patient may negatively influence the facility’s reputation.27 Lack of access due to waiting weeks or months for a scheduled appointment or wait-ing at the clinic on the day of the appointment also could cause a patient to go elsewhere for care or, worse, elect not to receive care.9 A closer partnership between the patient and the provider may be fostered if patient dissatisfaction is identified and considered. Satisfied patients will return to the clinic.26
Employee SatisfactionEmployee satisfaction is more complex and can
be defined several ways. Lorden et al reported that employee satisfaction includes employee workload, perception of the work environment and empower-ment.10 Employees are not fond of being overworked and underappreciated. Good job performance requires the right tools. Having the necessary materials and technology and the opportunity to do one’s best work are underlying factors for employee satisfaction.10
Recognition for work completed, respect from others and supervisor support are other reasons to stay in a job.29 Additionally, recognition by peers, attention and sincere appreciation for doing a job well are underlying factors.29
The work environment is critical in determining employee satisfaction.10,29 Lorden et al indicated that high-quality training and a good support system from supervisors allow employees to meet the customers’ needs.10 This level of involvement and participation between the supervisors and employees is significant to the employees. Micromanagement by supervisors, on the other hand, creates distrust and uneasiness among employees. Conversely, allowing them some freedom within their job description is seen as more supportive.10 The leaders of an organization should strive to remove causes of failure and help employ-ees do their jobs well and as efficiently as possible. Appropriate rewards and recognition can assist in sat-isfying employees.30
Emotionally demanding work can intensify situa-tions at work.11 Stress can be one reason why employees are repeatedly absent from work or leave an organiza-tion altogether.12 However, the use of humor has been reported to be an effective coping strategy for handling work-related stress and has positive implications for employee satisfaction.12
Contributors to Employee SatisfactionCommitment to the organization is an important
contributor to the employee’s satisfaction. The bond formed between an employee and an organization is commitment. The findings by Humphreys et al indi-cated that employees with high organizational com-mitment are most likely to satisfy patients.11 In turn, the organization’s commitment to employees can be seen directly in employee satisfaction and indirectly in employee loyalty to the organization.29
Operational success is an important contributor to employee success.30 An organization that is continu-ally improving and increasing profits appeals to the employee in the customer service role. Increased prof-its usually translate to increased salaries or bonuses for employees. However, respect, support from cowork-ers and supervisors and a family atmosphere satisfy employees far more than money.29
Communication also contributes to employee satis-faction. The cycle of communication from employees to leadership and back again is critical in any orga-nization.31 The cycle involves 2-way communication,
. . . . . . . . . . . . . . . . . . . . . . . . . . . . . . . . . . . . . . . . . . . . . . . . . . . . . . . . . . . . . . . . . . . . . . . . . . . . . . . . . . . . . . . . . . . . . . . . . . . . . . . . . . .MANAGING A MAMMOGRAPHY CENTER
30 September/October 2010, Vol. 82/No. 1 RADIOLOGIC TECHNOLOGY
select only activities that will not interfere with patient care or disrupt the clinic, such as supervisor-sponsored lunches, potluck meals or casual dress on Fridays to avoid perceptions from some employees that fun activities are nonproductive.12
Management of Patient and Employee SatisfactionPatient satisfaction and employee satisfaction are
unquestionably interrelated. Patient satisfaction may be influenced by efficiency of care, communication with health care professionals, or the state of the facili-ty.10 A cohesive team can provide exceptional patient service and quality care.27 Recruitment and training of high-quality staff with good interpersonal skills are essential to a clinic and some of the most important contributors to patient satisfaction.8 The quality of the employee determines the quality of the service given to the patient and ultimately the success of the clinic.30 Developing a program to recognize employees who go beyond expectations and show an extraordi-nary level of caring and compassion to patients can increase employee satisfaction.27 Recognition by peers, and especially by supervisors, is an important factor in employee satisfaction.29,31 Consistency, continuity and collaboration all can be used to increase satisfaction, both for patients and employees.28 Quality practice standards should be developed and consistently fol-lowed by employees to provide the best patient care. Collaboration with referring physicians and specialists, and within the clinic team will increase the quality of patient care.28
The last 3 elements and recommendations in the Table correspond to patient and employee satisfaction. An understanding that each contributes to the other will create a center with a positive, efficient environ-ment that provides quality patient care.
ConclusionThe MQSA has laid a stable foundation for the
regulation of quality mammography exams. Although the costs of compliance are high and reimbursements are low, the decrease in death rates from breast cancer indicates that facilities are following the regulations and are providing quality patient care. Now that digital mammography, both full field and computed radiogra-phy, is more mainstream, additional detailed modifica-tions to MQSA must include this technology and the inspectors must have knowledge and training on how to inspect these units. Changing the legislation’s name from MQSA to Breast Imaging Quality Standards Act
problem solving, action, measurement and reward and recognition. Shockey stated that involving the employee in this cycle allows him or her to communi-cate openly with leaders and take part in solving the organization’s problems.31
Fun in the workplace may play an important role in employee satisfaction. According to Peluchette and Karl, introducing fun in the health care setting has gained attention for improving employee satisfaction.12 They reported the top 3 fun activities were casual dress days, employee recognition and rewards and company-provided food. These activities allow employees to break away from daily routines and provide more inter-action with other employees and supervisors. However, they need to be appropriate to the work environment so as not to be perceived negatively by patients.12
Effects of Employee Satisfaction on the ClinicBenefits of employee satisfaction are high productiv-
ity, lower turnover, loyalty and overall competitiveness.30 The most visible sign of employee dissatisfaction is employee turnover.30 Excessive turnover is a serious challenge to the efficiency and effectiveness of an orga-nization and low employee satisfaction can have a great impact on patient satisfaction.11,31 Employee turnover has more than twice the impact of the next largest variable, poor work environment, on patient satisfac-tion.29 This impact on patient satisfaction can erode the physician/patient relationship and the physician/clinic relationship, which can affect the business. The interactions between an employee and customer can potentially make or break the relationship.30
Employee satisfaction can positively affect an organi-zation. Employees want to be recognized for the skills they bring to a job and for the contributions they make to the organization. Professionals want respect, appreci-ation and opportunities for intrinsic rewards.29 Satisfied employees ensure quality patient care, which increases profits and referrals to the organization.30
Health care organizations may consider interject-ing fun in the workplace as an approach to make the work environment better. Peluchette and Karl’s claim that employees who have fun with their jobs are more energized, more motivated, get along better and provide better service means that breast center managers should consider introducing fun activities. Conducting activities that focus on food or contests can be highly successful and practical in the health care setting without being disruptive. Organizations should set some boundaries for fun activities and

. . . . . . . . . . . . . . . . . . . . . . . . . . . . . . . . . . . . . . . . . . . . . . . . . . . . . . . . . . . . . . . . . . . . . . . . . . . . . . . . . . . . . . . . . . . . . . . . . . . . . . . . . . .
31RADIOLOGIC TECHNOLOGY September/October 2010, Vol. 82/No. 1
JOHNSTON, JOHNSTON
reduce turnover and maintain high-quality patient care. Recognition for a job well done by peers and supervisors does not go unnoticed by the employee. Most employees would rather have the recognition than a raise.29 This in turn will increase retention, and employee retention and customer satisfaction are directly related.
Communication is a key issue with employees. Their input into an organization gives them ownership. Supervisors who practice listening to employees will have greater success with them. Adding some fun into the workplace also could contribute to employee satis-faction. Most fun activities are usually not disruptive to patient care. According to Peluchette and Karl, fun in the workplace can have positive effects on the employ-ees, but sometimes may be perceived negatively.12
Both patient and employee satisfaction involve aspects of the other. Patients are dissatisfied with impo-lite, inefficient staff and employees are not happy with demanding, rude patients. A vicious cycle can send an organization into a tailspin. A solid group of employees who are well trained and patient oriented is a must for a clinic to remain competitive. The financial impact of employee satisfaction and turnover becomes appar-ent when patients choose to go elsewhere for care. The clinic may receive poor publicity or develop a negative reputation in the community. People are the No. 1 asset in health care. Employees, patients and the orga-nization should align to support that concept.29
Based on the literature reviewed, the Table was cre-ated as a best practice model that incorporates critical elements for running a quality breast center. A perfect center would employ all the best practices in the model. However, most centers may be able to follow only some of the elements suggested. Determining what works best in a particular center’s environment is a task for the center leaders. It is up to them to establish the best practices for that center.
Call for Future ResearchAlthough many studies were reviewed that examined
some of the aspects of a quality breast center, research is needed that focuses on the synergistic effects of MQSA, technology, reimbursement and costs, and patient and employee satisfaction as the 4 major areas that create a quality center.
References1. Odle TG. MQSA update. Radiol Technol. 2003;74(3):202-223.2. Nass S, Ball J, eds. Improving Breast Imaging Quality Standards.
(BIQSA) to include regulations for all breast imaging modalities would be an additional step in the right direction. As stated by Dakins, there may be a point where one will not be able to do any imaging exam without proving quality outcome measures to payers.14 MQSA already has set high standards, and now is the time to implement changes for the future. The addi-tional regulations will ensure that all patients receive quality breast imaging, no matter the modality used.
The introduction of technology to improve patient flow is a positive advancement. However, it must be imple-mented correctly. Staff and physicians must be involved in the planning and implementation of the system for it to be successful, effective and efficient. As stated by Sharrock, an effective clinic should run just like an effi-cient factory, getting the right part in the right place at the right time.19 Managers must organize their operation so that the patient spends less time at the facility and the physician’s time is maximized. It is important to get the right people in the right place and with the right equip-ment. When it comes to health care technology, every second saved is crucial to the patient and the physician.3 Up-to-date technology allows a good manager to save time and cut costs without sacrificing quality patient care.
Because the costs for operating a breast center are relatively fixed, increasing patient volume is key to lowering the cost per procedure. It is imperative that a center employ personnel who can properly code and collect as much reimbursement as possible for the pro-cedures provided. Avoiding mistakes and capturing the most from every exam help ensure the clinic’s success.
Patient satisfaction depends greatly on the aesthet-ics of the clinic and the patient’s interactions with the staff. Today’s women are more educated and judge the quality of their care by 3 components: efficient process-es, pleasant environment and advanced technology.27 With their busy lifestyles, patients want fast, friendly service in a multidisciplinary facility. Any indication that staff is incompetent or unqualified to complete duties gives rise to dissatisfaction. Patients expect all the latest technological advances. Up-to-date equip-ment and information systems allow the movement of patients through the clinic with an effortless flow. A standardized set of QA guidelines should be estab-lished and enforced to ensure that proper procedures and patient care standards are followed.
Similarly, employee training and support guide-lines ensure that an employee is taught to do a job properly and rewarded for doing it well. An employee’s dedication and commitment to an organization can

. . . . . . . . . . . . . . . . . . . . . . . . . . . . . . . . . . . . . . . . . . . . . . . . . . . . . . . . . . . . . . . . . . . . . . . . . . . . . . . . . . . . . . . . . . . . . . . . . . . . . . . . . . .MANAGING A MAMMOGRAPHY CENTER
32 September/October 2010, Vol. 82/No. 1 RADIOLOGIC TECHNOLOGY
Washington, DC: The National Academies Press; 2005.3. Haase N. Hospitals upgrade technology to streamline
patient treatment. New Orleans City Business. 2005;25(39):34-37.
4. Rich V, Sullivan PG, Kirby A. Pioneers in patient flow improvements: combining people, processes, technology. Nurse Leader. 2007;5(2):52-56.
5. Poulos CJ, Gazibarich BM, Eagar K. Supporting work prac-tices, improving patient flow and monitoring performance using a clinical information management system. Aust Health Rev. 2007;31(suppl 1):S79-S85.
6. Odle TG. Mammography coding and reimbursement. Radiol Technol. 2003;74(5):385-404.
7. Kolb GR. Integrate, innovate, imitate: surviving and thriving in the world of breast cancer economics. Breast J. 2005;11(suppl 1):S20-S23.
8. Hamilton EL, Barlow J. Women’s views of a breast screen-ing service. Health Care Women Intl. 2003;24(1):40-48.
9. Bairati I, Fillion L, Meyer FA, Héry C, Larochelle M. Women’s perceptions of events impeding or facilitating the detection, investigation and treatment of breast can-cer. Eur J Cancer Care. 2006;15(2):183-193.
10. Lorden A, Coustasse A, Singh KP. The balanced scorecard framework — a case study of patient and employee satis-faction: what happens when it does not work as planned? Health Care Manage Rev. 2008;33(2):145-155.
11. Humphreys J, Brunsen B, Davis D. Emotional structure and commitment: implication for health care manage-ment. J Health Organ Manag. 2005;19(2):120-129.
12. Peluchette J, Karl KA. Attitudes toward incorporating fun into the health care workplace. Health Care Manag. 2005;24(3):268-275.
13. Birdwell RL, Wilcox PA. The mammography quality stan-dards act: benefits and burdens. Breast Dis. 2001;13:97-107.
14. Dakins DR. MQSA historic success becomes regulatory threat — imagers acknowledge mammography quality improvements but bristle at prospects of expanded rules. Diagn Imaging. September, 2005:30-39.
15. Saywell RM, Champion VL, Skinner CS, Menon U, Daggy J. A cost-effective comparison of three tailored interven-tions to increase mammography screening. J Womens Health. 2004;13(8):909-918.
16. New MQSA inspection fees set. Mammography Regulation and Reimbursement Report. HC Pro Inc. August, 2007:66.
17. FDA issues guidance on CR mammography. Mammography Regulation and Reimbursement Report. HC Pro Inc. March, 2007:3.
18. Wagner J. Quality issue must move beyond mammogra-phy — MQSA 2007 reauthorization offers opportunity to include other breast imaging modalities. Diagn Imaging. March 2007;28:55-59.
19. Sharrock R. A well-appointed establishment. Ind Eng.
2007;39(4):44-48.20. Bachtel J, Lyle CR. Information technology can improve
healthcare quality. Comput Healthc. 1992;13(10):45-46.21. McHugh N. Improving staff member satisfaction and pro-
ductivity through technology. AORN J. 2004;80(3):523-526.22. Thuemmler C, Morris C. Global case management:
Scotland. Real-time monitoring of patient flow as an instrument to optimize quality of care in acute receiving units. Lippincotts Case Manag. 2005;10(5):254-260.
23. Making the healthcare system safer with innovation and technology. Qual Lett Healthc Lead. 2005;17(7):2-11.
24. Enzmann DR, Anglada PM, Haviley C, Venta LA. Providing professional mammography services: financial analysis. Radiology. 2001;219(2):467-473.
25. Feig SA. The economics of breast imaging: challenges and strategies for survival. Appl Radiol. September, 2005:30-35.
26. Sadjadian A, Kaviani A, Yunesian M, Montazeri A. Patient satisfaction: a descriptive study of a breast care clinic in Iran. Eur J Cancer Care. 2004;13(2):163-168.
27. Rust S. Improvement of women’s breast health services. J Ambul Care Manage. 2003;26(3):199-208.
28. Williams-Brown S, Phillips JM, Rust G. Ensuring consis-tent quality care to address disparities in cancer screening. J Nurs Care Quality. 2005;20(2):99-102.
29. McGuire M, Houser J, Jarrar T, Moy W, Wall M. Retention: it’s all about respect. Health Care Manag. 2003;22(1):38-44.
30. O’Neill M. Employee care, a vital antecedent to customer care in the health care industry: an exploratory investiga-tion of the employee satisfaction construct at north east Alabama regional medical center. Int J Health Care Qual Assur Inc Leadersh Health Serv. 2005;18(2-3):131-151.
31. Shockey C. Norman regional hospital’s magnetic culture attracts employees, pleases customers, and keeps the busi-ness healthy. Journal of Organizational Excellence. Spring 2006:25-38.
Stephanie Johnston, MSRS, R.T.(R)(M)(BS), is director of the Breast Center of Texoma in Wichita Falls, Texas, and chairman of ASRT’s Committee on Nominations.
James Johnston, PhD, R.T.(R)(CV), is associate professor of radiologic sciences and director of interdisciplinary educa-tion for the College of Health Sciences and Human Services at Midwestern State University in Wichita Falls, Texas. He is also vice chairman of the Editorial Review Board for Radiologic Technology.
Reprint requests may be sent to the American Society of Radiologic Technologists, Communications Department, 15000 Central Ave SE, Albuquerque, NM 87123-3909, or e-mail [email protected].
©2010 by the American Society of Radiologic Technologists.
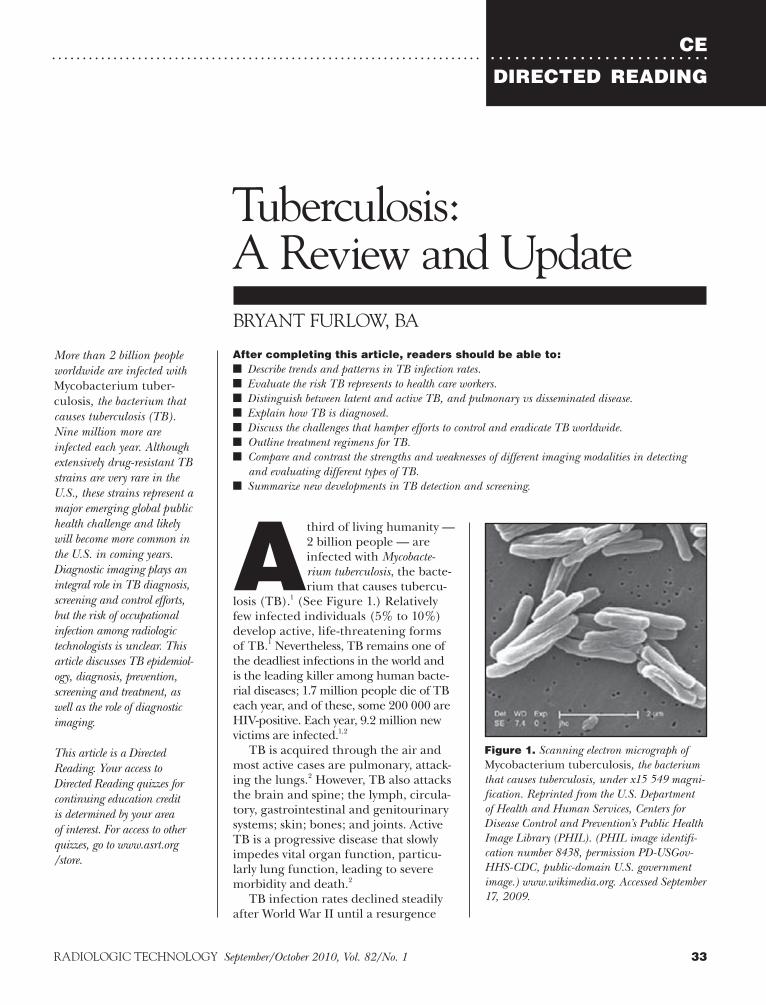
CE
DIRECTED READING. . . . . . . . . . . . . . . . . . . . . . . . . . . . . . . . . . . . . . . . . . . . . . . . . . . . . . . . . . . . . . . . . . . . . . . . . . . . . . . . . . . . . . . . . . . . . . . . . .
33RADIOLOGIC TECHNOLOGY September/October 2010, Vol. 82/No. 1
After completing this article, readers should be able to:■ Describe trends and patterns in TB infection rates.■ Evaluate the risk TB represents to health care workers.■ Distinguish between latent and active TB, and pulmonary vs disseminated disease.■ Explain how TB is diagnosed.■ Discuss the challenges that hamper efforts to control and eradicate TB worldwide.■ Outline treatment regimens for TB.■ Compare and contrast the strengths and weaknesses of different imaging modalities in detecting and evaluating different types of TB.■ Summarize new developments in TB detection and screening.
More than 2 billion people worldwide are infected with Mycobacterium tuber-culosis, the bacterium that causes tuberculosis (TB). Nine million more are infected each year. Although extensively drug-resistant TB strains are very rare in the U.S., these strains represent a major emerging global public health challenge and likely will become more common in the U.S. in coming years. Diagnostic imaging plays an integral role in TB diagnosis, screening and control efforts, but the risk of occupational infection among radiologic technologists is unclear. This article discusses TB epidemiol-ogy, diagnosis, prevention, screening and treatment, as well as the role of diagnostic imaging.
This article is a Directed Reading. Your access to Directed Reading quizzes for continuing education credit is determined by your area of interest. For access to other quizzes, go to www.asrt.org/store.
BRYANT FURLOW, BA
Tuberculosis: A Review and Update
A third of living humanity — 2 billion people — are infected with Mycobacte- rium tuberculosis, the bacte-rium that causes tubercu-
losis (TB).1 (See Figure 1.) Relatively few infected individuals (5% to 10%) develop active, life-threatening forms of TB.1 Nevertheless, TB remains one of the deadliest infections in the world and is the leading killer among human bacte-rial diseases; 1.7 million people die of TB each year, and of these, some 200 000 are HIV-positive. Each year, 9.2 million new victims are infected.1,2
TB is acquired through the air and most active cases are pulmonary, attack-ing the lungs.2 However, TB also attacks the brain and spine; the lymph, circula-tory, gastrointestinal and genitourinary systems; skin; bones; and joints. Active TB is a progressive disease that slowly impedes vital organ function, particu-larly lung function, leading to severe morbidity and death.2
TB infection rates declined steadily after World War II until a resurgence
Figure 1. Scanning electron micrograph of Mycobacterium tuberculosis, the bacterium that causes tuberculosis, under x15 549 magni-fication. Reprinted from the U.S. Department of Health and Human Services, Centers for Disease Control and Prevention’s Public Health Image Library (PHIL). (PHIL image identifi-cation number 8438, permission PD-USGov-HHS-CDC, public-domain U.S. government image.) www.wikimedia.org. Accessed September 17, 2009.

CETUBERCULOSIS
34 September/October 2010, Vol. 82/No. 1 RADIOLOGIC TECHNOLOGY
. . . . . . . . . . . . . . . . . . . . . . . . . . . . . . . . . . . . . . . . . . . . . . . . . . . . . . . . . . . . . . . . . . . . . . . . . . . . . . . . . . . . . . . . . . . . . . . . . .
resonance (MR) imaging in TB medicine.Box 1 presents a glossary of common abbreviations
used in TB medicine.
History TB is an ancient disease that has afflicted humans
since at least the Neolithic period, some 9000 years ago.10 Based on fossil bone evidence, some archeolo-gists controversially contend that TB plagued even our prehuman ancestors, Homo erectus.11
Until recently, it was believed that human strains of M. tuberculosis originally were acquired from cattle, which can transmit the disease to humans. But recent genetic research shows that human TB strains did not evolve directly from bovine TB, and instead suggests that the reverse may have been the case: Cattle prob-ably acquired TB from people.12,13 DNA sequences from the M. tuberculosis in the remains of a woman and child who died 9000 years ago, prior to animal domestication, reveal that the strains infecting many humans today are genetically more similar to ancient human strains than M. bovis.10 Genetic analyses indi-cate that TB emerged at least 40 000 years ago in Africa, and that the strains of TB infecting cattle today evolved from human strains.13
The Arab physician Ibn Sina first described pulmo-nary tuberculosis as a contagious respiratory disease and devised patient quarantine for TB control.14 Before the widespread dissemination of the germ theory of disease, TB sometimes was attributed in England and its North American colonies to witches or vampires, possibly because TB victims frequently exhibit light sen-sitivity, red eyes, pale skin and cool body temperatures, and cough up blood.15
The various types of TB were recognized as variants of a single disease during the early 1800s, when the disease was commonly known as “consumption” or “the White Plague.” Sanitaria were first established to treat patients in the 1850s.9
Physician Robert Koch first described M. tuberculo-sis as the cause of TB in 1882, for which he received the 1905 Nobel Prize in Medicine. However, evidence-based treatment was lacking well into the 20th centu-ry, leading playwright George Bernard Shaw to write in The Doctor’s Dilemma that the practice of medicine in 1903 was “a huge commercial system of quackery and poison.”16
Radiography played a growing role in the diagnosis of TB throughout the 1920s and 1930s, and was used in screening programs to identify individuals for isolation
in the 1980s that coincided with the emergence of the global HIV/AIDS epidemic. Three decades later, the TB epidemic remains “embedded” in the HIV/AIDS crisis, complicating TB diagnosis and treatment.3 TB and HIV coinfection hastens the progression of both diseases, and some anti-TB drugs can interfere with HIV/AIDS drug treatments.3
Worldwide, between 20% and 70% of new active TB cases occur among HIV-positive individuals, reflecting overlapping risk factors for the diseases as well as the increased susceptibility of HIV-positive people to TB.2,4
The United Nations’ Millennium Development Plan lists as one of its goals halting or reversing the resurgence of TB by 2015.2 The number of new cases per capita globally declined between 2003 and 2007, leading public health officials to anticipate meeting that goal.2 However, in the face of global economic challenges, donor nations started to slash funding in 2009 for future years’ global anti-TB, anti-HIV/AIDS and antimalaria efforts. These cuts occurred just as the National Academy of Sciences and the U.S. Institute of Medicine (IOM) released a report urging increased U.S. government investments in global health.5,6
Active TB cases in the U.S. are demographi-cally concentrated among young adults and ethnic minorities and are geographically concentrated in California, New York and southern states.7 Approximately 5% of U.S. HIV/AIDS patients have active TB.7 The U.S. Centers for Disease Control and Prevention (CDC) reported 13 779 new cases of tuber-culosis in the U.S. for 2006 and 13 299 new cases in 2007, the most recent year for which infection rate data are available.8 The U.S. had 644 TB deaths in 2006, the most recent year for which complete mortal-ity data are available.8
Overall U.S. infection rates have declined steadily since 1992, when the resurgence peaked. However, the rate of decline has slowed markedly during that time, and recent reductions in funding for global TB efforts have raised concerns that recent gains may be lost.8 Because most new TB cases in the U.S. occur among foreign-born individuals, global infection rate trends are likely to influence U.S. rates as well.
Diagnostic chest radiography is a central component of TB diagnosis and screening.9 Chest radiographs, skin and blood tests and microscopic exams of sputum (coughed-up mucus) cultures are the mainstays of TB diagnosis, but imaging advances are expanding the roles of computed tomography (CT) and magnetic

CEDIRECTED READING
. . . . . . . . . . . . . . . . . . . . . . . . . . . . . . . . . . . . . . . . . . . . . . . . . . . . . . . . . . . . . . . . . . . . . . . . . . . . . . . . . . . . . . . . . . . . . . . . . .
35RADIOLOGIC TECHNOLOGY September/October 2010, Vol. 82/No. 1
Leading risks for TB infection include silicosis, hemodialysis for chronic renal failure, diabetes, organ transplantation, cancer radiation therapy or chemo-therapy and the interlinked socio-demographic factors of male sex, poverty, HIV-positive status, homelessness and prior imprisonment.21,22 Poverty drives the spread of TB through poor hygiene, overcrowded living condi-tions, poor home ventilation, significant delays in diag-nosis and subsequent diagnosis at later disease stages, malnutrition and HIV/AIDS coinfection. Most of the global TB morbidity (95%) and mortality (98%) occur in developing countries where diagnostic and treat-ment tools considered standard in wealthy countries are largely unavailable.23
The pace of development of new drugs for TB treatment has been surprisingly slow, considering the disease’s deadly global toll. However, because TB dis-proportionately affects the poor, there has been little economic incentive for private-sector development of new anti-TB drugs.24
Infection Rates and TrendsGlobal epicenters of TB, including multidrug-
resistant TB (MDRTB) and extensively drug-resistant TB (XDRTB), are in Africa and eastern Europe, where annual infection incidence rates exceed 300 new cases per 100 000 population.9 Within the U.S. and Canada, infection incidence rates range from < 1 case per 100 000 to 24 cases per 100 000 population; the nationwide preva-lence of TB in the U.S. is 10 per 100 000.8,9 (Incidence rates represent the number of new cases per year. Prevalence rates represent the total number of cases in a population at any given time.)
In the U.S., TB case loads today are concentrated in California, New York, Washington, D.C. and the south.8 Just 4 states — California, Texas, New York and Florida — accounted for nearly half (48%) of new U.S. TB cases in 2007.8 TB incidence in the U.S. is concentrated among young adults, peaking among those aged 25 to 44 years.7,8 American men have a sig-nificantly higher TB infection rate than women (5.5 vs 3.4 per 100 000 population).8
There are dramatic differences in TB infection rates between U.S. racial and ethnic groups. Asian Americans have the highest annual TB new-case rate: 26.3 cases per 100 000 population, a slight increase from 25.9 in 2006.8 Native Hawaiians and other Pacific Islanders had the second-highest TB case rate for 2007, at 23 cases per 100 000 — an as-yet-unexplained jump from 13.4 cases per 100 000 in 2006.8 The instability in
from the general population at sanitaria.17
Sulfonamide antibiotics and penicillin changed the situation dramatically in the 1930s, arming public health clinicians with tools that could cure TB.18 As early as 1950, clinical trials showed that combination antibiotic therapies were more effective treatments than monotherapies, and that combina-tion therapies slowed the evolution of drug-resistant strains of TB.18
Concerted international anti-TB efforts, includ-ing education, expanded access to vaccination and advances in treatment, led to sustained reductions in new infection rates from the early 1950s through the 1970s. Optimal antibiotic treatment regimens went from 24-month ordeals to 6-month curative therapies, and survival rates increased throughout most of the 20th century,18 with the exception of HIV/AIDS-related TB resurgence and hampering of efforts from reduced funding.
EpidemiologyWhen individuals with active pulmonary TB cough,
sneeze, spit or vocalize, aerosol clouds of infected saliva and mucus droplets containing M. tuberculosis are released into the surrounding air. These aerosols are highly infectious; brief exposures and even exposure to a single bacterial cell can lead to a new case of TB.19,20
Box 1Glossary of Tuberculosis Abbreviations
BCG The Bacille Calmette Guerin vaccine against TB. CDC U.S. Centers for Disease Control and Prevention, located in Atlanta, Georgia. The CDC spearheads U.S. anti-TB efforts and has authority to impose interstate and international isolation and quar-antine orders to prevent the spread of TB.DOT Directly observed therapy. The U.S. standard for supervised antibiotic therapy.DOTS Directly observed therapy, short course. A strategy for HIV/TB coinfected patient therapy.IGRA Interferon gamma release assay; an in-vitro assay of host T-cell function used as an alternative to tuberculin skin testing to determine TB infection.MDRTB Multidrug resistant TB: resistance to isoni-azid and rifampin, plus any fluoroquinolone drug and at least one second-line drug.TST Tuberculin skin test.XDRTB Extensively drug-resistant TB.WHO World Health Organization.
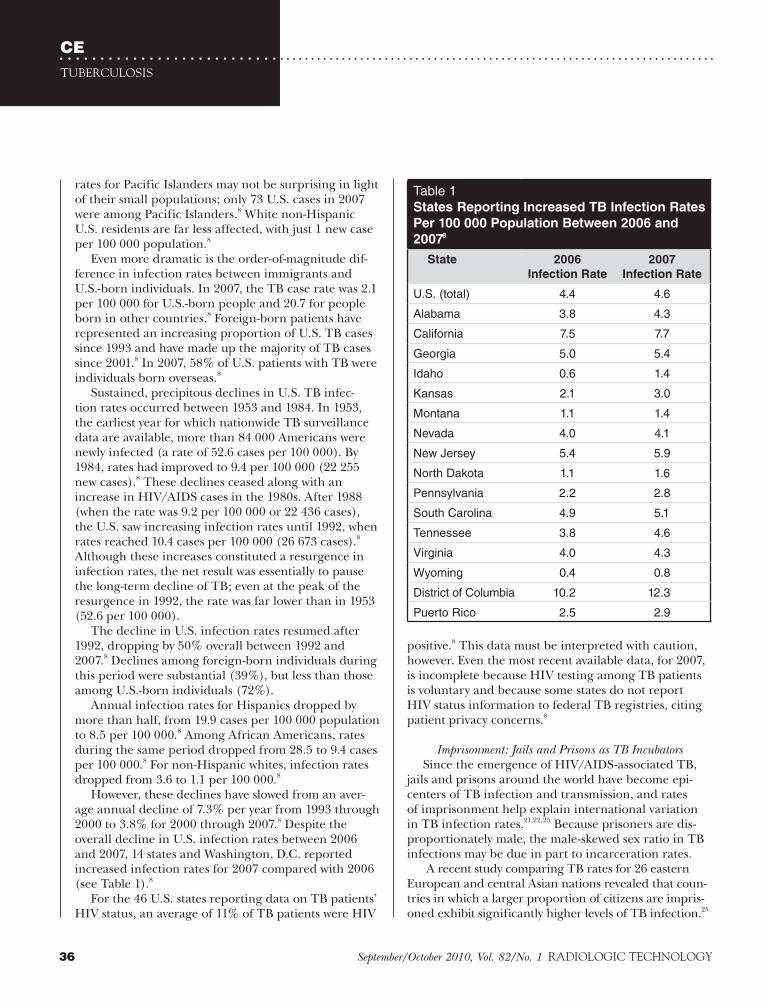
CETUBERCULOSIS
36 September/October 2010, Vol. 82/No. 1 RADIOLOGIC TECHNOLOGY
. . . . . . . . . . . . . . . . . . . . . . . . . . . . . . . . . . . . . . . . . . . . . . . . . . . . . . . . . . . . . . . . . . . . . . . . . . . . . . . . . . . . . . . . . . . . . . . . . .
rates for Pacific Islanders may not be surprising in light of their small populations; only 73 U.S. cases in 2007 were among Pacific Islanders.8 White non-Hispanic U.S. residents are far less affected, with just 1 new case per 100 000 population.8
Even more dramatic is the order-of-magnitude dif-ference in infection rates between immigrants and U.S.-born individuals. In 2007, the TB case rate was 2.1 per 100 000 for U.S.-born people and 20.7 for people born in other countries.8 Foreign-born patients have represented an increasing proportion of U.S. TB cases since 1993 and have made up the majority of TB cases since 2001.8 In 2007, 58% of U.S. patients with TB were individuals born overseas.8
Sustained, precipitous declines in U.S. TB infec-tion rates occurred between 1953 and 1984. In 1953, the earliest year for which nationwide TB surveillance data are available, more than 84 000 Americans were newly infected (a rate of 52.6 cases per 100 000). By 1984, rates had improved to 9.4 per 100 000 (22 255 new cases).8 These declines ceased along with an increase in HIV/AIDS cases in the 1980s. After 1988 (when the rate was 9.2 per 100 000 or 22 436 cases), the U.S. saw increasing infection rates until 1992, when rates reached 10.4 cases per 100 000 (26 673 cases).8 Although these increases constituted a resurgence in infection rates, the net result was essentially to pause the long-term decline of TB; even at the peak of the resurgence in 1992, the rate was far lower than in 1953 (52.6 per 100 000).
The decline in U.S. infection rates resumed after 1992, dropping by 50% overall between 1992 and 2007.8 Declines among foreign-born individuals during this period were substantial (39%), but less than those among U.S.-born individuals (72%).
Annual infection rates for Hispanics dropped by more than half, from 19.9 cases per 100 000 population to 8.5 per 100 000.8 Among African Americans, rates during the same period dropped from 28.5 to 9.4 cases per 100 000.8 For non-Hispanic whites, infection rates dropped from 3.6 to 1.1 per 100 000.8
However, these declines have slowed from an aver-age annual decline of 7.3% per year from 1993 through 2000 to 3.8% for 2000 through 2007.8 Despite the overall decline in U.S. infection rates between 2006 and 2007, 14 states and Washington, D.C. reported increased infection rates for 2007 compared with 2006 (see Table 1).8
For the 46 U.S. states reporting data on TB patients’ HIV status, an average of 11% of TB patients were HIV
positive.8 This data must be interpreted with caution, however. Even the most recent available data, for 2007, is incomplete because HIV testing among TB patients is voluntary and because some states do not report HIV status information to federal TB registries, citing patient privacy concerns.8
Imprisonment: Jails and Prisons as TB Incubators
Since the emergence of HIV/AIDS-associated TB, jails and prisons around the world have become epi-centers of TB infection and transmission, and rates of imprisonment help explain international variation in TB infection rates.21,22,25 Because prisoners are dis-proportionately male, the male-skewed sex ratio in TB infections may be due in part to incarceration rates.
A recent study comparing TB rates for 26 eastern European and central Asian nations revealed that coun-tries in which a larger proportion of citizens are impris-oned exhibit significantly higher levels of TB infection.25
Table 1States Reporting Increased TB Infection Rates
Per 100 000 Population Between 2006 and
20078
State 2006
Infection Rate
2007
Infection Rate
U.S. (total) 4.4 4.6
Alabama 3.8 4.3
California 7.5 7.7
Georgia 5.0 5.4
Idaho 0.6 1.4
Kansas 2.1 3.0
Montana 1.1 1.4
Nevada 4.0 4.1
New Jersey 5.4 5.9
North Dakota 1.1 1.6
Pennsylvania 2.2 2.8
South Carolina 4.9 5.1
Tennessee 3.8 4.6
Virginia 4.0 4.3
Wyoming 0.4 0.8
District of Columbia 10.2 12.3
Puerto Rico 2.5 2.9
CEDIRECTED READING
. . . . . . . . . . . . . . . . . . . . . . . . . . . . . . . . . . . . . . . . . . . . . . . . . . . . . . . . . . . . . . . . . . . . . . . . . . . . . . . . . . . . . . . . . . . . . . . . . .
37RADIOLOGIC TECHNOLOGY September/October 2010, Vol. 82/No. 1
highest XDRTB rate in western Europe, at more than 50%.27 The absence of drug-susceptibility testing lab equipment has precluded reliable estimates for most of Africa and much of the Middle East, including Iraq and Afghanistan, despite the presence of U.S. military medical personnel and equipment.27 Overall, only 30% to 50% of XDRTB patients survive the disease, although survival rates of up to 65% have been report-ed in some patient groups.27
XDRTB is very rare in the U.S.; only 6 cases were identified in 2006 and 2007 combined.8 However, worldwide rates are increasing dramatically, and U.S. health care workers must be aware of this threat, partic-ularly among patients born overseas and patients who have recently traveled outside of North America.
The Role of Substandard and Counterfeit DrugsThe global effort to control TB is severely under-
mined by the distribution of substandard and counter-feit drugs, which facilitate the spread of and morbidity and mortality due to all strains of TB, as well as other diseases, such as HIV/AIDS, pneumonia and typhoid disease.28,30-33 Substandard-quality medications contain low concentrations of active ingredients, facilitating the evolution of drug resistance;32 counterfeit drugs contain no active ingredients and thus contribute to morbidity and mortality among individuals who believe they are receiving treatment, as well as the spread of the disease.32,34 For example, substandard rifampin and pyrazinamide are believed to have contributed to the evolution and spread of MDRTB.32,35 The counterfeit drug trade has become so bad in much of the world that some authors have argued it will “fatally under-mine” efforts to identify optimal treatment policies for the third world until the trade is stopped.32
Nosocomial TB and Health Care WorkersDuring the HIV-associated TB resurgence in the
U.S., several hospitals experienced nosocomial out-breaks of MDRTB.36 Nosocomial infections (those acquired in a health care facility) remain common-place in eastern Europe and sub-Saharan Africa, par-ticularly among health care workers who have regular direct patient contact.21,27 In Romania, for example, MDRTB and XDRTB rates among all health care work-ers approach a magnitude higher than rates in the general public at 942 cases per 100 000 annually vs 98.6 per 100 000.37
The TB risk faced by radiologic technologists is not known and radiology departments are often neglected
For each additional percentage point in incarceration rate, TB incidence increases 0.34%, even after statisti-cally controlling for differences in HIV/AIDS incidence rates, surveillance programs and economic factors.25 Overall, more than half of the increases in TB rates in these countries between 1991 and 2002 were attributable to increased incarceration rates.25
TB is also a longstanding problem in U.S. jails and prisons, which release more than 10 million indi-viduals back into the general U.S. population each year.26 Crowded living conditions and lack of medical resources have facilitated higher incidence rates for TB among inmates and prisoners than the general public, although reliable numbers are unavailable.26 Many jails in the U.S.— in both urban TB epicenters like New York City and even in remote, rural jails like the Rio Arriba County Detention Center in northern New Mexico — have installed negative-air pressure TB isola-tion facilities in an effort to stem the spread of active TB infections among inmates22 (Bidal Candelaria, Rio Arriba County, New Mexico, jail administrator, oral communication, March 5, 2009).
Drug-resistant TBDrug resistance is a human-made crisis, the result
of inappropriate use and overuse of antibiotics.27,28 For example, the routine repeated prescription of fluoroqui-nolone drugs for pneumonia in Canada has been tied to the evolution of fluoroquinolone-resistant TB strains.27 Patient noncompliance and abandonment of antibiotic therapy also contribute importantly to drug resistance.18
Antibiotic resistance in a patient’s TB may involve either acquired or primary drug resistance.28 Acquired resistance evolves within a patient during treatment, whereas primary resistance is defined as a previously untreated patient’s TB isolates exhibiting drug resis-tance — a strong indicator that he or she was infected with an already-resistant strain.28
TB resistance to more than one antibiotic is defined as MDRTB. When the TB is resistant to isoniazid and rifampin, plus any fluoroquinolone drug and at least one second-line drug, it is defined as XDRTB. Confirmation of XDRTB status is cumbersome and slow, requiring 4 to 8 weeks of culture-based lab work.27,29
An estimated 900 000 people worldwide are infected with drug-resistant strains of TB, 500 000 of them XDRTB.5,27 Eastern European and central Asian countries have the highest rates of XDRTB infections — 15% of TB cases in Ukraine and 24% of Estonian TB cases involve XDRTB strains.27 Portugal has the

CETUBERCULOSIS
38 September/October 2010, Vol. 82/No. 1 RADIOLOGIC TECHNOLOGY
. . . . . . . . . . . . . . . . . . . . . . . . . . . . . . . . . . . . . . . . . . . . . . . . . . . . . . . . . . . . . . . . . . . . . . . . . . . . . . . . . . . . . . . . . . . . . . . . . .
in hospitals’ infection control programs.38 But when radiology personnel perform procedures involving exposure to infected patients, they obviously must observe precautions to minimize their risk of infection and the risk of cross-infecting other patients.
Published studies that compared TB infection rates for specific categories of health care workers have con-sistently identified nurses and physicians as facing the highest risks of infection. Very few cases were identified among radiology department personnel in the hand-ful of studies that included radiology personnel.21,37-44 In a study of Romanian hospital workers, for example, only 1 of the 50 hospital employees identified with TB worked in a radiology department, compared with 21 nurses, 12 maintenance and cleaning staff, 6 physi-cians, 5 lab technologists and 5 clerks.37 A 2007 study of latent TB infections in Russian medical school person-nel found that incidence was more than 4 times higher in physicians and nurses than in medical students (39% vs 9%).21
In the early 1990s, when the U.S. TB resurgence peaked, a study of workers at a large hospital with a nosocomial outbreak of MDRTB found that staff in departments where TB patients were seen were nearly 14 times as likely to test positive on a tuberculin skin test (TST) as other employees, regardless of whether the workers had direct contact with patients.44 Risk was high-est for nurses and clerks.44 Furthermore, the year-to-year fluctuation in hospital workers’ TB risk was related to the number of TB patients admitted to the hospital.44
A 2007 study in England found that foreign-born health care workers were significantly more likely to have latent TB, but found no evidence that these work-ers represented a transmission risk to patients or fellow health care workers.40
Biology TB is one of the leading causes of death in the
world, but only 5% of cases are active.1 The vast major-ity of cases are instead latent (quiescent), diagnosed only when patients undergo tuberculin antibody response tests or in vitro T-cell function assays called interferon gamma release assay (IGRA).1 An unknown proportion of latent cases represent a persistent immune response to TB bacterial proteins without sur-viving bacteria in the host.1
Active TB cases immediately following infection are called primary TB. Each year, between 1% and 2% of latent TB cases become postprimary (or active) infections.1 The transition from latent to postprimary
TB represents a neglected opportunity for medi-cal intervention; however, little is known about what causes reactivation to postprimary disease, other than a suspected link to immune suppression (eg, cancer, malnutrition, intravenous drug abuse, diabetes melli-tus, renal disease, other infections or advanced age).1,45 Reactivated TB is not clinically or radiographically dis-tinct from primary TB.46
Although TB is blood-borne, most infections begin with inhalation of infectious aerosols. The bacteria then travel from the lungs, through the lymph system to the bloodstream. From there, TB can infect any organ system in the body.47 TB spreads more rapidly to organ systems outside the lungs in HIV-positive indi-viduals than in others.47
This section introduces the functional anatomy and pathobiology of the respiratory system and describes the broad anatomic subtypes of TB.
Functional Respiratory Anatomy and PathobiologyThe respiratory system contains several antibacterial
adaptations. The nose and nasal passages connect to the anterior nasal mucus trap that stops inhaled particulate matter and pathogens. Nevertheless, some bacteria and viruses survive this gauntlet to pass through the pharynx — a muscular sac that routes air and food to the trachea and esophagus — to the larynx, trachea and ultimately the lungs. From the mainstem bronchi, the airways within the lungs repeatedly subdivide and bifurcate into the smaller-diameter bronchioles of the “tracheo-bronchial tree.”48 The tracheobronchial tree is coated with a mucus-covered epithelial lining. Cilial movement on this lining pushes mucus and trapped bacteria up a “ciliar escalator” toward the pharynx and away from the lungs.48 Beyond the smallest, terminal bronchioles are respiratory alveoli, where gas exchange occurs with cap-illaries’ circulating blood (see Figure 2).
Collectively, the bronchioles, alveoli and associated capillaries at the myriad termini of the bronchial tree are referred to as the lungs’ parenchyma. The total alveolar surface area in an adult is roughly that of a tennis court, providing ample habitat for bacteria that have circumvented the anterior nasal mucus trap and ciliar escalator.48 The destruction of lung parenchyma leads to the collapse, or failure to fully inflate during inhalation, of segments of the lung. This situation pre-vents normal oxygen delivery to the capillaries, a condi-tion called atelectasis. Parenchymal infection also can cause consolidation, in which chronically inflamed and fluid-filled alveoli become swollen and firm.
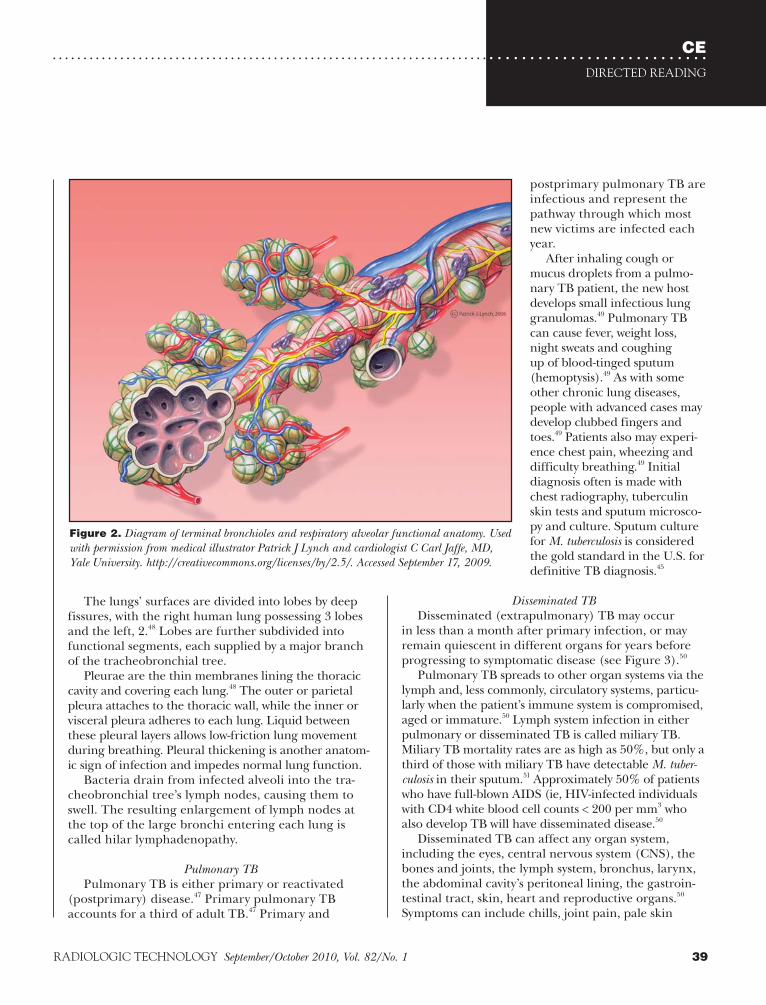
CEDIRECTED READING
. . . . . . . . . . . . . . . . . . . . . . . . . . . . . . . . . . . . . . . . . . . . . . . . . . . . . . . . . . . . . . . . . . . . . . . . . . . . . . . . . . . . . . . . . . . . . . . . . .
39RADIOLOGIC TECHNOLOGY September/October 2010, Vol. 82/No. 1
The lungs’ surfaces are divided into lobes by deep fissures, with the right human lung possessing 3 lobes and the left, 2.48 Lobes are further subdivided into functional segments, each supplied by a major branch of the tracheobronchial tree.
Pleurae are the thin membranes lining the thoracic cavity and covering each lung.48 The outer or parietal pleura attaches to the thoracic wall, while the inner or visceral pleura adheres to each lung. Liquid between these pleural layers allows low-friction lung movement during breathing. Pleural thickening is another anatom-ic sign of infection and impedes normal lung function.
Bacteria drain from infected alveoli into the tra-cheobronchial tree’s lymph nodes, causing them to swell. The resulting enlargement of lymph nodes at the top of the large bronchi entering each lung is called hilar lymphadenopathy.
Pulmonary TBPulmonary TB is either primary or reactivated
(postprimary) disease.47 Primary pulmonary TB accounts for a third of adult TB.47 Primary and
postprimary pulmonary TB are infectious and represent the pathway through which most new victims are infected each year.
After inhaling cough or mucus droplets from a pulmo-nary TB patient, the new host develops small infectious lung granulomas.49 Pulmonary TB can cause fever, weight loss, night sweats and coughing up of blood-tinged sputum (hemoptysis).49 As with some other chronic lung diseases, people with advanced cases may develop clubbed fingers and toes.49 Patients also may experi-ence chest pain, wheezing and difficulty breathing.49 Initial diagnosis often is made with chest radiography, tuberculin skin tests and sputum microsco-py and culture. Sputum culture for M. tuberculosis is considered the gold standard in the U.S. for definitive TB diagnosis.45
Disseminated TBDisseminated (extrapulmonary) TB may occur
in less than a month after primary infection, or may remain quiescent in different organs for years before progressing to symptomatic disease (see Figure 3).50
Pulmonary TB spreads to other organ systems via the lymph and, less commonly, circulatory systems, particu-larly when the patient’s immune system is compromised, aged or immature.50 Lymph system infection in either pulmonary or disseminated TB is called miliary TB. Miliary TB mortality rates are as high as 50%, but only a third of those with miliary TB have detectable M. tuber-culosis in their sputum.51 Approximately 50% of patients who have full-blown AIDS (ie, HIV-infected individuals with CD4 white blood cell counts < 200 per mm3 who also develop TB will have disseminated disease.50
Disseminated TB can affect any organ system, including the eyes, central nervous system (CNS), the bones and joints, the lymph system, bronchus, larynx, the abdominal cavity’s peritoneal lining, the gastroin-testinal tract, skin, heart and reproductive organs.50 Symptoms can include chills, joint pain, pale skin
Figure 2. Diagram of terminal bronchioles and respiratory alveolar functional anatomy. Used with permission from medical illustrator Patrick J Lynch and cardiologist C Carl Jaffe, MD, Yale University. http://creativecommons.org/licenses/by/2.5/. Accessed September 17, 2009.

CETUBERCULOSIS
40 September/October 2010, Vol. 82/No. 1 RADIOLOGIC TECHNOLOGY
. . . . . . . . . . . . . . . . . . . . . . . . . . . . . . . . . . . . . . . . . . . . . . . . . . . . . . . . . . . . . . . . . . . . . . . . . . . . . . . . . . . . . . . . . . . . . . . . . .
Clinical TestingTB diagnosis is based on clinical histories and symp-
toms, diagnostic imaging examinations and laboratory tests. Chest radiography has long been a mainstay of TB diagnosis and is discussed in detail below; CT is now considered the gold standard for TB imaging. However, when possible, definitive diagnosis is based on sputum culture. Only in rare cases are biopsies of affected tissues undertaken to make a definitive diagnosis.49
TST is a screening tool that involves injecting M. tuberculosis-derived protein tuberculin under the skin on the forearm.29 A positive test result is defined as a red welt developing at the injection site within 72 hours. However, the test is not perfectly sensitive; false positives may occur if the individual has been exposed to pathogens similar to M. tuberculosis or if the individu-al was vaccinated against TB outside the U.S.29
A positive TST result is not the basis of a definitive TB diagnosis, but rather indicates the need for further testing, such as laboratory sputum culture. Culturing TB isolates in the lab is a very slow process, typically requiring up to 8 weeks. This includes 4 weeks for the actual culture, because M. tuberculosis is a slow-growing bacterium, and then another 3 to 4 weeks to test iso-lates’ susceptibilities to different antibiotics and pro-duce antibiograms.29
TST remains a common screening test in the U.S. In 2001, however, the U.S. Food and Drug Administration approved a more accurate alternative to TST testing. IGRA is a blood test that detects the release of inter-feron from blood incubated with proteins that are very similar to M. tuberculosis proteins.52
Two IGRA tests have been approved by the Food and Drug Administration for use in the United States, although only one is widely used. The original QuantiFERON-TB (QFT) test was approved in 2001; the subsequently developed QFT-gamma (interferon gamma) test (Cellestis Limited, Carnegie, Australia) was approved in 2005 and quickly replaced its prede-cessor.52 The original test helped diagnose only cases of latent TB, whereas QFT-gamma IGRA is useful in diag-nosing both latent and active TB.52
QFT-gamma is a more specific test than TST because it uses proteins simulating M. tuberculosis-specific pro-teins and, molecules that are absent from both the Bacille Calmette Guerin (BCG) vaccine and other, non-M. tuberculosis mycobacterial species.52
Sputum microscopy (visual inspection of sputum iso-lates under a microscope) remains the traditional basis for diagnosing pulmonary TB in poor countries where
or swollen lymph nodes.50 Physical exams may reveal enlarged lymph nodes, spleen or liver — or none of these, depending on the progression and anatomic location of the disease.50
TB DiagnosisWhen TB is detected early and treated, the patient is
soon noninfectious and likely will be cured. Active pul-monary TB, particularly early in disease progression, can be completely asymptomatic or may be associated with mild or progressive dry cough. It also may involve a complex of symptoms, including fever, weight loss, fatigue, night sweats and cough with bloody sputum.
Figure 3. Disseminated tuberculosis: organ systems affected by extrapulmonary TB. Used with permission from artist Mikael Häggström. www.wikimedia.org. Accessed September 17, 2009.
CEDIRECTED READING
. . . . . . . . . . . . . . . . . . . . . . . . . . . . . . . . . . . . . . . . . . . . . . . . . . . . . . . . . . . . . . . . . . . . . . . . . . . . . . . . . . . . . . . . . . . . . . . . . .
41RADIOLOGIC TECHNOLOGY September/October 2010, Vol. 82/No. 1
Using only existing diagnostic techniques and treat-ments (not investing in the development of new diag-nostic or treatment tools), full implementation of the plan would cost $56 billion and would treat 50 million patients, saving an estimated 14 million lives by 2015, including an estimated 800 000 patients with MDRTB.54
The plan also established international working groups on strengthening health systems and screening and the role of poverty and TB in children and women. In addition, it called for providing antiretroviral thera-py for 3 million HIV-positive TB patients.54
Prevention and Infection Control
Infection control policies are devised to slow, con-tain and reverse environmental contamination and person-to-person transmission. Infection control strategies include contact precautions, surveillance, treatment and adherence to standard infection pre-cautions. Fundamentally, controlling the spread of all drug-resistant organisms, including MDRTB and XDRTB, requires regular and thorough cleaning of the health care environment and vigilant hand hygiene by health care workers.55 In addition, reusable equip-ment that comes into contact with patients must be regularly disinfected.55 By carefully adhering to stan-dard infection-control practices, health care person-nel will reduce the incidence of TB strains and other nosocomial infections.55 A study of nosocomial TB in South Africa found that simply implementing existing infection-control strategies could prevent half of noso-comial XDRTB cases and 75% of cases among hospital workers.4 Preventing TB infection among radiology department workers requires observance of standard infection-control precautions (particularly respiratory protection), disinfection practices, routine monitoring of these practices and periodic surveillance (testing) of workers, particularly when TB patients are known to have been seen at a facility.38
Standard PrecautionsCDC guidelines recommend that health care work-
ers wear gloves and gowns when caring for patients with drug-resistant infections. The CDC’s univer-sal precautions for blood and infectious materials became “Standard Precautions” in 1996, and address efforts to avoid transmission of blood-borne and non-blood-borne infections.56 Hand hygiene and respira-tory hygiene (cough etiquette), safe injection practices and the use of masks are standard precautions against nosocomial infection.55
more definitive diagnostic techniques are frequently unavailable. Microscopy is inexpensive and widely con-sidered to be accurate, despite studies showing a range of specificity from 20% to 80% for pulmonary TB.23
(Diagnostic specificity refers to a test’s percentage of true-negative test results; sensitivity refers to the per-centage of true-positive results.)
Some of the variation in sputum microscopy’s specificity appears to be due to tested individuals’ HIV status; false-negative test result rates are at least 11% higher in HIV-positive individuals than among HIV-negative individuals.23 This complicates the diagnosis, treatment and even determination of basic epidemiol-ogy for HIV/TB coinfection.23
TB Control
The impact of TB on economic development is dif-ficult to calculate, but 85% of TB cases occur among young and middle-aged adults, in the prime of their working years.5 A 2008 World Bank study concluded the economic returns to the global economy for fully implementing the Global Plan to Stop TB would exceed 1500%.5
Nevertheless, budgetary challenges in affluent coun-tries facing a global economic recession could hasten the global resurgence of TB. Despite the IOM’s recom-mendation that the U.S. increase its investment in glob-al public health and infectious disease control efforts, the 2008-2009 global financial crisis led to a $5 billion shortfall in the $10 billion pledged for the Global Fund to Fight AIDS, Tuberculosis and Malaria.5,6
During the January 2009 World Economic Forum in Switzerland, UN special advisor Jeffrey Sachs argued that the failure of affluent nations like the U.S. to make good on pledged levels of funding for these efforts was “absolutely in violation of the life and death pledge that the rich world has made.”5 The prior U.S. commitment of $2 billion to $2.7 billion in support of the Global Fund for 2010 was cut to $1 billion dur-ing January 2009 congressional budget negotiations. Committee members cited the financial sector bailout as the reason for the cuts.53
The Global Plan To Stop TBThe Global Plan to Stop TB emphasizes coordinated
international confrontation of TB, MDRTB and HIV as interconnected crises; expanded patient access to exist-ing diagnosis and treatment resources in underserved areas like sub-Saharan Africa; and the dissemination of new TB diagnostic tools, treatments and vaccines.54

CETUBERCULOSIS
42 September/October 2010, Vol. 82/No. 1 RADIOLOGIC TECHNOLOGY
. . . . . . . . . . . . . . . . . . . . . . . . . . . . . . . . . . . . . . . . . . . . . . . . . . . . . . . . . . . . . . . . . . . . . . . . . . . . . . . . . . . . . . . . . . . . . . . . . .
Patient Quarantine and IsolationThe terms quarantine and isolation are frequently
treated as synonyms in the medical literature, but they are not. A quarantine occurs when individuals who are not yet ill but who have been exposed to an infection are kept away from unexposed individuals (eg, told to stay in their home).57 Isolation, in contrast, refers to separating infected individuals from uninfected people.
State health departments have the authority to issue quarantine or isolation orders to prevent the introduction or spread of infectious diseases. The CDC’s Division of Global Migration and Quarantine is the federal government agency with the authority to impose interstate quarantine orders.57
However, enforcing patient isolation or quarantine orders can be challenging. Following orders from the division to curtail travel generally is voluntary and recent history provides examples of individuals who refused to change their travel plans, violating do-not-travel orders and endangering others.
For example, a 31-year-old Atlanta, Georgia, lawyer underwent chest radiography after a fall in 2007, a few months before he was to fly with his fiancée to Europe for their honeymoon.57 The radiograph suggested pul-monary TB, a finding supported by a subsequent chest CT but not by the initial analysis of sputum samples.9 Follow-up bronchoscopy definitively diagnosed pulmo-nary TB.9 More than a month later, lab work indicated the man’s TB strain was MDRTB, resistant to at least 2 standard TB-treatment antibiotics.9
When the man was informed, he revealed that he was about to travel to Europe for his honeymoon. Health authorities claim they told him not to travel, but the man rescheduled his honeymoon flight to Europe, leaving with his wife earlier than planned. Four days after he left, the CDC determined (possibly errone-ously) that he had XDRTB, not merely MDRTB, and that his disease was caused by a strain from rural South Africa.9 The CDC located the man in Italy and told him not to travel but to check into an Italian hospital for immediate medical care.9 However, the man sub-sequently flew to the Czech Republic, and from there flew to Montreal, Canada, where he rented a car and drove back to the U.S.9
Upon his return, a federal isolation order was issued against the man — the first since a 1963 order to control the movement of an individual believed to be infected with smallpox.9 Subsequent testing indicated that he had MDRTB rather than XDRTB. The CDC alerted 245 U.S. citizens that they had been seated
After each procedure, all equipment or devices that came into contact with an active TB patient must be handled as though they are contaminated.
The following standard precautions should be observed vigilantly:
■ Wash hands thoroughly and promptly after con-tact with a patient, body fluids or secretions.56
■ Immediately after use, discard disposable sharps (eg, needles and scalpels) in puncture-resistant containers close to the point of use.56
■ All personnel present at procedures involving potential exposure to patient blood, body flu-ids, secretions, excretions, mucus membranes or wounds should use barrier precautions (eg, gloves, gowns, masks, goggles or face shields).56
■ Facility staff, patients and visitors should be educated regarding respiratory hygiene, includ-ing observance of droplet precautions (wearing masks to contain infectious aerosols), tissue use and physical separation (more than 3 feet) from patients with respiratory infections. Tissues should be disposed of promptly and hands imme-diately washed. Facilities should post signs illus-trating respiratory hygiene.55,56
Cleaning and DisinfectionOne recent study of hospital workers during a nosoco-
mial outbreak of MDRTB found that workers employed in rooms where TB patients had been present, regard-less of whether those workers had direct contact with the patients, were nearly 14 times as likely to test positive for TB as other hospital workers.44 In addition to stan-dard precautions and hand hygiene, therefore, radiol-ogy department infection control depends on effective cleaning of environmental surfaces and sterilization of medical devices after TB patients are seen. Cleaning and disinfection are health care workers’ basic responsibility to patients and fellow workers.
Rinsing is not cleaning and visual inspection does not indicate whether a room or surface is free of bacteria. Regular environmental sampling for bacte-rial contamination should be scheduled with hospital infection control personnel. Electronic controls and wires can be very difficult to clean effectively and must be covered with disposable or readily disinfected covers (eg, clear plastic).
Janitorial staff often cannot be relied on to perform proper disinfection and cleaning of storage areas or rooms. Cleaning staff does not typically receive special training or education regarding disinfection techniques.

CEDIRECTED READING
. . . . . . . . . . . . . . . . . . . . . . . . . . . . . . . . . . . . . . . . . . . . . . . . . . . . . . . . . . . . . . . . . . . . . . . . . . . . . . . . . . . . . . . . . . . . . . . . . .
43RADIOLOGIC TECHNOLOGY September/October 2010, Vol. 82/No. 1
BCG vaccination prevents latent infections from developing into active disease, but even repeated vac-cinations do not reliably prevent latent infections with M. tuberculosis.27 Vaccination efficacy varies between 0% and 80% protection in different study cohorts.59 Vaccination is most protective against the develop-ment of TB meningitis (infection of the membranous lining of the brain).59
TreatmentDisseminated TB, such as spinal TB, may require
surgical excision of affected tissues, but antibiotic ther-apies are the mainstay of TB management.51
Drug TherapiesTB drugs are categorized as first-line and second-
line antibiotic agents (see Box 2). First-line drugs are increasingly losing their efficacy in the face of MDRTB and XDRTB, while second-line drugs cause sufficient toxicity that 40% of patients suffer serious side effects and more than half of patients discontinue second-line therapies prior to cure.27
close enough to the man during his airline travel that they may have been exposed to MDRTB.9 None contracted TB, although 8 filed a lawsuit in Canada against the man.9
Screening and SurveillanceTB screening refers to the testing of populations
or cohorts, whether or not they exhibit TB symptoms. Screening typically involves antibody tests such as TST or IGRA, and in some cases, chest radiography. Epidemiological surveillance refers to tracking the inci-dence rates or new cases identified in a given popula-tion or cohort.
Because the majority of new TB cases in the U.S. occurs among foreign-born individuals, the U.S. gov-ernment’s screening and surveillance efforts focus on immigrant populations. The CDC is working with other U.S. and international public health agencies such as the World Health Organization (WHO) to reduce the immigration of individuals with TB to the U.S. by estab-lishing systematic screening programs abroad, particu-larly for monitoring TB in refugee communities, and by strengthening notification systems that inform state and local health departments about immigrants who may be infected.8 The CDC has emphasized the importance of coordinating U.S. and Mexican TB control efforts to ensure that TB treatment regimens are not disrupted for individuals who cross the border — a daunting task for a “shadow population” that often appears on public health radars only when patients with advanced, infectious TB come to hospital emergency departments.8
Immigrants arriving in the U.S. from countries with high TB infection rates are tested for latent infection. Immigrants with latent TB undergo supervised treat-ment. The CDC is surveying foreign-born TB patients in the U.S. to devise additional screening, surveillance and control strategies.8
Vaccination
The BCG vaccine, the only available anti-TB vac-cine, was developed by French researchers and first used in 1921 to inoculate infants.58 It contains a live but weakened strain of M. bovis, a relative of M. tuberculosis, which causes most human cases of TB. More than 1 billion people worldwide have received BCG vaccina-tion and it is generally considered to be very safe.58,59 However, vaccination may cause TB infection in immunocompromised people. Immunocompromised individuals also may develop the disease as a result of exposure to recently vaccinated individuals.58
Box 2Antibiotic Agents Used To Treat TB8
First-line Agents
Rifampin
Isoniazid
Pyrazinamide
Ethambutol
Streptomycin
Second-line Agents
Amikacin
Aminosalicylic acid
Capreomycin
Ciprofloxacin
Clofazimine
Cycloserine
Ethionamide
Levofloxacin
Moxifloxacin
Rifabutin
Rifapentine

CETUBERCULOSIS
44 September/October 2010, Vol. 82/No. 1 RADIOLOGIC TECHNOLOGY
. . . . . . . . . . . . . . . . . . . . . . . . . . . . . . . . . . . . . . . . . . . . . . . . . . . . . . . . . . . . . . . . . . . . . . . . . . . . . . . . . . . . . . . . . . . . . . . . . .
The first-line “essential” drugs are gold-standard agents included in any short-course treatment regimen. First-line essentials include 4 medications: rifampin, ethambutol, isoniazid and pyrazinamide.
Of these, rifampin is the most powerful weapon against TB and a range of other bacteria.7 Rifampin blocks bacterial RNA synthesis, preventing cellular division by TB bacteria. Rifampin’s adverse effects are relatively rare (occurring in fewer than 1% of cases) and include rash, flu-like symptoms, fever with chills and gastrointestinal upset.55 Fever and chills are strong indicators for discontinuing rifampin therapy. Because rifampin increases liver enzyme production, its use can affect the efficacy of other drugs, including methadone, oral contraceptives and, importantly, anti-HIV drugs.55
Chemical hepatitis has been reported in rare cases after coadministration of either rifampin or pyrazin-amide with isoniazid — a common combination therapy for TB patients. Between 3% and 5% of patients receiv-ing these combination therapies develop hepatitis.60
Isoniazid also is included in most TB patients’ treat-ment, unless the strain is drug-resistant. Isoniazid is inexpensive and involves a low incidence of adverse effects (fewer than 5%), which include liver toxicity and peripheral neuropathy (numbness of the hands and feet), rash, fever, seizures, acne, arthritis and an auto-immune syndrome similar to systemic lupus erythe-matosus. The risk of chemical hepatitis increases with regular alcohol consumption, active hepatitis B infec-tion and current or recent pregnancy (up to 3 months after delivery).
Second-line antibiotics are less effective, older drugs that entail higher risks of adverse reactions and are therefore used only rarely. Amikacin, for example, can cause kidney damage and is ototoxic, meaning it can damage the auditory nerves and hearing.61 Other examples of second-line TB agents are ethionamide, cycloserine and capreomycin and for the treatment of MDRTB, 2 fluoroquinolone antibiotics: levofloxacin and moxifloxacin.
Patient noncompliance and premature abandon-ment of antibiotic therapy are major barriers to success-ful TB treatment and control efforts.18 Two very differ-ent antibiotic therapy strategies, known as DOT and DOTS, were developed to address these issues.
Supervised or directly observed therapy (DOT) has become a centerpiece of modern TB treatment in afflu-ent countries, leading to the development of intermit-tent rather than daily antibiotic treatment regimens.18 Commonly, DOT regimens consist of
6 months of antibiotics given 3 times a week or 2 weeks of initial daily antibiotic administration followed by twice-weekly doses. Both of these are as effective as daily antibiotic therapy.18
In the U.S., DOT regimens were adopted at the height of the resurgence in TB infection rates and have been credited with helping reverse the resurgence throughout the late 1990s.18 Only 4% of patients were treated with DOT regimens in 1990, but that propor-tion reached 70% by 2000 and 86% by 2005.8,18
Although DOT has been successful in wealthy, devel-oped nations like the U.S., medical personnel shortages mean that patient supervision throughout an entire course of antibiotics is often unrealistic in many poor countries.18 This led the WHO to develop a modified regimen, called DOTS (directly observed therapy, short course).18
DOTS has 5 components:1. Government commitment to TB treatment.2. Assured supplies of antibiotics.3. Microscopic sputum-based diagnosis rather than
culture-based diagnosis. 4. Outcome analysis of patient cohorts.5. Directly observed treatment during the first 2
months.DOTS forgoes meaningful surveillance of drug-
resistance patterns because microscopy cannot detect drug-resistance patterns.18 Furthermore, in clinical practice, most DOTS programs around the world have been implemented as daily, unsupervised patient-administered treatments with periodic supervised doses.18 As a result, DOTS has not had the impact originally anticipated.59
DOTS guidelines for TB treatment allow local varia-tion from standardized international TB treatment guidelines and regimens.62,63 First-line drug regimens vary around the world and in many poor countries, second-line drugs are used instead of first-line ones because of availability. An August 2009 study by the Global Alliance for TB Drug Development concluded that this flexibility is a strength rather than a weakness in the global TB control effort because it allows local public health authorities to adapt to changing local and national conditions, including the emergence of drug-resistant TB strains.63
Treating MDRTB and XDRTBXDRTB represents one of the most significant chal-
lenges to the clinical management of TB, but it can be successfully treated in 30% to 65% of patients who

CEDIRECTED READING
. . . . . . . . . . . . . . . . . . . . . . . . . . . . . . . . . . . . . . . . . . . . . . . . . . . . . . . . . . . . . . . . . . . . . . . . . . . . . . . . . . . . . . . . . . . . . . . . . .
45RADIOLOGIC TECHNOLOGY September/October 2010, Vol. 82/No. 1
those likely to have drug-susceptible TB. This would allow labs to prioritize drug susceptibility testing of iso-lates likely to exhibit some form of resistance.70 These findings are described in the next section.
In this section, the imaging modalities used in TB diagnosis are introduced and the specific applications of each modality are described.
RadiographyPosteroanterior chest radiography remains the
imaging mainstay of pulmonary TB screening and diagnosis. Radiographs of active pulmonary TB often reveal parenchymal consolidation, atelectasis, pleural effusion and, sometimes, lymphadenopathy (enlarged lymph nodes) along the trachea.45 Pleural effusion is particularly common in children.51 These signs in the upper lobes often indicate reactivated or postprimary TB.45 However, CT and MR imaging can offer sig-nificant advantages over radiography when assessing suspected cases of pulmonary and disseminated TB.51 Bronchoscopy sometimes is used to follow up chest radiographs, particularly when biopsies are required for lab analysis.
Computed TomographyCT is a rapid and more detailed modality for TB
assessment than radiography, and is considered the gold standard for diagnostic imaging of active TB, both as a confirmatory follow-up modality in the imaging of pulmonary TB, and the detection and characteriza-tion of disseminated TB in other organ systems.51 CT more clearly visualizes classic pulmonary TB signs than radiography, including parenchymal consolidation, atelectasis and hilar lymphadenopathy.51
CT scanners use x-ray tubes and detectors, arrayed opposite one another in a semicircular yoke. The fan-shaped x-ray beam passes in preselected slice thickness-es through the target anatomy. Patients are positioned on their back on the CT table, which advances through the scanner field as sequential slices are acquired. X-ray attenuation is calculated and digitized for computer image reconstruction and computer postprocessing. CT values represent tissue densities and are calculated from attenuation coefficients.
Because CT involves higher ionizing radiation doses than chest radiography, this imaging modality should be used only when necessary, in observance of the ALARA (as low as reasonably achievable) princi-ple. The diagnostic superiority of CT often outweighs radiation risks, however.47
are not coinfected with HIV by rapidly identifying the antibiotics to which the strain is susceptible and using prolonged antibiotic therapy regimens.27,64
The susceptibility of cultures or isolates from a given patient’s TB strain to these drugs should be deter-mined before treatment to identify cases of MDRTB or XDRTB and to help formulate optimal antibiotic therapy regimens. Antibiograms are summary reports of lab results from such testing, detailing the propor-tion of isolates susceptible to each of a panel of antibi-otic drugs.
Medical Imaging’s Role in the Fight Against TB
ModalitiesMedical imaging is a routine, central component of
TB diagnosis. Chest radiography can reveal evidence of pulmonary TB before any clinical symptoms appear, and incidental discoveries of TB cases are not uncommon.
Chest radiography and CT commonly are used to determine the extent of pulmonary, pleural and paren-chymal involvement in pulmonary TB. MR and CT also demonstrate mediastinal and hilar lymph node enlargement with excellent sensitivity.
Positron emission tomography (PET) is not in wide-spread clinical use as a diagnostic imaging modality for TB, in part because of its poor infection specificity and the superior anatomic imaging of CT and MR.65-67 For example, pulmonary TB sensitivity for gallium-based infection scintigraphy is between 80% and 97%, but because positive results reflect uptake of gallium by inflamed tissue, any pulmonary infection and many other lung diseases yield positive results.68 In cases of laboratory-confirmed pulmonary TB, however, gallium scintigraphy has shown promise in confirming the efficacy of antibiotic therapy.68 High-resolution CT also shows promise for this application, but no comparative studies of PET and high-resolution CT for treatment monitoring have been published.69
Two specific PET examinations, fluorodeoxyglu-cose F 18 and choline C 11, sometimes are used to dif-ferentiate TB granuloma of the lung from cancerous lung tumors.46
Laboratory identification of MDRTB can require sev-eral weeks to complete, delaying effective treatment. The discovery by Korean researchers of radiographic and CT differences between pulmonary MDRTB and drug-susceptible TB strains might lead to the use of diagnos-tic imaging as a more rapid, probabilistic screening tool for differentiating patients likely to have MDRTB from
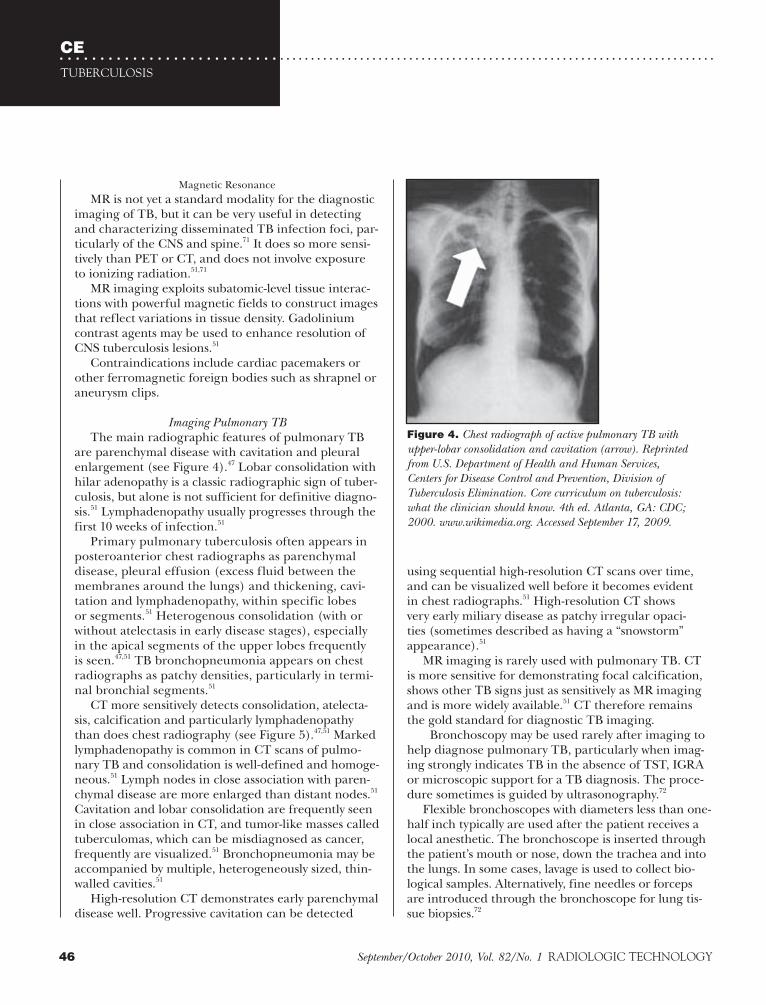
CETUBERCULOSIS
46 September/October 2010, Vol. 82/No. 1 RADIOLOGIC TECHNOLOGY
. . . . . . . . . . . . . . . . . . . . . . . . . . . . . . . . . . . . . . . . . . . . . . . . . . . . . . . . . . . . . . . . . . . . . . . . . . . . . . . . . . . . . . . . . . . . . . . . . .
Magnetic Resonance MR is not yet a standard modality for the diagnostic
imaging of TB, but it can be very useful in detecting and characterizing disseminated TB infection foci, par-ticularly of the CNS and spine.71 It does so more sensi-tively than PET or CT, and does not involve exposure to ionizing radiation.51,71
MR imaging exploits subatomic-level tissue interac-tions with powerful magnetic fields to construct images that reflect variations in tissue density. Gadolinium contrast agents may be used to enhance resolution of CNS tuberculosis lesions.51
Contraindications include cardiac pacemakers or other ferromagnetic foreign bodies such as shrapnel or aneurysm clips.
Imaging Pulmonary TBThe main radiographic features of pulmonary TB
are parenchymal disease with cavitation and pleural enlargement (see Figure 4).47 Lobar consolidation with hilar adenopathy is a classic radiographic sign of tuber-culosis, but alone is not sufficient for definitive diagno-sis.51 Lymphadenopathy usually progresses through the first 10 weeks of infection.51
Primary pulmonary tuberculosis often appears in posteroanterior chest radiographs as parenchymal disease, pleural effusion (excess fluid between the membranes around the lungs) and thickening, cavi-tation and lymphadenopathy, within specific lobes or segments.51 Heterogenous consolidation (with or without atelectasis in early disease stages), especially in the apical segments of the upper lobes frequently is seen.47,51 TB bronchopneumonia appears on chest radiographs as patchy densities, particularly in termi-nal bronchial segments.51
CT more sensitively detects consolidation, atelecta-sis, calcification and particularly lymphadenopathy than does chest radiography (see Figure 5).47,51 Marked lymphadenopathy is common in CT scans of pulmo-nary TB and consolidation is well-defined and homoge-neous.51 Lymph nodes in close association with paren-chymal disease are more enlarged than distant nodes.51 Cavitation and lobar consolidation are frequently seen in close association in CT, and tumor-like masses called tuberculomas, which can be misdiagnosed as cancer, frequently are visualized.51 Bronchopneumonia may be accompanied by multiple, heterogeneously sized, thin-walled cavities.51
High-resolution CT demonstrates early parenchymal disease well. Progressive cavitation can be detected
using sequential high-resolution CT scans over time, and can be visualized well before it becomes evident in chest radiographs.51 High-resolution CT shows very early miliary disease as patchy irregular opaci-ties (sometimes described as having a “snowstorm” appearance).51
MR imaging is rarely used with pulmonary TB. CT is more sensitive for demonstrating focal calcification, shows other TB signs just as sensitively as MR imaging and is more widely available.51 CT therefore remains the gold standard for diagnostic TB imaging.
Bronchoscopy may be used rarely after imaging to help diagnose pulmonary TB, particularly when imag-ing strongly indicates TB in the absence of TST, IGRA or microscopic support for a TB diagnosis. The proce-dure sometimes is guided by ultrasonography.72
Flexible bronchoscopes with diameters less than one-half inch typically are used after the patient receives a local anesthetic. The bronchoscope is inserted through the patient’s mouth or nose, down the trachea and into the lungs. In some cases, lavage is used to collect bio-logical samples. Alternatively, fine needles or forceps are introduced through the bronchoscope for lung tis-sue biopsies.72
Figure 4. Chest radiograph of active pulmonary TB with upper-lobar consolidation and cavitation (arrow). Reprinted from U.S. Department of Health and Human Services, Centers for Disease Control and Prevention, Division of Tuberculosis Elimination. Core curriculum on tuberculosis: what the clinician should know. 4th ed. Atlanta, GA: CDC; 2000. www.wikimedia.org. Accessed September 17, 2009.

CEDIRECTED READING
. . . . . . . . . . . . . . . . . . . . . . . . . . . . . . . . . . . . . . . . . . . . . . . . . . . . . . . . . . . . . . . . . . . . . . . . . . . . . . . . . . . . . . . . . . . . . . . . . .
47RADIOLOGIC TECHNOLOGY September/October 2010, Vol. 82/No. 1
CT of pulmonary XDRTB also was found to be more likely to reveal the presence of pleural thickening than CT of either MDRTB or drug-susceptible pulmonary TB.70 Contrary to the study’s findings with chest radiography, however, MDRTB CT was more likely than drug-susceptible TB CT to reveal the presence of large pulmonary nodules.70
The study’s authors concluded that their most significantly different finding was the visualization of multiple cavities in pulmo-nary MDRTB.70
No signs were unique or exclusive to MDRTB, XDRTB or drug-susceptible TB, however, so the correlations between radio-graphic appearance and drug-susceptibility status are probabilistic. The study included relatively small numbers of patients: 53 MDRTB patients, 15 XDRTB non-AIDS patients and 141 drug-susceptible TB patients, all of whom had received less than a month of anti-TB antibiotic therapy when imaged.70
The results described here are preliminary and in need of confirmation in larger studies.
Imaging Disseminated TB Diagnosis of disseminated TB outside the lungs can
be notoriously difficult, as negative TST test or chest radiography results do not preclude the presence of this disease.75 CT and MR imaging are each more sensi-tive imaging modalities, particularly when used to iden-tify TB in the CNS, spinal canal or abdomen.51
Miliary disease presents as millet-sized micronodules, while disseminated TB often involves larger, tubercu-loma lesions. In disseminated TB, larger and more read-ily detected lesions are seen in immunocompromised patients than others.51 Lymphadenopathy associated with disseminated TB occurs much more frequently in children than adults (95% vs 12% of cases).51
Abdominal TBAbdominal TB commonly involves lymphadenopathy
and in 90% of patients involves gastrointestinal infection, particularly of the ileum and cecum, where the small intestine connects to the large intestine.47,75 Bowel wall thickening, ileum/cecum valve thickening and terminal ileum narrowing are radiographic signs of TB.47,75,76
Hepatic and spleen TB occur in 2 types, miliary or, much more rarely, tuberculoma.75,77 After 12 hours of patient fasting, CT reveals miliary TB as numerous
Pulmonary MDRTB ImagingRecent research suggests that the radiographic
and CT appearances in active pulmonary MDRTB are frequently and significantly different from that of drug-susceptible TB, although differences were not reliably detected between XDRTB and MDRTB using radiography.70,73
In the most recent study, comparing drug-susceptible TB with XDRTB and MDRTB, posteroanterior chest radiographs revealed that both XDRTB and MDRTB were less frequently associated with lung nodule lesions such as ground-glass opacity than drug-susceptible TB.70 Large pulmonary nodules and pleural effusion also were significantly less frequent in MDRTB than drug-susceptible cases of pulmonary TB.70
Transverse CT scans acquired in 2.5-mm sections also revealed differences between drug-susceptible and MDRTB pulmonary infections. CT was significantly more likely to show multiple cavities, bronchial dilatation and tree-in-bud signs in MDRTB than drug-susceptible TB.70 (The “tree-in-bud” sign is a finding that involves small, well-defined peripheral nodules of soft-tissue CT attenuation connected to branch-like opacities resem-bling a tree in spring bud, typically within 3 to 5 mm of the pleural surface.74 This sign correlates with mucus or fluid impaction of the bronchus lumen of the peripheral airways in the lungs.74)
Figure 5. Computed tomography (CT) of pulmonary TB. The arrows indicate TB cavitation in lung tissue. Used with permission from radiologist Kyung Soo Lee, MD, Department of Radiology and Center for Imaging Science, Samsung Medical Center, Sungkyunkwan University School of Medicine, Seoul, South Korea.

CETUBERCULOSIS
48 September/October 2010, Vol. 82/No. 1 RADIOLOGIC TECHNOLOGY
. . . . . . . . . . . . . . . . . . . . . . . . . . . . . . . . . . . . . . . . . . . . . . . . . . . . . . . . . . . . . . . . . . . . . . . . . . . . . . . . . . . . . . . . . . . . . . . . . .
CT and particularly MR imaging offer sensitive visualization of the extent of spinal infection and spi-nal canal involvement.51 MR imaging reveals low to intermediate T1-weighted signal intensity and high T2-weighted signal intensity in vertebral marrow.51 Epidural abscesses generate intermediate and high-signal intensities in both T1- and T2-weighted MR images.51
Nonspinal skeletal and joint TB is detected using CT or MR imaging. Reduced joint space is evident, as are the loss of outer bone cortex and foci of bone frag-mentation with poorly defined margins.51 Foci of low MR signal intensity reveal cortical bone loss, whereas abscess (pus) generates increased T2 image signal intensity.51 Hip and knee joints and hand bones are most often involved, particularly in children, and usu-ally involve only one joint (the right or left knee or hip, for example, rather than both).51,75 Joint TB often pres-ents as arthritis, and may be mistaken for autoimmune rheumatoid arthritis, but rheumatoid arthritis involves early and profound loss of articular spaces.79
On the Horizon: Emerging TB Imaging Technologies
Traditional lab culture approaches to confirming TB cases are slow and cumbersome, requiring up to 8 weeks to complete.27 Rapid DNA-based analyses and advances in portable imaging modalities promise to simplify the process and would hasten diagnosis. If sufficiently inex-pensive, these tools could allow more effective screening in the poor countries that most need it.80
In July 2009, officials at Harvard Medical School’s Center for Molecular Imaging Research and University of California, Berkeley proposed 2 devices that may speed diagnosis and screening.80,81 Both devices are largely untested, speculative and mostly conceptual. But either device, if validated and mass-produced, could revolutionize and hasten TB diagnosis and screening around the world.80,81
According to media reports, the Harvard team developed a prototype hand-held molecular magnetic imaging device for rapid TB bacterial cell detection in sputum samples.80 Reportedly weighing 1 pound, the experimental, low-image-quality MR imaging unit mixes sputum with iron nanoparticles coated with bacterial antibodies; when the antibodies contact specific bacterial cells, they adhere to the cells, “paint-ing” them with the iron nanoparticles. The mixture is loaded into a screen that separates iron-painted bacteria and free-floating nanoparticles; the chamber
low-attenuation foci smaller than 1 cm in diameter.75 Larger (1 to 3 cm diameter) foci in the liver or spleen are tuberculoma.75
Genitourinary TB
Genitourinary tract TB usually includes the kidneys and represents the most common form of disseminated TB.75 Kidney parenchymal cavitation is common. In men, the prostate and seminal vesicles often are infect-ed initially (via the bloodstream), with TB subsequently spreading to the bladder and causing reduced bladder capacity that is readily discernable with x-ray cystogra-phy.75 Transrectal ultrasonography sometimes is used to detect prostate TB as hypoechoic prostate peripheries; contrast-enhanced CT reveals calcification and dead or inflamed prostate tissue as hypoattenuating foci.75
T2-weighted MR imaging of prostate TB abscesses reveals irregular low-attenuation foci.
When indicated by diagnostic imaging, suspected genitourinary TB is confirmed by biopsy and histopa-thology.75
Central Nervous System TBCNS TB presents as meningitis, abscess or tubercu-
loma of the brain or spinal cord, and is confirmed with cerebrospinal fluid culture.75,78 Vertebral involvement does not necessarily imply spinal cord involvement because TB usually spreads to the brain and spinal cord through the bloodstream. TB meningitis indicates involvement of cerebrospinal fluid.75,78
TB meningitis is imaged using CT or T1-weighted MR imaging, which reveals high signal-intensity thick-ening of the meninges or accumulations of cerebrospi-nal fluid and resulting spinal cord compression.75
Musculoskeletal TBSkeletal TB occurs in up to 3% of patients,51 and half
of these cases are spinal TB. TB infection in the spine results in spondylitis or infection-caused vertebral inflam-mation, also known as Pott disease. The infection often presents with low back pain.51,75 Vertebral and interverte-bral disk narrowing (loss of vertebral height75) usually is evident and new bone does not replace bone destroyed at TB lesions; vertebrae collapse as the disease progresses and TB may spread to the adjacent muscle, causing calci-fied abscess.51 Epidural abscesses (pus between the spinal cord and interior vertebral surface) also may occur. Clinical neurologic symptoms are a late manifestation of spinal TB, occurring only after more than half of the spinal canal has been infected.51

CEDIRECTED READING
. . . . . . . . . . . . . . . . . . . . . . . . . . . . . . . . . . . . . . . . . . . . . . . . . . . . . . . . . . . . . . . . . . . . . . . . . . . . . . . . . . . . . . . . . . . . . . . . . .
49RADIOLOGIC TECHNOLOGY September/October 2010, Vol. 82/No. 1
References1. Young DB, Gideon HP, Wilkinson RJ. Eliminating latent
tuberculosis. Trends Microbiol. 2009;17(5):183-188.2. World Health Organization. Global tuberculosis control:
surveillance, planning, financing. www.who.int/tb/publications/global_report/2008/en/index.html. Accessed June 20, 2009.
3. Moodley Y. The interaction of HIV and tuberculosis. Scientific Research and Essays. 2008;3(12):565-566.
4. Maartens G, Wilkinson RJ. Tuberculosis. Lancet. 2007;370(9604):2030-2043.
5. Morris K. Global tuberculosis control amid the world eco-nomic crisis. Lancet Infect Dis. 2009;9(3):144-145.
6. Institute of Medicine Committee on U.S. Commitment to Global Health. The U.S. commitment to global health: recommendations for the public and private sectors. Washington, D.C.: The National Academies Press; 2009.
7. Greenberg RS, Daniels SR, Flanders WD, et al. Medical Epidemiology. 4th ed. New York, NY: McGraw-Hill; 2005.
8. U.S. Department of Health and Human Services, Centers for Disease Control and Prevention. Reported tuberculosis in the United States, 2007. www.cdc.gov/tb/statistics/reports/2007/pdf/fullreport.pdf. Published September 2008. Accessed August 5, 2009.
9. Berlin L. Tuberculosis: resurgent disease, renewed liabil-ity. AJR Am J Roentgenol. 2008;190(6):1438-1444.
10. Hershkovitz I, Donoghue HD, Minnikin DE, et al. Detection and molecular characterization of 9000-year-old Mycobacterium tuberculosis from a Neolithic settlement in the eastern Mediterranean. PLoS One. 2008;3(10):e3426. doi:10.1371/journal.pone.0003426.
11. Roberts CA, Pfister LA, Mays S. Letter to the editor: was tuberculosis present in Homo erectus in Turkey? Am J Phys Anthropol. 2009;139(3):442-444.
12. Ernst JD, Trevejo-Nunez G, Banaiee N. Genomics and the evolution, pathogenesis and diagnosis of tuberculosis. J Clin Invest. 2007:117(7):1738-1745.
13. Callaway E. Oldest cases of human TB found beneath the sea. New Scientist website. www.newscientist.com/article/dn14941-oldest-cases-of-human-tb-found-beneath-the-sea.html. Published October 15, 2008. Accessed September 2, 2009.
14. Al Sharrah YA. The Arab tradition of medical education and its relationship with the European tradition. Prospects. 2003;33(4):413-425.
15. Sledzik P, Bellantoni N. Bioarcheological and biocultural evidence for the New England vampire folk belief. Am J Phys Anthropol. 1994;94(2):269-274.
16. Shaw GB. The Doctor’s Dilemma. Sioux Falls, SD: NuVision Publications; 2008.
17. Singh SP, Nath H. Early radiology of pulmonary tubercu-losis. AJR Am J Roentgenol. 1994;162(4):846.
is surrounded by electromagnetic coils that operate on the same principles as traditional MR, causing the nanoparticles to emit magnetic signals.80 The device is still unproven and has not yet been tested on TB cells; a test run with another bacterial species and antibod-ies reportedly worked well, with the magnitude of magnetic signals from the nanoparticle-painted cells correlating with the number of cells imaged.80 The team’s peer-reviewed technical report and data on the device’s sensitivity and specificity were not available as this Directed Reading went to press.
The Berkeley team’s blood and sputum TB-imaging device, according to a July 2009 media report, is a “cell-scope,” an optical imaging device attached to a cell phone camera.81 Essentially a microscope, lenses magnify the image of microscope slide-mounted sputum or blood samples that have been treated with auramine dye, which coats M. tuberculosis cells.81 A blue wavelength light-emitting diode causes the dye to emit green wavelengths (to fluoresce green light), allowing software in the cell phone to calculate the number of bacterial cells and to send the image as a cell phone picture file to a cli-nician or laboratory for diagnosis.81
Conclusion
TB infection rate declines are slowing in the U.S. and the success of international TB-control plans and funding for those plans now are in doubt.
Radiography remains a mainstay of pulmonary TB screening and diagnosis, and can reveal active pulmo-nary TB before the emergence of clinical symptoms. CT is a more sensitive follow-up modality for diagnos-tic imaging of pulmonary and disseminated TB, and both CT and MR imaging offer superior visualization of abdominal organ involvement. MR is a particularly sensitive modality for CNS and spinal TB imaging.
In the U.S., radiography, CT and MR will repre-sent the majority of medical imaging examinations for TB for the foreseeable future. PET scintigraphy may prove useful for confirming the efficacy of anti-biotic therapies for laboratory-confirmed pulmonary TB, but it is not yet clear that PET is any more effec-tive than high-resolution CT for treatment outcomes monitoring.
In coming years, hand-held magnetic TB imagers and cell-scopes may bring diagnostic imaging for TB to poor countries that today must rely on inexpensive diagnostic tools like sputum microscopy to identify new cases of the leading bacterial killer of humankind.

CETUBERCULOSIS
50 September/October 2010, Vol. 82/No. 1 RADIOLOGIC TECHNOLOGY
. . . . . . . . . . . . . . . . . . . . . . . . . . . . . . . . . . . . . . . . . . . . . . . . . . . . . . . . . . . . . . . . . . . . . . . . . . . . . . . . . . . . . . . . . . . . . . . . . .
1999;354(1384):739-749.35. Laing R, Vrakking H, Fourie B. Quality and stability of
TB medicines: let the buyer beware! Int J Tuberc Lung Dis. 2004;8(9):1043-1044.
36. Dooley SW, Castro KG, Hutton MD, et al. Guidelines for preventing the transmission of tuberculosis in health-care settings, with special focus on HIV-related issues. MMWR Recomm Rep. 1990;39(RR-17):1-29. www.cdc.gov/mmwr/preview/mmwrhtml/00001897.htm. Accessed Sept. 15, 2009.
37. Sotgiu G, Arbore AS, Cojocariu V, et al. High risk of tuber-culosis in health care workers in Romania. Int J Tuberc Lung Dis. 2008;12(6):606-611.
38. Tan LH, Kamarulzaman A. Preventing tuberculo-sis in healthcare workers of the radiology depart-ment: a Malaysian perspective. Biomed Imaging Interv J. 2006;2(1):1-3. doi:10.2349/biij.2.1.e3.
39. Barsegian V, Mathias KD, Wrighton-Smith P, Grosse-Wilde H, Lindemann M. Prevalence of latent tuber-culosis infection in German radiologists. J Hosp Infect. 2008;69(1):69-76.
40. Anderson C, Abubakar I, Maguire H, Sonnenberg P. Survey of tuberculosis incidents in hospital health-care workers, England and Wales, 2005. J Public Health. 2007;29(3):292-297.
41. Jo KW, Woo JH, Hong Y, et al. Incidence of tuberculosis among health care workers at a private university hospital in South Korea. Int J Tuberc Lung Dis. 2008;12(4):436-440.
42. Miller AK, Tepper A, Sieber K. Historical risks of tuber-culin skin test conversion among non-physician staff at a large urban hospital. Am J Ind Med. 2002;42(3):228-235.
43. Laniado-Laborin R, Cabrales-Vargas N. Tuberculosis in healthcare workers at a general hospital in Mexico. Infect Control Hosp Epidemiol. 2006:27(5):449-452.
44. Boudreau AY, Baron SL, Steenland NK, et al. Occupational risk of Mycobacterium tuberculosis infection in hospital workers. Am J Ind Med. 1997;32(5):528-534.
45. Stone CK, Humphries RL. Pulmonary emergencies. In: Stone CK, Humphries RL. Current Diagnosis and Treatment: Emergency Medicine. 6th ed. New York, NY: McGraw-Hill/AccessMedicine Online; 2008. www.accessmedicine.com/resourceTOC.aspx?resourceID=55. Accessed September 15, 2009.
46. Jeong YJ, Lee KS. Pulmonary tuberculosis: up-to-date imaging and management. AJR Am J Roentgenol. 2008;191(3):834-844.
47. De Backer AI, Mortelé KJ, De Keulenaer BL, Henckaerts L, Verhaert L. CT and MR imaging of gastrointestinal tuberculosis. JBR-BTR. 2006;89(4):190-194.
48. Derkornfeld TJ. Anatomy and Physiology for Respiratory Therapy. Sarasota, FL: Glenn Educational Medical Services Inc; 1976.
18. Iseman MD. Tuberculosis therapy past, present and future. Eur Respir J. 2002;20(suppl 36):87-94.
19. Nicas M, Nazaroff WW, Hubbard A. Toward under-standing the risk of secondary airborne infection: emission of respirable pathogens. J Occup Environ Hyg. 2005;2(3):143-154.
20. Kamper-Jorgensen Z, Lillebaek T, Andersen AB. Occupational tuberculosis following extremely short expo-sure. Clin Respir J. 2009;3(1):55-57.
21. Drobniewski F, Balabanova Y, Nikolayevsky V, et al. Drug-resistant tuberculosis, clinical virulance, and the dominance of the Beijing strain family in Russia. JAMA. 2005;293(22):2726-2731.
22. Shalev N. From public to private care: the historical trajec-tory of medical services in a New York City jail. Am J Public Health. 2009;99(6):988-995.
23. Steingart KR, Ng V, Henry M, et al. Sputum processing methods to improve the sensitivity of smear microscopy for tuberculosis: a systematic review. Lancet Infect Dis. 2006;6(10):664-674.
24. Caminero JA. Management of multidrug-resistant tuberculosis and patients in retreatment. Eur Respir J. 2005;25(5):928-936.
25. Stuckler D, Basu S, McKee M, King L. Mass incarceration can explain population increases in TB and multidrug-resistant TB in European and central Asian countries. Proc Natl Acad Sci USA. 2008;105(36):13280-13285.
26. Binkin NJ, Vernon AA, Simone PM, et al. Tuberculosis prevention and control activities in the United States: an overview of the organization of tuberculosis services. Int J Tuberc Lung Dis. 1999;3(8):663-674.
27. Senior K. Russian health-care workers run high risk of latent tuberculosis. Lancet Infect Dis. 2007;7:251.
28. Veen J. Drug resistant tuberculosis: back to sanatoria, sur-gery and cod-liver oil? Eur Respir J. 1995;8:1073-1075.
29. National Institute of Allergy and Infectious Diseases. Tuberculosis. www3.niaid.nih.gov/topics/tuberculosis/. Accessed September 15, 2009.
30. WHO. Counterfeit drugs. www.who.int/entity/medicines/services/counterfeit/RomeDeclaration.pdf. Accessed September 15, 2009.
31. International Medical Products Anti-Counterfeiting Taskforce. IMPACT website. www.who.int/impact/en/index.html. Accessed September 15, 2009.
32. Newton PN, Green MD, Fernandez FM, Day NP, White NJ. Counterfeit anti-infective drugs. Lancet Infect Dis. 2006;6(9):603-613.
33. Wertheimer AI, Santella TM. Counterfeit drugs: defining the problem and finding solutions. Expert Opin Drug Saf. 2005;4(4):619-622.
34. White NJ. Antimalarial drug resistance and combina-tion chemotherapy. Philos Trans R Soc Lond B Biol Sci.
CEDIRECTED READING
. . . . . . . . . . . . . . . . . . . . . . . . . . . . . . . . . . . . . . . . . . . . . . . . . . . . . . . . . . . . . . . . . . . . . . . . . . . . . . . . . . . . . . . . . . . . . . . . . .
51RADIOLOGIC TECHNOLOGY September/October 2010, Vol. 82/No. 1
WHO; 2003. http://whqlibdoc.who.int/HQ/2003/WHO_CDS_TB_2003.313_eng.pdf. Accessed August 5, 2009.
64. Sotgiu G, Ferrara G, Matteelli A, et al. Epidemiology and clinical management of XDR-TB: a systematic review by TBNET. Eur Respir J. 2009;33(4):871-881.
65. Demura Y, Tsuchida T, Uesaka D. Usefulness of F-18-fluorodeoxyglucose positron emission tomography for diagnosing disease activity and monitoring therapeutic response in patients with pulmonary mycobacteriosis. Eur J Nucl Med Mol Imaging. 2009;36(4):632-639.
66. Schuster DM, Alazraki N. Gallium and other agents in dis-eases of the lung. Semin Nucl Med. 2002;32(3):193-211.
67. Park IN, Ryu JS, Shim TS. Evaluation of therapeutic response of tuberculoma using F-18FDG positron emission tomography. Clin Nucl Med. 2008;33(1):1-3.
68. Liu SF, Liu JW, Lin MC, Lee CH, Huang HH, Lai YF. Monitoring treatment responses in patients with pulmo-nary TB using serial lung Gallium-67 scintigraphy. AJR Am J Roentgenol. 2007;188(5):W403-W408.
69. Lee JJ, Chong PY, Lin CB, et al. High resolution chest CT in patients with pulmonary tuberculosis: characteristic findings before and after antituberculous therapy. Eur J Radiol. 2008;67(1):100-104.
70. Cha J, Lee HY, Lee KS, et al. Radiological findings of extensively drug-resistant pulmonary tuberculosis in non-AIDS adults: comparisons with findings of multidrug-resistant and drug-sensitive tuberculosis. Korean J Radiol. 2009;10(3):207-214.
71. Lee IS, Lee JS, Kim SJ, Jun S, Suh KT. Fluorine-18-fluorodeoxyglucose positron emission tomography/com-puted tomography imaging in pyogenic and tuberculosis spondylitis: preliminary study. J Comput Assist Tomogr. 2009;33(4):587-592.
72. National Library of Medicine. Bronchoscopy. www.nlm.nih.gov/medlineplus/ency/article/003857.htm. Accessed August 12, 2009.
73. Chung MJ, Lee KS, Koh WJ, et al. Drug-sensitive tubercu-losis, multidrug-resistant tuberculosis, and nontuberculous mycobacterial pulmonary disease in nonAIDS adults: comparisons of thin-section CT findings. Eur Radiol. 2006;16(9):1934-1941.
74. Eisenhuber E. The tree-in-bud sign. Radiology. 2002;222(3):771-772.
75. Engin G, Acunas B, Acunas G, Tunaci M. Imaging of extrapulmonary tuberculosis. Radiographics. 2000;20(2):471-488.
76. Sinan T, Sheikh M, Ramadan S, et al. CT features of abdominal tuberculosis: 20 years experience. BMC Med Imaging. 2002;2(3):1-7.
77. Yu RS, Zhang SZ, Wu JJ, Li RF. Imaging diagnosis of 12 patients with hepatic tuberculosis. World J Gastroenterol. 2004;10(11):1639-1642.
49. National Library of Medicine. Pulmonary tuberculosis. www.nlm.nih.gov/medlineplus/ency/article/000077.htm. Accessed September 16, 2009.
50. National Library of Medicine. Disseminated tuberculosis. www.nlm.nih.gov/medlineplus/ency/article/000624.htm. Accessed September 16, 2009.
51. Buxi TB, Sud S, Vohra R. CT and MRI in the diagnosis of tuberculosis. Indian J Pediatr. 2002;69(11):965-972.
52. Mazurek GH, Jereb J, LoBue P, et al. Guidelines for using the QuantiFERON-TB gold test for detecting Mycobacterium tuberculosis infection, United States. MMWR Recomm Rep. 2005;54(RR-15):49-55.
53. Skirble R. Economic downturn threatens global fund for AIDS, TB, malaria. Voice of America. www.voanews.com/english/archive/2009-02/2009-02-04-voa23.cfm?CFID=286036918&CFTOKEN=78929346&jsessionid=003036db6cd7a7afa5ff6665711b3c63513b. Published February 4, 2009. Accessed September 19, 2009.
54. Global Plan to Stop TB. Global Plan to Stop TB: 2006-2015 Plan. http://www.stoptb.org/global/plan/main/default.asp. Accessed August 5, 2009.
55. Williams WW. Guideline for infection control in hos-pital personnel. U.S. Centers for Disease Control and Prevention. http://wonder.cdc.gov/wonder/prevguid/p0000446/p0000446.asp. Published July 1, 1983. Accessed August 5, 2009.
56. Ribner BS. Nosocomial infections associated with proce-dures performed in radiology. In: Mayhall CG, ed. Hospital Epidemiology and Infection Control. 2nd ed. Philadelphia, PA: Lippincott Williams & Wilkins; 1999:999-1006.
57. Swendiman KS, Jones NL. Extensively drug-resistant tuberculosis (XDRTB): quarantine and isolation (Report RS22672). Congressional Research Service; 2007:1-6.http://fpc.state.gov/documents/organization/86251.pdf. Accessed August 5, 2009.
58. World Health Organization. BCG: the current vaccine for tuberculosis. www.who.int/vaccine_research/diseases/tb/vaccine_development/bcg/en. Accessed August 5, 2009.
59. Rook GA, Seah G, Ustianowski A. M. tuberculosis: immu-nology and vaccination. Eur Respir J. 2001;17(3):537-557.
60. Chang KC, Leung CC, Yew WW, Tam CM. Standard anti-tuberculosis treatment and hepatotoxicity: do dosing schedules matter? Eur Respir J. 2007;29(2):347-351.
61. Black RE, Lau WK, Weinstein RJ, et al. Ototoxicity of ami-kacin. Antimicrob Agents Chemother. 1976;9(6):956-961.
62. Global Alliance for TB Drug Development. New TB regimens: what countries want; the value proposition of existing and new first-line regimens for drug-susceptible tuberculosis. 2009. www.tballiance.org/downloads/publi cations/TBA_VPSreport_final_flat.pdf. Published August 2009. Accessed August 5, 2009.
63. World Health Organization. Treatment of tuberculosis: guidelines for national programmes. Geneva, Switzerland:

CETUBERCULOSIS
52 September/October 2010, Vol. 82/No. 1 RADIOLOGIC TECHNOLOGY
. . . . . . . . . . . . . . . . . . . . . . . . . . . . . . . . . . . . . . . . . . . . . . . . . . . . . . . . . . . . . . . . . . . . . . . . . . . . . . . . . . . . . . . . . . . . . . . . . .
78. Janse van Rensburg P, Andronikou S, van Toorn R, Pienaar M. Magnetic resonance imaging of miliary tuber-culosis of the central nervous system in children with tuberculosis meningitis. Pediatr Radiol. 2008;38(12):1306-1313.
79. Resnick D. Bone and Joint Imaging. 2nd ed. Philadelphia, PA: Saunders: 1996.
80. Bourzac K. Rapid TB detector: an ultrasensitive test can spot bacteria in half an hour. Technol Rev. http://csb.mgh.harvard.edu/data/information/news/MIT_Technology_Review.pdf. Published August 4, 2009. Accessed September 14, 2009.
81. Corley AM. A cell-phone microscope for disease detection. Technol Rev. www.technologyreview.com/biomedicine/23059/. Published July 23, 2009. Accessed September 14, 2009.
Bryant Furlow, BA, is a medical journalist and a regular contributor to Radiologic Technology and The Lancet Oncology. His reporting for the Rio Grande Sun newspa-per on the impact of hospital budget cuts on rural ambulance response times and the off-label use of psychiatric drugs to sedate jail inmates has been nominated for awards in public service and investigative journalism. Mr Furlow is a member of the Association of Health Care Journalists and Investigative Reporters and Editors. He graduated with honors in biology from the University of New Mexico and studied international relations, including international pharmaceutical patent regimes, at California State University, Sacramento.
Reprint requests may be sent to the American Society of Radiologic Technologists, Communications Department, 15000 Central Ave SE, Albuquerque, NM 87123-3909, or e-mail [email protected].
©2010 by the American Society of Radiologic Technologists.
ErrataThe answer sheet for the Directed Reading
article “Adrenal Gland Disorders” contains a typo-graphical error. The article was published in the main version of the September/October 2009 issue of Radiologic Technology (volume 81, number 1). The correct credit amount for this Directed Reading is 1.5 Category A+ CE credits.
The Directed Reading article “Bleeding Risks in Interventional Radiology,” which appeared in the July/August 2010 issue, contained an error on Page 549. Vitamin K promotes blood clotting. Therefore, high intake of supplements containing vitamin K decreases the effectiveness of warfarin therapy.

53RADIOLOGIC TECHNOLOGY September/October 2010, Vol. 82/No. 1
Directed Reading Continuing Education Quiz
Continued on next page
#10805-01Expiration Date:October 31, 2012*Approved for 2.0Cat. A+ CE credits
Tuberculosis: A Review and Update
To receive Category A+ continuing education credit for this Directed Reading, read the preceding article and circle the correct response to each statement. Choose the answer that is most correct based on the text. Transfer your
responses to the answer sheet on Page 58 and then follow the directions for submitting the answer sheet to the American Society of Radiologic Technologists. You also may take Directed Reading quizzes online at www.asrt.org. Effective October 1, 2002, new and reinstated members are ineligible to take DRs from journals published prior to
their most recent join date unless they have purchased a back issue from ASRT. Your access to Directed Reading
quizzes for Continuing Education credit is detemined by your Area of Interest. For access to other quizzes, go to
www.asrt.org/store.
*Your answer sheet for this Directed Reading must be received in the ASRT office on or before this date.
1. Up to _______ % of TB-infected individuals develop active forms of the disease.a. 5b. 10 c. 15d. 20
2. Each year, _______ million people die of TB and
_______ million new victims are infected.a. 1.3; 5.2b. 1.3; 9.2c. 1.7; 5.2d. 1.7; 9.2
3. Active TB in the U.S. is concentrated in:
1. ethnic minorities.2. California.3. southern states.
a. 1 and 2b. 1 and 3c. 2 and 3d. 1, 2 and 3
4. The Centers for Disease Control and Prevention (CDC) reported _______ new cases of TB in the U.S. in 2006 and _______ in 2007. a. 12 779; 12 299b. 13 779; 13 299 c. 14 779; 14 299d. 15 779; 15 299
5. Most strains of TB affecting humans today are
more similar genetically to _______ than _______ .a. ancient human strains; M. bovis b. ancient human strains; M. simiaec. M. bovis; ancient human TBd. M. simiae; ancient human TB
6. Risks for TB infection include:
1. diabetes.2. HIV.3. imprisonment.
a. 1 and 2b. 1 and 3c. 2 and 3d. 1, 2 and 3

Directed Reading Continuing Education Quiz
54 September/October 2010, Vol. 82/No. 1 RADIOLOGIC TECHNOLOGY
Continued on next page
12. Routine prescription of _______ antibiotics for pneumonia in Canada has been tied to the evolution of drug-resistant TB strains.a. pyrazinamideb. rifampin c. fl uoroquinoloned. amikacin
13. Studies that compared TB infection rates
for specifi c categories of health care workers consistently identifi ed _______ as facing the highest risk of infection.a. medical technologistsb. radiologic technologistsc. clerksd. nurses
14. Each year, between _______ % and _______ % of
latent TB cases become postprimary (or active) infections.a. 1; 2b. 3; 5 c. 10; 12d. 15; 20
15. _______ is the condition caused by chronic infl ammation when fl uid-fi lled alveoli become swollen and fi rm.a. Lymphadenopathyb. Consolidationc. Atelectasisd. Cavitation
16. According to the Directed Reading, clinical
symptoms of disseminated TB include:1. petechiae.2. joint pain.3. enlarged liver.
a. 1 and 2 b. 1 and 3c. 2 and 3d. 1, 2 and 3
7. Within the U.S. and Canada, TB infection incidence rates range up to _______ cases per 100 000 population per year; in the U.S., the nationwide prevalence of TB is _______ per 100 000.a. 44; 20b. 34; 15c. 24; 10 d. 14; 5
8. Which group has the highest TB incidence rate, at
26.3 cases per 100 000 population?a. Native Hawaiiansb. Hispanicsc. Asian Americansd. African Americans
9. In 2007, _______ % of U.S. TB patients were
individuals born overseas.a. 58b. 48c. 38d. 28
10. Declines in U.S. TB infection rates have decreased
from an average annual decline of _______ % per year between 1993 and 2000 to _______ % per year between 2000 and 2007.a. 6.3; 4.8b. 7.3; 3.8c. 8.3; 2.8d. 9.3; 1.8
11. An average of _______ % of TB patients in the U.S.
are HIV positive.a. 11b. 12c. 13d. 14

55RADIOLOGIC TECHNOLOGY September/October 2010, Vol. 82/No. 1
Directed Reading Continuing Education Quiz
22. How many U.S. airline passengers were told by the CDC that they may have been exposed to drug-resistant TB during fl ights between the U.S., Europe and Canada by an American traveler who had been informed that he had drug-resistant pulmonary TB?a. 45b. 145c. 245d. 345
23. First-line essentials in TB treatment include:a. rifabutin.b. rifapentine.c. levofl oxacin.d. rifampin.
24. Only 4% of U.S. patients were treated with
_______ regimens in 1990, but that proportion had reached 70% by 2000 and 86% by 2005.a. QuantiFERONb. BCGc. directly observed therapy (DOT)d. IGRA
25. _______ sometimes is used to differentiate
pulmonary TB granulomas from cancerous lung tumors.a. Positron emission tomography (PET)b. Magnetic resonance (MR) imagingc. CTd. Radiography
26. Lobar consolidation with hilar adenopathy is a
classic _______ sign of tuberculosis, but alone is not a suffi cient basis for defi nitive diagnosis.a. PETb. MR c. CTd. radiographic
17. When possible, defi nitive diagnosis of TB is based on _______ .a. chest radiographyb. a sputum culturec. computed tomography (CT)d. a tuberculin skin test (TST)
18. _______ uses proteins similar to M. tuberculosis
proteins to screen for TB.a. Interferon gamma release assay (IGRA)b. Bacille Calmette Guerin (BCG)c. Sputum microscopyd. none of the above
19. A 2008 World Bank study concluded that the economic returns to the global economy for fully implementing the Global Plan To Stop TB would exceed _______ %.a. 15b. 150c. 1500d. 15 000
20. A South African study found that simply
implementing standard infection-control strategies could prevent half of nosocomial extensively drug-resistant TB cases and _______ % of cases among hospital workers.a. 45b. 55c. 65d. 75
21. Before 2007, the last U.S. federal isolation order
was issued by the CDC in what year?a. 1953b. 1963c. 1973d. 1983
Continued on next page

Directed Reading Continuing Education Quiz
56 September/October 2010, Vol. 82/No. 1 RADIOLOGIC TECHNOLOGY
27. _______ demonstrates early parenchymal disease well.a. PETb. MRc. CTd. Radiography
28. CT was signifi cantly more likely to show multiple
cavities, bronchial dilatation and tree-in-bud signs in _______ TB.a. multidrug resistant (MDR)b. primaryc. disseminatedd. drug-susceptible
29. _______ associated with disseminated TB occurs
much more frequently in children than adults (95% vs 12% of cases).a. Lymphadenopathyb. Tuberculomac. Pleural thickeningd. Multiple cavitation
30. Abdominal TB commonly involves
lymphadenopathy and, in 90% of patients, involves _______ infection. a. renalb. gastrointestinalc. genitourinaryd. hepatic
For your convenience, the evaluation and answer sheet for this Directed Reading now immediately follow the quiz. Just turn to Pages 57 and 58.

✁
Carefully cut or tear here.
CE
DIRECTED READING. . . . . . . . . . . . . . . . . . . . . . . . . . . . . . . . . . . . . . . . . . . . . . . . . . . . . . . . . . . . . . . . . . . . . . . . . . . . . . . . . . . . . . . . . . . . . . . . . .
59MRADIOLOGIC TECHNOLOGY September/October 2010, Vol. 82/No. 1
After completing this article, readers should be able to:■ Explain the importance of the radiologic technologist’s role in percutaneous stereotactic breast biopsy.■ List breast biopsy techniques and indications.■ Review imaging modalities used to guide percutaneous breast biopsy.■ Describe types of stereotactic equipment and how each calculates coordinate positions.■ Specify correct needle position on prefire and postfire images.■ Explain positioning options for upright and prone stereotactic tables.■ Relate the importance of needle measurement to the targeting outcome.■ Explain stroke margin and how it affects targeting.■ Discuss the principles of polar and Cartesian coordinate calculations.
Knowing how to success-fully target small lesions or microcalcifications is crucial to breast biopsy success. This article focuses on stereotactic breast biopsy, types of imaging systems and biopsy devices and how stereotactic imaging targets lesions and adjusts to ensure successful sampling.It also describes stereotactic coordinate systems, position-ing for patient comfort and ways to successfully locate the correct lesion or micro-calcifications. A successful biopsy outcome is represented by biopsy of the suspicious area concordant with imag-ing and pathology results. It takes the entire team to achieve this goal.
This article does not replace official recommendations and practice guidelines for breast lesion targeting. This article is a Directed Reading. Your access to Directed Reading quizzes for continuing education credit is determined by your area of interest. For access to other quizzes, go to www.asrt.org/store.
PAT BALDWIN, AA, R.T.(R)(M)
Breast Biopsy Targeting Techniques
Breast cancer is a devastat-ing diagnosis, and the path to a diagnosis can be arduous for the patient. Several imaging modali-
ties and biopsy procedures can be used to reach a final diagnosis. Some patients adamantly request that a breast lesion be completely removed, regardless of suspicion for malignancy. These patients are candidates for needle localization and excision by a surgeon. However, sur-gical biopsy requires general anesthesia, which can add unnecessary risk, recov-ery time and expense, as well as surgical scarring. Patients who decide to forgo a possibly unnecessary surgical procedure are candidates for percutaneous breast biopsy. The patient’s body habitus and mobility, lesion position within the breast, ability to visualize the lesion and the lesion size and type are factors in determining which imaging modality ultimately is used to guide the biopsy.
When the lesion is easily palpated, large enough and easily accessible, a biopsy can be performed without imag-ing assistance. This type of biopsy usu-ally is done in a physician’s office under local anesthesia and requires the skill of a physician to palpate and biopsy the lesion. Other lesions are better located using ultrasonography and some are seen only with magnetic resonance (MR) imaging. Recent advances in tar-geting devices and MR-safe materials from manufacturers allow biopsies to take place in the MR suite. Lesions that are best seen using mammography can be biopsied with stereotactic mammog-raphy guidance.
Overview of Breast BiopsyOn average, 100 of 1000 women
screened with mammography are recalled for follow-up, and only 20 of those women eventually receive a biop-sy.1 Ultimately, the purpose of having

CEBREAST BIOPSY TARGETING
60M September/October 2010, Vol. 82/No. 1 RADIOLOGIC TECHNOLOGY
. . . . . . . . . . . . . . . . . . . . . . . . . . . . . . . . . . . . . . . . . . . . . . . . . . . . . . . . . . . . . . . . . . . . . . . . . . . . . . . . . . . . . . . . . . . . . . . . . .
Percutaneous biopsy should not be substituted for early mammographic follow-up. However, patients with BI-RADS category 3 lesions may have a biopsy because of anxiety regarding the follow-up period and diagno-sis or because they cannot meet follow-up recommen-dations because of long-term travel or other reasons.4
Lesions that may require surgical excision follow-ing core biopsy include carcinoma, possible phyllodes tumor, indeterminate papillary lesion, atypical ductal and lobular hyperplasia, as well as radial scar or lesions for which an insufficient sample was obtained.4 Lesions that pose difficult decisions following needle biopsy are columnar cell lesions, lobular neoplasia, fibroepi-thelial lesions and mucocele-like lesions.6 Physicians must decide whether to surgically remove these lesions or simply follow them with surveillance. It is better to surgically biopsy radial scars and remove the lesions. Radial scars are difficult to diagnose by core biopsy because the pathologist relies on the lesions’ distinctive architecture along with their cellular features. Radial scars also may be associated with areas of atypical hyperplasia and ductal carcinoma in situ (DCIS).4
a breast biopsy is to determine whether the breast finding is positive or negative for cancer. However, gra-dations of the diagno-sis also are important. For example, atypical ductal hyperplasia (ADH) is a benign condition that increas-es breast cancer risk and warrants close observation or remov-al. An estimated 80% of breast biopsies are diagnosed as benign (see Figure 1).2 Percutaneous biopsy can help confirm a benign diagnosis for lesions that are likely to be benign accord-ing to clinical and mammography indi-cations. Benefits of a needle biopsy com-pared with an open surgical biopsy include minimal scarring, reduced post-procedure pain, lower cost and shorter recovery time.3,4
Percutaneous Biopsy IndicationsAn important role of needle biopsy, often referred
to as percutaneous biopsy, is to provide a minimally invasive and less costly method of diagnosis compared with open (ie, surgical) biopsy. An open biopsy requires anesthesia and tissue removal. However, lesions that are reported as category 4 (suspicious abnormality) accord-ing to the American College of Radiology (ACR) Breast Imaging Reporting and Data System (BI-RADS), are biopsied percutaneously to determine a benign diag-nosis without surgery. For BI-RADS category 5 findings (high likelihood of malignancy), a percutaneous biopsy can confirm a cancer finding, thus avoiding a 2-step surgical procedure (open biopsy followed by a lumpec-tomy or mastectomy).4 The biopsy findings assist with histologic grading and tumor characteristic analysis to aid in surgical planning. BI-RADS category 3 lesions (< 2% chance of malignancy) generally are managed with early mammographic follow-up (see Table 1).
Figure 1. Flowchart showing the low percentage of patients’ mammogram results that result in biopsy and malignancy as an outcome. Modified with permission from Imaginis Corporation, Greenville, SC.
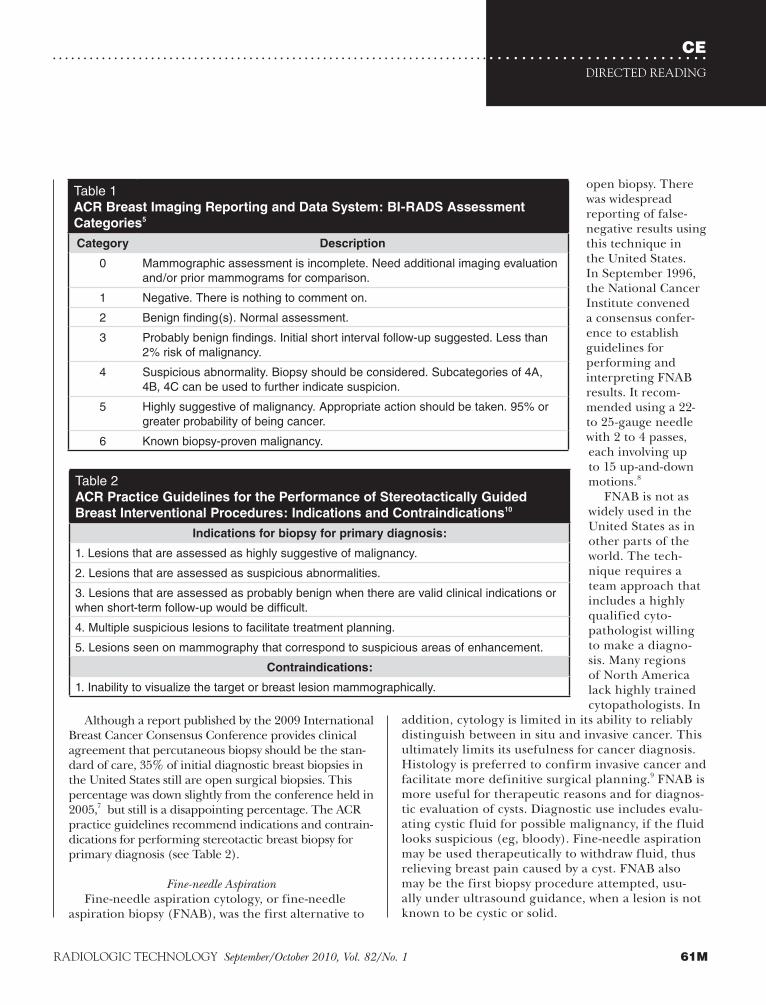
CEDIRECTED READING
. . . . . . . . . . . . . . . . . . . . . . . . . . . . . . . . . . . . . . . . . . . . . . . . . . . . . . . . . . . . . . . . . . . . . . . . . . . . . . . . . . . . . . . . . . . . . . . . . .
61MRADIOLOGIC TECHNOLOGY September/October 2010, Vol. 82/No. 1
open biopsy. There was widespread reporting of false-negative results using this technique in the United States. In September 1996, the National Cancer Institute convened a consensus confer-ence to establish guidelines for performing and interpreting FNAB results. It recom-mended using a 22- to 25-gauge needle with 2 to 4 passes, each involving up to 15 up-and-down motions.8
FNAB is not as widely used in the United States as in other parts of the world. The tech-nique requires a team approach that includes a highly qualified cyto-pathologist willing to make a diagno-sis. Many regions of North America lack highly trained cytopathologists. In
addition, cytology is limited in its ability to reliably distinguish between in situ and invasive cancer. This ultimately limits its usefulness for cancer diagnosis. Histology is preferred to confirm invasive cancer and facilitate more definitive surgical planning.9 FNAB is more useful for therapeutic reasons and for diagnos-tic evaluation of cysts. Diagnostic use includes evalu-ating cystic fluid for possible malignancy, if the fluid looks suspicious (eg, bloody). Fine-needle aspiration may be used therapeutically to withdraw fluid, thus relieving breast pain caused by a cyst. FNAB also may be the first biopsy procedure attempted, usu-ally under ultrasound guidance, when a lesion is not known to be cystic or solid.
Although a report published by the 2009 International Breast Cancer Consensus Conference provides clinical agreement that percutaneous biopsy should be the stan-dard of care, 35% of initial diagnostic breast biopsies in the United States still are open surgical biopsies. This percentage was down slightly from the conference held in 2005,7 but still is a disappointing percentage. The ACR practice guidelines recommend indications and contrain-dications for performing stereotactic breast biopsy for primary diagnosis (see Table 2).
Fine-needle AspirationFine-needle aspiration cytology, or fine-needle
aspiration biopsy (FNAB), was the first alternative to
Table 1ACR Breast Imaging Reporting and Data System: BI-RADS Assessment
Categories5
Category Description
0 Mammographic assessment is incomplete. Need additional imaging evaluation and/or prior mammograms for comparison.
1 Negative. There is nothing to comment on.
2 Benign finding(s). Normal assessment.
3 Probably benign findings. Initial short interval follow-up suggested. Less than 2% risk of malignancy.
4 Suspicious abnormality. Biopsy should be considered. Subcategories of 4A, 4B, 4C can be used to further indicate suspicion.
5 Highly suggestive of malignancy. Appropriate action should be taken. 95% or greater probability of being cancer.
6 Known biopsy-proven malignancy.
Table 2ACR Practice Guidelines for the Performance of Stereotactically Guided
Breast Interventional Procedures: Indications and Contraindications10
Indications for biopsy for primary diagnosis:
1. Lesions that are assessed as highly suggestive of malignancy.
2. Lesions that are assessed as suspicious abnormalities.
3. Lesions that are assessed as probably benign when there are valid clinical indications or when short-term follow-up would be difficult.
4. Multiple suspicious lesions to facilitate treatment planning.
5. Lesions seen on mammography that correspond to suspicious areas of enhancement.
Contraindications:
1. Inability to visualize the target or breast lesion mammographically.

CEBREAST BIOPSY TARGETING
62M September/October 2010, Vol. 82/No. 1 RADIOLOGIC TECHNOLOGY
. . . . . . . . . . . . . . . . . . . . . . . . . . . . . . . . . . . . . . . . . . . . . . . . . . . . . . . . . . . . . . . . . . . . . . . . . . . . . . . . . . . . . . . . . . . . . . . . . .
Accurate DiagnosisTo achieve an accurate breast biopsy diagnosis, cor-
rect and adequate tissue must be obtained. In addition, the biopsy tissue must be fixed properly and transport-ed safely in a timely manner to the pathologist. These are responsibilities of the radiology team. Staff from the pathology and radiology departments must work together to achieve the goal of a correct diagnosis. The pathologist has specific requirements for the type of delivery, delivery vessel, fixation and paperwork. The radiologist has requirements for patient positioning, imaging projections, equipment, tray setup, preproce-dure and postprocedure patient instructions, specimen positioning and specimen transport vessel. It is impor-tant that those assisting with breast biopsies never lose sight of the purpose of the biopsy. If a specimen is improperly fixed and does not render a diagnosis, the patient has gone through the procedure in vain. Procedural steps should be documented and available for easy reference.
When the radiology report’s assessment (and expected resulting histology) differs markedly from the actual histology diagnosis, it is called discordant diagnosis. For example, if the radiologist determines the lesion visualized on the mammogram is a BI-RADS category 5 but the pathology finding from the biopsy is benign fibrocystic changes, this should raise concern that the biopsy missed the lesion. An additional follow-up biopsy should be considered. According to the ACR guidelines for stereotactically guided breast biopsies, repeat stereotactically guided percutaneous sampling is an alternative to surgical biopsy when the initial core biopsy results are nondiagnostic or are discordant with the imaging findings.10
Originally, breast biopsy only could be performed through open surgical incision and open surgical biopsy only could be accomplished with palpable lesions. Increased use of mammography and its suc-cess at detecting lesions that are palpably undetectable led to mapping of nonpalpable lesions from the mam-mographic image that then were surgically removed and the margins verified following removal by use of a specimen radiograph.
To further limit the amount of breast tissue required for excision, radiologists began using mammography to guide them in placing radiopaque markers directly over the lesion. Injection of dye into the lesion and nee-dle track further helped surgical guidance. That tech-nique led to leaving the needle in place until biopsy and eventually to the development of hook-wire systems
for needle localization. It has been suggested that this technique was accompanied by a lesion removal failure rate of < 2%.8
Stereotactic Guidance PrinciplesThe principles of stereotaxis work much the same
way that eyes work together to achieve depth percep-tion. Stereotactic biopsy is performed with special dedicated stereotactic mammography equipment or specially adapted mammography equipment that can acquire tube-angled images in 2 opposite directions to achieve a 3-D calculation. The opposing angles vary by manufacturer, but most equipment uses angulations of -15º and +15º per stereotactic pair of images. Because mammography produces 2-D images, these angulations are used to calculate the 3-D position of an object. Today’s equipment can acquire images using analog or digital technology. Digital acquisition speeds up the procedure because it eliminates film processing time. Visualization of the breast in stereotaxis is not full field but rather a small field of view in the range of 5 x 5 cm. Field size varies among manufacturers.
In 1977, an article was published describing the use of a stereotactic instrument for percutaneous needle biopsy of the breast in Sweden. The imaging device described by the authors was an early model of what currently is known as a prone table.11 Stereotactic needle placement accuracy depends on the 2 differ-ent angles used to calculate the appropriate depth.8 The stereotactic 3-D coordinate system usually is used to locate a group of microcalcifications or small non-palpable mass that is not easily visualized using ultra-sound imaging.
Ultrasound imaging often is preferred to stereo-tactic guidance because ultrasound is more comfort-able for the patient, involves no ionizing radiation, is real-time imaging and usually is faster. However, small masses, architectural distortion and microcalcifica-tions may not be demonstrated as well using ultra-sound, and stereotactic guidance may be preferred in these instances.
Stereotactic biopsy can be performed using either a prone table or an upright system that is added to an existing mammography unit. Each system has its pros and cons. There are patient weight limits for prone tables and these tables require the patient to lie prone with her head turned to the side, which occasionally can cause neck, rib and back discomfort. Prone tables are expensive and require a dedicated space for a procedure that usually is not scheduled

CEDIRECTED READING
. . . . . . . . . . . . . . . . . . . . . . . . . . . . . . . . . . . . . . . . . . . . . . . . . . . . . . . . . . . . . . . . . . . . . . . . . . . . . . . . . . . . . . . . . . . . . . . . . .
63MRADIOLOGIC TECHNOLOGY September/October 2010, Vol. 82/No. 1
units. Patients do not have to be biopsied in the sitting posi-tion, however. Decubitus and recumbent positioning have proven to be comfortable for patients. Upright units have a shorter x-ray source-to-image distance (SID), which makes it more difficult to attach and remove the longer vacuum-assisted biopsy devices (see Figure 4). For one manufac-turer’s unit, removal of the vacuum-assisted devices only is possible with the addition of a lateral arm attachment. ACR practice guidelines help physicians assess patients for appropriate use of stereotactic guided biopsy (see Table 3).
Biopsy DevicesA number of needle and probe devices are avail-
able that can be used along with stereotactic guidance to acquire the breast specimen. Core-needle biopsy (CNB) was introduced in Sweden in 1982 and the tech-nique used an automated large-core gun. It was adapt-ed for use with a prone stereotactic table in the United States by Parker in 1990. CNB also can be used with ultrasound guidance; these advantages led to a new era of breast biopsy in the United States.8
Large-core NeedlesToday, when practitioners perform most large-core
needle biopsies (LCNB), they use a 14-gauge needle with a spring-loaded firing device, sometimes referred to as a gun, to obtain specimens. As with many biopsy needle devices, the LCNB may be used with stereotactic or ultrasound guidance, as well as in the MR suite if the device is MR compatible. This article discusses stereotactic application.
Some LCNB devices have more than one sampling notch length. This is important to know when using these devices. The surgeon or radiologist performing the biopsy should inform the radiologic technologist of the sampling notch size the physician will be using because it affects whether the sampling notch ends up in the correct area of the lesion. If a shorter sampling notch is used and the technologist sets the machine for the longer sampling notch measurement, then the sampling notch may fall short of the target lesion. The
continuously throughout every exam day (see Figure 2). The positive side of these units is that the patient cannot see the procedure and therefore is unlikely to have a vasovagal reaction.
Because upright stereotactic units are added to existing mam-mography equipment (see Figure 3), they are less expensive than prone tables and the mam-mography unit can be used for screening and diagnostic mammograms when not used for stereotactic procedures. There have been reports of patients hav-ing vasovagal reactions while in the upright sitting posi-tion on these
Figure 2. Prone breast biopsy table. Image courtesy of Siemens Healthcare, Malvern, PA.
Figure 3. Upright stereotactic add-on system. Image courtesy of Hologic Inc, Bedford, MA.

CEBREAST BIOPSY TARGETING
64M September/October 2010, Vol. 82/No. 1 RADIOLOGIC TECHNOLOGY
. . . . . . . . . . . . . . . . . . . . . . . . . . . . . . . . . . . . . . . . . . . . . . . . . . . . . . . . . . . . . . . . . . . . . . . . . . . . . . . . . . . . . . . . . . . . . . . . . .
longest sampling notch usually should be used because it acquires a longer section of breast specimen, which ulti-mately is more desirable. However, when a patient’s com-pressed breast tissue is minimal, the shorter sampling notch may be of benefit to accomplish the biopsy.
Vacuum-assisted DevicesThere are several manufacturers of vacuum devices.
The vacuum-assisted device originally was designed to be used with stereotactic guidance8 but most current manufacturers have modified versions for use under ultrasound and MR guidance; they also can deploy biopsy site markers. Vacuum-assisted devices retrieve substantially larger specimens than nonvacuum-assisted devices. The needle probe usually contains a cutting device to separate the breast tissue specimen. Once cut, vacuum pressure is applied to send the specimen to a collecting chamber or container. The vacuum also may be applied to the cutting notch area to help pull tissue into the sampling notch before cutting. These devices usually are large probes of size 7, 9, 10, 11, 12 or 14 gauge, depending on the manufacturer.
All of the vacuum-assisted devices, with the excep-tion of the 14-gauge probes, are large enough to deploy a marker using the probe channel for guidance. The marker is useful for future mammographic reference. Some of the automated vacuum devices require that the specimen be retrieved after each cut, and others collect the specimens within a container for retrieval when the procedure is complete. There are advantages and disadvantages to both systems. Retrieving each specimen and placing it in a specific order within the selected specimen transportation product allows the clinician to visualize each specimen and easily identify each specimen on radiologic imaging. On the other hand, having the specimens collected automatically via vacuum assistance into a collection container may make the procedure go more quickly because each specimen does not have to be retrieved individually. Each specimen may not be seen as easily because the specimens are grouped together and may need to be separated before imaging for calcification verification.
All of these vacuum devices have large stations to support mechanics and electronics for vacuum
Figure 4. A. Vacuum-assisted biopsy device attached to an upright add-on stereotactic unit. B. Vacuum-assisted biopsy device attached to a prone table stereotactic unit. Images courtesy of Hologic Inc, Bedford, MA.
A
B
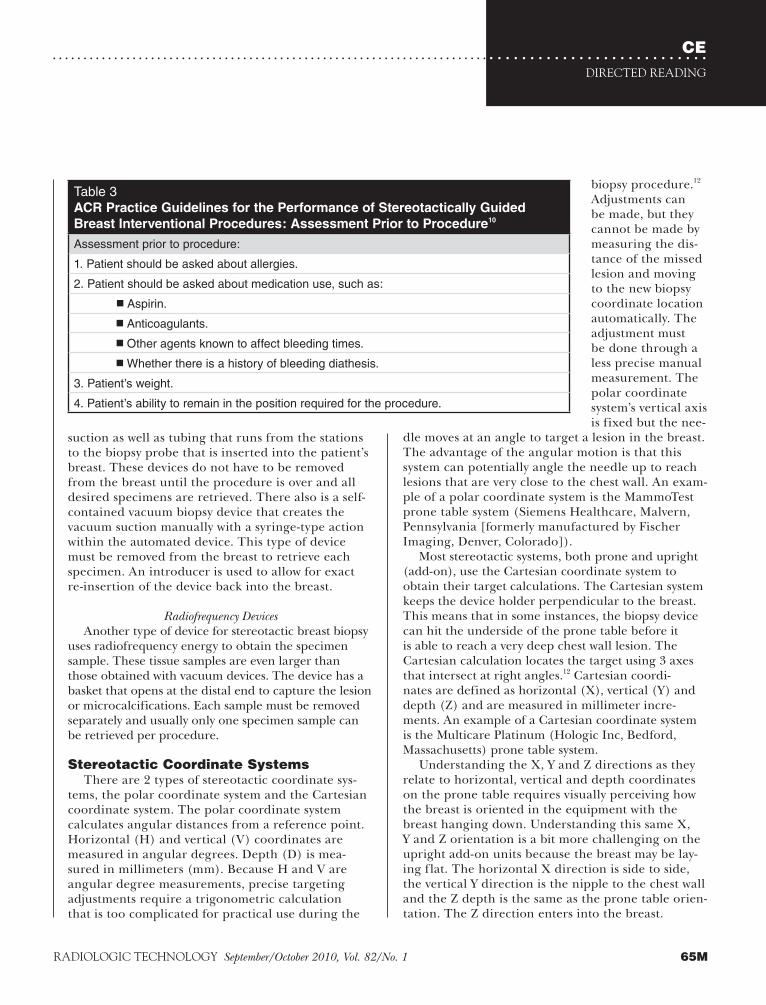
CEDIRECTED READING
. . . . . . . . . . . . . . . . . . . . . . . . . . . . . . . . . . . . . . . . . . . . . . . . . . . . . . . . . . . . . . . . . . . . . . . . . . . . . . . . . . . . . . . . . . . . . . . . . .
65MRADIOLOGIC TECHNOLOGY September/October 2010, Vol. 82/No. 1
suction as well as tubing that runs from the stations to the biopsy probe that is inserted into the patient’s breast. These devices do not have to be removed from the breast until the procedure is over and all desired specimens are retrieved. There also is a self-contained vacuum biopsy device that creates the vacuum suction manually with a syringe-type action within the automated device. This type of device must be removed from the breast to retrieve each specimen. An introducer is used to allow for exact re-insertion of the device back into the breast.
Radiofrequency DevicesAnother type of device for stereotactic breast biopsy
uses radiofrequency energy to obtain the specimen sample. These tissue samples are even larger than those obtained with vacuum devices. The device has a basket that opens at the distal end to capture the lesion or microcalcifications. Each sample must be removed separately and usually only one specimen sample can be retrieved per procedure.
Stereotactic Coordinate SystemsThere are 2 types of stereotactic coordinate sys-
tems, the polar coordinate system and the Cartesian coordinate system. The polar coordinate system calculates angular distances from a reference point. Horizontal (H) and vertical (V) coordinates are measured in angular degrees. Depth (D) is mea-sured in millimeters (mm). Because H and V are angular degree measurements, precise targeting adjustments require a trigonometric calculation that is too complicated for practical use during the
biopsy procedure.12 Adjustments can be made, but they cannot be made by measuring the dis-tance of the missed lesion and moving to the new biopsy coordinate location automatically. The adjustment must be done through a less precise manual measurement. The polar coordinate system’s vertical axis is fixed but the nee-
dle moves at an angle to target a lesion in the breast. The advantage of the angular motion is that this system can potentially angle the needle up to reach lesions that are very close to the chest wall. An exam-ple of a polar coordinate system is the MammoTest prone table system (Siemens Healthcare, Malvern, Pennsylvania [formerly manufactured by Fischer Imaging, Denver, Colorado]).
Most stereotactic systems, both prone and upright (add-on), use the Cartesian coordinate system to obtain their target calculations. The Cartesian system keeps the device holder perpendicular to the breast. This means that in some instances, the biopsy device can hit the underside of the prone table before it is able to reach a very deep chest wall lesion. The Cartesian calculation locates the target using 3 axes that intersect at right angles.12 Cartesian coordi-nates are defined as horizontal (X), vertical (Y) and depth (Z) and are measured in millimeter incre-ments. An example of a Cartesian coordinate system is the Multicare Platinum (Hologic Inc, Bedford, Massachusetts) prone table system.
Understanding the X, Y and Z directions as they relate to horizontal, vertical and depth coordinates on the prone table requires visually perceiving how the breast is oriented in the equipment with the breast hanging down. Understanding this same X, Y and Z orientation is a bit more challenging on the upright add-on units because the breast may be lay-ing flat. The horizontal X direction is side to side, the vertical Y direction is the nipple to the chest wall and the Z depth is the same as the prone table orien-tation. The Z direction enters into the breast.
Table 3ACR Practice Guidelines for the Performance of Stereotactically Guided
Breast Interventional Procedures: Assessment Prior to Procedure10
Assessment prior to procedure:
1. Patient should be asked about allergies.
2. Patient should be asked about medication use, such as:
■ Aspirin.
■ Anticoagulants.
■ Other agents known to affect bleeding times.
■ Whether there is a history of bleeding diathesis.
3. Patient’s weight.
4. Patient’s ability to remain in the position required for the procedure.

CEBREAST BIOPSY TARGETING
66M September/October 2010, Vol. 82/No. 1 RADIOLOGIC TECHNOLOGY
. . . . . . . . . . . . . . . . . . . . . . . . . . . . . . . . . . . . . . . . . . . . . . . . . . . . . . . . . . . . . . . . . . . . . . . . . . . . . . . . . . . . . . . . . . . . . . . . . .
paddle and the patient’s skin, which can cause some breast slippage. Imaging and preparation techniques depend on the physician’s protocol. It is recommended that both the technologist and physician verify target coordinate transfer at both the computer and biopsy station. The physician should manually insert the cocked biopsy device to the appropriate depth coordi-nate (D or Z). The prefire location usually is reached by using a dialing operation set for the specified depth.
The radiologic technologist acquires stereotactic prefire images and the physician evaluates them. The tip of the biopsy needle should appear at the lesion or microcalcifications on the prefire images and should look like a mirror image from the right image to the left image. If this is not the case, appropriate adjust-ments of horizontal (H or X), vertical (V or Y), or depth (D or Z) should be made or targeting should be redone and followed by another pair of prefire stereo-tactic images to verify target accuracy.
The device may be fired when no coordinate adjust-ments are indicated by the prefire images. Postfire stereotactic images are taken to verify lesion position in relation to the needle or probe sampling notch and that the lesion has not been moved by the needle. For most vacuum-assisted breast biopsy (VABB) procedures, postfire images should reveal that the sampling notch
Imaging ProceduresThe stereotactic imag-
ing procedure consists of an initial 0º scout image to locate the lesion or micro-calcifications and to deter-mine whether obvious blood vessels lie near the target (see Figure 5). The specific approach or projection to be used usually is discussed before the patient’s arrival and during the review of her previous images. The patient may be taken directly to the stereotactic suite for the procedure or first taken to a mammography suite to locate the lesion or micro-calcifications in full-field imaging of the selected view. The radiologic technologist places a marker, such as a “BB,” over the area to help locate the target during the small field-of-view stereo-tactic imaging. This initial step can save imaging mul-tiple times with a stereotactic unit to find the lesion or microcalcifications. The full-field view helps provide landmarks to initially locate very tiny and discrete lesions or calcifications. After the 0º scout has located the lesion or microcalcifications and they are within the center third of the window, a pair of stereotactic images is obtained. When the lesion or microcalcifica-tions are located within each stereotactic pair, target-ing may begin.
After targeting and preparation and attachment of the sterile needle and guide, the correct coordinates must be transferred to the biopsy device holder. The needle or probe is moved automatically or manually to these coordinates. Systems may need to be zeroed out at their paddle or other reference point position before transmitting target coordinates. The depth coordi-nate is the last coordinate to which the needle moves. Before advancing to the depth coordinate, the biopsy device is moved closer to the patient’s skin so that clini-cians can prepare the patient’s skin with disinfectant and anesthetic and the incision can be made precisely according to the coordinate calculations.
Caution should be used to prevent the fluid being used to disinfect the skin from seeping between the
Figure 5. Stereotactic scout image showing a blood vessel (arrows) close to the lesion. If a blood vessel appears directly in the area of the lesion, altering positioning slightly or rolling the breast slightly will move it farther from the lesion. Blood vessels should be observed on the perpendicular 0º scout, not on stereotactic pair images. Image courtesy of Siemens Healthcare, Malvern, PA.
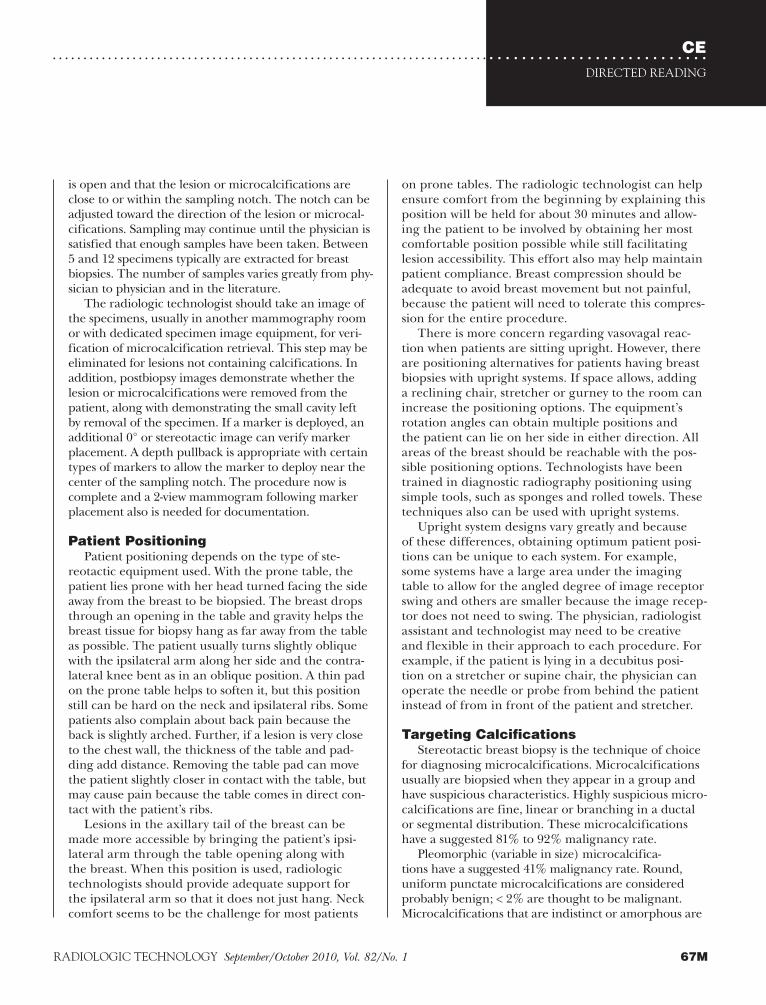
CEDIRECTED READING
. . . . . . . . . . . . . . . . . . . . . . . . . . . . . . . . . . . . . . . . . . . . . . . . . . . . . . . . . . . . . . . . . . . . . . . . . . . . . . . . . . . . . . . . . . . . . . . . . .
67MRADIOLOGIC TECHNOLOGY September/October 2010, Vol. 82/No. 1
on prone tables. The radiologic technologist can help ensure comfort from the beginning by explaining this position will be held for about 30 minutes and allow-ing the patient to be involved by obtaining her most comfortable position possible while still facilitating lesion accessibility. This effort also may help maintain patient compliance. Breast compression should be adequate to avoid breast movement but not painful, because the patient will need to tolerate this compres-sion for the entire procedure.
There is more concern regarding vasovagal reac-tion when patients are sitting upright. However, there are positioning alternatives for patients having breast biopsies with upright systems. If space allows, adding a reclining chair, stretcher or gurney to the room can increase the positioning options. The equipment’s rotation angles can obtain multiple positions and the patient can lie on her side in either direction. All areas of the breast should be reachable with the pos-sible positioning options. Technologists have been trained in diagnostic radiography positioning using simple tools, such as sponges and rolled towels. These techniques also can be used with upright systems.
Upright system designs vary greatly and because of these differences, obtaining optimum patient posi-tions can be unique to each system. For example, some systems have a large area under the imaging table to allow for the angled degree of image receptor swing and others are smaller because the image recep-tor does not need to swing. The physician, radiologist assistant and technologist may need to be creative and flexible in their approach to each procedure. For example, if the patient is lying in a decubitus posi-tion on a stretcher or supine chair, the physician can operate the needle or probe from behind the patient instead of from in front of the patient and stretcher.
Targeting CalcificationsStereotactic breast biopsy is the technique of choice
for diagnosing microcalcifications. Microcalcifications usually are biopsied when they appear in a group and have suspicious characteristics. Highly suspicious micro-calcifications are fine, linear or branching in a ductal or segmental distribution. These microcalcifications have a suggested 81% to 92% malignancy rate.
Pleomorphic (variable in size) microcalcifica-tions have a suggested 41% malignancy rate. Round, uniform punctate microcalcifications are considered probably benign; < 2% are thought to be malignant. Microcalcifications that are indistinct or amorphous are
is open and that the lesion or microcalcifications are close to or within the sampling notch. The notch can be adjusted toward the direction of the lesion or microcal-cifications. Sampling may continue until the physician is satisfied that enough samples have been taken. Between 5 and 12 specimens typically are extracted for breast biopsies. The number of samples varies greatly from phy-sician to physician and in the literature.
The radiologic technologist should take an image of the specimens, usually in another mammography room or with dedicated specimen image equipment, for veri-fication of microcalcification retrieval. This step may be eliminated for lesions not containing calcifications. In addition, postbiopsy images demonstrate whether the lesion or microcalcifications were removed from the patient, along with demonstrating the small cavity left by removal of the specimen. If a marker is deployed, an additional 0° or stereotactic image can verify marker placement. A depth pullback is appropriate with certain types of markers to allow the marker to deploy near the center of the sampling notch. The procedure now is complete and a 2-view mammogram following marker placement also is needed for documentation.
Patient PositioningPatient positioning depends on the type of ste-
reotactic equipment used. With the prone table, the patient lies prone with her head turned facing the side away from the breast to be biopsied. The breast drops through an opening in the table and gravity helps the breast tissue for biopsy hang as far away from the table as possible. The patient usually turns slightly oblique with the ipsilateral arm along her side and the contra-lateral knee bent as in an oblique position. A thin pad on the prone table helps to soften it, but this position still can be hard on the neck and ipsilateral ribs. Some patients also complain about back pain because the back is slightly arched. Further, if a lesion is very close to the chest wall, the thickness of the table and pad-ding add distance. Removing the table pad can move the patient slightly closer in contact with the table, but may cause pain because the table comes in direct con-tact with the patient’s ribs.
Lesions in the axillary tail of the breast can be made more accessible by bringing the patient’s ipsi-lateral arm through the table opening along with the breast. When this position is used, radiologic technologists should provide adequate support for the ipsilateral arm so that it does not just hang. Neck comfort seems to be the challenge for most patients
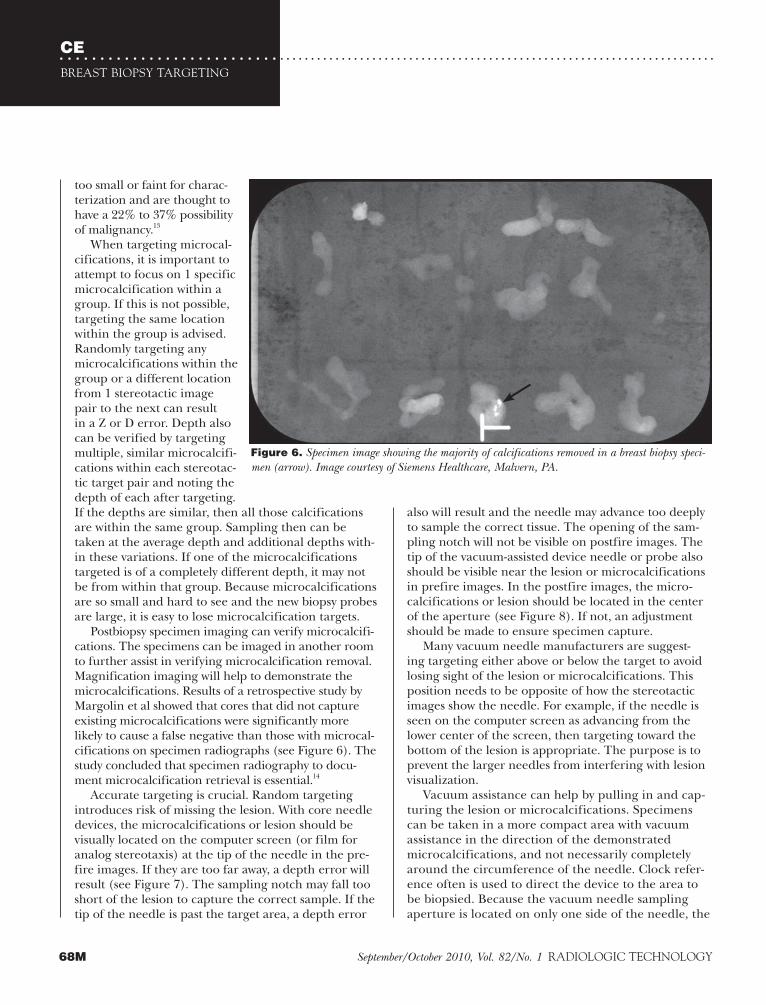
CEBREAST BIOPSY TARGETING
68M September/October 2010, Vol. 82/No. 1 RADIOLOGIC TECHNOLOGY
. . . . . . . . . . . . . . . . . . . . . . . . . . . . . . . . . . . . . . . . . . . . . . . . . . . . . . . . . . . . . . . . . . . . . . . . . . . . . . . . . . . . . . . . . . . . . . . . . .
also will result and the needle may advance too deeply to sample the correct tissue. The opening of the sam-pling notch will not be visible on postfire images. The tip of the vacuum-assisted device needle or probe also should be visible near the lesion or microcalcifications in prefire images. In the postfire images, the micro-calcifications or lesion should be located in the center of the aperture (see Figure 8). If not, an adjustment should be made to ensure specimen capture.
Many vacuum needle manufacturers are suggest-ing targeting either above or below the target to avoid losing sight of the lesion or microcalcifications. This position needs to be opposite of how the stereotactic images show the needle. For example, if the needle is seen on the computer screen as advancing from the lower center of the screen, then targeting toward the bottom of the lesion is appropriate. The purpose is to prevent the larger needles from interfering with lesion visualization.
Vacuum assistance can help by pulling in and cap-turing the lesion or microcalcifications. Specimens can be taken in a more compact area with vacuum assistance in the direction of the demonstrated microcalcifications, and not necessarily completely around the circumference of the needle. Clock refer-ence often is used to direct the device to the area to be biopsied. Because the vacuum needle sampling aperture is located on only one side of the needle, the
too small or faint for charac-terization and are thought to have a 22% to 37% possibility of malignancy.13
When targeting microcal-cifications, it is important to attempt to focus on 1 specific microcalcification within a group. If this is not possible, targeting the same location within the group is advised. Randomly targeting any microcalcifications within the group or a different location from 1 stereotactic image pair to the next can result in a Z or D error. Depth also can be verified by targeting multiple, similar microcalcifi-cations within each stereotac-tic target pair and noting the depth of each after targeting. If the depths are similar, then all those calcifications are within the same group. Sampling then can be taken at the average depth and additional depths with-in these variations. If one of the microcalcifications targeted is of a completely different depth, it may not be from within that group. Because microcalcifications are so small and hard to see and the new biopsy probes are large, it is easy to lose microcalcification targets.
Postbiopsy specimen imaging can verify microcalcifi-cations. The specimens can be imaged in another room to further assist in verifying microcalcification removal. Magnification imaging will help to demonstrate the microcalcifications. Results of a retrospective study by Margolin et al showed that cores that did not capture existing microcalcifications were significantly more likely to cause a false negative than those with microcal-cifications on specimen radiographs (see Figure 6). The study concluded that specimen radiography to docu-ment microcalcification retrieval is essential.14
Accurate targeting is crucial. Random targeting introduces risk of missing the lesion. With core needle devices, the microcalcifications or lesion should be visually located on the computer screen (or film for analog stereotaxis) at the tip of the needle in the pre-fire images. If they are too far away, a depth error will result (see Figure 7). The sampling notch may fall too short of the lesion to capture the correct sample. If the tip of the needle is past the target area, a depth error
Figure 6. Specimen image showing the majority of calcifications removed in a breast biopsy speci-men (arrow). Image courtesy of Siemens Healthcare, Malvern, PA.

CEDIRECTED READING
. . . . . . . . . . . . . . . . . . . . . . . . . . . . . . . . . . . . . . . . . . . . . . . . . . . . . . . . . . . . . . . . . . . . . . . . . . . . . . . . . . . . . . . . . . . . . . . . . .
69MRADIOLOGIC TECHNOLOGY September/October 2010, Vol. 82/No. 1
them to do so rather than reposition the patient. This may be an option when poor visualization is not because of location but rather because overlying or underlying tis-sues obscure the lesion. If the 0º scout image is used as part of the stereotactic pair, this reduces the angle between the 2 projections from 30º to 15º. The decreased angle requires greater accuracy in targeting.15
As with needle local-izations for open biopsy, patient positioning for the stereotactic biopsy should accommodate the shortest possible approach. However, an approach that is too short may not allow for the sampling notch to be totally inserted under the skin. If this happens, a small piece of skin could be removed along with the lesion sample. Incision stitching usually is not necessary after a percu-taneous biopsy but may be needed if skin is removed unintentionally. An addition-
al problem with a short approach in vacuum-assisted biopsy is that the vacuum will not work properly if the sampling notch is not totally submerged under the patient’s skin, which provides an adequate seal to cre-ate a vacuum. Physicians can use techniques such as injection to inflate the tissue to allow for coverage of the sampling notch or a sterile skin hook to pull up and twist the skin over the exposed sampling notch to help create a seal for the vacuum.
Visual PreparationSeveral observational steps should be taken before
the biopsy begins to ensure that the appropriate area is being biopsied. The suspicious lesion should be observed on the patient within the same area of the breast as identified on screening or diagnostic mammo-grams. If the lesion is located in the upper outer quad-rant, then the position of the lesion on stereotactic images also should be the upper outer quadrant. This
aperture should be turned toward where the lesion or microcalcifications are suspected to be; specimens don’t necessarily need to be taken from the opposite direction. For example, if the needle is in the 6:00 position in relation to the lesion, the biopsy aperture should be turned to the 12:00 position and samples should be taken at 10:00, 11:00, 12:00, 1:00 and 2:00 positions (see Figure 9).
In most systems, targeting must be done through use of a pair of stereotactic images. If a lesion or micro-calcifications are seen only on one of the stereotactic images, the physician will need to reevaluate the scout image. The initial 0º scout image should contain the area to be biopsied within the middle third of the hori-zontal H or X axis to prevent the target area from dis-appearing in the angled stereotactic images because of parallax shift. Radiologic technologists and physicians should avoid the temptation to use the scout image as one of the stereotactic pairs on systems that allow
Figure 7. Line drawing showing stereotactic breast biopsy prefire. The circles represent a lesion. A. Needle is short of the lesion and the lesion will not be captured in the sam-pling notch. B. Needle tip is past the lesion and the lesion will not be captured in the sampling notch. Drawing by the author.
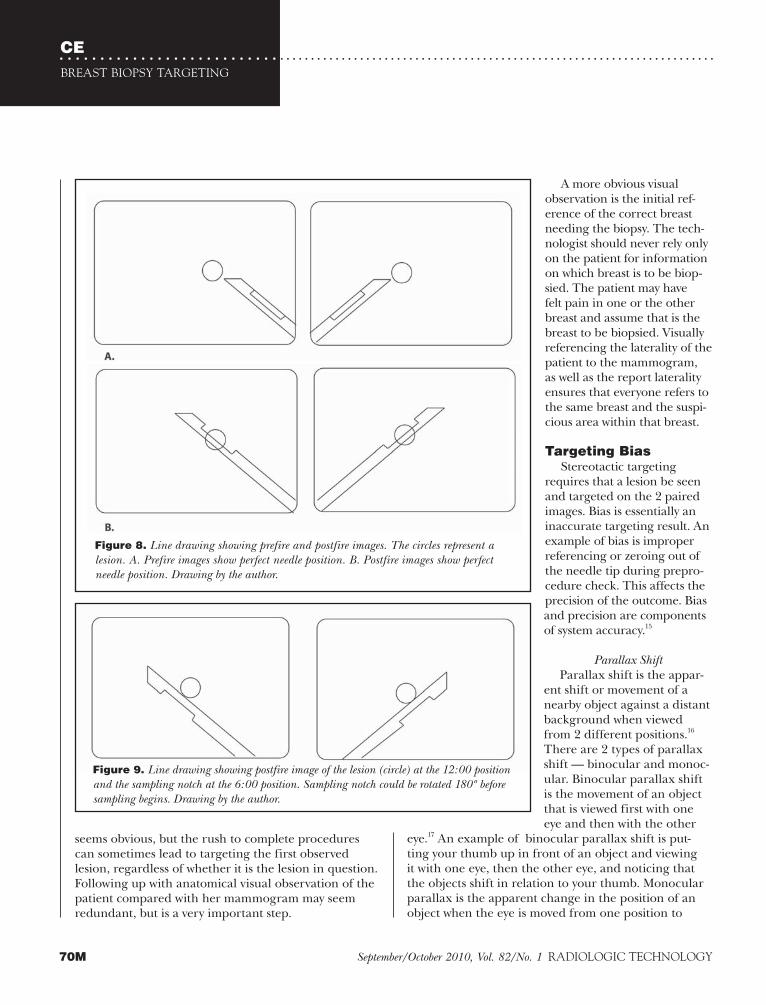
CEBREAST BIOPSY TARGETING
70M September/October 2010, Vol. 82/No. 1 RADIOLOGIC TECHNOLOGY
. . . . . . . . . . . . . . . . . . . . . . . . . . . . . . . . . . . . . . . . . . . . . . . . . . . . . . . . . . . . . . . . . . . . . . . . . . . . . . . . . . . . . . . . . . . . . . . . . .
seems obvious, but the rush to complete procedures can sometimes lead to targeting the first observed lesion, regardless of whether it is the lesion in question. Following up with anatomical visual observation of the patient compared with her mammogram may seem redundant, but is a very important step.
A more obvious visual observation is the initial ref-erence of the correct breast needing the biopsy. The tech-nologist should never rely only on the patient for information on which breast is to be biop-sied. The patient may have felt pain in one or the other breast and assume that is the breast to be biopsied. Visually referencing the laterality of the patient to the mammogram, as well as the report laterality ensures that everyone refers to the same breast and the suspi-cious area within that breast.
Targeting BiasStereotactic targeting
requires that a lesion be seen and targeted on the 2 paired images. Bias is essentially an inaccurate targeting result. An example of bias is improper referencing or zeroing out of the needle tip during prepro-cedure check. This affects the precision of the outcome. Bias and precision are components of system accuracy.15
Parallax ShiftParallax shift is the appar-
ent shift or movement of a nearby object against a distant background when viewed from 2 different positions.16 There are 2 types of parallax shift — binocular and monoc-ular. Binocular parallax shift is the movement of an object that is viewed first with one eye and then with the other
eye.17 An example of binocular parallax shift is put-ting your thumb up in front of an object and viewing it with one eye, then the other eye, and noticing that the objects shift in relation to your thumb. Monocular parallax is the apparent change in the position of an object when the eye is moved from one position to
Figure 8. Line drawing showing prefire and postfire images. The circles represent a lesion. A. Prefire images show perfect needle position. B. Postfire images show perfect needle position. Drawing by the author.
Figure 9. Line drawing showing postfire image of the lesion (circle) at the 12:00 position and the sampling notch at the 6:00 position. Sampling notch could be rotated 180º before sampling begins. Drawing by the author.
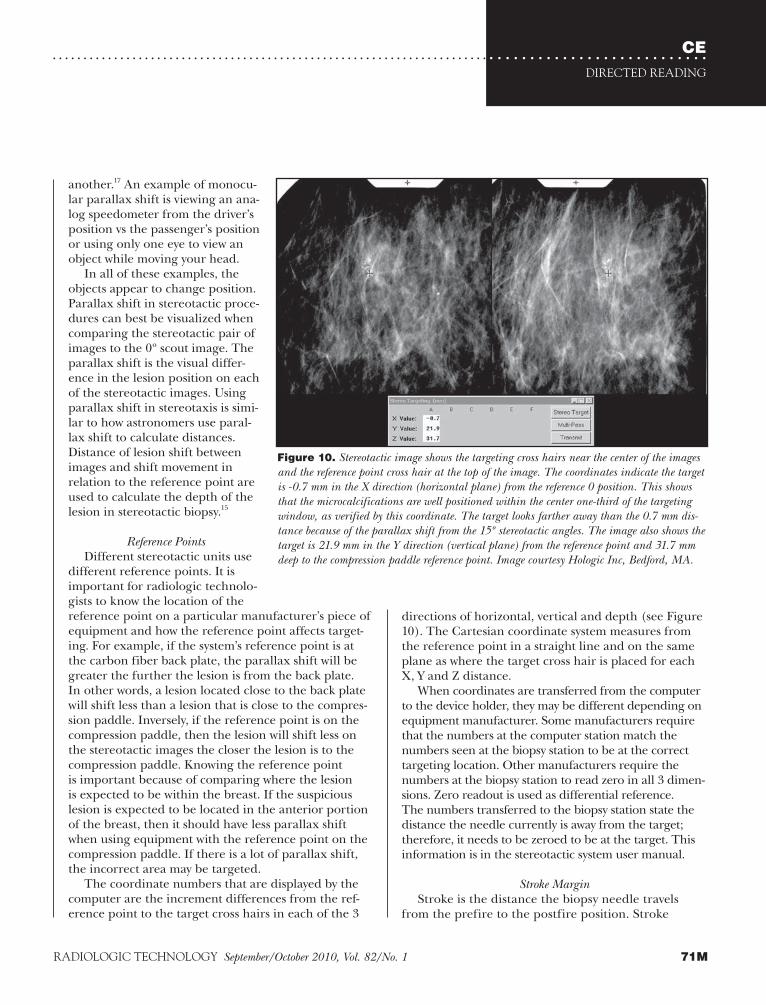
CEDIRECTED READING
. . . . . . . . . . . . . . . . . . . . . . . . . . . . . . . . . . . . . . . . . . . . . . . . . . . . . . . . . . . . . . . . . . . . . . . . . . . . . . . . . . . . . . . . . . . . . . . . . .
71MRADIOLOGIC TECHNOLOGY September/October 2010, Vol. 82/No. 1
directions of horizontal, vertical and depth (see Figure 10). The Cartesian coordinate system measures from the reference point in a straight line and on the same plane as where the target cross hair is placed for each X, Y and Z distance.
When coordinates are transferred from the computer to the device holder, they may be different depending on equipment manufacturer. Some manufacturers require that the numbers at the computer station match the numbers seen at the biopsy station to be at the correct targeting location. Other manufacturers require the numbers at the biopsy station to read zero in all 3 dimen-sions. Zero readout is used as differential reference. The numbers transferred to the biopsy station state the distance the needle currently is away from the target; therefore, it needs to be zeroed to be at the target. This information is in the stereotactic system user manual.
Stroke MarginStroke is the distance the biopsy needle travels
from the prefire to the postfire position. Stroke
another.17 An example of monocu-lar parallax shift is viewing an ana-log speedometer from the driver’s position vs the passenger’s position or using only one eye to view an object while moving your head.
In all of these examples, the objects appear to change position. Parallax shift in stereotactic proce-dures can best be visualized when comparing the stereotactic pair of images to the 0º scout image. The parallax shift is the visual differ-ence in the lesion position on each of the stereotactic images. Using parallax shift in stereotaxis is simi-lar to how astronomers use paral-lax shift to calculate distances. Distance of lesion shift between images and shift movement in relation to the reference point are used to calculate the depth of the lesion in stereotactic biopsy.15
Reference PointsDifferent stereotactic units use
different reference points. It is important for radiologic technolo-gists to know the location of the reference point on a particular manufacturer’s piece of equipment and how the reference point affects target-ing. For example, if the system’s reference point is at the carbon fiber back plate, the parallax shift will be greater the further the lesion is from the back plate. In other words, a lesion located close to the back plate will shift less than a lesion that is close to the compres-sion paddle. Inversely, if the reference point is on the compression paddle, then the lesion will shift less on the stereotactic images the closer the lesion is to the compression paddle. Knowing the reference point is important because of comparing where the lesion is expected to be within the breast. If the suspicious lesion is expected to be located in the anterior portion of the breast, then it should have less parallax shift when using equipment with the reference point on the compression paddle. If there is a lot of parallax shift, the incorrect area may be targeted.
The coordinate numbers that are displayed by the computer are the increment differences from the ref-erence point to the target cross hairs in each of the 3
Figure 10. Stereotactic image shows the targeting cross hairs near the center of the images and the reference point cross hair at the top of the image. The coordinates indicate the target is -0.7 mm in the X direction (horizontal plane) from the reference 0 position. This shows that the microcalcifications are well positioned within the center one-third of the targeting window, as verified by this coordinate. The target looks farther away than the 0.7 mm dis-tance because of the parallax shift from the 15º stereotactic angles. The image also shows the target is 21.9 mm in the Y direction (vertical plane) from the reference point and 31.7 mm deep to the compression paddle reference point. Image courtesy Hologic Inc, Bedford, MA.
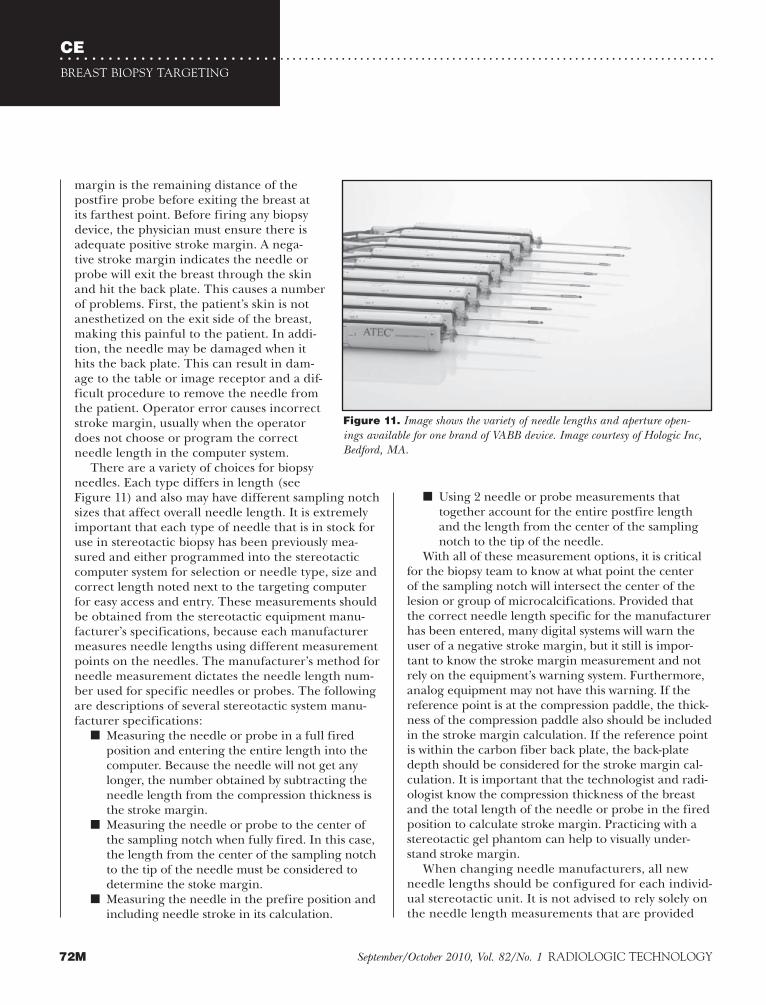
CEBREAST BIOPSY TARGETING
72M September/October 2010, Vol. 82/No. 1 RADIOLOGIC TECHNOLOGY
. . . . . . . . . . . . . . . . . . . . . . . . . . . . . . . . . . . . . . . . . . . . . . . . . . . . . . . . . . . . . . . . . . . . . . . . . . . . . . . . . . . . . . . . . . . . . . . . . .
margin is the remaining distance of the postfire probe before exiting the breast at its farthest point. Before firing any biopsy device, the physician must ensure there is adequate positive stroke margin. A nega-tive stroke margin indicates the needle or probe will exit the breast through the skin and hit the back plate. This causes a number of problems. First, the patient’s skin is not anesthetized on the exit side of the breast, making this painful to the patient. In addi-tion, the needle may be damaged when it hits the back plate. This can result in dam-age to the table or image receptor and a dif-ficult procedure to remove the needle from the patient. Operator error causes incorrect stroke margin, usually when the operator does not choose or program the correct needle length in the computer system.
There are a variety of choices for biopsy needles. Each type differs in length (see Figure 11) and also may have different sampling notch sizes that affect overall needle length. It is extremely important that each type of needle that is in stock for use in stereotactic biopsy has been previously mea-sured and either programmed into the stereotactic computer system for selection or needle type, size and correct length noted next to the targeting computer for easy access and entry. These measurements should be obtained from the stereotactic equipment manu-facturer’s specifications, because each manufacturer measures needle lengths using different measurement points on the needles. The manufacturer’s method for needle measurement dictates the needle length num-ber used for specific needles or probes. The following are descriptions of several stereotactic system manu-facturer specifications:
■ Measuring the needle or probe in a full fired position and entering the entire length into the computer. Because the needle will not get any longer, the number obtained by subtracting the needle length from the compression thickness is the stroke margin.
■ Measuring the needle or probe to the center of the sampling notch when fully fired. In this case, the length from the center of the sampling notch to the tip of the needle must be considered to determine the stoke margin.
■ Measuring the needle in the prefire position and including needle stroke in its calculation.
■ Using 2 needle or probe measurements that together account for the entire postfire length and the length from the center of the sampling notch to the tip of the needle.
With all of these measurement options, it is critical for the biopsy team to know at what point the center of the sampling notch will intersect the center of the lesion or group of microcalcifications. Provided that the correct needle length specific for the manufacturer has been entered, many digital systems will warn the user of a negative stroke margin, but it still is impor-tant to know the stroke margin measurement and not rely on the equipment’s warning system. Furthermore, analog equipment may not have this warning. If the reference point is at the compression paddle, the thick-ness of the compression paddle also should be included in the stroke margin calculation. If the reference point is within the carbon fiber back plate, the back-plate depth should be considered for the stroke margin cal-culation. It is important that the technologist and radi-ologist know the compression thickness of the breast and the total length of the needle or probe in the fired position to calculate stroke margin. Practicing with a stereotactic gel phantom can help to visually under-stand stroke margin.
When changing needle manufacturers, all new needle lengths should be configured for each individ-ual stereotactic unit. It is not advised to rely solely on the needle length measurements that are provided
Figure 11. Image shows the variety of needle lengths and aperture open-ings available for one brand of VABB device. Image courtesy of Hologic Inc, Bedford, MA.

CEDIRECTED READING
. . . . . . . . . . . . . . . . . . . . . . . . . . . . . . . . . . . . . . . . . . . . . . . . . . . . . . . . . . . . . . . . . . . . . . . . . . . . . . . . . . . . . . . . . . . . . . . . . .
73MRADIOLOGIC TECHNOLOGY September/October 2010, Vol. 82/No. 1
Importance of Needle GuidesIn the early days of stereotactic breast biopsy,
needles used for FNA or surgical localization were stereotactically guided to provide better accuracy than freehand insertion. Some of these early systems used a single-needle guide on which the needle rested. Using a single-needle guide caused needle instability as the needle veered off course; the system relied on the phy-sician to keep the needle perpendicular. The addition of a second needle guide helped to keep the needle on its trajectory.
Today’s VABB devices are thicker and stronger, and also are securely locked in place, which reduces insta-bility. Still, these devices use some sort of guide close to the breast to keep the needle trajectory straight. Needles and probes are large radiopaque objects that can get in the way when imaging. The guides usually have radiolucent sterile probe guides inserted within them to provide sterile needle guidance. The guides can be moved up or back and partially out of the way during the exposures. It is important that moving the guides up and back down (or forward and backward) between exposures does not deviate from the target location. The movement can cause a shift in needle location on the images, although the shift usually is insignificant with VABB systems. The movement can be more significant when using thinner nonvacuum core gun needles or self-contained VABB devices that may not be locked to the stereotactic equipment. Needle-guide accuracy can be verified with a calibration check phantom by observing needle-tip images with the needle guide up and down or pulled in and out. There should be no difference in needle-tip position. This testing should be performed periodically because the system’s mechanics can become loose.
Missed LesionsTechnical failure of a breast biopsy occurs when the
physician retrieves tissue that does not match the tissue type seen on the mammogram, such as tissue with spe-cific calcification characteristics.20 This is a discordant diagnosis. Although the radiologic technologist usu-ally is not responsible for targeting during stereotactic breast biopsy, it is important for radiologic technolo-gists to understand the mechanics. There are several reasons why microcalcifications or small lesions are missed during stereotactic breast biopsy.
Patient movement is the most common reason for missed lesions. Marking the locations of the corners of the compression paddle on the patient’s skin in
with the products. Radiologic technologists should verify manufacturer numbers with the calibration check phantom before patient imaging. Each manu-facturer provides or recommends a phantom for cali-bration checking.
Repositioning the patient and taking the opposite approach should be the first alternative to correct inad-equate stroke margin. Certain positioning tricks can be used when there is no other patient positioning alter-native to correct inadequate stroke margin. Putting the plastic insert of a stereotactic biopsy paddle upside down between the breast and back plate will allow for additional stroke margin to the back plate but does not prevent the needle from exiting the breast on the other side of the lesion and causing pain to the patient unless the skin is appropriately anesthetized. When the needle or probe goes through the opposite side of the breast, the skin it breaks through also needs to be ster-ile. Putting an object that does not have a hole to allow the needle or probe to pass untouched on the other side of the breast between the back plate and the breast can cause needle contamination. It also may cause non-sterile material to be pulled back through the breast on the needle tip as it is removed.
Plumping the breast tissue is another alternative to accommodate negative stroke margin. A moldable object, such as a breast bolster, can be placed around the periphery of the breast.18 Breast plumping can negatively affect the visibility of the lesion or micro-calcifications because of reduced tissue compression. Some systems allow addition of a lateral arm device, which can reduce negative stroke margin in breasts that are so thin under compression that there isn’t enough distance to allow for the length from the tip of the needle to the top of the sampling notch. Lateral arm devices may not be able to support heavi-er VABB devices.19
Most VABB devices do not have to be fired to obtain a specimen, which differs from other biopsy devices. However, most VABB manufacturers recommend firing within the breast for the best results. This technique should lessen the possibility of pushing the lesion or breast tissue containing the microcalcifications for-ward during needle or probe insertion. If the lesion or microcalcifications are too deep or too shallow, optimal firing of the device may cause patient pain pos-terior to the lesion, as is possible with a deep lesion or an unnecessary skin puncture biopsy for some anterior lesions. It may be preferred to fire the VABB device before breast insertion in those situations.
CEBREAST BIOPSY TARGETING
74M September/October 2010, Vol. 82/No. 1 RADIOLOGIC TECHNOLOGY
. . . . . . . . . . . . . . . . . . . . . . . . . . . . . . . . . . . . . . . . . . . . . . . . . . . . . . . . . . . . . . . . . . . . . . . . . . . . . . . . . . . . . . . . . . . . . . . . . .
is located on the compression paddle, a tube angle of 15º to the left is a negative (-) direction, and angling to the right is the positive (+) direction. This directional information is available in the equipment user manual.
It also is important that the x-ray tube be moved completely to the angled position and not rotationally stopped before reaching its full angled position. The result will lead to incorrect calculations because the angle will not cover the entire expanse expected by the computer to make a precise calculation.15 Technologists can make a note on the technique chart at the imaging control panel as a reminder of which direction the tube should be angled first. This also helps remind tech-nologists who do not perform stereotactic procedures on a daily basis that the tube must be angled a specific direction for the first stereotactic exposure.
Technologists also should pay attention to the lesion’s expected shift from the 0º scout on the stereo-tactic pair. Expecting a particular result and surprise at the amount of shift should be a warning that the cor-rect lesion is not being targeted. If the lesion or micro-calcifications are thought to be posterior in the breast and the equipment’s reference point is at the image receptor carbon fiber plate, the expected lesion shift should be minimal. If, however, the equipment refer-ence point is on the compression paddle and the lesion is posterior, then the lesion shift should be greater.
Image ResolutionVisualizing a small indistinct lesion in a dense
breast or diffusely faint microcalcifications for biopsy can depend on image quality. In the screening or diagnostic mammography setting in which the lesion or microcalcifications were identified, image quality was at its maximum. Duplicating that image quality is not possible with stereotaxis. At the very least, the amount of compression applied during screening mammography may not be tolerable to the patient during a longer stereotactic procedure. In addition, the compression paddle used for the mammogram was solid, but the stereotactic compression paddle has an opening through which the targeting window of breast tissue protrudes. For this reason, the area that needs to be seen most clearly receives the least amount of compression. A small amount of additional compression can be achieved by covering the biopsy paddle opening with taut sterile tape with the adhe-sive side away from the patient’s breast skin. This type of tape often is used in surgery or to cover venous catheters. While not a perfect solution, this technique
ink may help to indicate that there has been patient motion. Lesion movement is different from patient movement. It can be caused by pushing the lesion with the biopsy needle or when injecting the anesthetic. One study found target lesion displacement > 2.1 mm with the use of larger VABB needles. The study also stated that needle deviation errors > 1.8 mm were more likely to occur with thinner needles.21 Most VABB devic-es do not require firing in the patient’s breast, but may be fired outside the breast and inserted into the target location in 1 movement. Insertion pressure from the large needle or probe can push the lesion away from the target area, causing the lesion to be missed.
Incorrect targeting is another reason for missed lesions and can be caused by a number of factors. An automatic error can occur when coordinates are transferred from the targeting station to the biopsy station or incorrect data, such as needle length, may be entered at the targeting station computer. Correct targeting of the lesion at the computer is crucial. Incorrect targeting on one or both projections usually causes an error in the calculated D or Z depth. The degree of error ultimately depends on which direction the error is made in relation to the lesion.11 Incorrectly targeting a lesion on the lateral aspect in each stereo-tactic pair can cause a depth miscalculation. Targeting a lesion incorrectly on the medial aspect of each ste-reotactic pair will result in an inverse depth error (see Figure 12).
It is also crucial that the technologist be aware of the equipment manufacturer’s requirement for tube exposure position. Incorrect sequencing of images may cause a missed lesion. One manufacturer requires the first image of a stereotactic pair be taken with the tube to the left, and another manufacturer requires that the first image pair be taken from the right. Some sys-tems are set up to take the first image from either side because the image automatically is placed in the cor-rect location on the computer screen. A lesion may be missed if the D or Z depth reading is opposite of that expected or the target coordinates appear outside the breast. In this case, the tube was positioned opposite the required direction.
Because opposite reference points are used in various systems, the negative or positive tube-angle degree can be inverse from one system to the next. For example, if the reference point is on or in the image receptor carbon fiber table, a tube angle of 15º to the left is the positive (+) direction, and angling to the right is the negative (-) direction. If the reference point

CEDIRECTED READING
. . . . . . . . . . . . . . . . . . . . . . . . . . . . . . . . . . . . . . . . . . . . . . . . . . . . . . . . . . . . . . . . . . . . . . . . . . . . . . . . . . . . . . . . . . . . . . . . . .
75MRADIOLOGIC TECHNOLOGY September/October 2010, Vol. 82/No. 1
Specimen SizeCore biopsy size is determined by several factors,
including the diameter or gauge of the needle, length of the sampling notch, suction direction and vacuum power for VABB systems. It has been suggested that increased biopsy size may be preferable when micro-calcifications are biopsied. Differentiation of atypical hyperplasia from ductal carcinoma in situ (DCIS) depends on correct targeting and biopsy specimen size.22 The histological features of atypical ductal hyper-plasia (ADH) are similar to DCIS, but ADH lesions do not reach the size of DCIS lesions. An involvement of one duct or aggregate diameter of < 2 mm is classified as ADH but a lesion with nearly the same histologic
sometimes allows for slightly more compression and improved visualization.
Proper imaging techniques should be posted on a technique chart at the generator. Some manufactur-ers also offer imaging target and filtration options to improve individual patient image quality. It is impor-tant that analog stereotactic systems use available mam-mography quality-controlled processors to maximize resolution of the resulting radiographs. Image quality is negatively affected by poorly maintained processors for analog stereotaxis. Digital image quality depends a great deal on the resolution of the imaging detector and monitor. Some digital adjustments can be made to contrast and density at the display monitor.
Figure 12. Line drawing showing targeting cross hairs incorrectly placed. A. Targeting lateral to a lesion will cause the needle to fall short of the target for stereotactic equipment using a compression paddle refer-ence point and too deep for stereotactic equipment using a back-plate reference point. B. Targeting medial to a lesion will cause the needle to be too deep for stereotactic equipment using a compression paddle reference point and too shallow for stereotactic equipment using a back-plate reference point. Drawing by the author.
Incorrect Lesion Targeting
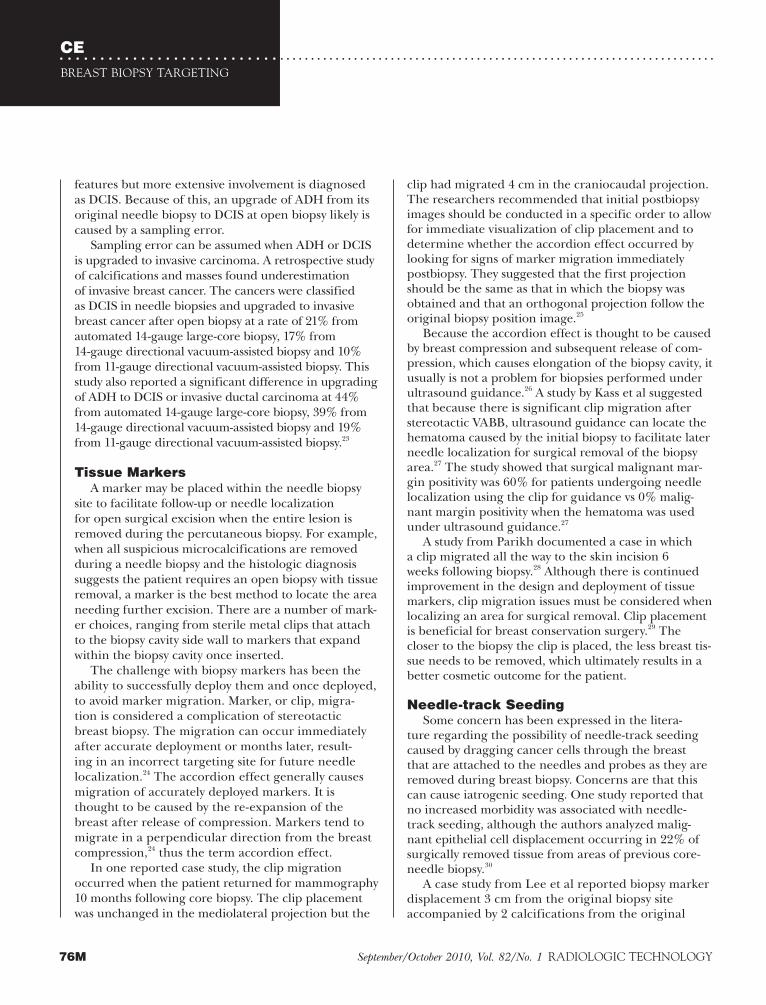
CEBREAST BIOPSY TARGETING
76M September/October 2010, Vol. 82/No. 1 RADIOLOGIC TECHNOLOGY
. . . . . . . . . . . . . . . . . . . . . . . . . . . . . . . . . . . . . . . . . . . . . . . . . . . . . . . . . . . . . . . . . . . . . . . . . . . . . . . . . . . . . . . . . . . . . . . . . .
clip had migrated 4 cm in the craniocaudal projection. The researchers recommended that initial postbiopsy images should be conducted in a specific order to allow for immediate visualization of clip placement and to determine whether the accordion effect occurred by looking for signs of marker migration immediately postbiopsy. They suggested that the first projection should be the same as that in which the biopsy was obtained and that an orthogonal projection follow the original biopsy position image.25
Because the accordion effect is thought to be caused by breast compression and subsequent release of com-pression, which causes elongation of the biopsy cavity, it usually is not a problem for biopsies performed under ultrasound guidance.26 A study by Kass et al suggested that because there is significant clip migration after stereotactic VABB, ultrasound guidance can locate the hematoma caused by the initial biopsy to facilitate later needle localization for surgical removal of the biopsy area.27 The study showed that surgical malignant mar-gin positivity was 60% for patients undergoing needle localization using the clip for guidance vs 0% malig-nant margin positivity when the hematoma was used under ultrasound guidance.27
A study from Parikh documented a case in which a clip migrated all the way to the skin incision 6 weeks following biopsy.28 Although there is continued improvement in the design and deployment of tissue markers, clip migration issues must be considered when localizing an area for surgical removal. Clip placement is beneficial for breast conservation surgery.29 The closer to the biopsy the clip is placed, the less breast tis-sue needs to be removed, which ultimately results in a better cosmetic outcome for the patient.
Needle-track SeedingSome concern has been expressed in the litera-
ture regarding the possibility of needle-track seeding caused by dragging cancer cells through the breast that are attached to the needles and probes as they are removed during breast biopsy. Concerns are that this can cause iatrogenic seeding. One study reported that no increased morbidity was associated with needle-track seeding, although the authors analyzed malig-nant epithelial cell displacement occurring in 22% of surgically removed tissue from areas of previous core-needle biopsy.30
A case study from Lee et al reported biopsy marker displacement 3 cm from the original biopsy site accompanied by 2 calcifications from the original
features but more extensive involvement is diagnosed as DCIS. Because of this, an upgrade of ADH from its original needle biopsy to DCIS at open biopsy likely is caused by a sampling error.
Sampling error can be assumed when ADH or DCIS is upgraded to invasive carcinoma. A retrospective study of calcifications and masses found underestimation of invasive breast cancer. The cancers were classified as DCIS in needle biopsies and upgraded to invasive breast cancer after open biopsy at a rate of 21% from automated 14-gauge large-core biopsy, 17% from 14-gauge directional vacuum-assisted biopsy and 10% from 11-gauge directional vacuum-assisted biopsy. This study also reported a significant difference in upgrading of ADH to DCIS or invasive ductal carcinoma at 44% from automated 14-gauge large-core biopsy, 39% from 14-gauge directional vacuum-assisted biopsy and 19% from 11-gauge directional vacuum-assisted biopsy.23
Tissue MarkersA marker may be placed within the needle biopsy
site to facilitate follow-up or needle localization for open surgical excision when the entire lesion is removed during the percutaneous biopsy. For example, when all suspicious microcalcifications are removed during a needle biopsy and the histologic diagnosis suggests the patient requires an open biopsy with tissue removal, a marker is the best method to locate the area needing further excision. There are a number of mark-er choices, ranging from sterile metal clips that attach to the biopsy cavity side wall to markers that expand within the biopsy cavity once inserted.
The challenge with biopsy markers has been the ability to successfully deploy them and once deployed, to avoid marker migration. Marker, or clip, migra-tion is considered a complication of stereotactic breast biopsy. The migration can occur immediately after accurate deployment or months later, result-ing in an incorrect targeting site for future needle localization.24 The accordion effect generally causes migration of accurately deployed markers. It is thought to be caused by the re-expansion of the breast after release of compression. Markers tend to migrate in a perpendicular direction from the breast compression,24 thus the term accordion effect.
In one reported case study, the clip migration occurred when the patient returned for mammography 10 months following core biopsy. The clip placement was unchanged in the mediolateral projection but the
CEDIRECTED READING
. . . . . . . . . . . . . . . . . . . . . . . . . . . . . . . . . . . . . . . . . . . . . . . . . . . . . . . . . . . . . . . . . . . . . . . . . . . . . . . . . . . . . . . . . . . . . . . . . .
77MRADIOLOGIC TECHNOLOGY September/October 2010, Vol. 82/No. 1
A daily calibration check is usually an in-air test using either a phantom provided by the manufacturer or a handmade phantom created by threading a nee-dle through a paper cup or a piece of Styrofoam block that allows the tip of the targeting needle to touch the tip of the phantom point after performing the routine steps of imaging and targeting. If this test fails, then the equipment requires calibration. Some units can be calibrated by the user, but others may require cali-bration from a service engineer.
Qualified PersonnelAs with almost everything, there is a learning curve
for stereotactic breast biopsy. A study by Liberman et al of 6 radiologists noted significantly higher technical success and lower false-negative rates for stereotactic breast biopsy for radiologists who had performed between 5 and 20 cases using a 14-gauge automated core biopsy device and for those who had performed between 5 and 15 cases using an 11-gauge vacuum-assisted biopsy device. The study added that even if the radiologist had experience with stereotactic biopsy, a change in equipment could result in a new learning curve.33 This also is true for personnel participating in the procedure, such as the radiologic technologist. The technologist plays a major role in the success of the ste-reotactic procedure.
Stereotactic biopsy steps should be carried out com-pletely and in a specific order. These procedural steps should be written out in detail for less-experienced personnel or if stereotactic procedures are not per-formed often in a given facility. Radiologic technolo-gists and radiologist assistants should expect a learning curve similar to that documented for radiologists in the Liberman study. According to the ACR Practice Guidelines for the Performance of Stereotactically Guided Breast Interventional Procedures, physicians should perform at least 24 stereotactic breast biopsies every 2 years.10 Stereotactic breast biopsy can be accred-ited separately from the mammography accreditation program requiring documented case experience. The ACR stereotactic breast biopsy accreditation program requirements are available for review.34
Surgeons also may qualify to perform stereotactic breast biopsies and have specific guidelines from the American Society of Breast Surgeons.35 Surgeons also face a learning curve in performing stereotactic proce-dures. Practicing periodically as a team with a biopsy phantom early in this learning curve, and especially with any equipment change, can be helpful.
biopsy site.31 The authors surmised that the microcal-cifications may have traveled with the probe when it coursed through the breast after a small amount of tissue containing some of the microcalcifications was caught when the clip was closed during deployment. The fragments may have traveled with the clip or some tissue fragments may have been left within the bowl of the probe and deployed with the marker.31 No matter the method, this study suggested the potential for needle-track seeding.
Quality ControlA facility that performs stereotactic breast biopsy
procedures may or may not perform screening or diagnostic mammography. Some breast biopsies are performed in a freestanding surgical center or a mobile van. Because there is no accreditation require-ment for performance of stereotactic breast biopsy, a facility that does not offer mammography is not held to the strict federal standards of the U.S. Food and Drug Administration (FDA) Mammography Quality Standards Act (MQSA) and program accreditation guidelines. Because stereotaxis emits radiation, the systems are subject to specific state requirements. The ACR 1999 Stereotactic Breast Biopsy Quality Control Manual32 has sections specific to the physician, tech-nologist and physicist. The manual contains recom-mendations and requirements for accredited facilities but is also a good reference for any facility performing stereotactic procedures. It also contains quality con-trol (QC) forms and data sheets that are useful for all stereotactic breast biopsy providers. QC testing should be performed and documented whether or not a facil-ity is accredited.
It is extremely important that stereotactic units be correctly calibrated and, as with any other radiologic equipment, meet specific state-regulated radiation standards for use on patients. The correct calibration ensures targeting accuracy. If the calibration is off by 5 mm, the targeting and subsequent sampling also will be off. The MQSA manual contains a data sheet for accurate testing of localization. This is a daily check to verify that targeting calibration is accurate. Calibration checks are dictated by each manufactur-er’s procedure. Most systems use a specific needle to visually check for accuracy. It is important that tech-nologists inspect the dedicated needle for straight-ness prior to the calibration check. Warped or bent needles can cause sampling errors that would result in an incorrect calibration check.

CEBREAST BIOPSY TARGETING
78M September/October 2010, Vol. 82/No. 1 RADIOLOGIC TECHNOLOGY
. . . . . . . . . . . . . . . . . . . . . . . . . . . . . . . . . . . . . . . . . . . . . . . . . . . . . . . . . . . . . . . . . . . . . . . . . . . . . . . . . . . . . . . . . . . . . . . . . .
Published October 24, 2000. Assessed January 2, 2010.5. American College of Radiology. BI-RADS assessment catego-
ries. ACR website. www.acr.org/SecondaryMainMenuCategories/quality_safety/BIRADSAtlas/BIRADSAtlasexcerptedtext/BIRADSMammographyFourthEdition/Assessment CategoriesDoc1.aspx. Accessed July 1, 2010.
6. Johnson NB, Collins LC. Update on percutaneous needle biopsy of nonmalignant breast lesions. Adv Anat Pathol. 2009;16(4):183-195.
7. Needle biopsy best for breast cancer diagnosis. AuntMinnie website. www.auntminnie.com/index.asp?Sec=sup&Sub=wom&Pag=dis&ItemId=87538. Accessed October 8, 2009.
8. Bassett LW. Options in breast biopsy. Imaging Economics website. www.imagingeconomics.com/issues/articles /2002-03_05.asp. Published March 2002. Accessed January 2, 2010.
9. Gordon P. International Society of Breast Pathology. How to effectively sample non-palpable breast lesions radio-logic/pathologic correlation. 2004 annual meeting hand-out. United States and Canadian Academy of Pathology website. www.uscap.org/site~/93rd/companion11h1.htm. Accessed January 3, 2010.
10. American College of Radiology. ACR practice guide-lines for the performance of stereotactically guided breast interventional procedures. www.acr.org/SecondaryMainMenuCategories/quality_safety/guidelines/breast/stereotactically_guided_breast.aspx. Revised 2009. Accessed December 27, 2009.
11. Bolmgren J, Jacobson B, Nordenstrom B. Stereotaxic instrument for needle biopsy of the mamma. AJR Am J Roentgenol. 1977;129(1):121-125.
12. Andolina VF, Lillé SL, Willison KM. Mammographic Imaging: a Practical Guide. 2nd ed. Baltimore, MD: Lippincott Williams & Wilkins; 2001:335-336.
13. Berg WA, Arnoldus CL, Teferra E, Bhargavan M. Biopsy of amorphous breast calcifications: pathologic outcome and yield at stereotactic biopsy. Radiology. 2001;221(2):495-503.
14. Margolin FR, Kaufman L, Jacobs RP, Denny SR, Schrumpf JD. Stereotactic core breast biopsy of malignant calci-fications: diagnostic yield of cores with and cores with-out calcifications on specimen radiographs. Radiology. 2004;233(1):251-254.
15. Carr JJ, Hemler PF, Halford PW, et al. Stereotactic local-ization of breast lesions: how it works and methods to improve accuracy. Radiographics. 2001;21(2):463-473.
16. Parallax. Berkeley Center for Cosmological Physics web-site. http://bccp.lbl.gov/Academy/pdfs/Parallax.pdf. Accessed December 26, 2009.
17. Parallax. TheFreeDictionary.com. http://medical-diction ary.thefreedictionary.com/parallax. Accessed December 26, 2009.
18. Bober SE, Russell DG. Increasing breast tissue depth
The Future of Breast BiopsyAlthough percutaneous breast biopsy techniques
have remained a standard for some time, there have been continuous improvements made to tissue inser-tion devices used to internally mark the biopsy site and to biopsy devices that help extract larger biopsy samples. The current limitations of enclosed MR sys-tems and short injection threshold tend to limit its use, but improvements in biopsy devices compatible for use with MR equipment and in breast coils may support increased use of MR guidance. Positron emission mam-mography using positron emission tomography radio-pharmaceuticals and a modified prone table also may prove effective for certain breast lesions.36
The 3-D localization of breast lesions using digital breast tomosynthesis (DBT) may change the way ste-reotactic breast biopsy is performed. This would first require widespread implementation of DBT.
ConclusionIncreasing the use of percutaneous breast biopsy
when appropriate continues to be a challenge. Advances continue to be made to improve breast imaging, 3-D reconstructions for biopsy targeting, biopsy instruments that make tissue removal easier and more accurate and markers that will remain in the biopsy location.
It takes a practiced and skilled team to accomplish successful stereotactic breast biopsies. Familiarity with the equipment needed to accomplish a successful biopsy is essential. This includes understanding how individual stereotactic units calculate their targeting coordinates to prevent targeting errors. Verifying that the correct tar-get location is entered into the computer before needle insertion can help to avoid sampling errors.
References1. Overview of breast cancer diagnosis decision process.
Imaginis website. www.imaginis.com/breast-health/over view-of-breast-cancer-diagnosis-decision-process. Updated May 4, 2008. Accessed January 2, 2010.
2. Breast biopsy. MayoClinic.com. www.mayoclinic.com/health/breast-biopsy/MY00301. Updated August 8, 2009. Accessed December 26, 2009.
3. Breast cancer guide. Breast cancer: minimally invasive breast biopsy. WebMD website. www.webmd.com/breast-cancer/guide/minimally-invasive-biopsy. Accessed January 5, 2010.
4. de Paredes ES. Patient selection and care for percutaneous breast biopsy. Radiologyweb website. www.radiologyweb.com/new_direction/ii/oct00/esdp-oct00-ii-bio.shtml.

CEDIRECTED READING
. . . . . . . . . . . . . . . . . . . . . . . . . . . . . . . . . . . . . . . . . . . . . . . . . . . . . . . . . . . . . . . . . . . . . . . . . . . . . . . . . . . . . . . . . . . . . . . . . .
79MRADIOLOGIC TECHNOLOGY September/October 2010, Vol. 82/No. 1
during stereotactic needle biopsy. AJR Am J Roentgenol. 2000;174(4):1085-1086.
19. Georgian-Smith D, D’Orsi C, Morris E, Clark CF Jr, Liberty E, Lehman CD. Stereotactic biopsy of the breast using an upright unit, a vacuum-suction needle, and a lateral arm-support system. AJR Am J Roentgenol. 2002;178(4):1017-1024.
20. Fehr MK. Limitations of minimally invasive breast biopsy. Recent Results Cancer Res. 2009;173:149-157.
21. Deurloo EE, Gilhuijs KG, Schultze Kool LJ, Muller SH. Displacement of breast tissue and needle devia-tions during stereotactic procedures. Invest Radiol. 2001;36(6):347-353.
22. Rogers LW. Breast biopsy: a pathologist’s perspec-tive on biopsy acquisition techniques and devices with mammographic-pathologic correlation. Semin Breast Dis. 2005;8(3):127-137.
23. Darling ML, Smith DN, Lester SC, et al. Atypical ductal hyperplasia and ductal carcinoma in situ as revealed by large-core needle breast biopsy: results of surgical exci-sion. AJR Am J Roentgenol. 2000;175(5):1341-1346.
24. Bernaerts A, De Schepper A Jr, Van Dam P, Pouillon M. Clip migration after vacuum-assisted stereotactic breast biopsy: a pitfall in preoperative wire localization. JBR-BTR. 2007;90(3):172-175.
25. Burnside ES, Sohlich RE, Sickles EA. Movement of a biopsy-site marker clip after completion of stereotactic directional vacuum-assisted breast biopsy: case report. Radiology. 2001;221(2):504-507.
26. Costa D, Esserman L, Kusnick C, et al. Effect of image guidance modality on accuracy of breast biopsy marker placement after 11 gauge directional vacuum-assisted biopsy: multi-site study. AJR Am J Roentgenol. 2003;180(3):84.
27. Kass R, Kumar G, Klimberg VS, et al. Clip migration in stereotactic biopsy. Am J Surg. 2002;184(4):325-331.
28. Parikh J. Ultrasound demonstration of clip migration to skin within 6 weeks of 11-gauge vacuum-assisted stereotac-tic breast biopsy. Breast J. 2004;10(6):539-542.
29. Harris AT. Clip migration within 8 days of 11-gauge vacuum-assisted stereotactic breast biopsy: case report. Radiology. 2003;228(2):552-554.
30. Liebens F, Carly B, Cusumano P, et al. Breast cancer seed-ing associated with core needle biopsies: a systemic review. Maturitas. 2009;62(2):113-123.
31. Lee SG, Piccoli CW, Hughes JS. Displacement of micro-calcifications during stereotactic 11-gauge directional vacuum-assisted biopsy with marking clip placement: case report. Radiology. 2001;219(2):495-497.
32. Hendrick RE, Dershaw DD, Kimme-Smith C, et al. Stereotactic Breast Biopsy Quality Control Manual. Merrifield, VA: American College of Radiology; 1999.
33. Liberman L, Benton CL, Dershaw DD, et al. Learning curve for stereotactic breast biopsy: how many cases are enough? AJR Am J Roentgenol. 2001;176(3):721-727.
34. American College of Radiology. Stereotactic breast biopsy accreditation program requirements. www.acr.org/accred itation/stereotactic/stereotactic_breast_reqs.aspx. Revised August 11, 2009. Accessed January 4, 2010.
35. The American Society of Breast Surgeons. Performance and practice guidelines for stereotactic breast procedures. www.breastsurgeons.org/statements/PDF_Statements/Perf_Guidelines_Stereo.pdf. Accessed January 13, 2010.
36. Raylman RR, Majewski S, Weisenberger AG, et al. Positron emission mammography-guided breast biopsy. J Nucl Med. 2001;42(6):960-966.
Pat Baldwin, AA, R.T.(R)(M), has been a registered radiologic technologist since 1970, after receiving her associate degree from Fullerton College in California and completing an internship at the University of California Irvine Medical Center in Orange. She has experience in diagnostic radiol-ogy, nuclear medicine and special procedures. Ms Baldwin eventually specialized in mammography, working in radiol-ogy offices, hospitals and outpatient centers, as well as with a medical imaging company as a clinical education specialist. Ms Baldwin has contributed to mammography continuing education through in-house and on-site clinical education and seminar presentations. Since retiring in 2006, she has served the ASRT as a content reviewer.
Reprint requests may be sent to the American Society of Radiologic Technologists, Communications Department, 15000 Central Ave SE, Albuquerque, NM 87123-3909, or e-mail [email protected].
©2010 by the American Society of Radiologic Technologists.

Directed Reading Continuing Education Quiz
80M September/October 2010, Vol. 82/No. 1 RADIOLOGIC TECHNOLOGY
Continued on next page
Breast Biopsy Targeting Techniques
To receive Category A+ continuing education credit for this Directed Reading, read the preceding article and circle the correct response to each statement. Choose the answer that is most correct based on the text. Transfer your
responses to the answer sheet on Page 86M and then follow the directions for submitting the answer sheet to the American Society of Radiologic Technologists. You also may take Directed Reading quizzes online at www.asrt.org. Effective October 1, 2002, new and reinstated members are ineligible to take DRs from journals published prior to
their most recent join date unless they have purchased a back issue from ASRT. Your access to Directed Reading
quizzes for Continuing Education credit is detemined by your area of interest. For access to other quizzes, go to
www.asrt.org/store.
*Your answer sheet for this Directed Reading must be received in the ASRT office on or before this date.
#10805-03Expiration Date:October 31, 2012*Approved for 2.0Cat. A+ CE credits
1. On average, _______ of 1000 women screened with mammography are recalled for follow-up.a. 20b. 50c. 100d. 300
2. What is the defi nition of BI-RADS category 5?a. high likelihood of malignancyb. biopsy-proven malignancyc. negatived. benign fi nding
3. Which of the following lesions would be best biopsied surgically?a. microcalcifi cationsb. small lesionsc. radial scarsd. fi broadenomas
4. Of the initial diagnostic breast biopsies performed in the United States, _______ % are open surgical biopsies.a. 2b. 10c. 35d. 80
5. Why is fi ne-needle aspiration biopsy performed less in the United States than in other countries?a. Many parts of North America lack qualifi ed
cytopathologists.b. There is no standard way to fi x retrieved fl uid.c. Radiologists have been unable to achieve
proper techniques to obtain adequate fl uid.d. It causes too much pain for the patient.
6. What is discordant diagnosis?a. when the radiology report’s assessment differs
markedly from the actual histology diagnosisb. a diagnosis of fi brocystic changesc. when the radiology report is exactly the same
as the expected histology diagnosisd. when the biopsy attempt has failed

81MRADIOLOGIC TECHNOLOGY September/October 2010, Vol. 82/No. 1
Directed Reading Continuing Education Quiz
7. The approximate fi eld of view for most stereotactic equipment is _______ cm.a. 2 x 3 b. 5 x 5c. 8 x 10d. 10 x 12
8. _______ is preferred for patient comfort over stereotactic guidance.a. Open surgical biopsyb. Magnetic resonance imagingc. Computed tomographyd. Ultrasound
9. Small masses, architectural distortion and microcalcifi cations may not be demonstrated as well using ultrasound as with stereotactic guidance. a. trueb. false
10. Which of the following is a patient less likely to experience on a prone table for breast biopsy vs an upright unit?a. neck painb. back painc. rib paind. vasovagal reaction
11. An advantage of upright stereotactic systems over prone table systems is:a. upright systems cause fewer vasovagal reac-
tions.b. there is greater source-to-image distance with
upright systems.c. the patient cannot see the procedure.d. the upright equipment usually is less expen-
sive.
12. The fi rst automated large-core gun was introduced in Sweden in _______ and adapted for use on a prone table in the United States by _______ .a. 1977; Kopansb. 1982; Kopansc. 1977; Parkerd. 1982; Parker
13. All of the vacuum-assisted devices, except the _______ -gauge probes, are large enough to deploy a marker using the probe channel for guidance.a. 7b. 9c. 11d. 14
14. All of the following are breast biopsy devices except the:a. hook wire.b. radiofrequency device.c. vacuum-assisted device.d. core needle.
15. The _______ coordinate system uses H, V and D angle references.a. Cartesianb. polarc. parallaxd. bias
16. Most prone and upright stereotactic systems use the _______ coordinate system to obtain target calculations.a. Cartesianb. polarc. parallaxd. bias
Continued on next page

Directed Reading Continuing Education Quiz
82M September/October 2010, Vol. 82/No. 1 RADIOLOGIC TECHNOLOGY
Continued on next page
22. According to a retrospective study by Margolin et al, a _______ is essential to document microcalcifi cation retrieval.a. postfi re stereotactic pairb. prefi re stereotactic pairc. scout imaged. specimen radiograph
23. If the 0º scout image is used as part of the stereotactic pair, this:a. reduces the angle between the 2 projections
from 30º to 15º. b. has no effect.c. increases the total projection angle from 15º
to 30º.d. makes the patient more comfortable.
24. Targeting bias is:a. 2 different angles.b. triangulation of the target.c. an inaccurate result of targeting.d. 2 paired images.
25. What is an example of binocular parallax shift?a. viewing an analog speedometer from the pas-
senger’s position vs the driver’s positionb. using only one eye to view an object and mov-
ing your head while doing soc. putting your thumb up in front of an object
and viewing it with one eye, then the other eye, and noticing that the object shifts in rela-tion to your thumb
d. closing one eye before moving an object
26. All stereotactic units use the same reference points.a. trueb. false
17. A pair of stereotactic images is obtained after the scout image has located the lesion or microcalcifi cations and they are within the _______ of the window.a. center halfb. right halfc. center thirdd. right third
18. On prefi re images, the tip of the biopsy needle should appear: a. 1 cm away from the lesion.b. 0.5 cm away from the lesion.c. at the lesion.d. just past the lesion.
19. When using a prone table, lesions in the axillary tail of the breast can be made more accessible by: a. bringing the patient’s contralateral arm
through the table opening along with the breast.
b. bringing the patient’s ipsilateral arm through the table opening along with the breast.
c. placing the patient’s ipsilateral arm over her head.
d. turning the patient in a slightly oblique posi-tion.
20. Pleomorphic microcalcifi cations have a suggested _______ % malignancy rate.a. 11b. 21c. 41d. 61
21. When targeting microcalcifi cations, it is important to focus on _______ microcalcifi cation(s) within a group.a. allb. several differentc. one specifi cd. none of the

83MRADIOLOGIC TECHNOLOGY September/October 2010, Vol. 82/No. 1
Directed Reading Continuing Education Quiz
31. According to the article, part of the reason for the difference in image quality in stereotactic images vs screening mammograms is:a. lack of regulation for stereotactic breast
biopsy.b. operator error.c. a shorter source-to-image distance in stereo-
taxis.d. less compression in stereotaxis, particularly
because of the opening in the targeting win-dow.
32. The migration of markers caused by breast re-expansion after release of compression is referred to as the _______.a. parallax shiftb. accordion effectc. triangulation effectd. stroke margin
27. In breast biopsy, stroke is the:a. distance the biopsy needle travels from the
prefi re to postfi re positions.b. distance remaining for the probe to travel
before exiting the breast.c. length of the biopsy needle.d. length of the sampling notch.
28. _______ should be the fi rst alternative to correct inadequate stroke margin.a. Putting in an upside-down biopsy paddle
insertb. Using a breast bolsterc. Administering additional anesthesiad. Repositioning the patient
29. Incorrect targeting on one or both projections in most cases usually causes an error on the _______ axis.a. horizontalb. verticalc. depthd. parallel
30. If the x-ray tube does not reach its full stereotactic angled position, the result will be _______ .a. an incorrect calculationb. nothing c. an alarm sounding in the equipmentd. shutting down of the system
For your convenience, the evaluation and answer sheet for this Directed Reading now immediately follow the quiz. Just turn to Pages 85M and 86M.

©2010 ASRT. All rights reserved.
Printed answer sheets are now located after the quiz questions. These can be mailed to ASRT at the address on the answer sheet.
Log on. Take Quiz. Score!
essentialeducation
It’s Easy To Start: Visit www.asrt.org/myasrt. Log in. Select My Directed Readings. Select the answer sheet.
Take Your Directed Reading Quizzes Online Anytime!
www.asrt.org/myasrt


✁
Carefully cut or tear here.

MY PERSPECTIVE. . . . . . . . . . . . . . . . . . . . . . . . . . . . . . . . . . . . . . . . . . . . . . . . . . . . . . . . . . . . . . . . . . . . . . . . . . . . . . . . . . . . . . . . . . . . . . . . . . . . . . . . . . .
87RADIOLOGIC TECHNOLOGY September/October 2010, Vol. 82/No. 1
How To Grow a TechnologistWe live in times of plenty — plenty of
applicants, plenty of graduates, plenty of highly skilled technologists, and no worries about filling any open positions. But I have been a manager long enough to remember having a position open for 18 months and filling it with the first applicant who had a pulse! During times of plenty it is easy to forget that things will not always be this way and hard to remember that we have an obligation to help grow future radiologic technolo-gists. I know that times will come again when applicants will be scarce and our hospitals and imaging centers will suf-fer, so in our department we have a 3-pronged approach to ensuring a future with many dedicated young people seek-ing health care careers.
First, we don’t limit job shadowing to 1 day a year, but have an open-door policy and open arms for anyone inter-ested in learning about careers in imag-ing. At Roper St Francis Healthcare we offer one-time educational experiences to introduce students aged 14 years and older and interested adults to a particular health care career by pairing them with an employee for a period of 8 hours or less. The student “shadows” an employee as he or she performs normal activities. Students are allowed to observe, ask ques-tions and gain first-hand knowledge of a career and the workplace environment.
If they are interested in an experience lasting longer than 8 hours, they are invited to apply through our volunteer department and attend a volunteer orien-tation. Each student signs a job shadow request form that lists his or her rights and responsibilities. Students understand that they must be supervised at all times by their mentor and they must respect the confidentiality of the employees and patients at Roper St Francis Healthcare. Parents or guardians must sign for stu-dents younger than 14 years old. Each mentor agrees to supervise and be responsible for his or her student during the job shadowing experience.
Second, our staff attends many career fairs at local junior and senior high schools. We have created a PowerPoint presentation (Microsoft Corporation, Redmond, Washington) describing imag-ing careers and it is full of interesting images and photos of our staff. Living in Charleston, South Carolina, we have some opportunities for unusual images and the students’ favorite is always the foot with a shark-sized bite out of the heel! Students who have family mem-bers in health care careers or who have experienced a health crisis in either their own lives or with a close family member always express the most interest, but we believe it is important to make sure that all students are aware that health care careers do not begin with “nurse” and end with “physician.” We tell the students that imaging careers marry an opportu-nity to make a difference in people’s lives and the use of really cool technology.
Especially now, when jobs are hard to come by and students see their parents, older siblings, other family members and friends struggling to find and keep worthwhile work, I think it is important to give them the message that careers in health care will be vital and necessary throughout their lives. Someone across the world may be able to interpret medi-cal images and diagnose diseases, but technologists always will be needed to put their hands on patients.
Finally, we are extremely proud of our SCRUBS (Students Can Really Use Bedside Skills) program. Students aged 14 to 16 can enroll in either a week-long summer camp or a quarterly evening session. The imaging department spon-sors one of the quarterly sessions, during which more than 50 students are sepa-rated into groups and rotated through each of our modalities. A department employee volunteers to demonstrate the modality and talk about his or her indi-vidual career. During the summer camp session, we host the students one morn-ing and also participate in other parts of
Lorraine M McCurdy, BHS, R.T.(R)(M), RDMS, CRA, is the imaging manager at Roper St Francis Healthcare in Charleston, South Carolina.
“My Perspective” features guest editorials on topics in the radiologic sciences. Opinions expressed by writers do not necessarily reflect those of the ASRT. Those interested in writ-ing an editorial should e-mail [email protected].

MY PERSPECTIVE
88 September/October 2010, Vol. 82/No. 1 RADIOLOGIC TECHNOLOGY
. . . . . . . . . . . . . . . . . . . . . . . . . . . . . . . . . . . . . . . . . . . . . . . . . . . . . . . . . . . . . . . . . . . . . . . . . . . . . . . . . . . . . . . . . . . . . . . . . . . . . . . . . . .
the program. Students especially love the behind-the-scenes tours of the operations plant, kitchens and supply areas. Our facility’s educator helps teach the students cardiopulmonary resuscitation and first aid. The stu-dents all wear special scrub tops identifying them as SCRUBS camp members and they love to collect the dif-ferent colors offered each year. Other quarterly sessions have included tours of the operating rooms, where the students practice sterile techniques and see samples of surgically removed tissues; visits to the nursery and labor and delivery department; and nursing skills classes.
As you can see, we dedicate many hours to the important task of creating interest in health care careers because we believe that it is vital to our future to have talented and interested students thinking about health care careers. Our staff is dedicated to mentor-ing and they are cheerleaders for their careers. As an added bonus, they encourage valuable support staff to think about moving up the career ladder. For example, we have an extremely talented special procedures
technologist who began his career as a transporter, and a computed tomography technologist who originally worked as a clerk. Teaching and mentoring are projects our entire department has embraced and we encour-age other departments to dedicate part of their valu-able time to this important cause. ◆

RE: REGISTRY. . . . . . . . . . . . . . . . . . . . . . . . . . . . . . . . . . . . . . . . . . . . . . . . . . . . . . . . . . . . . . . . . . . . . . . . . . . . . . . . . . . . . . . . . . . . . . . . . . . . . . . . . . .
89RADIOLOGIC TECHNOLOGY September/October 2010, Vol. 82/No. 1
300 000 and CountingThe American Registry of Radiologic
Technologists (ARRT) recently topped 300 000 registered technologists! This col-umn examines how we got there and when we expect to reach the next milestone.
1922 to 2010The first individual to earn certi-
fication and registration was Sister M Beatrice Merrigan of St Anthony’s Hospital in Oklahoma City, Oklahoma, who earned her credential in November 1922. By the end of that decade there were 643 registered technologists. Growth continued at a slow rate until the first of the baby boom generation (those born between 1946 and 1964) began entering the profession in the 1960s. By the end of the 1960s, ARRT had reached the 50 000 milestone. By the end of the 1970s, the number topped 100 000. We reached the 200 000 mark by the mid 1990s. The rate of increase clearly accelerated in the second half of ARRT’s existence, as illustrated by the fact that it took about 60 years to reach the first 100 000, only 15 years to reach 200 000, and another 15 years to reach 300 000 (see Figure 1).
Will this rate of increase continue into the future? If the recent rate of increase
was simply extrapolated, one might con-clude that there will be 400 000 R.T.s in 2025 and 500 000 in 2040. The actual growth pattern will depend on demo-graphic factors, technological develop-ments, economic conditions and the regulatory environment, to name just a few of the important forces. These factors make projections more than a few years out very uncertain.
DemographicsThe “graying” of the U.S. population
is well publicized. The baby boomers, who compose a significant percent-age of both the U.S. population and the R.T. population, have a significant effect on both. Baby boomers make up about 41% of all R.T.s. The average age of the R.T. population continues to increase, due in large part to the aging of the baby boomers. In 1991 the aver-age age of the R.T. population was 37; in 2010 it had increased by 6 years to 43 years old.
Will the number of new R.T.s be enough to offset those who retire and drop registration? If not, the rate of growth in the R.T. population will decrease. The trend in the number of newly minted R.T.s provides an indica-tion of future growth. After growing from 2000 to 2006, the numbers of first-time examinees leveled off and then began to fall during the past 4 years. The number of first-time radi-ography examinees during this period illustrates this trend, with the leveling off occurring at about 14 000 per year (see Figure 2).
As Figure 3 illustrates, the number of radiography examinees has gone through recurring cycles historically. Note particularly that although the num-ber of examinees decreases over some periods, the overall trend in volume is up. That is, for each new cycle the highs are higher than the previous cycle’s highs and the lows are higher than the last cycle’s lows. Similar cycles are seen for
Jerry Reid, PhD, is the regular contributing colum-nist for RE: Registry, which addresses issues concerning the American Registry of Radiologic Technologists. Dr Reid is executive director of the Registry. Questions or comments may be sent to his attention at the ARRT, 1255 Northland Drive, St Paul, MN 55120-1155.
Figure 1. Total number of registered technologists by year.

RE: REGISTRY
90 September/October 2010, Vol. 82/No. 1 RADIOLOGIC TECHNOLOGY
. . . . . . . . . . . . . . . . . . . . . . . . . . . . . . . . . . . . . . . . . . . . . . . . . . . . . . . . . . . . . . . . . . . . . . . . . . . . . . . . . . . . . . . . . . . . . . . . . . . . . . . . . . .
growth is across a 10-year period, the 400 000 mark would not be reached within the 15-year period that it took to go from 100 000 to 200 000 and from 200 000 to 300 000. The best guess is that the number of R.T.s will continue to grow, although perhaps not at the same rate as seen in recent decades. ◆
nuclear medicine and radiation therapy. If this overall upward trend continues, the growth rate in the R.T. population could be sustained.
DemandThere can be no doubt
that as the average age of the U.S. population increases, the need for health care services will grow. The Bureau of Labor Statistics (BLS) is tasked with predicting demand for various professionals based on projected demand for services. For radiologic technologists, the BLS esti-mated that in 2008 there were 214 700 technologists employed and projected that 251 000 technologists will be needed by 2018. This would be an increased need for 37 000 addi-tional technologists or 17% growth. If the 17% BLS growth estimate is used, then ARRT’s 300 000 R.T.s will grow to about 350 000 by 2018, which is only half-way to the next 100 000. Because BLS’ predicted
Figure 2. Number of radiography examinees by year, 2000-2009.
Figure 3. Number of radiography examinees by year, 1980-2009.

LITERATURE REVIEW. . . . . . . . . . . . . . . . . . . . . . . . . . . . . . . . . . . . . . . . . . . . . . . . . . . . . . . . . . . . . . . . . . . . . . . . . . . . . . . . . . . . . . . . . . . . . . . . . . . . . . . . . . .
A Guide to Standardizing MR Imaging
91RADIOLOGIC TECHNOLOGY September/October 2010, Vol. 82/No. 1
Literature Review features contributions from volunteer writers from the radiologic sciences, reviewing the latest in publications and communication materials produced for the profession. Sugges tions and questions should be sent to [email protected].
readers are directed to “Plot on central sagittal plane, line through anterior and posterior margin of the corpus callosum (parallel to a line running through the anterior and posterior commissure); [complete] enough scans to delineate the brain completely from the vertex to the cerebellum usually to the line of the fora-men magnum.” This knowledge makes the technologist more professional and independent in the workplace by famil-iarizing him or her with what is expected and needed to complete the exam, there-by minimizing wasted time.
I found the “tips and tricks” most useful, even for experienced technolo-gists. The section includes ideas for difficult patients. For example, “In patients with increased kyphosis, place cushions under the pelvis as well; in those with neck problems, it may be necessary to raise the head somewhat and cushion it.” Great stuff! In the angiography sections, there are even suggestions for giving bolus injections, including flow rates. In addition, ana-tomical illustrations aid in understand-ing positioning and anatomy.
The appendix alone is truly a treasure. Included are parameters for different field strengths discussed in an easy- to-understand way. This is important infor-mation that can be accessed quickly, as when changing between machines of differing strength, without having to read a lengthy paragraph. Another chart displays scan parameters and their effects. For instance, if the field of view is decreased, how will that affect resolu-tion, signal-to-noise ratio and acquisition time? Also included in the appendix is an artfully and thoughtfully presented chart of MR acronyms for the major manu-facturers (Siemens, GE, Philips, Hitachi and Toshiba). For instance, Siemens calls a steady-state free precession PSIF; GE calls it SSFP; Philips refers to it as T2-FFE; and Hitachi uses the term Time-Reversed SARGE. This handy chart could be extremely helpful when changing jobs
MRI PARAMETERS AND
POSITIONING. 2nd ed. Moeller
T, Reif E. 2010. 341 pgs. Thieme
Publishing. www.thieme.com. $39.95.
What a clever and practical book is MRI Parameters and Positioning. This is the ideal book for the begin-ning magnetic resonance (MR) imaging technol-ogist and makes a great textbook for the classroom or independent learner. It also is helpful for standardizing protocols wherever MR imaging is being per-formed, rather like Merrill’s Atlas does for radiography. As the authors point out, “It is only through standardization that the quality of diagnostic imaging will improve.” Protocols are presented for every region of the body in a simple, concise manner. In addition, the latest in MR angiography, MR cholangiogra-phy, MR urography and MR colonogra-phy are included.
The organization of MRI Parameters and Positioning makes it easy to access information on any area of the body quickly and efficiently. Each area begins with no-nonsense patient preparation guidelines, such as “Offer the patient ear plugs or ear protectors.” These are important little instructions that we may all forget when starting out. The guidelines are followed by important but simple directives for positioning, such as “Secure the head in the head coil, cush-ion the legs.”
Sequences and protocols follow. I found this section unique and valuable in that it explains in detail important infor-mation for scanning. As an example, for an axial sequence of the brain and skull,

LITERATURE REVIEW
92 September/October 2010, Vol. 82/No. 1 RADIOLOGIC TECHNOLOGY
. . . . . . . . . . . . . . . . . . . . . . . . . . . . . . . . . . . . . . . . . . . . . . . . . . . . . . . . . . . . . . . . . . . . . . . . . . . . . . . . . . . . . . . . . . . . . . . . . . . . . . . . . . .
and she suggests changes to correct an unacceptable film-screen image.
The author discusses digital radiography (DR) and computerized radiography (CR) and the terminologi-cal and other differences between them. Excellent drawings of histograms help evaluate whether the techniques used in these imaging systems are correct. The author compares density to image brightness and changes needed to correct technical factors. In addi-tion, she emphasizes the same important identifica-tion information and the placement of markers on DR and CR images.
Additional chapters each contain technique charts, excellent examples of correctly positioned and incor-rectly positioned images and criteria to evaluate images. Anatomy is labeled on each image, and breathing instructions are discussed. Information on pediatric and geriatric positioning has been expanded to assist the radiographer with compensatory methods to produce quality images of these patients.
This text is a powerful book with information that is valuable to anyone in radiography. If I had a criticism it would be very minute. That criticism would be offer-ing baseline techniques for density using automatic exposure control settings with little information about actual baseline milliamperage settings.
As an educator who has taught image analysis for many years, I believe this is an excellent reference for educators as well as student radiographers. The textbook also can be used by registered radiographers and even radiology residents. The third edition of this text only improves on prior editions and provides updated infor-mation. I would recommend this book to any radiology program as a reference or textbook for courses.
Debra Ann Durick, MPA, R.T.(M)(CT)University of South Alabama
Department of Radiologic SciencesMobile, Alabama
or manufacturers because these acronyms can be very confusing. Last but not least, the glossary explains all the different terms and acronyms thoroughly.
All in all, I strongly recommend MRI Imaging Param- eters and Positioning. This handy and practical little book will help make the confusing world of MR imaging more readily understandable.
Connie McCready, BA, R.T.(R)(M)(CT)(MR)Retired
Portland, Oregon
RADIOGRAHIC IMAGE ANALYSIS. 3rd ed.
McQuillen-Martensen K. 2010. 570 pgs.
Saunders-Elsevier. www.elsevier.com. $66.38.
In the third edition of this textbook, the author does an excellent job overall of presenting information about how to produce a qual-ity image. The text starts where it all counts — with the patient — and provides a discussion of our professional responsibility to the patient. Ms McQuillen-Martensen reminds us of our duty to produce high-quality radio-graphs using proper posi-tioning and techniques, and explains how to evaluate the images produced. She even goes a little further to list what possibly would constitute the basis for a mal-practice suit. In summary, the author emphasizes the importance of producing quality radiographs and cov-ers all facets of the process.
In each chapter, objectives and terminology used in the chapter are listed and defined. This provides a quick reference for the reader. The beginning of the text discusses image recording, density, contrast, grid ratio, source-to-image distance, markers, peak kilovolts, collimation and distortion. The author progresses to information that is required on an image, the placement of the cassette, the central ray angulation and reasons for the angulation. Radiation protection and other important factors involved in producing a radiograph are emphasized in this chapter. Also in the first chapter, the author discusses the rules or foundation for techni-cal factors required for adequate density and contrast,

ON THE JOB. . . . . . . . . . . . . . . . . . . . . . . . . . . . . . . . . . . . . . . . . . . . . . . . . . . . . . . . . . . . . . . . . . . . . . . . . . . . . . . . . . . . . . . . . . . . . . . . . . . . . . . . . . .
Skull Fracture Diagnosis: A Case Study
93RADIOLOGIC TECHNOLOGY September/October 2010, Vol. 82/No. 1
Victor N White, MSRS, R.T.(R), CHES, is director of the medical radiography program at the ECPI College of Technology in Greensboro, North Carolina, and a doc-toral candidate in health education at Southern Illinois University in Carbondale.
The study began at 10:28 am and ended at 10:35 am. The patient did not complain of any difficulties and was taken by stretcher back to the ED. The CT images were evaluated by the ED physician, who assessed the CT scan as negative. Figure 2 shows slice 4 enlarged by the technologist for the ED physi-cian’s benefit.
An immediate radiologist consult was not possible because telephone line transmission was inactive and the radi-ologist had not arrived yet to view the CT hard copy images.
The ED physician told the ED nurse to give the patient and his mother head injury instructions and ask them to call back immediately if there were any change in the patient’s condition.4 The patient and his mother left the ED. At around 11:15 am, they returned, with the patient complaining of posterior head pain and the mother demanding a more thorough evaluation of her son’s condition.
The technologist who had performed the CT scan mentioned to the ED physi-cian that 2 views of the skull could be performed to correlate with the CT to improve diagnostic efficacy.5 The ED physician agreed and ordered a 2-view skull series. The radiographer produced
An 18-year-old white male patient presented to a small Midwestern hospi-tal at about 10 am complaining of right posterior head pain. The patient had fallen down the stairs at his residence around 2 am, then returned to bed. He woke up later that morning complain-ing of headache, nausea and general malaise. The patient’s mother brought him to the local emergency department (ED) for evaluation. The patient was checked into the ED and evaluated by the physician on duty. The ED physician examined the patient and ordered a CT scan of the brain without contrast to include soft tissue (ie, brain) and bony window settings (ie, skull).1
A CT scan was performed on a GE LightSpeed (GE Healthcare, Chalfont St Giles, UK). A lateral CT scout image was obtained and used to plan the study.1 Slices 1 through 10 were done at 5 mm cuts and slices 11 through 18 were done at 10 mm cuts.2 Window width settings for the soft-tissue structures were 146 and window level settings were +47. Window width setting for the bone windows was 2000 and window level setting was +600.1 The scan was done from the base of the skull through the skull cap.2,3 Figure 1 demonstrates the CT lateral scout image and scan data.2
Figure 1. Computed tomography lateral head scan and scan data.

ON THE JOB
94 September/October 2010, Vol. 82/No. 1 RADIOLOGIC TECHNOLOGY
. . . . . . . . . . . . . . . . . . . . . . . . . . . . . . . . . . . . . . . . . . . . . . . . . . . . . . . . . . . . . . . . . . . . . . . . . . . . . . . . . . . . . . . . . . . . . . . . . . . . . . . . . . .
a right lateral projection and an anteroposterior axial Towne projection corresponding to the area of the patient’s headache in the right posterior region of the skull.5,6
Both of these images were taken to the ED physician. The ED physician believed that the Towne projection demonstrated a linear density on the right occipital
Figure 2. Slice 4. Bone window image.
Figure 3. Right lateral skull radiograph.
Figure 4. Anteroposterior axial Towne projection clearly demonstrating a skull fracture in the right occipital region of the skull.
region of the skull that was absent in the left occipital region.4,7 The ED physician said this could be a fracture. The radiologist arrived at this time and looked at the CT brain scan and radiographs of the skull (see Figures 3 and 4).
The radiologist indicated that there was an approxi-mately 9 cm linear density in the right occipital region of the skull that was demonstrated on the Towne projec-tion and the previous CT brain study. The radiologist communicated the diagnosis to the ED physician, who then made arrangements to have the patient flown to a major trauma center for neurosurgical consultation.
It is noteworthy that while CT still is considered the “gold standard” in brain trauma imaging, plain films can be valuable in conjunction with CT for assessing patients with traumatic head injuries.5,6 ◆
References1. Ballinger P, Frank E. Merrill’s Atlas of Radiographic Positions
and Radiologic Procedures. 10th ed. St Louis, MO: Mosby; 2003:132, 331-340.

95RADIOLOGIC TECHNOLOGY September/October 2010, Vol. 82/No. 1
. . . . . . . . . . . . . . . . . . . . . . . . . . . . . . . . . . . . . . . . . . . . . . . . . . . . . . . . . . . . . . . . . . . . . . . . . . . . . . . . . . . . . . . . . . . . . . . . . . . . . . . . . . .
2 . Seeram E. Computed Tomography: Physical Principles, Clinical Applications and Quality Control. 2nd ed. Philadelphia, PA: Saunders; 2001:326-333.
3. Madden ME. Introduction to Sectional Anatomy. 1st ed. Philadelphia, PA: Lippincott, Williams and Wilkins; 2001:362.
4. Kowalczyk N, Mace JD. Radiographic Pathology for Technologists. 5th ed. St. Louis, MO: Mosby Elsevier; 2009:338-340.
5. Daffner R. Clinical Radiology. 2nd ed. Baltimore, MD: Lippincott Williams and Wilkins; 1999:495-512.
6 . Bontrager KL, Lampignano JP. Textbook of Radiographic Positioning and Related Anatomy. 6th ed. St Louis, MO: Elsevier Mosby; 2005:385-389.
7. Martensen KQ. Radiographic Image Analysis. 2nd ed. St Louis, MO: Elsevier Saunders; 2006:470-478.

TEACHING TECHNIQUES. . . . . . . . . . . . . . . . . . . . . . . . . . . . . . . . . . . . . . . . . . . . . . . . . . . . . . . . . . . . . . . . . . . . . . . . . . . . . . . . . . . . . . . . . . . . . . . . . . . . . . . . . . .
96 September/October 2010, Vol. 82/No. 1 RADIOLOGIC TECHNOLOGY
Andy Allen, MEd, R.T.(R), is an assistant professor and clinical coordinator in the department of radiologic technology at the University of Louisiana in Monroe.
“Teaching Techniques” dis-cusses issues of concern to educators. The primary focus of the column is innovative and interesting approaches to teach-ing. Comments and suggestions should be sent to [email protected].
GoniometersWhat is a goniometer and what does
it have to do with radiography? This is a question often posed by radiography stu-dents and sometimes technologists alike after hearing the word “goniometer.” Goniometry, derived from the Greek words for angle and measure, is defined as the measurement of angles. A goni-ometer is a device that is used to measure angles. Goniometry is a common practice in the field of occupational therapy, in which a joint’s range of motion is mea-sured for therapeutic assessment. So you probably are still asking, “What does this have to do with radiography?”
Radiography often requires that a patient’s body or body part be manipulated for optimal visualization of anatomy. Radiographers use terms such as angle, oblique, flex and extend to describe this positioning. As a radi-ography instructor, I have noticed a pattern with student radiographers having difficulty with correct oblique positioning and angling of body parts. The problem arises when students are instructed to position the patient or part at a precise degree. Many students are comfortable with positioning or angling at 45° because it is fairly easy to gauge halfway between 0° and 90°. However, students are still esti-mating the amount, and not every student can accurately assess a 45° angle. In addition, not all positioning or angling requirements are exactly 45°. Some examples of this posi-tioning include placing the orbitomeatal line 37° from the table, flexing the knee 20° and obliquing the patient 30° from later-al, just to name a few. It is difficult for many students to obtain this specific amount
of angluation or obliquity. This results in estimating the degree of angulation, thus leading to incorrect positioning and the need for repeat exposures.
This is where the goniometer plays a critical role in helping students obtain that exact degree of angulation and eliminating the need for estimation. In addition to finding angles, most goni-ometers also double as rulers, which can be used for determining exact distances from anatomical landmarks and also can be used to find part thickness of smaller anatomy when calipers are not available.
Older models of goniometers were bulky and made of metal, consisting of a 180° arc and an extendable antenna (see Figure 1). These devices are very effec-tive, but finding one in good condition is rare. They are also considerably more expensive than models that are currently manufactured. Another negative aspect is their size, which usually limits the device to the immediate x-ray room or department. Today’s goniometers used in radiography, sometimes referred to as angle finders, angle rules, or angulators, are small plastic devices that fit in one’s pocket, making them portable and easily accessible. This portability is beneficial to students who rotate through multiple
Figure 1. A metal goniometer.

97RADIOLOGIC TECHNOLOGY September/October 2010, Vol. 82/No. 1
. . . . . . . . . . . . . . . . . . . . . . . . . . . . . . . . . . . . . . . . . . . . . . . . . . . . . . . . . . . . . . . . . . . . . . . . . . . . . . . . . . . . . . . . . . . . . . . . . . . . . . . . . . .
clinical sites during their education. In addition, this type of goniometer is relatively inexpensive and can even be customized with an institution’s name or logo (see Figure 2).
So if this is such a great tool, why aren’t more technologists using it? Over time, a technologist learns how to accurately gauge positioning angles and obliquity from experience. However, a student radiog-rapher is just getting accustomed to positioning. Students emulate what they see technologists do in the clinical setting, and often try to position patients just by estimating. Using a goniometer gives students a way to measure and verify their positioning. With practice and proper instruction, students eventually will be able to accurately position patients without the aid of the goniometer.
The goniometer is not intended to be used as a requirement for learning, but rather as a supple-mental instructional tool for students beginning the profession. If you, as an educator or clinical supervi-sor, notice that students are having difficulty with positioning angles, obliquity, or measurements, goni-ometers may prove to be an invaluable tool to help improve student learning. ◆
Figure 2. A plastic goniometer.

WRITING & RESEARCH. . . . . . . . . . . . . . . . . . . . . . . . . . . . . . . . . . . . . . . . . . . . . . . . . . . . . . . . . . . . . . . . . . . . . . . . . . . . . . . . . . . . . . . . . . . . . . . . . . . . . . . . . . .
98 September/October 2010, Vol. 82/No. 1 RADIOLOGIC TECHNOLOGY
Melissa Jackowski, EdD, R.T.(R)(M), is a clini-cal assistant professor in the division of radiologic science at the University of North Carolina at Chapel Hill and a member of the Radiologic Technology Editorial Review Board.
“Writing & Research” discuss-es issues of concern to writers and researchers and is written by members of the Editorial Review Board. Comments and suggestions should be sent to [email protected].
Writing Conclusions The conclusion is often the most
difficult part of writing a research paper.1-2 The Hamilton College hand-out on conclusions goes so far as to state that “…almost all writers struggle with writing conclusions” because of the fact that this section plays such an important role in an article or research paper.3 Many authors make the mistake of simply restating or summarizing their findings. The conclusion, which is sometimes incorporated into the discussion or may be a stand-alone sec-tion, is much more than a summary. This section should include an analysis of the findings/results, implications for practice, limitations and suggestions for future research. This column discusses the main parts that should be included in a conclusion.
Analysis of Findings/ResultsOne of the main mistakes authors
make when writing conclusions is to summarize the information previously presented. This section should not be a summary, but an analysis or synthesis of the findings/results.1-2 Authors should reflect on the original purpose, problem statement and hypotheses (if applicable) and tie the conclusions back to these. In this section, the author discusses his or her findings in light of previously pub-lished literature. If the paper is a quan-titative research paper, such as survey research, the author should compare his or her findings to similar study findings discussed in the literature review section. If the paper is a qualitative literature review, major agreements and disagree-ments found in the literature should be discussed.4
It is important to note that no new information should be presented in the conclusion.5 This section provides an analysis of what has been discussed. Through this analysis, the author should demonstrate how this work adds to the body of previously published literature. This includes analyzing the literature,
finding themes and drawing conclusions based on the literature, which leads to providing the reader with implications for practice.
Implications for PracticeTo be able to effectively write impli-
cations for practice, an author must answer 2 questions: “So what?” and “Who cares?”1-2 By answering the question “So What?” the author is able to articulate the significance of the research. Here, the author shows the reader the impor-tance of the work and proves that the work is useful and meaningful.2 Once the significance is discussed, it is impor-tant to know “Who cares?” One of the key parts of the conclusion is when the author speaks directly to his or her audi-ence and tells them what they should do based on the findings. This is where research meets practice. The audience is given specific suggestions for changing or enhancing practice based on the find-ings. For instance, if an author conducts a literature review on job satisfaction for an audience of radiology administrators who are interested in retaining employ-ees, the conclusion section should pro-vide the administrators with a succinct list or table of specific actions to take to improve satisfaction and ultimately retain employees. While answering these ques-tions, it is common to point out limita-tions in the study.
LimitationsLimitations are the possible weak-
nesses of the study.6 All research studies have some limitations and they often are dictated by time and budget.7 Creswell gave these examples of limitations6:
■ “The purposive sampling proce-dure decreases the generalizability of findings.”
■ “In this qualitative study, the find-ings could be subject to other inter-pretations.”
Acknowledging study limitations also provides the opportunity to make
. . . . . . . . . . . . . . . . . . . . . . . . . . . . . . . . . . . . . . . . . . . . . . . . . . . . . . . . . . . . . . . . . . . . . . . . . . . . . . . . . . . . . . . . . . . . . . . . . . . . . . . . . . .
3. Hamilton College Nesbitt-Johnston Writing Center. Conclusions. www.hamilton.edu/academics/resource/wc/Conclusions_F’04.PDF. Updated October 2004. Accessed August 2, 2010.
4. The University of Canberra. Writing a literature review. www.canberra.edu.au/studyskills/writing/literature. Accessed August 2, 2010.
5. Hamilton BW. Tips for writing a strong conclusion. http://acc.roberts.edu/NEmployees/Hamilton_Barry/TIPS%20FOR%20WRITING%20A%20STRONG%20CONCLUSION.htm. Updated October 31, 2005. Accessed August 2, 2010.
6. Creswell J. Research Design: Qualitative and Quantitative Approaches. Thousand Oaks, California: Sage Publications; 1994.
7. Walonick DS. Elements of a research proposal and report. www.statpac.com/research-papers/research-proposal.htm#top. Accessed August 2, 2010.
8. University of Southern California Libraries. Limitations of the study — Organizing your social sciences research paper. http://libguides.usc.edu/content.php?pid=83009&sid=616083. Accessed August 2, 2010.
suggestions for future research, which is another important part of writing conclusions.8
Suggestions for Future ResearchThe conclusions sections always should list sugges-
tions for future research. These come from limitations of the study and also from gaps found in the literature. Through the process of writing, an author should become an expert on the topic and have a clear under-standing of what has been published along with what needs to be investigated to add to the body of knowl-edge. Researchers often look to this section of a work to find ideas for research projects. ◆
References1. The Writing Center. Conclusions. University of North
Carolina at Chapel Hill. www.unc.edu/depts/wcweb/handouts/conclusions.html. Accessed August 2, 2010.
2. Holewa R. Strategies for writing a conclusion. St. Cloud State University. matayabas.weebly.com/uploads/3/5/6/4/3564376/conclusion_writing.doc. Updated February 19, 2004. Accessed August 2, 2010.


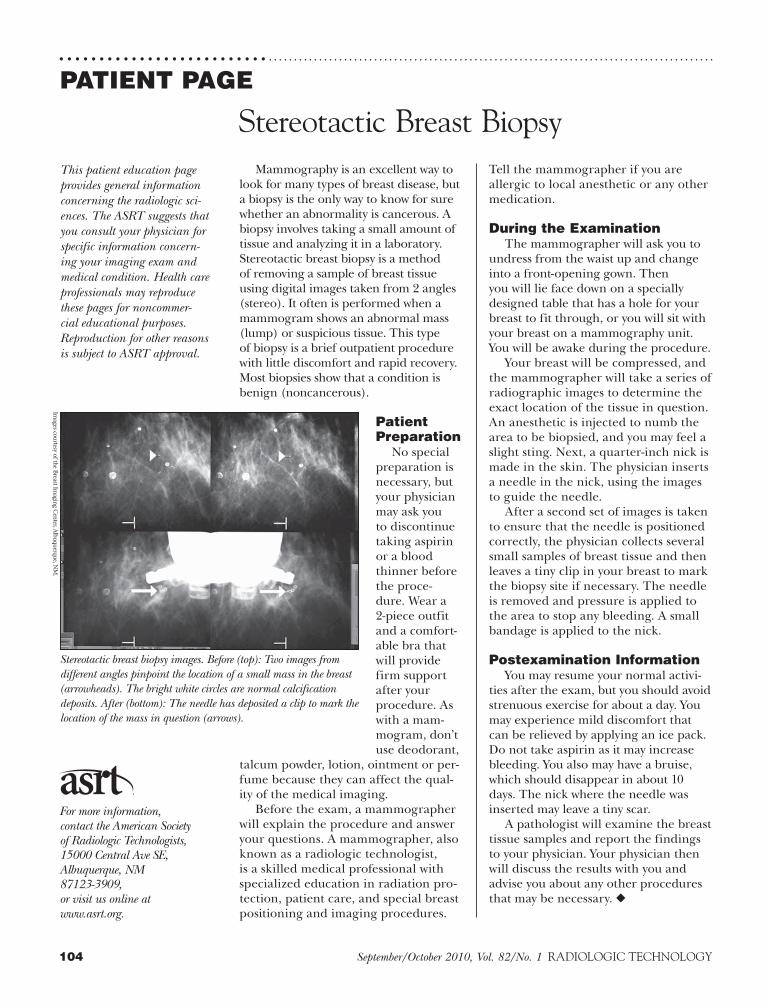
104 September/October 2010, Vol. 82/No. 1 RADIOLOGIC TECHNOLOGY
. . . . . . . . . . . . . . . . . . . . . . . . . . . . . . . . . . . . . . . . . . . . . . . . . . . . . . . . . . . . . . . . . . . . . . . . . . . . . . . . . . . . . . . . . . . . . . . . . . . . . . . . . . . . . . . . . . .
PATIENT PAGE
This patient education page provides general information concerning the radiologic sci-ences. The ASRT suggests that you consult your physician for specific information concern-ing your imaging exam and medical condition. Health care professionals may reproduce these pages for noncommer-cial educational purposes. Reproduction for other reasons is subject to ASRT approval.
For more information, contact the American Society of Radiologic Technologists, 15000 Central Ave SE, Albuquerque, NM 87123-3909, or visit us online at www.asrt.org.
Stereotactic Breast BiopsyMammography is an excellent way to
look for many types of breast disease, but a biopsy is the only way to know for sure whether an abnormality is cancerous. A biopsy involves taking a small amount of tissue and analyzing it in a laboratory. Stereotactic breast biopsy is a method of removing a sample of breast tissue using digital images taken from 2 angles (stereo). It often is performed when a mammogram shows an abnormal mass (lump) or suspicious tissue. This type of biopsy is a brief outpatient procedure with little discomfort and rapid recovery. Most biopsies show that a condition is benign (noncancerous).
Patient Preparation
No special preparation is necessary, but your physician may ask you to discontinue taking aspirin or a blood thinner before the proce-dure. Wear a 2-piece outfit and a comfort-able bra that will provide firm support after your procedure. As with a mam-mogram, don’t use deodorant,
talcum powder, lotion, ointment or per-fume because they can affect the qual-ity of the medical imaging.
Before the exam, a mammographer will explain the procedure and answer your questions. A mammographer, also known as a radiologic technologist, is a skilled medical professional with specialized education in radiation pro-tection, patient care, and special breast positioning and imaging procedures.
Tell the mammographer if you are allergic to local anesthetic or any other medication.
During the ExaminationThe mammographer will ask you to
undress from the waist up and change into a front-opening gown. Then you will lie face down on a specially designed table that has a hole for your breast to fit through, or you will sit with your breast on a mammography unit. You will be awake during the procedure.
Your breast will be compressed, and the mammographer will take a series of radiographic images to determine the exact location of the tissue in question. An anesthetic is injected to numb the area to be biopsied, and you may feel a slight sting. Next, a quarter-inch nick is made in the skin. The physician inserts a needle in the nick, using the images to guide the needle.
After a second set of images is taken to ensure that the needle is positioned correctly, the physician collects several small samples of breast tissue and then leaves a tiny clip in your breast to mark the biopsy site if necessary. The needle is removed and pressure is applied to the area to stop any bleeding. A small bandage is applied to the nick.
Postexamination InformationYou may resume your normal activi-
ties after the exam, but you should avoid strenuous exercise for about a day. You may experience mild discomfort that can be relieved by applying an ice pack. Do not take aspirin as it may increase bleeding. You also may have a bruise, which should disappear in about 10 days. The nick where the needle was inserted may leave a tiny scar.
A pathologist will examine the breast tissue samples and report the findings to your physician. Your physician then will discuss the results with you and advise you about any other procedures that may be necessary. ◆
Stereotactic breast biopsy images. Before (top): Two images from different angles pinpoint the location of a small mass in the breast (arrowheads). The bright white circles are normal calcification deposits. After (bottom): The needle has deposited a clip to mark the location of the mass in question (arrows).
Images courtesy of the B
reast Imaging C
enter, Albuquerque, N
M.

Our scholarship recipients have different backgrounds and a variety of goals. Some seek bachelor’s degrees and
others pursue master’s degrees. Many want to obtain specialty certification in MR or CT. But they do have one thing
in common — they are dedicated to academic achievement and willing to jump into action to reach their goals.
Jump Into Action
With a Siemens Clinical Advancement Scholarship
ASRTEducation and
Research Foundation
®
If you are an R.T. professional pursuing higher education, you can apply
for a $5,000 Siemens Clinical Advancement Scholarship.
Visit www.asrtfoundation.org to learn more.
©2010 ASRT Education and Research Foundation. All rights reserved.
ERF10_SCH_Ads.indd 1 8/25/10 7:11:38 AM
