managilement - pmi nashvillepminashville.org/.../05/managilement...thena-berry.pdf · there’s no...
TRANSCRIPT

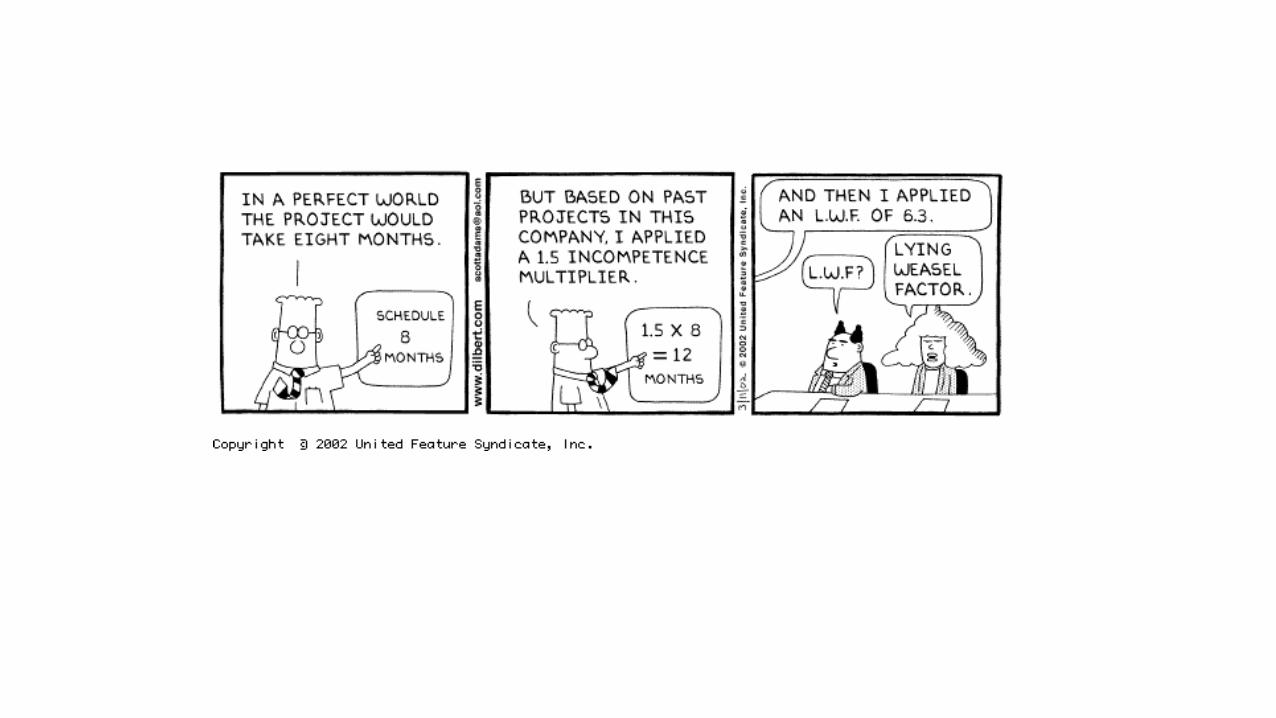
MANAGILEMENT
the Dilbert Way

Introductions
Priyanka Sharma, CSM, PMI-ACPDirector, QA and KMS
MEDHOSTNashville, Tennessee
Thena Berry, CSMSenior Manager, KMS
MEDHOSTNashville, Tennessee

Common Statements about Agile
Let’s convert PMs to Scrum Masters
Scrum coach didn’t say anything about PMs
We don’t need MS Project Plan
We don’t need PMs since we’re moving to Agile
There’s no role for a PM - Agile teams are completely self-managed
Scrum is a PM-free zone
There are no accountants in Scrum either, yet it is likely that all companies have them.
Scrum does not cover all necessary aspects of Product DLC:
We can’t assume that anything not defined by scrum fails to exist.

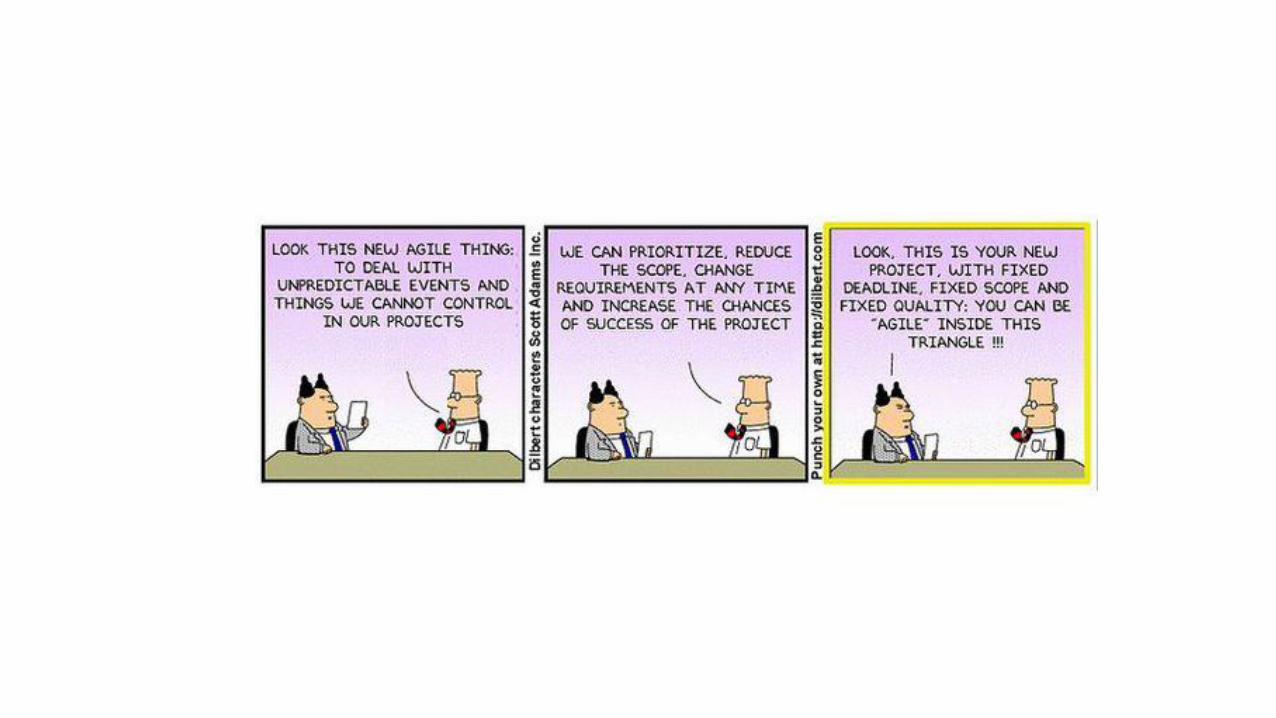
Magical Thinking

Traditional Agile
Unit of Measurement Time Velocity
Breakdown structure Activity management via work breakdown structure
Commitment management via feature breakdown structure
Major Effort Ramps up over time Planning
ResourceManagement
Balancing Enabling teams
Task and Allocation Allocate tasks Team picks up tasks
Planning Structured Adaptable
Response to change Corrective action Adaptive action
Practices Prescriptive, heavyweight methods Minimal set of context-sensitive, generative practices


Boss PM Team
Project Plan
“Give me the schedule view”
Backlog
“But I only have velocity”
“I can help”
Act as a translator

Velocity View
Schedule View
Fixed Time / ScopeTeam Projected / Actual Expected
Feature List Description Team Size Story Points Velocity # Sprints Cost Velocity # Sprints Cost
Feature A Physicians can view allergies in a patient's record
SP1 5 60 40 1.50 $30,000 60 1 $20,000
Feature B Nurses can record allergies in a patient's record
SP1 5 40 50 0.80 $16,000 40 1 $20,000
Feature C Patients can review their allergies in their own records
SP1 5 30 25 1.20 $24,000 60 1 $10,000


Worst CaseAverage CaseBest Case
SprintProjected Team Size Cost / Sprint Actual Total Projected Worst Case Cost WC Total Best Case Cost BC Total
1 5 $ 30,000 $ 25,200 $ 25,200
2 5 $ 30,000 $ 26,980 $ 52,180
3 5 $ 30,000 $ 33,456 $ 85,636
4 5 $ 30,000 $ 30,000 $ 115,636
5 5 $ 30,000 $ 32,000 $ 147,636
6 5 $ 30,000 $ 28,654 $ 176,290
7 5 $ 30,000 $ 30,125 $ 206,415
8 5 $ 30,000 $ 30,000 $ 236,415 $ 236,415 $ 33,456 $ 239,871 $ 30,000 $ 236,415
9 5 $ 30,000 $ 266,415 $ 33,456 $ 273,327 $ 30,000 $ 266,415
10 5 $ 30,000 $ 296,415 $ 33,456 $ 306,783 $ 30,000 $ 296,415
11 5 $ 30,000 $ 326,415 $ 33,456 $ 340,239 $ 30,000 $ 326,415
12 5 $ 30,000 $ 356,415 $ 33,456 $ 373,695 $ 30,000 $ 356,415
13 5 $ 30,000 $ 386,415 $ 33,456 $ 407,151 $ 30,000 $ 386,415
14 5 $ 30,000 $ 416,415 $ 33,456 $ 440,607 $ 30,000 $ 416,415
15 5 $ 30,000 $ 446,415 $ 33,456 $ 474,063 $ 30,000 $ 446,415

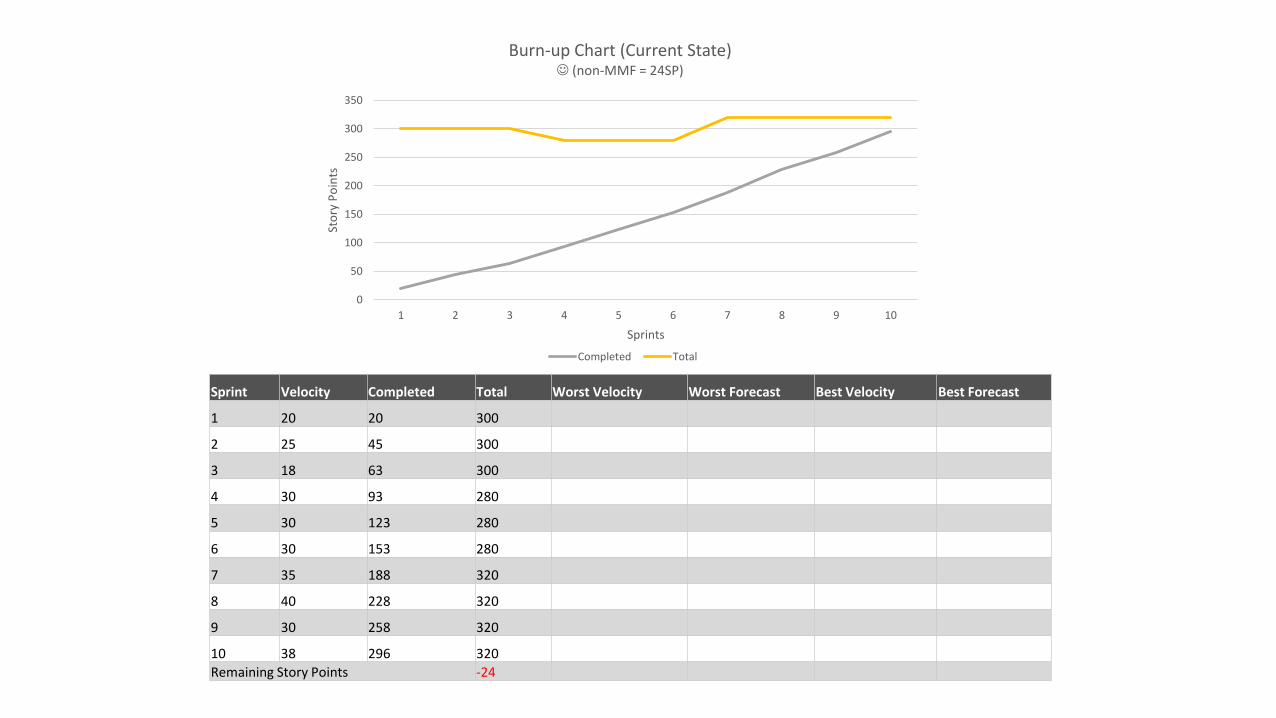
Sprint Velocity Completed Total Worst Velocity Worst Forecast Best Velocity Best Forecast
1 20 20 300
2 25 45 300
3 18 63 300
4 30 93 280
5 30 123 280
6 30 153 280
7 35 188 320
8 40 228 320
9 30 258 320
10 38 296 320
Remaining Story Points -24
0
50
100
150
200
250
300
350
1 2 3 4 5 6 7 8 9 10
Sto
ry P
oin
tsSprints
Burn-up Chart (Current State) (non-MMF = 24SP)
Completed Total
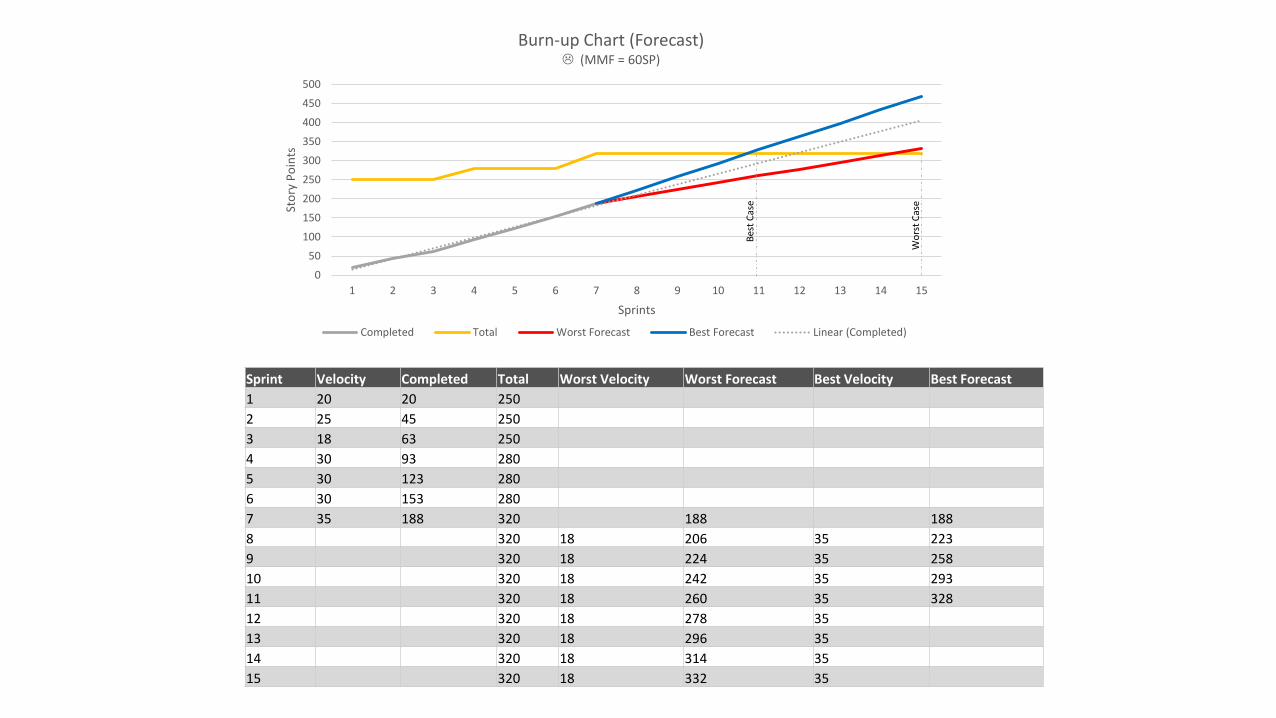
Sprint Velocity Completed Total Worst Velocity Worst Forecast Best Velocity Best Forecast
1 20 20 250
2 25 45 250
3 18 63 250
4 30 93 280
5 30 123 280
6 30 153 280
7 35 188 320 188 188
8 320 18 206 35 223
9 320 18 224 35 258
10 320 18 242 35 293
11 320 18 260 35 328
12 320 18 278 35
13 320 18 296 35
14 320 18 314 35
15 320 18 332 35
0
50
100
150
200
250
300
350
400
450
500
1 2 3 4 5 6 7 8 9 10 11 12 13 14 15St
ory
Po
ints
Sprints
Burn-up Chart (Forecast) (MMF = 60SP)
Completed Total Worst Forecast Best Forecast Linear (Completed)
Wo
rst
Cas
e
Bes
t C
ase

But wait! There’s more!“The plan is nothing. Planning is EVERYTHING.”
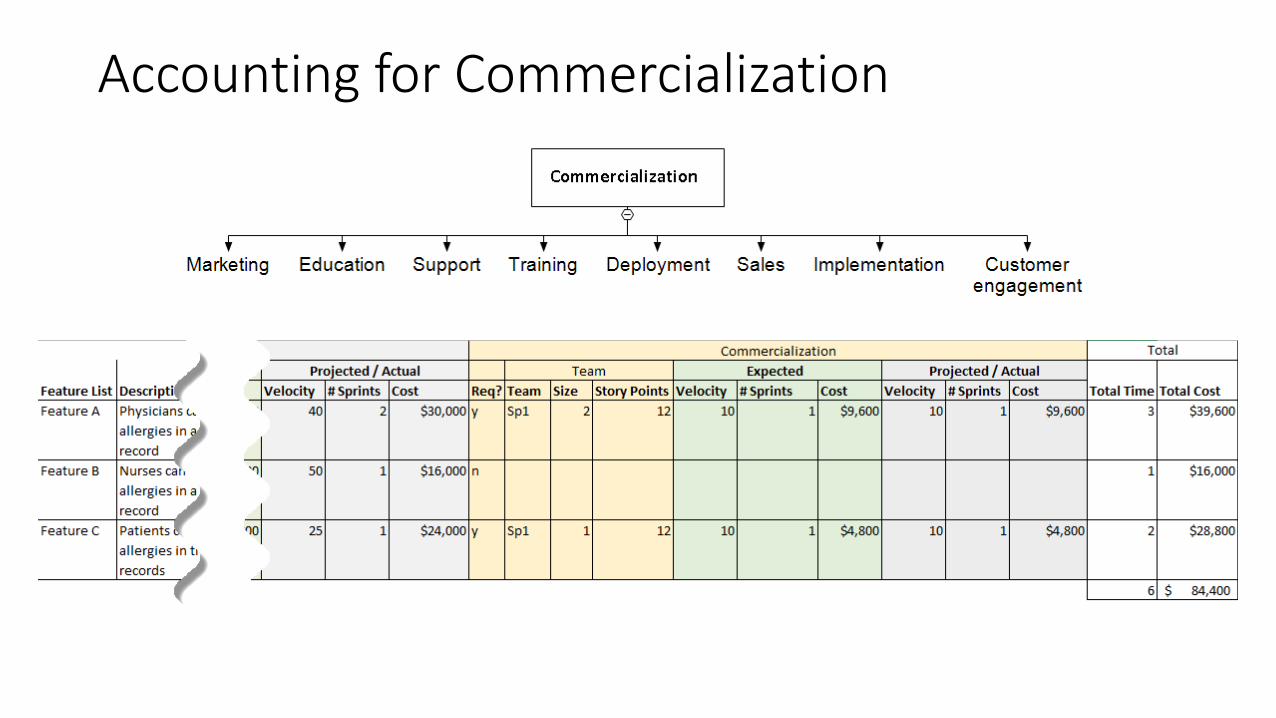
Accounting for Commercialization

Xchange Management = Communication + Prioritization

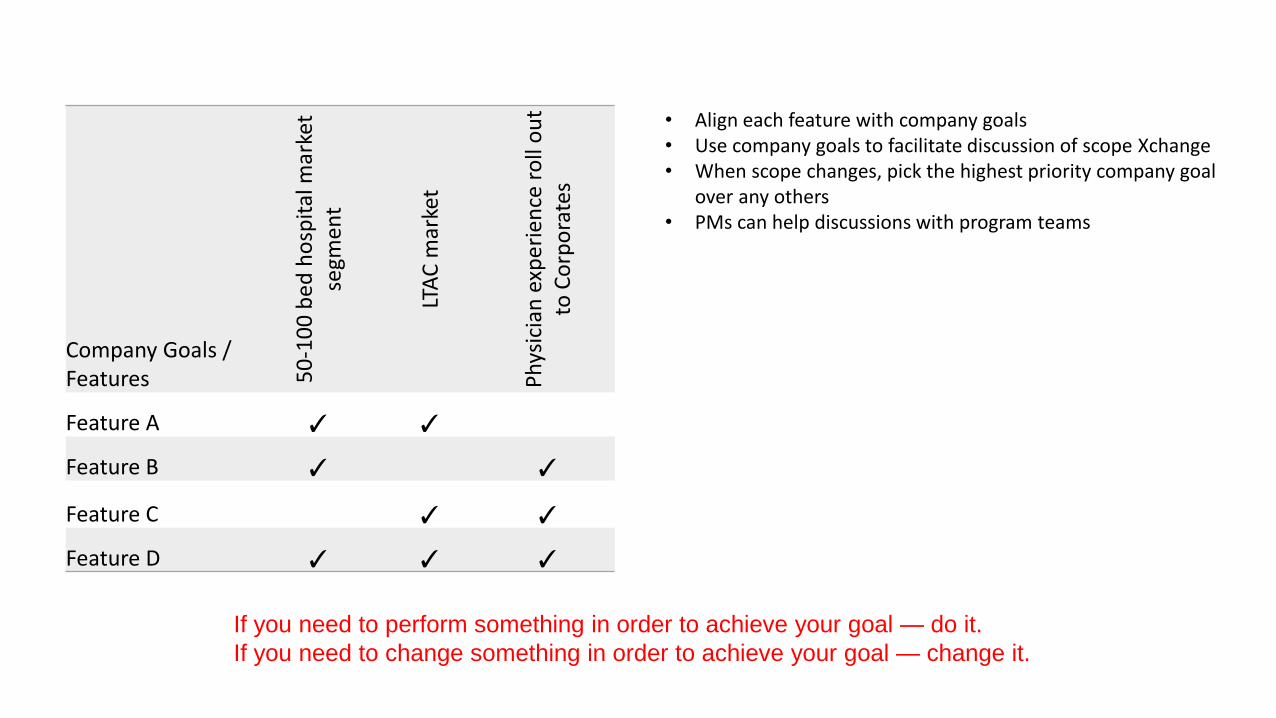
Company Goals /Features 5
0-1
00
bed
ho
spit
al m
arke
t se
gmen
t
LTA
C m
arke
t
Ph
ysic
ian
exp
eri
ence
ro
ll o
ut
to C
orp
ora
tes
Feature A ✓ ✓
Feature B ✓ ✓
Feature C ✓ ✓
Feature D ✓ ✓ ✓
• Align each feature with company goals• Use company goals to facilitate discussion of scope Xchange• When scope changes, pick the highest priority company goal
over any others• PMs can help discussions with program teams
If you need to perform something in order to achieve your goal — do it.
If you need to change something in order to achieve your goal — change it.

Your New Job Profile
TranslatorGuesstimatorCorrection OfficerStack RankerConnectorBacklog GroomerInformation Radiator

Questions?
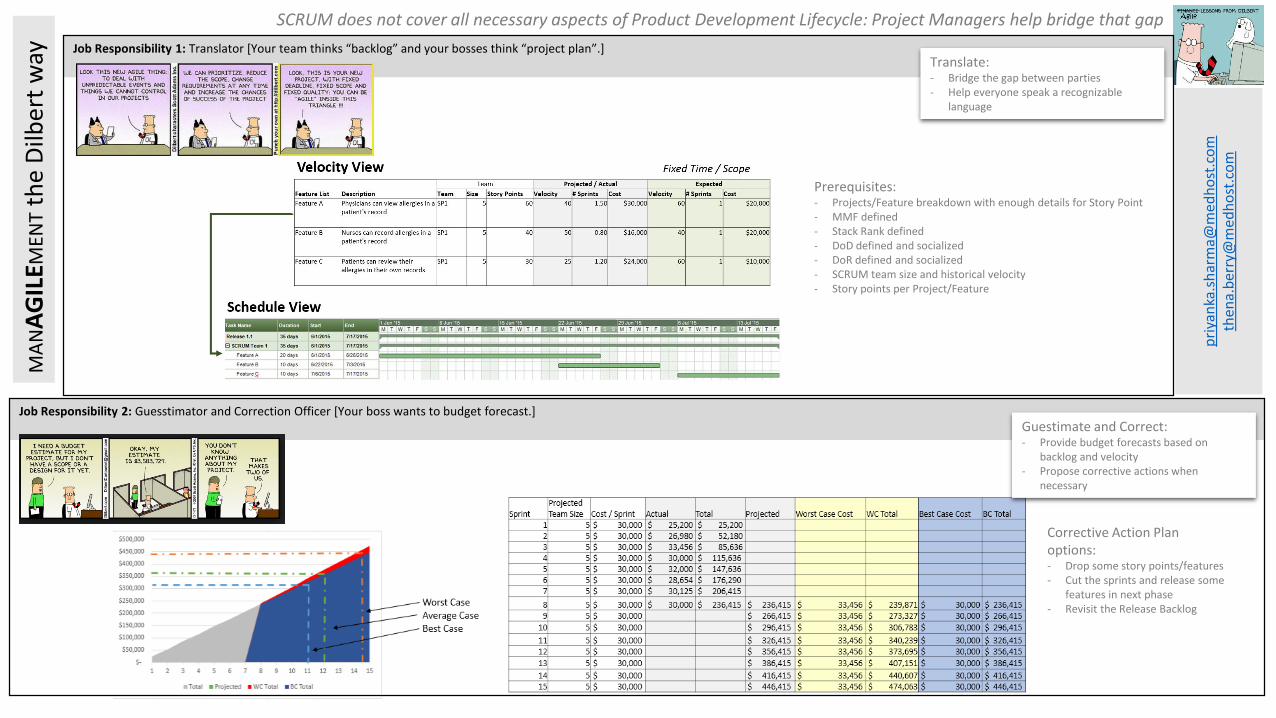
SCRUM does not cover all necessary aspects of Product Development Lifecycle: Project Managers help bridge that gap
Job Responsibility 1: Translator [Your team thinks “backlog” and your bosses think “project plan”.]
Prerequisites:- Projects/Feature breakdown with enough details for Story Point- MMF defined- Stack Rank defined- DoD defined and socialized- DoR defined and socialized- SCRUM team size and historical velocity- Story points per Project/Feature
Job Responsibility 2: Guesstimator and Correction Officer [Your boss wants to budget forecast.]
Corrective Action Plan options:- Drop some story points/features- Cut the sprints and release some
features in next phase- Revisit the Release Backlog
Guestimate and Correct:- Provide budget forecasts based on
backlog and velocity- Propose corrective actions when
necessary
Translate:- Bridge the gap between parties- Help everyone speak a recognizable
language
MA
NA
GIL
EMEN
Tth
e D
ilber
t w
ay
pri
yan
ka.s
har
ma@
me
dh
ost
.co
mth
ena.
ber
ry@
med
ho
st.c
om
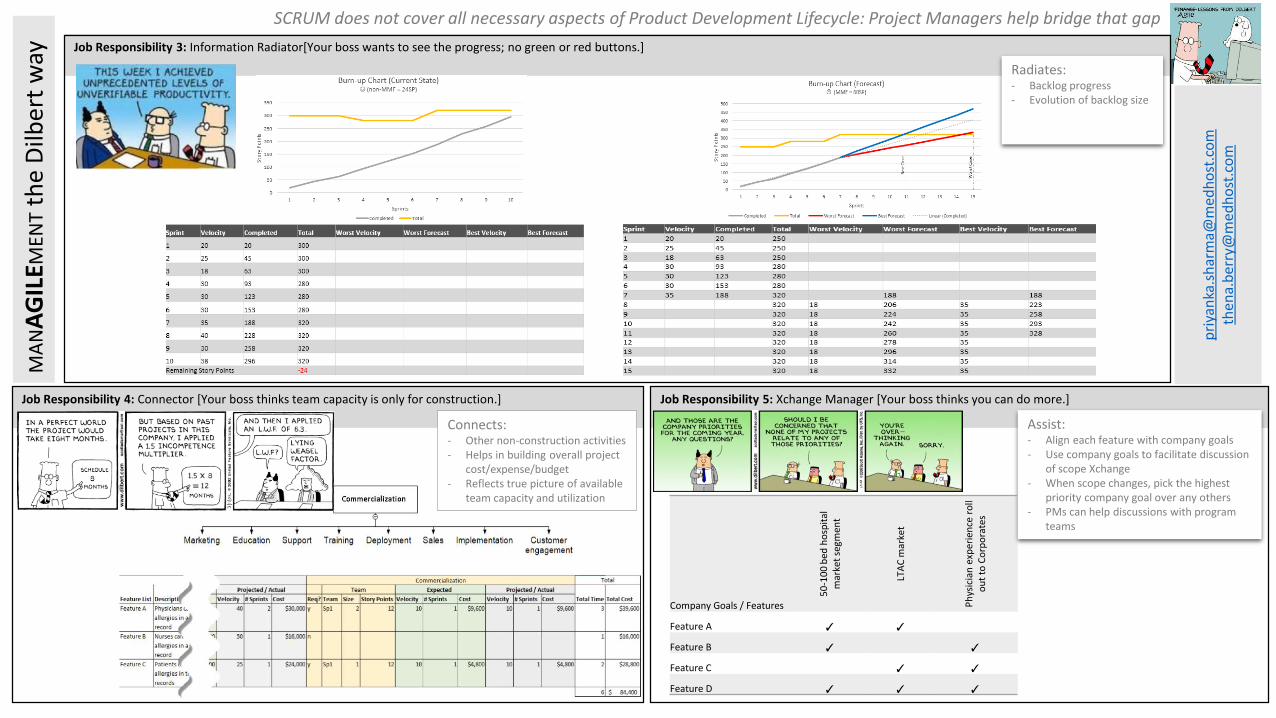
Job Responsibility 3: Information Radiator[Your boss wants to see the progress; no green or red buttons.]
Radiates:- Backlog progress- Evolution of backlog size
Job Responsibility 4: Connector [Your boss thinks team capacity is only for construction.] Job Responsibility 5: Xchange Manager [Your boss thinks you can do more.]
Assist:- Align each feature with company goals- Use company goals to facilitate discussion
of scope Xchange- When scope changes, pick the highest
priority company goal over any others- PMs can help discussions with program
teams
SCRUM does not cover all necessary aspects of Product Development Lifecycle: Project Managers help bridge that gap
Connects:- Other non-construction activities- Helps in building overall project
cost/expense/budget- Reflects true picture of available
team capacity and utilization
Company Goals / Features
50
-10
0 b
ed h
osp
ital
m
arke
t se
gmen
t
LTA
C m
arke
t
Ph
ysic
ian
exp
erie
nce
ro
ll o
ut
to C
orp
ora
tes
Feature A ✓ ✓
Feature B ✓ ✓
Feature C ✓ ✓
Feature D ✓ ✓ ✓
MA
NA
GIL
EMEN
Tth
e D
ilber
t w
ay
pri
yan
ka.s
har
ma@
med
ho
st.c
om
then
a.b
erry
@m
edh
ost
.co
m