management’s discussion and analysis - … · from other healthcare facilities in the service...
TRANSCRIPT
450 Brookline Avenue, Boston, MA 02215-5450 617.632.3000 617.632.5330 TDD
A Teaching Affiliate of Harvard Medical School
This document is dated as of September 11, 2017
SPECIAL NOTE CONCERNING FORWARD-LOOKING STATEMENTS. Certain of the discussions included in the following document may include certain “forward-looking statements” which involve known and unknown risks and uncertainties inherent in the operation of healthcare facilities. Actual actions or results may differ materially from those discussed below. Specific factors that might cause such differences include competition from other healthcare facilities in the service area of Dana-Farber Cancer Institute, federal and state regulations of healthcare providers, and reimbursement policies of the state and federal governments and managed care organizations. In particular, statements preceded by, followed by or that include the words “believes,” “estimates,” “expects,” “anticipates,” “plans,” “intends,” “scheduled” or other similar expressions are or may constitute forward-looking statements.
MANAGEMENT’S DISCUSSION AND ANALYSIS
DANA-FARBER CANCER INSTITUTE, INC. AND SUBSIDIARIES* Third Quarter Ended June 30, 2017
Laurie H. Glimcher M.D., President and Chief Executive Officer Dorothy E. Puhy, Executive Vice President and Chief Operating Officer
Michael L. Reney, Senior Vice President and Chief Financial Officer
*Dana-Farber Cancer Institute, Inc. is the parent corporation of Dana-Farber, Inc., Dana-Farber Trust, Inc. and Dana-Farber Cancer Care Network, Inc. Results for the quarter endedJune 30, 2017 are presented on a condensed, consolidated basis.The Obligated Group is Dana-Farber Cancer Institute, Inc. and Dana-Farber, Inc.

Dana-Farber Cancer Institute, Inc. and Subsidiaries Management’s Discussion and Analysis of Financial Condition
and Operating Results
Third Quarter Ended June 30, 2017
For the first nine months of fiscal year (“FY”) 2017, Dana-Farber Cancer Institute, Inc. (DFCI) recorded an excess of revenues over expenses of $9.6 million, compared to $13.3 million for the first nine months of FY 2016. Income from operations was ($34.9) million, compared to $21.4 million for the first nine months of FY 2016. The decline in operating income reflects the addition of the Longwood Center fixed costs combined with costs associated with the review (see “Other Developments” below) by the U.S. Centers for Medicare and Medicaid Services (“CMS”), unfavorable trends in payer mix and the write-off of certain prior year patient accounts resulting from the 2015 implementation of a new electronic medical record and revenue cycle system.
Total operating revenue for the first nine months of FY 2017 was $1.1 billion, an increase of $88.9 million, or 8.6%, over the same period in FY 2016. Patient care revenue grew by $42.1 million, or 6.2% over the same period in FY 2016. Management attributes this increase largely to growth in patient volume and pharmacy offset by an increase in the mix of Medicare patients and a change in estimate related to the collectability of certain prior year patient accounts. Research revenues have increased by $44.1 million, or 15.8%, over the same period in FY 2016. Management attributes this increase to increases in funding from federal grants and commercial agreements plus additional use of gifts and royalty funds. Unrestricted gifts increased by $0.3 million, or less than 1.0% over the same period in FY 2016. Operating expenses increased to $1.1 billion, an increase of $145.1 million, or 14.4% over the same period in FY 2016. Direct patient care expenses increased by $66.8 million or 14.7% due to growth in patient volume and pharmacy. General, administrative and plant expenses increased by $15.8 million, or 6.6% which is largely related to consulting and legal costs related to the CMS review. Depreciation expense increased by $11.5 million, or 17.8% and interest expense increased by $10.4 million, or 140.4% compared to the prior fiscal year. Management attributes the increase in interest expense to the issuance of the Series N debt as well as the conversion of the Longwood Research Space lease from operating to capital lease treatment. For a discussion of the accounting treatment of the Longwood Research Space Lease, see DFCI’s Fourth Quarter Ended 9/30/16 (Unaudited) Report under the heading “Management’s Discussion and Analysis of Financial Condition and Operating Results” on file at emma.msrb.org.
Unrestricted investment returns for the first nine months of FY 2017 were $32.3 million compared to $10.8 million through the first nine months of FY 2016. Investment returns
2
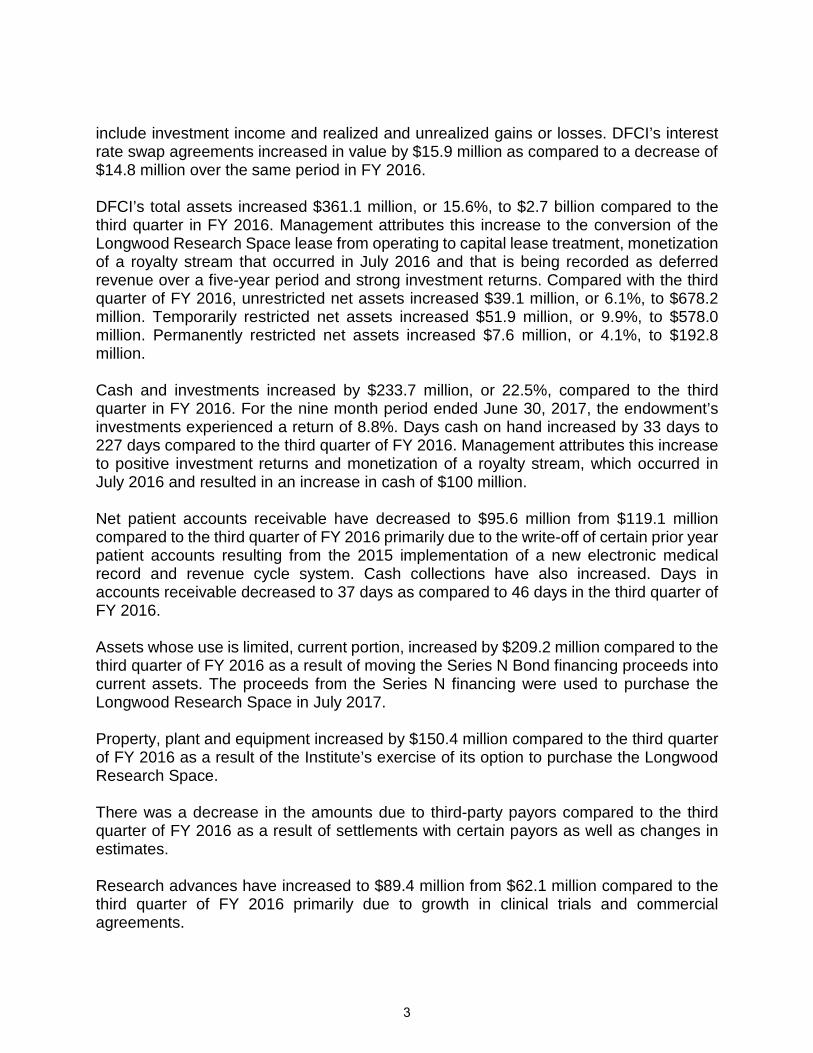
include investment income and realized and unrealized gains or losses. DFCI’s interest rate swap agreements increased in value by $15.9 million as compared to a decrease of $14.8 million over the same period in FY 2016. DFCI’s total assets increased $361.1 million, or 15.6%, to $2.7 billion compared to the third quarter in FY 2016. Management attributes this increase to the conversion of the Longwood Research Space lease from operating to capital lease treatment, monetization of a royalty stream that occurred in July 2016 and that is being recorded as deferred revenue over a five-year period and strong investment returns. Compared with the third quarter of FY 2016, unrestricted net assets increased $39.1 million, or 6.1%, to $678.2 million. Temporarily restricted net assets increased $51.9 million, or 9.9%, to $578.0 million. Permanently restricted net assets increased $7.6 million, or 4.1%, to $192.8 million. Cash and investments increased by $233.7 million, or 22.5%, compared to the third quarter in FY 2016. For the nine month period ended June 30, 2017, the endowment’s investments experienced a return of 8.8%. Days cash on hand increased by 33 days to 227 days compared to the third quarter of FY 2016. Management attributes this increase to positive investment returns and monetization of a royalty stream, which occurred in July 2016 and resulted in an increase in cash of $100 million. Net patient accounts receivable have decreased to $95.6 million from $119.1 million compared to the third quarter of FY 2016 primarily due to the write-off of certain prior year patient accounts resulting from the 2015 implementation of a new electronic medical record and revenue cycle system. Cash collections have also increased. Days in accounts receivable decreased to 37 days as compared to 46 days in the third quarter of FY 2016. Assets whose use is limited, current portion, increased by $209.2 million compared to the third quarter of FY 2016 as a result of moving the Series N Bond financing proceeds into current assets. The proceeds from the Series N financing were used to purchase the Longwood Research Space in July 2017. Property, plant and equipment increased by $150.4 million compared to the third quarter of FY 2016 as a result of the Institute’s exercise of its option to purchase the Longwood Research Space. There was a decrease in the amounts due to third-party payors compared to the third quarter of FY 2016 as a result of settlements with certain payors as well as changes in estimates. Research advances have increased to $89.4 million from $62.1 million compared to the third quarter of FY 2016 primarily due to growth in clinical trials and commercial agreements.
3
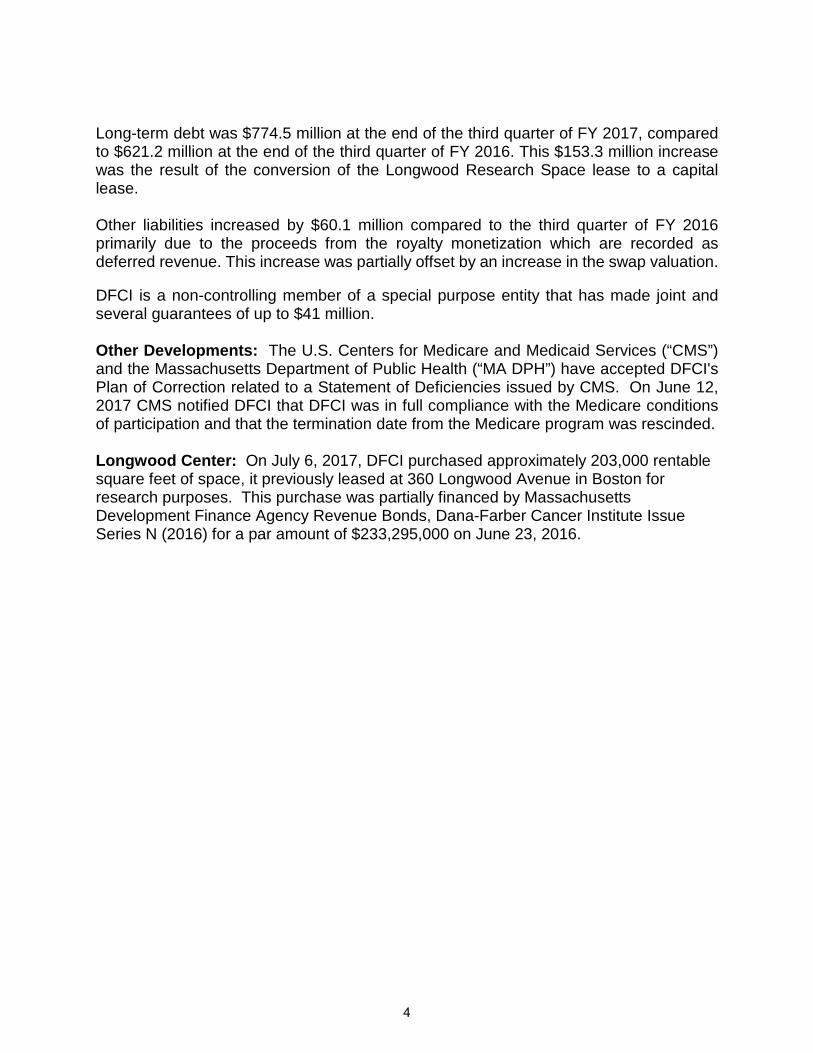
Long-term debt was $774.5 million at the end of the third quarter of FY 2017, compared to $621.2 million at the end of the third quarter of FY 2016. This $153.3 million increase was the result of the conversion of the Longwood Research Space lease to a capital lease. Other liabilities increased by $60.1 million compared to the third quarter of FY 2016 primarily due to the proceeds from the royalty monetization which are recorded as deferred revenue. This increase was partially offset by an increase in the swap valuation. DFCI is a non-controlling member of a special purpose entity that has made joint and several guarantees of up to $41 million. Other Developments: The U.S. Centers for Medicare and Medicaid Services (“CMS”) and the Massachusetts Department of Public Health (“MA DPH”) have accepted DFCI's Plan of Correction related to a Statement of Deficiencies issued by CMS. On June 12, 2017 CMS notified DFCI that DFCI was in full compliance with the Medicare conditions of participation and that the termination date from the Medicare program was rescinded. Longwood Center: On July 6, 2017, DFCI purchased approximately 203,000 rentable square feet of space, it previously leased at 360 Longwood Avenue in Boston for research purposes. This purchase was partially financed by Massachusetts Development Finance Agency Revenue Bonds, Dana-Farber Cancer Institute Issue Series N (2016) for a par amount of $233,295,000 on June 23, 2016.
4

DANA-FARBER CANCER INSTITUTE, INC. AND SUBSIDIARIESConsolidated Balance Sheets
(Dollars in thousands) 2017 2016 2016 2015
ASSETS
Current AssetsCash and cash equivalents 137,502$ 49,213$ 136,127$ 29,389$ Patient accounts receivable, net 95,584 119,058 113,877 99,513 Contributions receivable, current portion 5,933 4,734 16,325 22,910 Assets whose use is limited, current portion 222,407 13,207 245,318 5,146 Research receivables 33,247 27,815 22,144 26,845 Prepaid expenses and other current assets 65,486 54,760 54,530 46,432
Total Current Assets 560,159 268,787 588,321 230,235 Investments 1,134,287 988,834 1,034,466 950,994
Assets whose use is limited by indentureagreement or other, less current portion 12,808 253,726 12,703 12,666
Property, plant and equipment, net 894,475 744,040 923,299 748,560 Contributions receivable, less current portion 31,623 44,179 28,824 40,469 Other assets 48,902 21,589 48,262 21,305
TOTAL ASSETS 2,682,254$ 2,321,155$ 2,635,875$ 2,004,229$
LIABILITIES AND NET ASSETSCurrent Liabilities
Accounts payable and accrued expenses 133,503$ 111,054$ 144,608$ 145,986$ Amounts due to third party payors 48,561 54,464 43,044 60,045 Research advances 89,425 62,066 62,045 50,566 Current portion of long-term debt 9,459 4,243 14,722 5,458
Total Current Liabilities 280,948 231,827 264,419 262,055 Other Liabilities
Long-term debt, less current portion 774,471 621,166 782,064 345,769 Other Liabilities 177,826 117,707 195,819 91,946
952,297 738,873 977,883 437,715 Net Assets
Unrestricted 678,171 639,083 668,285 612,732 Temporarily restricted 578,021 526,166 540,317 516,907 Permanently restricted 192,817 185,206 184,971 174,820
Total Net Assets 1,449,009 1,350,455 1,393,573 1,304,459
TOTAL LIABILITIES AND NET ASSETS 2,682,254$ 2,321,155$ 2,635,875$ 2,004,229$
September 30June 30As Of As Of
June 2016 early adoption of Accounting Standard Update 2015-03 (ASU). Bond issuance costs reclassed to long-term debt, less current portion from other assets on a comparative basis including second quarter FY16.
5

DANA-FARBER CANCER INSTITUTE, INC. AND SUBSIDIARIESConsolidated Statement of Operations and Changes in Net Assets
(Dollars in thousands) 2017 2016 2017 2016 2016 2015
Operating revenues:
Patient service revenue, net of contractual $ 238,552 $ 241,131 $ 729,934 $ 688,087 $ 938,141 $ 780,826
allowances and discounts Provision for bad debts 3,327 3,555 8,820 9,100 12,813 7,604
Net Patient service revenues, less provision for bad debts 235,225 237,576 721,114 678,987 925,328 773,222
Research revenues 110,176 98,669 322,509 278,394 386,793 357,625 Unrestricted contributions and bequests 5,405 6,311 57,018 56,734 73,276 69,398 Other operating revenues 5,402 5,063 18,225 15,877 21,130 20,941 Total operating revenues 356,208 347,619 1,118,866 1,029,992 1,406,527 1,221,186
Operating expenses:Direct research 94,662 86,807 281,385 240,843 337,901 310,721
Direct patient care 184,498 160,251 522,526 455,681 624,564 512,950 General, administrative and plant 88,955 82,431 255,820 240,029 310,624 295,006 Depreciation and amortization 26,379 21,539 76,138 64,614 88,060 72,492 Interest 5,938 2,543 17,866 7,433 15,656 8,018 Total operating expenses 400,432 353,571 1,153,735 1,008,600 1,376,805 1,199,187 Operating income (44,224) (5,952) (34,869) 21,392 29,722 21,999
Investment gains, net 11,502 3,715 32,290 10,805 26,280 (7,345)Interest rate swap agreement: Net interest paid (1,176) (1,330) (3,703) (4,040) (5,354) (5,593) Change in fair value (1,796) (6,678) 15,923 (14,843) (13,836) (11,238)
Other - - (248)EXCESS (DEFICIT) OF REVENUES OVER EXPENSES (35,694) (10,245) 9,641 13,314 36,812 (2,425)
Other Changes in Net Assets:Net unrealized gains (losses) on endowment - 20 - 90 170 (168) Net assets released from restriction for capital - 1,582 - 12,944 20,948 13,889 Pension adjustment - - - - (2,380) (5,427) Other 247 - 247 - 3 - Increase in unrestricted net assets (35,447) (8,643) 9,888 26,348 55,553 5,869 Increase (decrease) in temporarily restricted net assets 13,676 1,214 37,702 9,262 23,410 (21,163) Increase in permanently restricted net assets 879 3,634 7,846 10,386 10,151 7,603
Increase (decrease) in Net Assets (20,892) (3,795) 55,436 45,996 89,114 (7,691)
Net Assets at Beginning of Period 1,469,901 1,354,250 1,393,573 1,304,459 1,304,459 1,312,150
NET ASSETS AT END OF PERIOD 1,449,009$ 1,350,455$ 1,449,009$ 1,350,455$ 1,393,573$ 1,304,459$
September 30June 30 June 30Quarter Ended Nine Months Ended Year Ended
6
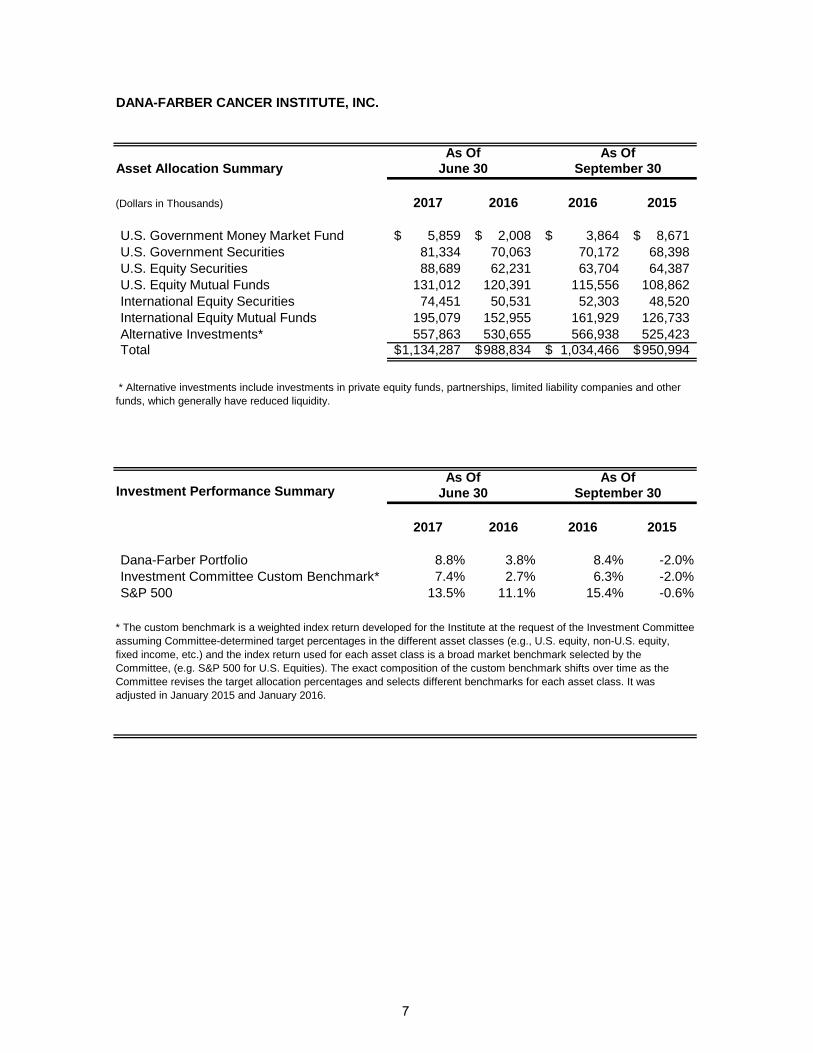
DANA-FARBER CANCER INSTITUTE, INC.
Asset Allocation Summary
(Dollars in Thousands) 2017 2016 2016 2015
U.S. Government Money Market Fund 5,859$ 2,008$ 3,864$ 8,671$ U.S. Government Securities 81,334 70,063 70,172 68,398 U.S. Equity Securities 88,689 62,231 63,704 64,387 U.S. Equity Mutual Funds 131,012 120,391 115,556 108,862 International Equity Securities 74,451 50,531 52,303 48,520 International Equity Mutual Funds 195,079 152,955 161,929 126,733 Alternative Investments* 557,863 530,655 566,938 525,423 Total 1,134,287$ 988,834$ 1,034,466$ 950,994$
Investment Performance Summary
2017 2016 2016 2015
Dana-Farber Portfolio 8.8% 3.8% 8.4% -2.0%Investment Committee Custom Benchmark* 7.4% 2.7% 6.3% -2.0%S&P 500 13.5% 11.1% 15.4% -0.6%
As Of As Of
As Of As Of
* The custom benchmark is a weighted index return developed for the Institute at the request of the Investment Committee assuming Committee-determined target percentages in the different asset classes (e.g., U.S. equity, non-U.S. equity, fixed income, etc.) and the index return used for each asset class is a broad market benchmark selected by the Committee, (e.g. S&P 500 for U.S. Equities). The exact composition of the custom benchmark shifts over time as the Committee revises the target allocation percentages and selects different benchmarks for each asset class. It was adjusted in January 2015 and January 2016.
June 30 September 30
* Alternative investments include investments in private equity funds, partnerships, limited liability companies and other funds, which generally have reduced liquidity.
June 30 September 30
7

DANA-FARBER CANCER INSTITUTE, INC. Capitalization for the Obligated Group
(Dollars in Thousands) 2017 2016 2016 2015
Long-Term DebtSeries K Bonds 79,242$ 83,198$ 83,145$ 86,942$ Series L Bonds 184,025 183,992 184,000 183,967 Series M Bonds 50,253 50,199 50,213 50,160 Series N Bonds 277,713 279,262 278,805 - South Shore lease obligation 18,966 20,166 19,819 21,182 Milford lease obligation 8,059 8,592 8,461 8,976 Longwood Center lease obligation 165,674 - 172,343 - Total Long-Term Debt 783,932 625,409 796,786 351,227
Unrestricted Net Assets 698,273 651,786 682,684 620,619 Total Capitalization 1,482,205$ 1,277,195$ 1,479,470$ 971,846$
Total Long-Term Debt as a Percent of Total Capitalization 52.9% 49.0% 53.9% 36.1%
September 30June 30As Of As Of
The increase in the Long-Term Debt as a Percent of Total Capitalization is the result of the Series N bond financing as well as the conversion of the Longwood Research Space lease to a capital lease.
8

DANA-FARBER CANCER INSTITUTE, INC.
Days Cash on Hand for the Obligated Group(Dollars in Thousands) 2017 2016 2016 2015
Total Unrestricted Cash Position 1 871,865$ 642,754$ 769,101$ 612,918$ Average Daily Expenses 2 3,834 3,319 3,403 2,975 Days Cash On-Hand 227 194 226 206
Actual and Maximum Debt Service for the Obligated Group(Dollars in Thousands) 2017 2016 2016 2015
Income Available for Debt Service 120,658 122,148 144,735 123,425 Actual Historical Annual Debt Service 47,669 20,398 30,844 18,807 Actual Historical Debt Service Coverage Ratio 2.53 5.99 4.69 6.56
Income Available for Debt Service 120,658 122,148 144,735 123,425 Pro Forma Maximum Annual Debt Service 1 51,632 35,563 51,372 24,470 Pro Forma Maximum Debt Service Coverage Ratio 2.34 3.43 2.82 5.04
As Of As Of
Year Ended Year Ended
June 30 September 30
1 Maximum Annual Debt Service represents the highest total debt service on all long-term indebtedness which is projected to occur in the fiscal year ending 9/30/2027. The debt service requirement for $150,000 of long-term indebtedness which is covered by interest rate swap agreements is calculated in accordance with the terms of Master Trust Indenture. The Assumed Rate used to calculate debt service for the Series L variable rate bonds is 1.28% and 1.09% for September 30, 2016 and 2015 and 1.5% and 1.23% for June 30, 2017 and 2016, respectively. The Assumed Rate used to calculate debt service for the variable rate capital lease which expires in 2030 is 3.04% and 3.40% for September 30, 2016 and 2015 and 1.71% and 3.32% for June 30, 2017 and 2016, respectively.
June 30 September 30
1 Unrestricted cash equivalents and marketable securities plus an amount equal to 200% of the donor restricted research funds that have been released from restriction and used for operating expenses during the relevant calculation period, plus temporarily restricted cash and marketable securities that are available for current use but exlcuding certain items permitted to be excluded under the Master Trust Indenture.
2 Total operating expenses less extraordinary items, infrequently occurring items or unusual items and the cumulative effect of changes in accounting principles, depreciation and amortization and other non-cash charges divided by the number of days in the period.
The increase in both the historical and maximum annual debt service is the result of the Series N bond financing as well as the conversion of the Longwood Research Space lease to a capital lease.
9

DANA-FARBER CANCER INSTITUTE, INC. Operational Statistics for the Obligated Group
2017 2016 2017 2016 2016 2015OUTPATIENT STATISTICS
MD Clinic visits (1) 84,816 81,960 245,525 240,383 321,900 309,750Infusion visits (1) 41,822 40,689 124,270 122,596 157,533 149,413
ANCILLARY STATISTICS(units of service)
Laboratories 335,261 296,628 903,231 841,370 1,134,298 1,069,448Blood Bank 17,121 20,038 50,867 47,356 64,431 56,896Pharmacy (1)(2) 97,460,249 82,215,291 276,893,523 235,097,088 320,947,215 241,663,006PET Scans 861 1,155 2,841 3,249 4,347 3,892Diagnostic Radiology 4,878 3,171 13,676 9,141 12,110 12,202Ultrasound 390 291 1,020 878 1,164 1,149Nuclear Medicine 684 614 2,032 1,607 2,300 2,094MRI 2,089 2,167 5,945 6,113 8,211 7,137CT Scans 7,791 7,807 22,567 22,700 30,399 28,435Radiation Therapy 9,405 10,923 28,625 32,001 42,160 39,235Respiratory Therapy/EKG 5,370 5,538 15,664 18,107 23,357 24,687(Treatments)
INPATIENT STATISTICS Licensed Beds 30 30 30 30 30 30Total Admissions 235 316 794 954 1,270 1,251ALOS 11.24 7.75 9.57 7.97 7.80 7.66Total Patient Days 2,641 2,449 7,596 7,600 9,912 10,065Occupancy Rate 96.7% 88.7% 92.7% 92.5% 90.3% 91.9%
Source: Institute Records
Quarter Ended Nine Months Ended Year Ended
2 Cost of drugs administered
1 Includes results of DFCCN
September 30June 30 June 30
10
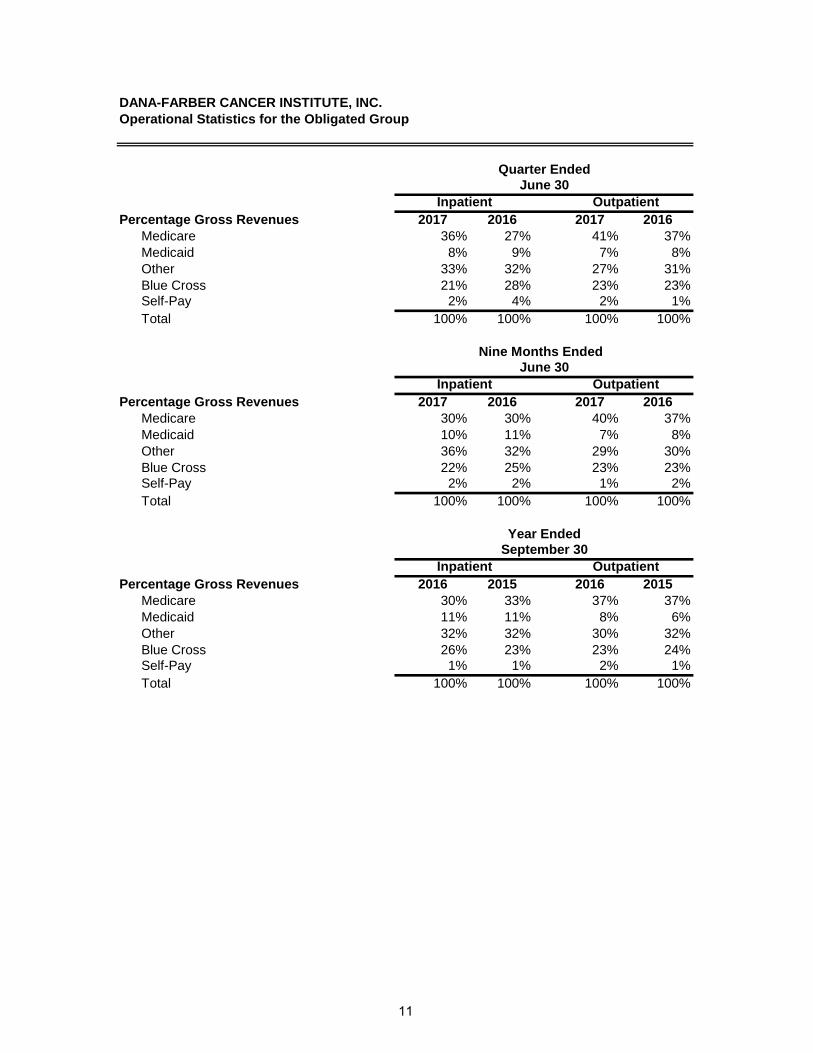
DANA-FARBER CANCER INSTITUTE, INC. Operational Statistics for the Obligated Group
Percentage Gross Revenues 2017 2016 2017 2016
Medicare 36% 27% 41% 37%Medicaid 8% 9% 7% 8%Other 33% 32% 27% 31%Blue Cross 21% 28% 23% 23%Self-Pay 2% 4% 2% 1%
Total 100% 100% 100% 100%
Percentage Gross Revenues 2017 2016 2017 2016
Medicare 30% 30% 40% 37%Medicaid 10% 11% 7% 8%Other 36% 32% 29% 30%Blue Cross 22% 25% 23% 23%Self-Pay 2% 2% 1% 2%Total 100% 100% 100% 100%
Percentage Gross Revenues 2016 2015 2016 2015
Medicare 30% 33% 37% 37%Medicaid 11% 11% 8% 6%Other 32% 32% 30% 32%Blue Cross 26% 23% 23% 24%Self-Pay 1% 1% 2% 1%
Total 100% 100% 100% 100%
September 30Inpatient Outpatient
Quarter Ended
Inpatient OutpatientJune 30
June 30Inpatient Outpatient
Nine Months Ended
Year Ended
11
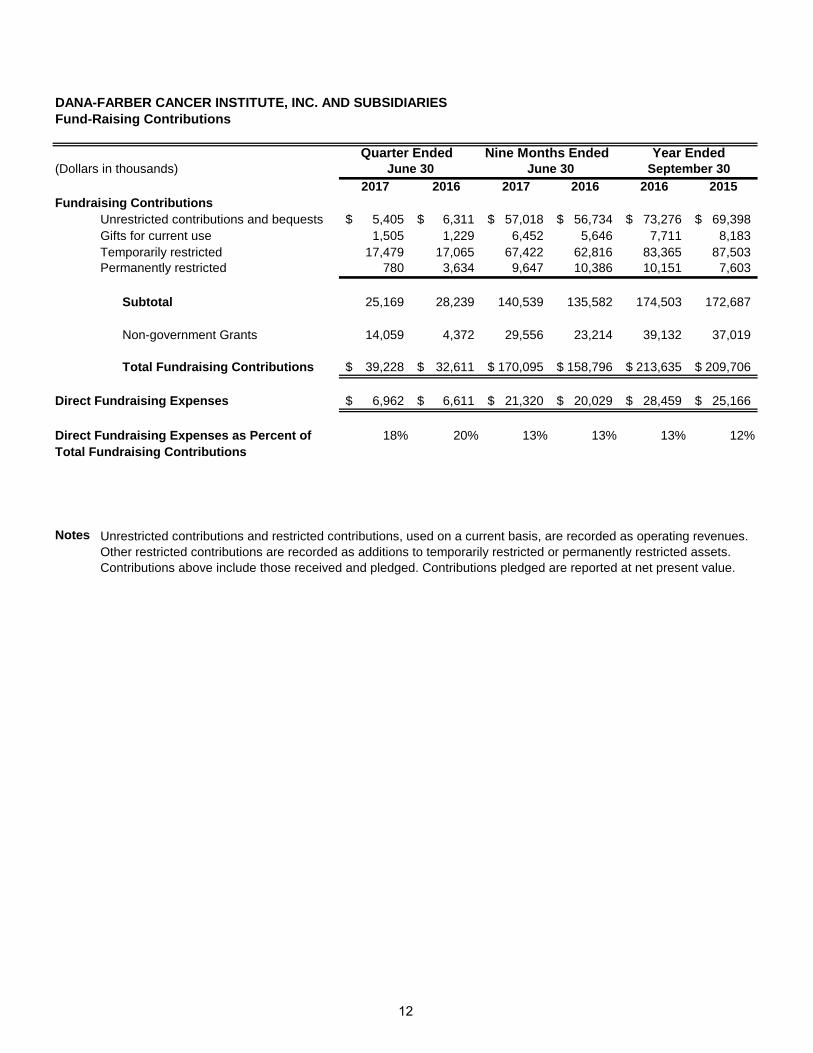
DANA-FARBER CANCER INSTITUTE, INC. AND SUBSIDIARIESFund-Raising Contributions
(Dollars in thousands)2017 2016 2017 2016 2016 2015
Fundraising ContributionsUnrestricted contributions and bequests 5,405$ 6,311$ 57,018$ 56,734$ 73,276$ 69,398$ Gifts for current use 1,505 1,229 6,452 5,646 7,711 8,183 Temporarily restricted 17,479 17,065 67,422 62,816 83,365 87,503 Permanently restricted 780 3,634 9,647 10,386 10,151 7,603
Subtotal 25,169 28,239 140,539 135,582 174,503 172,687
Non-government Grants 14,059 4,372 29,556 23,214 39,132 37,019
Total Fundraising Contributions 39,228$ 32,611$ 170,095$ 158,796$ 213,635$ 209,706$
Direct Fundraising Expenses 6,962$ 6,611$ 21,320$ 20,029$ 28,459$ 25,166$
Direct Fundraising Expenses as Percent of 18% 20% 13% 13% 13% 12%Total Fundraising Contributions
Notes Unrestricted contributions and restricted contributions, used on a current basis, are recorded as operating revenues. Other restricted contributions are recorded as additions to temporarily restricted or permanently restricted assets. Contributions above include those received and pledged. Contributions pledged are reported at net present value.
September 30June 30 June 30Quarter Ended Nine Months Ended Year Ended
12

DANA-FARBER CANCER INSTITUTE, INC. AND SUBSIDIARIES
Supplementary Information
See Annual Report filings for comparative annual consolidating financial statements contained in the Supplementary Information section of Audited Financial Statements. Restated annual consolidated financial statements presented in this current filing have been updated from what was presented in the Annual Report for ASU 2015-03 which reclassifies bond issuance costs from other assets to long-term debt, less current portion.
13

DANA-FARBER CANCER INSTITUTE, INC. AND SUBSIDIARIESConsolidating Balance Sheets
As Of June 30, 2017
(Dollars in thousands)
Obligated Group
Dana-Farber Cancer Care Network, Inc.
Eliminations and
Reclassifications Consolidated
ASSETS
Current AssetsCash and cash equivalents 136,938$ 564$ 137,502$ Patient accounts receivable, net 93,075 2,509 95,584 Contributions receivable, current portion 5,933 5,933 Assets whose use is limited, current portion 222,407 222,407 Research receivables 33,247 33,247 Prepaid expenses and other current assets 89,670 1,031 (25,215)$ 65,486
Total Current Assets 581,270 4,104 (25,215) 560,159 Investments 1,134,287 1,134,287 Assets whose use is limited by indenture
agreement or other, less current portion 12,808 12,808 Property, plant and equipment, net 892,912 1,563 894,475 Contributions receivable, less current portion 31,623 31,623 Other assets 48,902 48,902
TOTAL ASSETS 2,701,802$ 5,667$ (25,215)$ 2,682,254$
LIABILITIES AND NET ASSETSCurrent Liabilities
Accounts payable and accrued expenses 133,099$ 25,619$ (25,215)$ 133,503$ Amounts due to third party payors 48,561 48,561 Research advances 89,425 89,425 Current portion of long-term debt 9,459 9,459
Total Current Liabilities 280,544 25,619 (25,215) 280,948 Other Liabilities
Long-term debt, less current portion 774,471 774,471 Other Liabilities 177,826 177,826
952,297 - - 952,297 Net Assets
Unrestricted 698,273 (20,102) 678,171 Temporarily restricted 577,871 150 578,021 Permanently restricted 192,817 192,817
Total Net Assets 1,468,961 (19,952) - 1,449,009
TOTAL LIABILITIES AND NET ASSETS 2,701,802$ 5,667$ (25,215)$ 2,682,254$
14
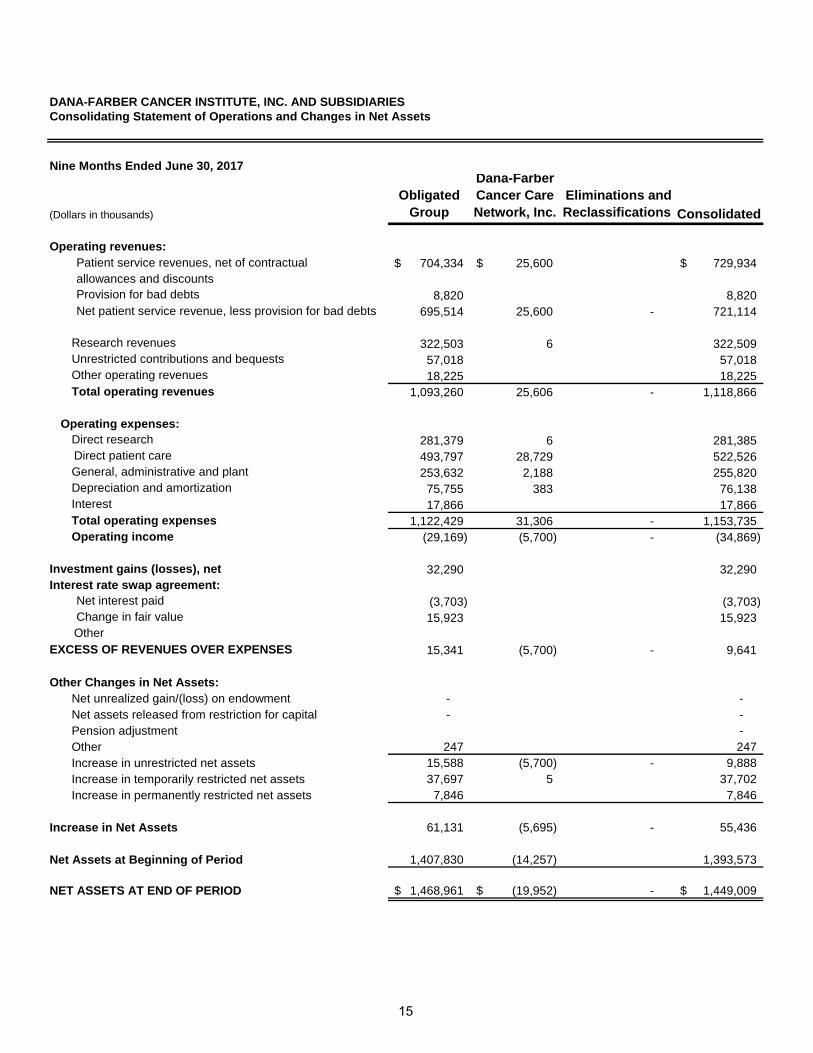
DANA-FARBER CANCER INSTITUTE, INC. AND SUBSIDIARIESConsolidating Statement of Operations and Changes in Net Assets
Nine Months Ended June 30, 2017
(Dollars in thousands)
Obligated Group
Dana-Farber Cancer Care Network, Inc.
Eliminations and Reclassifications Consolidated
Operating revenues: Patient service revenues, net of contractual 704,334$ 25,600$ 729,934$ allowances and discounts Provision for bad debts 8,820 8,820 Net patient service revenue, less provision for bad debts 695,514 25,600 - 721,114
Research revenues 322,503 6 322,509 Unrestricted contributions and bequests 57,018 57,018 Other operating revenues 18,225 18,225 Total operating revenues 1,093,260 25,606 - 1,118,866
Operating expenses:Direct research 281,379 6 281,385
Direct patient care 493,797 28,729 522,526 General, administrative and plant 253,632 2,188 255,820 Depreciation and amortization 75,755 383 76,138 Interest 17,866 17,866 Total operating expenses 1,122,429 31,306 - 1,153,735 Operating income (29,169) (5,700) - (34,869)
Investment gains (losses), net 32,290 32,290 Interest rate swap agreement: Net interest paid (3,703) (3,703) Change in fair value 15,923 15,923
OtherEXCESS OF REVENUES OVER EXPENSES 15,341 (5,700) - 9,641
Other Changes in Net Assets:Net unrealized gain/(loss) on endowment - - Net assets released from restriction for capital - - Pension adjustment - Other 247 247 Increase in unrestricted net assets 15,588 (5,700) - 9,888 Increase in temporarily restricted net assets 37,697 5 37,702 Increase in permanently restricted net assets 7,846 7,846
Increase in Net Assets 61,131 (5,695) - 55,436
Net Assets at Beginning of Period 1,407,830 (14,257) 1,393,573
NET ASSETS AT END OF PERIOD 1,468,961$ (19,952)$ - 1,449,009$
15

DANA-FARBER CANCER INSTITUTE, INC. AND SUBSIDIARIESConsolidating Statement of Operations and Changes in Net Assets
Quarter Ended June 30, 2017
(Dollars in thousands)
Obligated Group
Dana-Farber Cancer Care Network, Inc.
Eliminations and Reclassifications Consolidated
Operating revenues: Patient service revenues, net of contractual 230,513$ 8,039$ 238,552$ allowances and discounts Provision for bad debts 3,327 - 3,327 Net patient service revenue, less provision for bad debts 227,186 8,039 - 235,225
Research revenues 110,175 1 110,176 Unrestricted contributions and bequests 5,405 5,405 Other operating revenues 5,402 5,402 Total operating revenues 348,168 8,040 - 356,208
Operating expenses:Direct research 94,661 1 94,662
Direct patient care 175,089 9,409 184,498 General, administrative and plant 88,196 759 88,955 Depreciation and amortization 26,252 127 26,379 Interest 5,938 5,938 Total operating expenses 390,136 10,296 - 400,432 Operating income (41,968) (2,256) - (44,224)
Investment gains (losses), net 11,502 11,502 Interest rate swap agreement: Net interest paid (1,176) (1,176) Change in fair value (1,796) (1,796)
OtherEXCESS OF REVENUES OVER EXPENSES (33,438) (2,256) - (35,694)
Other Changes in Net Assets:Net unrealized gain/(loss) on endowment - - Net assets released from restriction for capital - - Pension adjustment - - Other 247 247 Increase in unrestricted net assets (33,191) (2,256) - (35,447) Increase in temporarily restricted net assets 13,677 (1) 13,676 Increase in permanently restricted net assets 879 879
Increase in Net Assets (18,635) (2,257) - (20,892)
Net Assets at Beginning of Period 1,487,596 (17,695) 1,469,901
NET ASSETS AT END OF PERIOD 1,468,961$ (19,952)$ - 1,449,009$
16
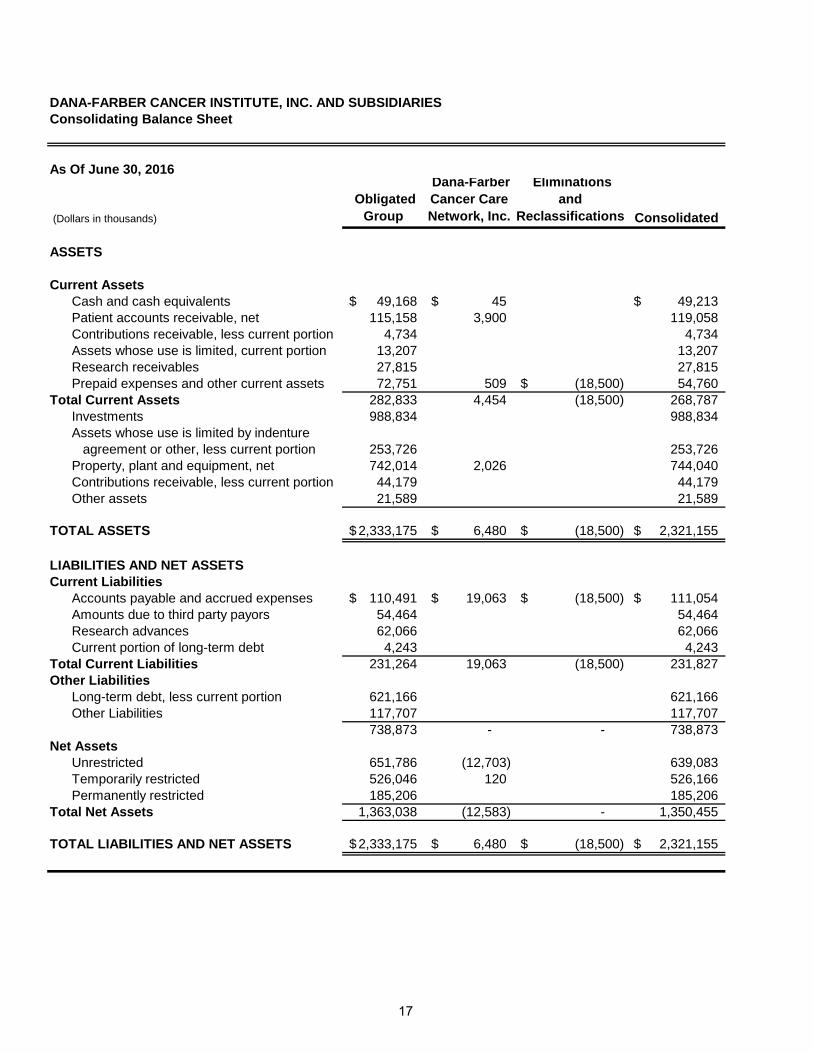
DANA-FARBER CANCER INSTITUTE, INC. AND SUBSIDIARIES Consolidating Balance Sheet
As Of June 30, 2016
(Dollars in thousands)
Obligated Group
Dana-Farber Cancer Care Network, Inc.
Eliminations and
Reclassifications Consolidated
ASSETS
Current AssetsCash and cash equivalents 49,168$ 45$ 49,213$ Patient accounts receivable, net 115,158 3,900 119,058 Contributions receivable, less current portion 4,734 4,734 Assets whose use is limited, current portion 13,207 13,207 Research receivables 27,815 27,815 Prepaid expenses and other current assets 72,751 509 (18,500)$ 54,760
Total Current Assets 282,833 4,454 (18,500) 268,787 Investments 988,834 988,834 Assets whose use is limited by indenture
agreement or other, less current portion 253,726 253,726 Property, plant and equipment, net 742,014 2,026 744,040 Contributions receivable, less current portion 44,179 44,179 Other assets 21,589 21,589
TOTAL ASSETS 2,333,175$ 6,480$ (18,500)$ 2,321,155$
LIABILITIES AND NET ASSETSCurrent Liabilities
Accounts payable and accrued expenses 110,491$ 19,063$ (18,500)$ 111,054$ Amounts due to third party payors 54,464 54,464 Research advances 62,066 62,066 Current portion of long-term debt 4,243 4,243
Total Current Liabilities 231,264 19,063 (18,500) 231,827 Other Liabilities
Long-term debt, less current portion 621,166 621,166 Other Liabilities 117,707 117,707
738,873 - - 738,873 Net Assets
Unrestricted 651,786 (12,703) 639,083 Temporarily restricted 526,046 120 526,166 Permanently restricted 185,206 185,206
Total Net Assets 1,363,038 (12,583) - 1,350,455
TOTAL LIABILITIES AND NET ASSETS 2,333,175$ 6,480$ (18,500)$ 2,321,155$
17

DANA-FARBER CANCER INSTITUTE, INC. AND SUBSIDIARIESConsolidating Statement of Operations and Changes in Net Assets
Nine Months Ended June 30, 2016
(Dollars in thousands)
Obligated Group
Dana-Farber Cancer Care Network, Inc.
Eliminations and
Reclassifications Consolidated
Operating revenues: Patient service revenues, net of contractual 657,851$ 30,236$ 688,087$ allowances and discounts Provision for bad debts 9,100 9,100 Net patient service revenue, less provision for bad debts 648,751 30,236 - 678,987
Research revenues 278,390 4 278,394 Unrestricted contributions and bequests 56,734 56,734 Other operating revenues 15,877 15,877 Total operating revenues 999,752 30,240 - 1,029,992
Operating expenses:Direct research 240,839 4 240,843
Direct patient care 423,523 32,158 455,681 General, administrative and plant 237,500 2,529 240,029 Depreciation and amortization 64,246 368 64,614 Interest 7,433 7,433 Total operating expenses 973,541 35,059 - 1,008,600 Operating income 26,211 (4,819) - 21,392
Investment gains (losses), net 10,805 10,805 Interest rate swap agreement: Net interest paid (4,040) (4,040) Change in fair value (14,843) (14,843)
OtherEXCESS OF REVENUES OVER EXPENSES 18,133 (4,819) - 13,314
Other Changes in Net Assets:Net unrealized gain/(loss) on endowment 90 90 Net assets released from restriction for capital 12,944 12,944 Pension adjustment - Other - Increase in unrestricted net assets 31,167 (4,819) - 26,348 Increase in temporarily restricted net assets 9,142 120 9,262 Increase in permanently restricted net assets 10,386 10,386
Increase in Net Assets 50,695 (4,699) - 45,996
Net Assets at Beginning of Period 1,312,343 (7,884) 1,304,459
NET ASSETS AT END OF PERIOD 1,363,038$ (12,583)$ - 1,350,455$
18
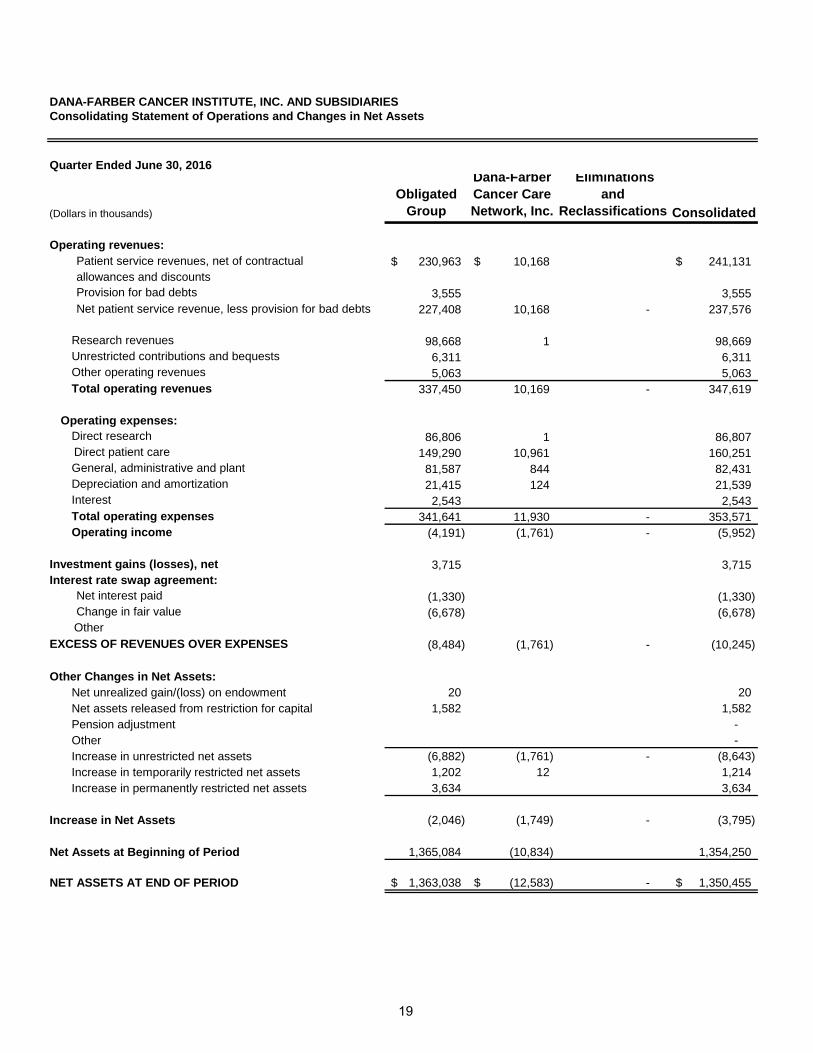
DANA-FARBER CANCER INSTITUTE, INC. AND SUBSIDIARIESConsolidating Statement of Operations and Changes in Net Assets
Quarter Ended June 30, 2016
(Dollars in thousands)
Obligated Group
Dana-Farber Cancer Care Network, Inc.
Eliminations and
Reclassifications Consolidated
Operating revenues: Patient service revenues, net of contractual 230,963$ 10,168$ 241,131$ allowances and discounts Provision for bad debts 3,555 3,555 Net patient service revenue, less provision for bad debts 227,408 10,168 - 237,576
Research revenues 98,668 1 98,669 Unrestricted contributions and bequests 6,311 6,311 Other operating revenues 5,063 5,063 Total operating revenues 337,450 10,169 - 347,619
Operating expenses:Direct research 86,806 1 86,807
Direct patient care 149,290 10,961 160,251 General, administrative and plant 81,587 844 82,431 Depreciation and amortization 21,415 124 21,539 Interest 2,543 2,543 Total operating expenses 341,641 11,930 - 353,571 Operating income (4,191) (1,761) - (5,952)
Investment gains (losses), net 3,715 3,715 Interest rate swap agreement: Net interest paid (1,330) (1,330) Change in fair value (6,678) (6,678)
OtherEXCESS OF REVENUES OVER EXPENSES (8,484) (1,761) - (10,245)
Other Changes in Net Assets:Net unrealized gain/(loss) on endowment 20 20 Net assets released from restriction for capital 1,582 1,582 Pension adjustment - Other - Increase in unrestricted net assets (6,882) (1,761) - (8,643) Increase in temporarily restricted net assets 1,202 12 1,214 Increase in permanently restricted net assets 3,634 3,634
Increase in Net Assets (2,046) (1,749) - (3,795)
Net Assets at Beginning of Period 1,365,084 (10,834) 1,354,250
NET ASSETS AT END OF PERIOD 1,363,038$ (12,583)$ - 1,350,455$
19