management’s discussion & analysis · pdf file4 objectives and strategy ......
TRANSCRIPT


Management ’s Discussion & Analysis
3 Introduction
3 Caution Regarding Forward-Looking Statements
3 Non-GAAP Financial Measures
3 General Business Overview
4 Objectives and Strategy
5 Performance Indicators
5 Significant Event of Fiscal 2007
7 Performance Analysis
8 Results of Operations
11 Distributable Income and Distributions
13 Funds from Operations
14 Adjusted Funds from Operations
15 Liquidity and Capital Resources
18 Property Portfolio
18 Acquisition and Development Program
22 Real Estate Operations
24 Issued and Outstanding Unit Data
25 Related-Party Transactions
26 Selected Quarterly Information
27 Fourth Quarter 2007 Results
29 Subsequent Events
29 Unitholder Taxation
29 Disclosure Controls and Procedures
29 Outlook
30 Significant Accounting Policies Adopted by Cominar and Use of Estimates
31 Recently Published Accounting Changes
31 New Accounting Policies Adopted in 2007
31 Risks and Uncertainties
34 Selected Financial Information
{ Table of Contents }
Consol idated F inancial Statements
35 Management’s Responsibility for Financial Reporting
36 Auditors’ Report
37 Consolidated Financial Statements
41 Notes to Consolidated Financial Statements
51 Corporate Information
52 Unitholder Information

3 } 20 07 A N N U A L R E P ORT
M A N A GE M E N T ’ S DIS C U S S ION A N D A N A LY SIS
Introduct ionThe following Management’s Discussion and Analysis (“MD&A”) is provided toenable a reader to assess the results of operations of Cominar Real EstateInvestment Trust (“Cominar”, the “Trust” or the “REIT”), for the fiscal year endedDecember 31, 2007, as well as its financial position at that date and its outlook.Dated March 13, 2008, this MD&A reflects all significant information available tothat date and should be read in conjunction with the consolidated financial state-ments and accompanying notes included in this report on page 56. Unless other-wise indicated, all amounts are in thousands of Canadian dollars, except for perunit and per square foot amounts, and are based on financial statements preparedin accordance with Canadian generally accepted accounting principles (“GAAP”).
Additional information about us, including our 2007 Annual Information Form, isavailable free of charge on our website at www.cominar.com and on the CanadianSecurities Administrators’ (“CSA”) website at www.sedar.com.
The Board of Trustees, under the recommendation of the Audit Committee, hasapproved the contents of this MD&A.
Caution Regarding Forward-Looking StatementsFrom time to time, we make written or oral forward-looking statements within themeaning of applicable Canadian securities legislation. We may make such state-ments in this document and in other filings with Canadian regulators, in reports tounitholders or in other communications. These forward-looking statementsinclude, among others, statements with respect to our medium-term and 2008objectives, and strategies to achieve our objectives, as well as statements withrespect to our beliefs, outlooks, plans, objectives, expectations, anticipations, estimates and intentions. The words “may”, “could”, “should”, “would”, “suspect”, “outlook”, “believe”, “plan”, “anticipate”, “estimate”, “expect”,“intend”, “forecast”, “objective” and words and expressions of similar import areintended to identify forward-looking statements.
By their very nature, forward-looking statements involve numerous factors andassumptions, and are subject to inherent risks and uncertainties, both general andspecific, which give rise to the possibility that predictions, forecasts, projectionsand other forward-looking statements will not be achieved. We caution readers notto place undue reliance on these statements as a number of important factors couldcause our actual results to differ materially from the expectations expressed in suchforward-looking statements. These factors include general business and economic
conditions in Canada, the effects of competition in the markets where we operate,the impact of changes in laws and regulations, including tax laws, successful execution of our strategy, our ability to complete and integrate acquisitions successfully, our ability to attract and retain key employees and executives, thefinancial position of customers, our ability to refinance our debts upon maturityand to lease vacant space, as well as changes in interest rates.
We caution that the foregoing list of important factors that may affect future resultsis not exhaustive. When relying on our forward-looking statements to make deci-sions with respect to us, investors and others should carefully consider the fore-going factors and other uncertainties and potential events.
Additional information about these factors can be found in the “Risks andUncertainties” section of this MD&A.
Non-GAAP F inancial MeasuresWe issue guidance on and report on certain non-GAAP measures, including “netoperating income”, “distributable income”, “funds from operations” and “adjustedfunds from operations”, which we use to evaluate our performance. Because non-GAAP measures do not have a standardized meaning and may differ from similarmeasures presented by other issuers, securities regulations require that non-GAAPmeasures be clearly defined and qualified, reconciled with their nearest GAAPmeasure and given no more prominence than the closest GAAP measure. You mayfind such information in the sections dealing with these financial measures.
General Business OverviewCominar Real Estate Investment Trust is the largest owner of commercial proper-ties in the Province of Québec. As of March 13, 2008, we own and manage a high-quality portfolio of 208 properties including 36 office buildings, 38 retail buildingsand 134 industrial and mixed-use buildings covering over 17.0 million square feetin the Québec City, Montréal and Ottawa areas.
Since its inception in 1998, Cominar has made a series of acquisitions and com-pleted many construction and property development projects. During fiscal 2007,we added 67 properties to Cominar’s real estate portfolio, representing over 6.8 million square feet of leasable area. Consequently, the gross book value of ourreal estate assets has increased more than sixfold since 1998, rising from $244.6million to over $1.5 billion as at December 31, 2007.

20 07 A N N U A L R E P ORT { 4
Our asset and property management is internalized and we are a fully integrated,self-managed real estate investment operation. This mode of operation reduces thepotential for conflict between the interests of management and the Trust, whileensuring that the interests of management and employees are aligned with thoseof unitholders. The result is an improved financial performance for Cominar.
Object ives and StrategyOBJECTIVESCominar’s primary objectives are to provide its unitholders with growing tax-deferred cash distributions, payable monthly, and to increase and maximize unitvalue through proactive management and the growth of its property portfolio.
STRATEGYTo continue to ensure the growth of distributions and to increase return on investmentfor unitholders, Cominar strives to manage growth, operational risk and debt in a flexible and prudent manner. The key strategic axes for reaching these objectives are:
• Acquisition as well as construction, redevelopment and expansion of properties offering a high potential for return
To increase the leasable area in its property portfolio, Cominar continues to seekacquisition, construction and development opportunities in the Quebec City, Montrealand Ottawa areas. The key criterion in evaluating any acquisition or development continues to be the ratio between the acquisition or development price, the relateddebt and the anticipated profitability of the project in question over he short andlong term. Cominar maintains a conservative growth strategy, based on a very strictselection of properties to be acquired and the construction and development of quality properties in locations in great demand with customers.
• Diversification of our property portfolio
This strategic axis includes the following elements:
(a) Sector diversification has been an integral part of our strategy from the begin-ning and consists in maintaining the right balance in our property portfolio among three sectors of activity: office buildings, retail properties and industrial and mixed-use properties. By diversifying our activities among three types of properties, Cominar reduces the risk associated with any given sector. This diversification contributes to steady revenue and income growth.
(b)Geographic diversification – While consolidating its dominant position in the Québec City area, Cominar has from the outset established a major presence in the Montréal area where it owns, as at March 13, 2008, 112 properties repre-senting approximately 10.1 million square feet of leasable area. In addition, in 2007, Cominar acquired its first properties in the Ottawa region. As with sector diversification, geographic diversification allows Cominar to better mitigate the risks associated with the real estate business.
(c) Customer diversification – Cominar serves an extensive and diverse customer base operating in many sectors of activity. Customers occupy an average area of 7,000 square feet. This diversification allows us to maintain foreseeable cash flows.
• Proactive property management emphasizing the growth of occupancy rates and net leasing income
Retail real estate is a dynamic investment and requires active and experiencedmanagement. With its integrated management, Cominar exercises rigorous, preventive and cost-effective control over its operations. Expanding our propertyportfolio enables us to achieve economies of scale and synergies. We therebyassure delivery of efficient, cost-effective services to our customers. The result isincreased customer satisfaction and high occupancy and retention rates.
• Prudent financial management
Debt management continues to be a decisive factor in growth and stability for areal estate investment trust. Cominar maintains its debt ratio below the maximumauthorized by its Contract of Trust and at a level we deem prudent. We believe thatthis disciplined policy contributes to the stability of future distributions and to prudent growth of the Trust. We also take a conservative approach to managing thedistributions ratio, which we regard as another key factor in the stability of futuredistributions. This approach allows us to retain the funds needed for our capitalexpenditures and for the implementation of our leasing programs.
M A N A GE M E N T ’ S DIS C U S S ION A N D A N A LY S IS
5 } 20 07 A N N U A L R E P ORT
M A N A GE M E N T ’ S DIS C U S S ION A N D A N A LY SIS
Performance IndicatorsCominar measures the success of our strategy with a number of performance indi-cators, as follows:
Operational Performance Customer satisfaction is defined as customer perception and judgment of the service received and their loyalty with respect to Cominar. Two indicators are usedto measure customer satisfaction: occupancy rate and retention rate; the latter iscalculated as the leasable space of renewed leases divided by the leasable space ofleases that expired during the year.
Financial Performance To measure our financial performance, Cominar uses the following key indicators:
• same property net operating income, which provides an indication of the opera-ting profitability of the existing portfolio, i.e. Cominar’s ability to increase revenues and reduce costs, and thereby generate added value for its unitholders;
• the NOI margin, which provides an indication of the operating profitability of the portfolio;
• (recurring) distributable income per unit, which represents a benchmark for investors to judge the stability of distributions;
• (recurring) funds from operations per unit, which represent a significant measure of Cominar’s ability to generate cash flows;
• (recurring) adjusted funds from operations per unit, which considers leasing costs and capital expenditures and can vary significantly from one entity to another and/or according to their sector of activity; and
• the debt ratio, which is used to assess the financial balance essential to the smooth running of an organization.
Definitions and other information regarding these performance indicators are provided in the relevant sections.
Signif icant Event of F iscal 2007
ACQUISIT ION OF PROPERTIES FROM ALEXIS NIHON REAL ESTATE
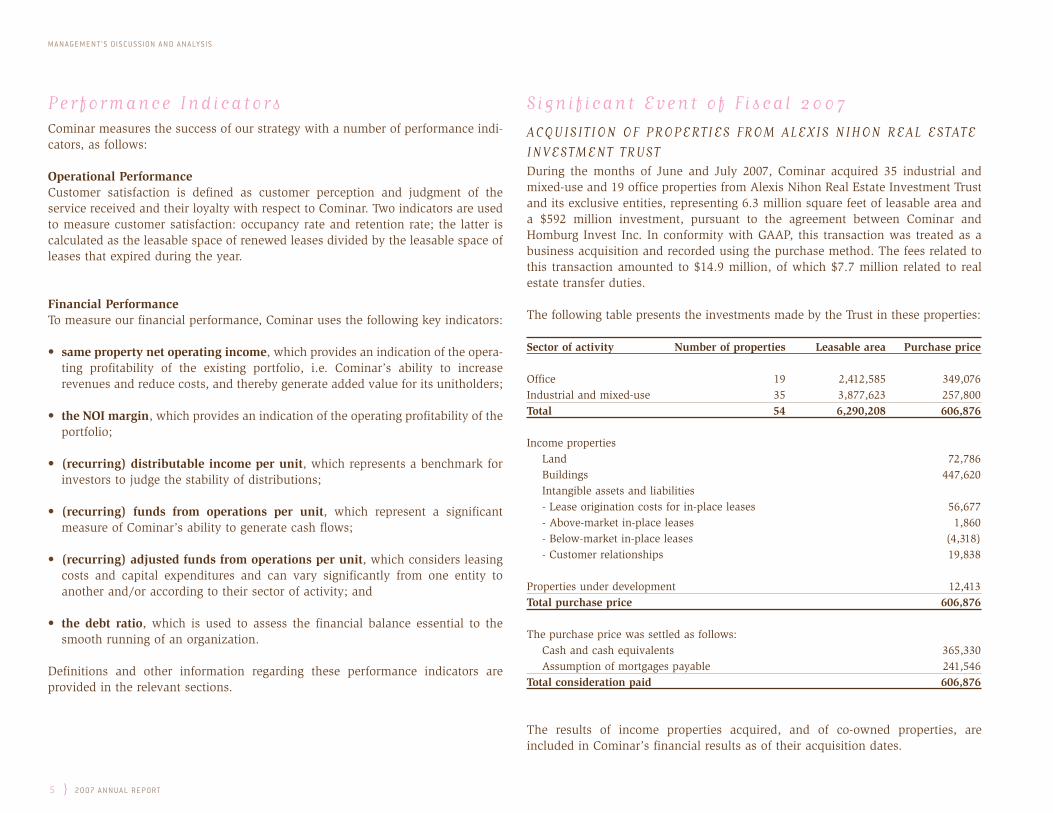
INVESTMENT TRUSTDuring the months of June and July 2007, Cominar acquired 35 industrial andmixed-use and 19 office properties from Alexis Nihon Real Estate Investment Trustand its exclusive entities, representing 6.3 million square feet of leasable area anda $592 million investment, pursuant to the agreement between Cominar andHomburg Invest Inc. In conformity with GAAP, this transaction was treated as abusiness acquisition and recorded using the purchase method. The fees related tothis transaction amounted to $14.9 million, of which $7.7 million related to realestate transfer duties.
The following table presents the investments made by the Trust in these properties:
Sector of activity Number of properties Leasable area Purchase price
Office 19 2,412,585 349,076Industrial and mixed-use 35 3,877,623 257,800Total 54 6,290,208 606,876
Income propertiesLand 72,786Buildings 447,620Intangible assets and liabilities- Lease origination costs for in-place leases 56,677- Above-market in-place leases 1,860- Below-market in-place leases (4,318)- Customer relationships 19,838
Properties under development 12,413Total purchase price 606,876
The purchase price was settled as follows:Cash and cash equivalents 365,330Assumption of mortgages payable 241,546
Total consideration paid 606,876
The results of income properties acquired, and of co-owned properties, are included in Cominar’s financial results as of their acquisition dates.

20 07 A N N U A L R E P ORT { 6
Information on the acquired properties is presented in the following table:
Income property City Sector(1) Leasablearea (sq.ft.)
1080 Beaver Hall Hill, Montréal O 319,2394700 de la Savane, Montréal O 189,933455 Fénelon Blvd., Dorval O 95,6569900 Cavendish Blvd., St-Laurent O 84,6939999 Cavendish Blvd., St-Laurent O 51,1009960-9970 Chemin de la Côte-de-Liesse, Lachine O 24,8171 Place Laval, Laval O 123,8702 Place Laval, Laval O 101,9303 Place Laval, Laval O 188,0774 Place Laval, Laval O 140,2373080 Le Carrefour Blvd., Laval O 89,0703090 Le Carrefour Blvd., Laval O 73,0523100 Le Carrefour Blvd., Laval O 77,4802525 Daniel-Johnson Blvd., Laval O 110,2581111 Dr. Frederik-Philips Blvd., St-Laurent O 102,7443300 de la Côte-Vertu Blvd., St-Laurent O 98,268550 de la Cité Blvd., Gatineau O 320,742480 de la Cité Blvd., Gatineau O 45,528400 Cooper St., Ottawa O 175,8913071-3075 Louis-A.-Amos, Lachine I 164,1951615-1805 55th Avenue, Dorval I 158,3103339-3403 Griffith St., Saint-Laurent I 118,1028100 Cavendish Blvd., Saint-Laurent I 114,5961949 Onésime-Gagnon St., Lachine I 95,7692260 32nd Avenue, Lachine I 92,4292102-2150 32nd Avenue, Lachine I 77,4162024-2080 32nd Avenue, Lachine I 68,4306320-6380 Chemin de la Côte-De-Liesse, Saint-Laurent I 58,4832025 de la Métropole St., Longueuil I 206,5231925-1975 Hymus Blvd., Dorval I 105,70880-140 Lindsay Avenue, Dorval I 44,3818411-8453 Chemin Dalton, Mont-Royal I 31,5208459-8497 Chemin Dalton, Mont-Royal I 41,7038545-8579 Chemin Dalton, Mont-Royal I 38,4238605-8639 Chemin Dalton, Mont-Royal I 37,4637527-7583 Henri-Bourassa Blvd., Montréal I 138,9158552-8648 Pie-IX Blvd, Montréal I 147,629
Income property City Sector(1) Leasablearea (sq.ft.)
8740-8878 Pie-IX Blvd., Montréal I 165,5897075 Place Robert-Joncas, Saint-Laurent I 218,4731225 Volta St., Boucherville I 225,6002000 Halpern St., Saint-Laurent I 527,0002105 23rd Avenue, Lachine I 318,9601111 46th Avenue, Lachine I 107,6441200 55th Avenue, Lachine (50% co-owned) (2) I 34,2315055 Lévy St., Saint-Laurent I 60,6662400 Trans-Canada Highway, Pointe-Claire I 194,993243 Hymus Blvd., Pointe-Claire I 40,0002555 Pitfield Blvd., Saint-Laurent I 99,000731-749 Meloche Avenue, Dorval (25% co-owned) (2) I 8,892703-729 Meloche Avenue, Dorval (25% co-owned) (2) I 7,927679-701 Meloche Avenue, Dorval (25% co-owned) (2) I 8,6901730-1850 55th Avenue, Lachine (50% co-owned) (2) I 39,5121520-1660 55th Avenue, Lachine (50% co-owned) (2) I 39,5121875 55th Avenue, Dorval (50% co-owned) (2) I 40,939TOTAL 6,290,208
(1) O = Office, I = Industrial and mixed-use(2) Leasable area indicated reflects Cominar's share in the building
M A N A GE M E N T ’ S DIS C U S S ION A N D A N A LY S IS

7 } 20 07 A N N U A L R E P ORT
M A N A GE M E N T ’ S DIS C U S S ION A N D A N A LY SIS
Performance Analysis
RESULTS OF OPERATIONSThe following table summarizes our results of operations for fiscal 2007 and 2006,and should be read in conjunction with the financial statements and accom-panying notes presented in this Annual Report. It should be noted that certainamounts for fiscal 2006 have been reclassified as “discontinued operations” in conformity with GAAP.
For the years ended December 31, 2007 2006 ∆$
Operating revenues 182,124 126,750 55,374Operating expenses 72,353 49,699 22,654Net operating income 109,771 77,051 32,720Interest on borrowings 35,711 20,712 14,999Depreciation of income properties 35,514 15,261 20,253Amortization of deferred leasing costs 6,965 6,139 826Amortization of other assets 196 177 19Trust administrative expenses 2,968 2,130 838Other revenues 394 489 (95)Unusual items 422 (554) 976Net income from continuing operations 29,233 32,567 (3,334)Net income from discontinued operations 8 1,508 (1,500)Net income 29,241 34,075 (4,834)
Net income per unit (basic) 0.70 0.99 (0.29)Net income per unit (diluted) 0.69 0.98 (0.29)
FINANCIAL POSITIONThe following table summarizes our assets and liabilities as well as unitholders’equity as at December 31, 2007 and 2006, and should be read in conjunction withthe financial statements and accompanying notes presented in this Annual Report.
As at December 31, 2007 2006 ∆$
ASSETSIncome properties (amortized cost) 1,323,095 711,441 611,654Properties under development and
land held for future development 61,280 24,232 37,048Other assets 58,419 50,782 7,637Total 1,442,794 786,455 656,339
LIABILIT IESMortgages payable 619,755 270,142 349,613Convertible debentures 203,852 39,984 163,868Bank indebtedness 35,321 73,616 (38,295)Other liabilities 42,170 25,705 16,465
901,098 409,447 491,651
UNITHOLDERS’ EQUITY 541,696 377,008 164,688
Total 1,442,794 786,455 656,339
PERFORMANCE INDICATORSThe following table summarizes our performance indicators for fiscal 2007 and2006. A detailed analysis of each of these performance indicators is provided onthe page indicated:
P E R FO R M A N C E I N D I C ATO R S
Page 2007 2006 ∆$ ∆%
Same property net operating income 27 72,464 70,380 2,084 3.0DI per unit (basic) 30 1.51 1.41 0.10 7.1Recurring funds from operations per unit (basic) 32 1.73 1.64 0.09 5.5Recurring adjusted funds from perations
per unit (basic) 33 1.43 1.35 0.08 5.9
20 07 A N N U A L R E P ORT { 8
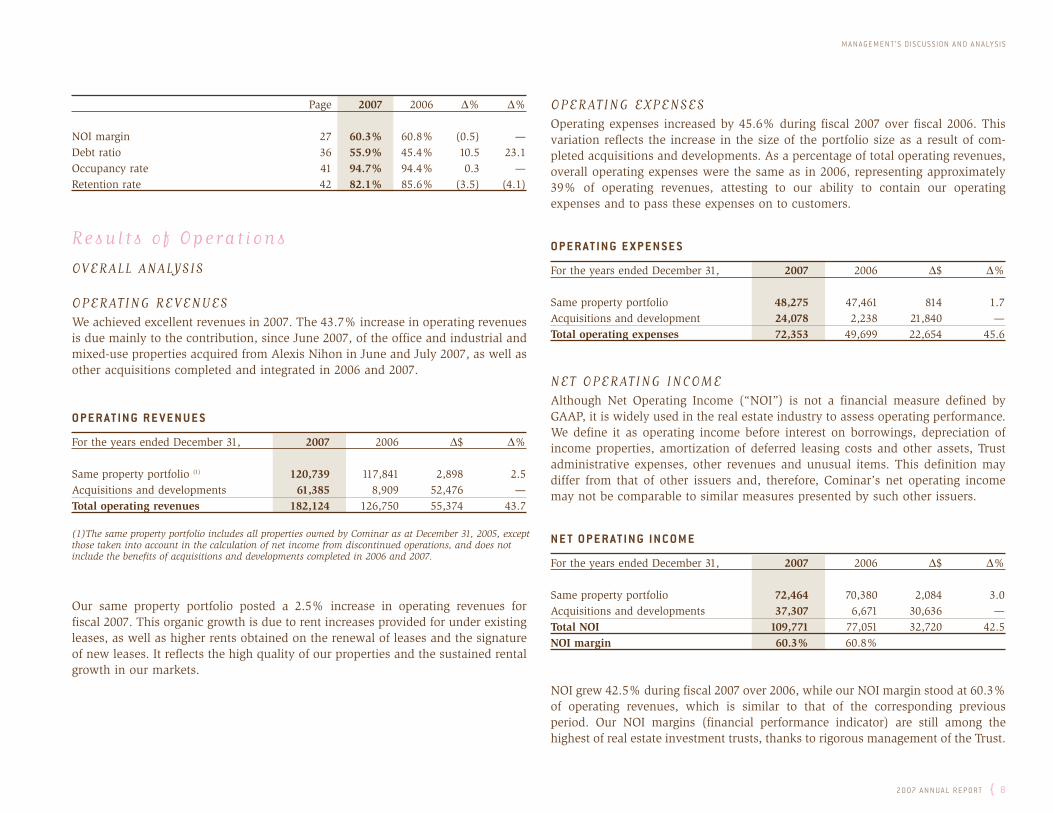
Page 2007 2006 ∆% ∆%
NOI margin 27 60.3% 60.8% (0.5) —Debt ratio 36 55.9% 45.4% 10.5 23.1Occupancy rate 41 94.7% 94.4% 0.3 —Retention rate 42 82.1% 85.6% (3.5) (4.1)
Results of Operat ions
OVERALL ANALYSIS
OPERATING REVENUESWe achieved excellent revenues in 2007. The 43.7% increase in operating revenuesis due mainly to the contribution, since June 2007, of the office and industrial andmixed-use properties acquired from Alexis Nihon in June and July 2007, as well asother acquisitions completed and integrated in 2006 and 2007.
O P E R AT I N G R E V E N U E S
For the years ended December 31, 2007 2006 ∆$ ∆%
Same property portfolio (1) 120,739 117,841 2,898 2.5Acquisitions and developments 61,385 8,909 52,476 —Total operating revenues 182,124 126,750 55,374 43.7
(1)The same property portfolio includes all properties owned by Cominar as at December 31, 2005, except those taken into account in the calculation of net income from discontinued operations, and does not include the benefits of acquisitions and developments completed in 2006 and 2007.
Our same property portfolio posted a 2.5% increase in operating revenues for fiscal 2007. This organic growth is due to rent increases provided for under existingleases, as well as higher rents obtained on the renewal of leases and the signatureof new leases. It reflects the high quality of our properties and the sustained rentalgrowth in our markets.
OPERATING EXPENSESOperating expenses increased by 45.6% during fiscal 2007 over fiscal 2006. Thisvariation reflects the increase in the size of the portfolio size as a result of com-pleted acquisitions and developments. As a percentage of total operating revenues,overall operating expenses were the same as in 2006, representing approximately39% of operating revenues, attesting to our ability to contain our operating expenses and to pass these expenses on to customers.
O P E R AT I N G E X P E N S E S
For the years ended December 31, 2007 2006 ∆$ ∆%
Same property portfolio 48,275 47,461 814 1.7Acquisitions and development 24,078 2,238 21,840 —Total operating expenses 72,353 49,699 22,654 45.6
NET OPERATING INCOMEAlthough Net Operating Income (“NOI”) is not a financial measure defined byGAAP, it is widely used in the real estate industry to assess operating performance.We define it as operating income before interest on borrowings, depreciation ofincome properties, amortization of deferred leasing costs and other assets, Trustadministrative expenses, other revenues and unusual items. This definition maydiffer from that of other issuers and, therefore, Cominar’s net operating incomemay not be comparable to similar measures presented by such other issuers.
N E T O P E R AT I N G I N C O M E
For the years ended December 31, 2007 2006 ∆$ ∆%
Same property portfolio 72,464 70,380 2,084 3.0Acquisitions and developments 37,307 6,671 30,636 —Total NOI 109,771 77,051 32,720 42.5NOI margin 60.3% 60.8%
NOI grew 42.5% during fiscal 2007 over 2006, while our NOI margin stood at 60.3%of operating revenues, which is similar to that of the corresponding previous period. Our NOI margins (financial performance indicator) are still among the highest of real estate investment trusts, thanks to rigorous management of the Trust.
M A N A GE M E N T ’ S DIS C U S S ION A N D A N A LY S IS
9 } 20 07 A N N U A L R E P ORT
M A N A GE M E N T ’ S DIS C U S S ION A N D A N A LY SIS
Same property NOI (financial performance indicator) grew 3.0% during fiscal 2007due mainly to the increase in operating revenues and to a stringent control of operating expenses.
Cominar’s management considers the analysis of same property NOI particularlyimportant because this measure provides an indication of our success in contai-ning operating expenses and our ability to transfer these controlled expenses to ourcustomers. The growth in operating revenues also attests to our ability to nego-tiate lease agreements that provide growing cash flows over time, thereby contributing to the delivery of added value for unitholders.
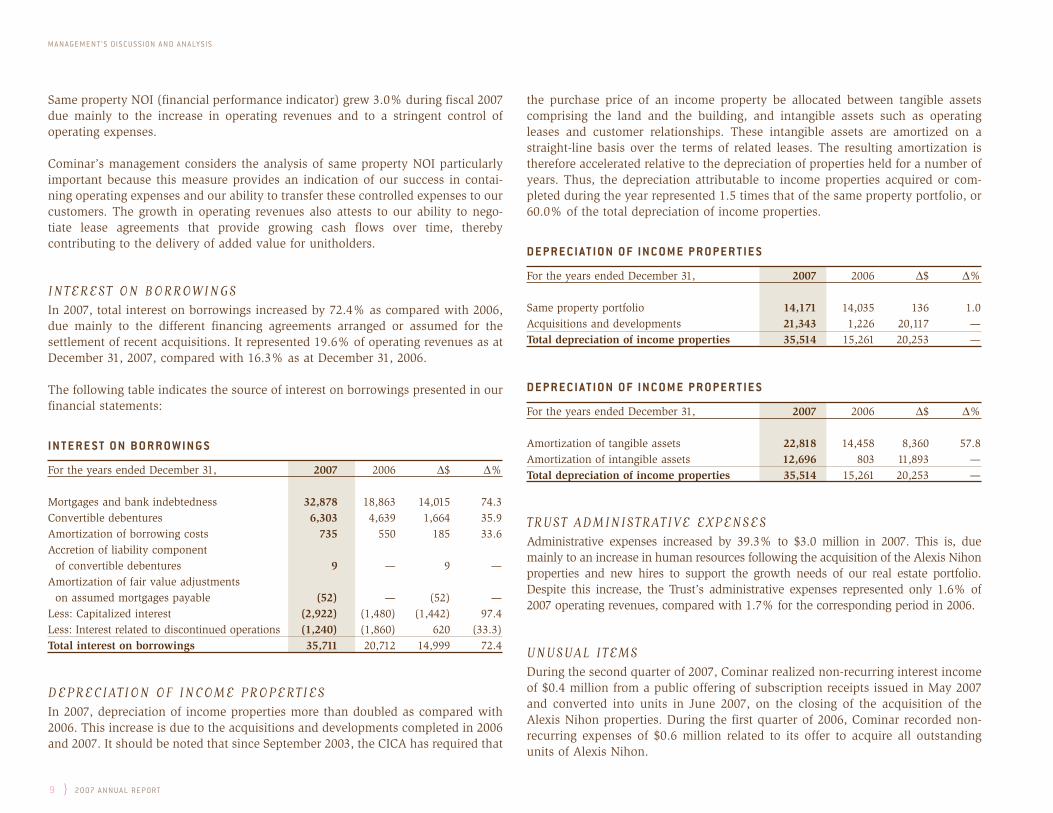
INTEREST ON BORROWINGSIn 2007, total interest on borrowings increased by 72.4% as compared with 2006,due mainly to the different financing agreements arranged or assumed for the settlement of recent acquisitions. It represented 19.6% of operating revenues as atDecember 31, 2007, compared with 16.3% as at December 31, 2006.
The following table indicates the source of interest on borrowings presented in ourfinancial statements:
I N T E R E S T O N B O R R O W I N G S
For the years ended December 31, 2007 2006 ∆$ ∆%
Mortgages and bank indebtedness 32,878 18,863 14,015 74.3Convertible debentures 6,303 4,639 1,664 35.9Amortization of borrowing costs 735 550 185 33.6Accretion of liability component
of convertible debentures 9 — 9 —Amortization of fair value adjustments
on assumed mortgages payable (52) — (52) —Less: Capitalized interest (2,922) (1,480) (1,442) 97.4Less: Interest related to discontinued operations (1,240) (1,860) 620 (33.3)Total interest on borrowings 35,711 20,712 14,999 72.4
DEPRECIATION OF INCOME PROPERTIESIn 2007, depreciation of income properties more than doubled as compared with2006. This increase is due to the acquisitions and developments completed in 2006and 2007. It should be noted that since September 2003, the CICA has required that
the purchase price of an income property be allocated between tangible assetscomprising the land and the building, and intangible assets such as operating leases and customer relationships. These intangible assets are amortized on astraight-line basis over the terms of related leases. The resulting amortization istherefore accelerated relative to the depreciation of properties held for a number ofyears. Thus, the depreciation attributable to income properties acquired or com-pleted during the year represented 1.5 times that of the same property portfolio, or60.0% of the total depreciation of income properties.
D E P R E C I AT I O N O F I N C O M E P R O P E R T I E S
For the years ended December 31, 2007 2006 ∆$ ∆%
Same property portfolio 14,171 14,035 136 1.0Acquisitions and developments 21,343 1,226 20,117 —Total depreciation of income properties 35,514 15,261 20,253 —
D E P R E C I AT I O N O F I N C O M E P R O P E R T I E S
For the years ended December 31, 2007 2006 ∆$ ∆%
Amortization of tangible assets 22,818 14,458 8,360 57.8Amortization of intangible assets 12,696 803 11,893 —Total depreciation of income properties 35,514 15,261 20,253 —
TRUST ADMINISTRATIVE EXPENSESAdministrative expenses increased by 39.3% to $3.0 million in 2007. This is, due mainly to an increase in human resources following the acquisition of the Alexis Nihonproperties and new hires to support the growth needs of our real estate portfolio.Despite this increase, the Trust’s administrative expenses represented only 1.6% of2007 operating revenues, compared with 1.7% for the corresponding period in 2006.
UNUSUAL ITEMSDuring the second quarter of 2007, Cominar realized non-recurring interest incomeof $0.4 million from a public offering of subscription receipts issued in May 2007and converted into units in June 2007, on the closing of the acquisition of theAlexis Nihon properties. During the first quarter of 2006, Cominar recorded non-recurring expenses of $0.6 million related to its offer to acquire all outstandingunits of Alexis Nihon.
20 07 A N N U A L R E P ORT { 10
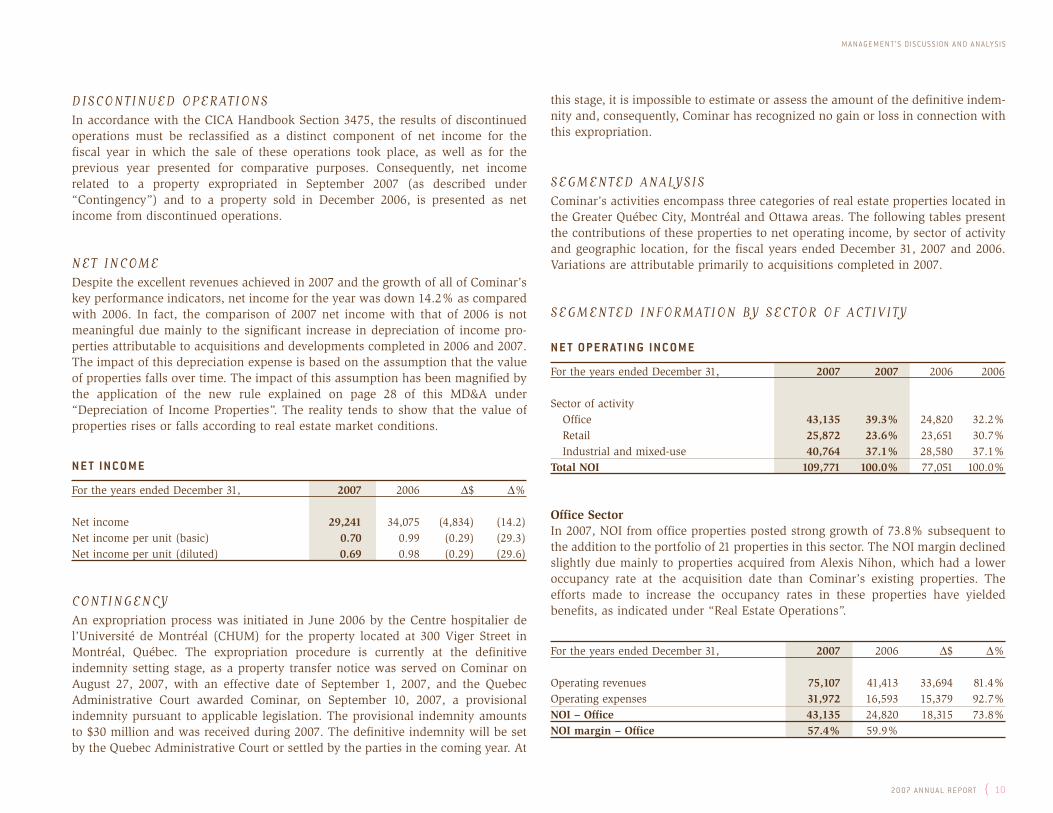
DISCONTINUED OPERATIONSIn accordance with the CICA Handbook Section 3475, the results of discontinuedoperations must be reclassified as a distinct component of net income for the fiscal year in which the sale of these operations took place, as well as for the previous year presented for comparative purposes. Consequently, net income related to a property expropriated in September 2007 (as described under“Contingency”) and to a property sold in December 2006, is presented as netincome from discontinued operations.
NET INCOMEDespite the excellent revenues achieved in 2007 and the growth of all of Cominar’skey performance indicators, net income for the year was down 14.2% as comparedwith 2006. In fact, the comparison of 2007 net income with that of 2006 is notmeaningful due mainly to the significant increase in depreciation of income pro-perties attributable to acquisitions and developments completed in 2006 and 2007.The impact of this depreciation expense is based on the assumption that the valueof properties falls over time. The impact of this assumption has been magnified bythe application of the new rule explained on page 28 of this MD&A under“Depreciation of Income Properties”. The reality tends to show that the value ofproperties rises or falls according to real estate market conditions.
N E T I N C O M E
For the years ended December 31, 2007 2006 ∆$ ∆%
Net income 29,241 34,075 (4,834) (14.2)Net income per unit (basic) 0.70 0.99 (0.29) (29.3)Net income per unit (diluted) 0.69 0.98 (0.29) (29.6)
CONTINGENCYAn expropriation process was initiated in June 2006 by the Centre hospitalier del’Université de Montréal (CHUM) for the property located at 300 Viger Street inMontréal, Québec. The expropriation procedure is currently at the definitiveindemnity setting stage, as a property transfer notice was served on Cominar onAugust 27, 2007, with an effective date of September 1, 2007, and the QuebecAdministrative Court awarded Cominar, on September 10, 2007, a provisionalindemnity pursuant to applicable legislation. The provisional indemnity amountsto $30 million and was received during 2007. The definitive indemnity will be setby the Quebec Administrative Court or settled by the parties in the coming year. At
this stage, it is impossible to estimate or assess the amount of the definitive indem-nity and, consequently, Cominar has recognized no gain or loss in connection withthis expropriation.
SEGMENTED ANALYSISCominar’s activities encompass three categories of real estate properties located inthe Greater Québec City, Montréal and Ottawa areas. The following tables presentthe contributions of these properties to net operating income, by sector of activityand geographic location, for the fiscal years ended December 31, 2007 and 2006.Variations are attributable primarily to acquisitions completed in 2007.
SEGMENTED INFORMATION BY SECTOR OF ACTIVITY
N E T O P E R AT I N G I N C O M E
For the years ended December 31, 2007 2007 2006 2006
Sector of activityOffice 43,135 39.3% 24,820 32.2%Retail 25,872 23.6% 23,651 30.7%Industrial and mixed-use 40,764 37.1% 28,580 37.1%
Total NOI 109,771 100.0% 77,051 100.0%
Office SectorIn 2007, NOI from office properties posted strong growth of 73.8% subsequent tothe addition to the portfolio of 21 properties in this sector. The NOI margin declinedslightly due mainly to properties acquired from Alexis Nihon, which had a loweroccupancy rate at the acquisition date than Cominar’s existing properties. Theefforts made to increase the occupancy rates in these properties have yielded benefits, as indicated under “Real Estate Operations”.
For the years ended December 31, 2007 2006 ∆$ ∆%
Operating revenues 75,107 41,413 33,694 81.4%Operating expenses 31,972 16,593 15,379 92.7%NOI – Office 43,135 24,820 18,315 73.8%NOI margin – Office 57.4% 59.9%
M A N A GE M E N T ’ S DIS C U S S ION A N D A N A LY S IS

11 } 20 07 A N N U A L R E P ORT
M A N A GE M E N T ’ S DIS C U S S ION A N D A N A LY SIS
Retail SectorThe retail sector’s net operating income grew 9.4% in 2007 over the previous year,which represents an appreciable increase considering the fierce competition cur-rently prevailing, especially in the Québec City region.
For the years ended December 31, 2007 2006 ∆$ ∆%
Operating revenues 44,344 41,130 3,214 7.8%Operating expenses 18,472 17,479 993 5.7%NOI – retail 25,872 23,651 2,221 9.4%NOI margin – retail 58.3% 57.5%
Industrial and Mixed-Use SectorThe industrial and mixed-use sector achieved an excellent performance in 2007,with a 42.6% increase in NOI stemming primarily from acquisitions during the year.This sector’s operating revenues grew by 41.8%, whereas the increase in operatingexpenses was limited to 40.2%, contributing to maintain a stable NOI margin.
For the years ended December 31, 2007 2006 ∆$ ∆%
Operating revenues 62,673 44,207 18,466 41.8%Operating expenses 21,909 15,627 6,282 40.2%NOI – Industrial and mixed-use 40,764 28,580 12,184 42.6%NOI margin – Industrial and mixed-use 65.0% 64.7%
The following table shows that the recently completed acquisitions, primarily in theMontréal and Ottawa regions, have contributed to a better breakdown of revenueand profit streams, thereby minimizing the risk associated with any one region.
SEGMENTED INFORMATION BY GEOGRAPHIC LOCATION
N E T O P E R AT I N G I N C O M E
For the years ended December 31, 2007 2007 2006 2006
Region: Québec City 53,205 48.5% 50,780 65.9%Montréal 51,488 46.9% 26,271 34.1%Ottawa 5,078 4.6% — —
Total NOI 109,771 100.0% 77,051 100.0%
Distr ibutable Income and Distr ibut ionsAlthough the concept of “distributable income” (“DI”) is not a financial measuredefined under GAAP, it is a measure widely used in the field of income trusts. Weconsider DI an excellent tool for assessing the Trust’s performance. Given its historical nature, DI per unit is also a benchmark enabling investors to ascertainthe stability of distributions. Pursuant to the Contract of Trust governing Cominar,the total annual distributions paid monthly to unitholders must represent at least85% of annual DI.
The following presents the calculation of DI in accordance with the terms of theContract of Trust as well as reconciliation with net income calculated in accordancewith GAAP:
D I S T R I B U TA B L E I N C O M E
For the years ended December 31, 2007 2006 ∆$
Net income (GAAP) 29,241 34,075 (4,834)+ Depreciation of income properties 36,132 16,276 19,856+ Amortization of (below-market)/above-market leases (250) 120 (370)+ Compensation costs related to unit option plan 217 179 38+ Accretion of liability component of convertible
debentures 9 — 9- Deferred rentals (2,060) (1,754) (306)- Gain on sale of real estate assets — (835) 835- Amortization of fair value adjustments
on assumed mortgages payable (52) — (52)
DI 63,237 48,061 15,176+ Unusual item (422) 554 (976)RDI 62,815 48,615 14,200
D I S T R I B U T I O N S TO U N I T H O L D E R S 55,454 42,724 12,730Distributions reinvested under DRIP (1,950) (1,347) (603)Cash distributions 53,504 41,377 12,127
Per unit information: ∆%DI (basic) 1.52 1.40 0.12 8.6DI (fully diluted) 1.49 1.35 0.14 10.4RDI (basic) 1.51 1.41 0.10 7.1RDI (fully diluted) 1.48 1.36 0.12 8.8
D I S T R I B U T I O N S P E R U N I T 1.301 1.230DI payout ratio 85.6% 87.9%RDI payout ratio 86.2% 86.9%
20 07 A N N U A L R E P ORT { 12
Fully diluted RDI per unit grew 7.1%, thanks mainly to the immediate impact ofacquisitions and developments completed since the beginning of 2006 and to thesignificant 3.0% increase in same property NOI. Per unit distributions rose from$1.230 in 2006 to $1.301 in 2007, whereas the payout to RDI payout ratio was86.2%, compared with 86.9% in 2006. This attests to Cominar’s ability to managethe growth of its distributions while maintaining a payout ratio that gives it the latitude needed to ensure the stability of future distributions.
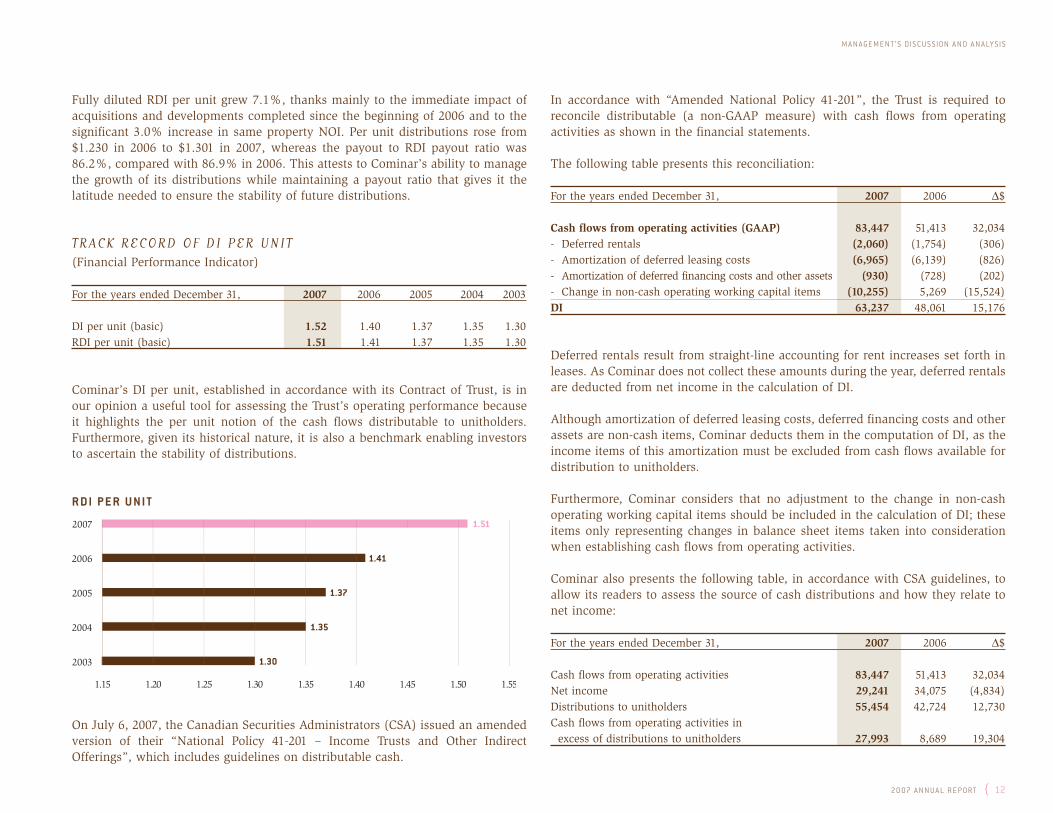
TRACK RECORD OF DI PER UNIT(Financial Performance Indicator)
For the years ended December 31, 2007 2006 2005 2004 2003
DI per unit (basic) 1.52 1.40 1.37 1.35 1.30RDI per unit (basic) 1.51 1.41 1.37 1.35 1.30
Cominar’s DI per unit, established in accordance with its Contract of Trust, is inour opinion a useful tool for assessing the Trust’s operating performance becauseit highlights the per unit notion of the cash flows distributable to unitholders.Furthermore, given its historical nature, it is also a benchmark enabling investorsto ascertain the stability of distributions.
R D I P E R U N I T
On July 6, 2007, the Canadian Securities Administrators (CSA) issued an amendedversion of their “National Policy 41-201 – Income Trusts and Other IndirectOfferings”, which includes guidelines on distributable cash.
In accordance with “Amended National Policy 41-201”, the Trust is required to reconcile distributable (a non-GAAP measure) with cash flows from operatingactivities as shown in the financial statements.
The following table presents this reconciliation:
For the years ended December 31, 2007 2006 ∆$
Cash flows from operating activities (GAAP) 83,447 51,413 32,034- Deferred rentals (2,060) (1,754) (306)- Amortization of deferred leasing costs (6,965) (6,139) (826)- Amortization of deferred financing costs and other assets (930) (728) (202)- Change in non-cash operating working capital items (10,255) 5,269 (15,524)DI 63,237 48,061 15,176
Deferred rentals result from straight-line accounting for rent increases set forth inleases. As Cominar does not collect these amounts during the year, deferred rentalsare deducted from net income in the calculation of DI.
Although amortization of deferred leasing costs, deferred financing costs and otherassets are non-cash items, Cominar deducts them in the computation of DI, as theincome items of this amortization must be excluded from cash flows available fordistribution to unitholders.
Furthermore, Cominar considers that no adjustment to the change in non-cashoperating working capital items should be included in the calculation of DI; theseitems only representing changes in balance sheet items taken into considerationwhen establishing cash flows from operating activities.
Cominar also presents the following table, in accordance with CSA guidelines, toallow its readers to assess the source of cash distributions and how they relate tonet income:
For the years ended December 31, 2007 2006 ∆$
Cash flows from operating activities 83,447 51,413 32,034Net income 29,241 34,075 (4,834)Distributions to unitholders 55,454 42,724 12,730Cash flows from operating activities in
excess of distributions to unitholders 27,993 8,689 19,304
M A N A GE M E N T ’ S DIS C U S S ION A N D A N A LY S IS
1.251.20
2003
2004
2005
2006
2007
1.45 1.501.40 1.551.351.301.15
1.35
1.37
1.41
1.51
1.30

13 } 20 07 A N N U A L R E P ORT
M A N A GE M E N T ’ S DIS C U S S ION A N D A N A LY SIS
For fiscal 2007, cash flows from operating activities totalled $83.4 million, whereasDI amounted to $63.2 million. Excluding non-recoverable capital expenditures of$0.7 million disbursed during the year, adjusted cash flows from operations stood at$82.7 million. Cominar’s operations therefore generated sufficient cash flows from itsoperating activities to finance distributions of $55.5 million ($53.5 million excludingdistributions reinvested under the Distribution Reinvestment Plan (“DRIP”)).
For comparative purposes, DI for fiscal 2006 amounted to $48.1 million, whereascash flows from operating activities stood at $51.4 million, excluding non-recoverablecapital expenditures of $1.2 million. Adjusted cash flows from operations amountedto $50.2 million. In 2006, Cominar’s operations therefore generated sufficient fundsto finance distributions of $42.7 million.
In the near term, the annual non-recoverable capital expenditures needed to main-tain Cominar’s properties in good condition are not expected to have a significantimpact on cash flows such that it would affect distributions.
As fiscal year net income is not used in the calculation of distributions payable tounitholders, Cominar considers that the comparison with this item is not indicativeof its capacity to pay sustained distributions. The difference between distributions,calculated on the basis of DI, and net income, is primarily attributable to non-cashitems, as shown above in the reconciliation between net income and DI.
Funds from Operat ionsAlthough the notion of “funds from operations” (“FFO”) is not a financial measuredefined under GAAP, it is widely used in the field of real estate investment trusts. TheReal Property Association of Canada (“REALpac”) defines this measure as net income(calculated in accordance with GAAP), excluding gains (or impairment provisions andlosses) from sales of income properties and extraordinary items, plus depreciation ofincome properties and amortization of deferred leasing costs. FFO should not be substituted for net income or cash flows from operating activities established in accor-dance with GAAP in measuring our performance. Our method of calculating FFO isin compliance with REALpac recommendations, but may differ from the methodsused by other trusts, and therefore cannot be used for comparison.
We consider FFO a meaningful additional measure of operating performance, sinceit excludes the assumption that the value of real estate assets diminishes predictablyover time and discounts certain items included in net income, established in accor-dance with GAAP, that are not necessarily indicative of our operating performance(for example, gains or losses from the sale of real estate assets).
The following table presents a reconciliation of net income, as determined in accordancewith GAAP, and FFO for the 12-month periods ended December 31, 2007 and 2006:
F U N D S F R O M O P E R AT I O N S
For the years ended December 31, 2007 2006 ∆$
Net income (GAAP) 29,241 34,075 (4,834)+ Depreciation of income properties 36,132 16,276 19,856+ Amortization of deferred leasing costs 6,965 6,139 826- Gain on sale of real estate assets — (835) 835
FFO 72,338 55,655 16,683+ Unusual item (422) 554 (976)Recurring FFO 71,916 56,209 15,707
Per unit information: ∆%FFO (basic) 1.74 1.62 0.12 7.4FFO (fully diluted) 1.68 1.54 0.14 9.1Recurring FFO (basic) 1.73 1.64 0.09 5.5Recurring FFO (fully diluted) 1.67 1.56 0.11 7.1
In 2007, FFO increased due to the acquisitions and developments completed during the year and strong organic growth. Recurring FFO per unit grew 5.5% forthe year; on a fully diluted basis, they increased by 7.1% over the previous year.
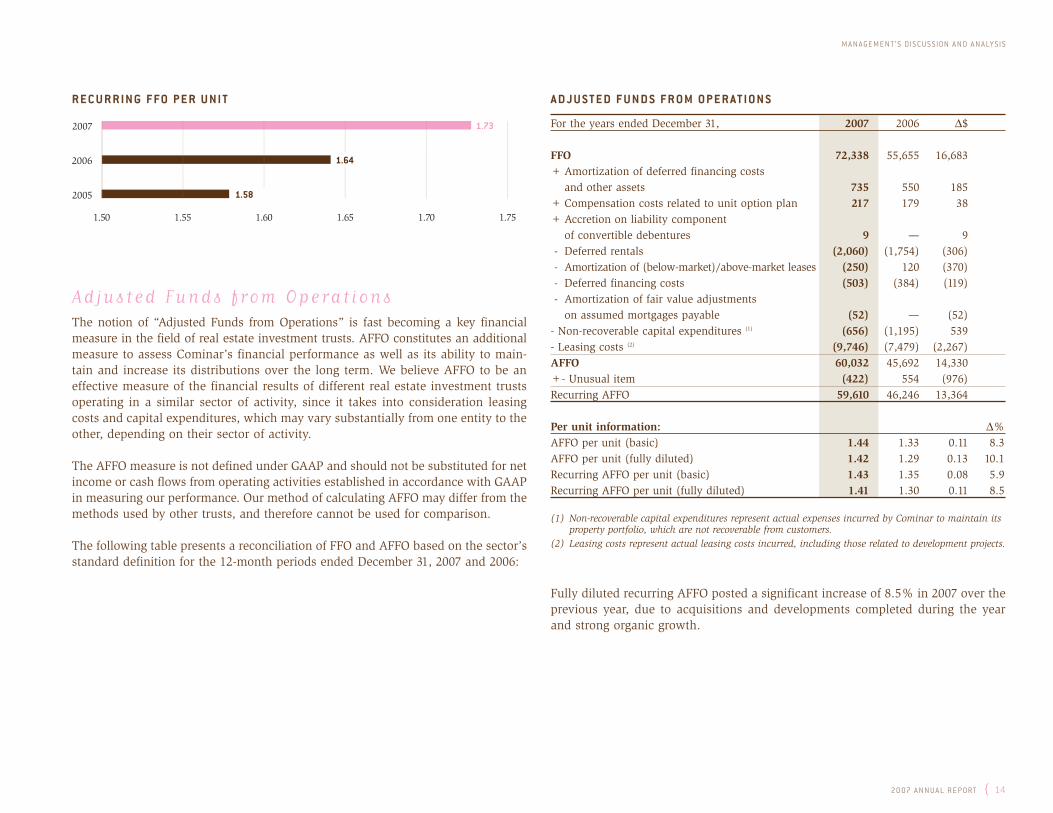
TRACK RECORD OF FUNDS FROM OPERATIONS PER UNIT(Financial Performance Indicator)
For the years ended December 31, 2007 2006 2005
FFO per unit (basic) 1.74 1.62 1.58Recurring FFO per unit (basic) 1.73 1.64 1.58
Cominar’s management considers FFO per unit a further useful tool for assessinga real estate company’s operating performance. Although this performance indi-cator is not a measure of the cash flows generated by the company, or its ability todeliver distributions, it is widely used in the financial community.
20 07 A N N U A L R E P ORT { 14
R E C U R R I N G F FO P E R U N I T
Adjusted Funds from Operat ionsThe notion of “Adjusted Funds from Operations” is fast becoming a key financialmeasure in the field of real estate investment trusts. AFFO constitutes an additionalmeasure to assess Cominar’s financial performance as well as its ability to main-tain and increase its distributions over the long term. We believe AFFO to be aneffective measure of the financial results of different real estate investment trustsoperating in a similar sector of activity, since it takes into consideration leasingcosts and capital expenditures, which may vary substantially from one entity to theother, depending on their sector of activity.
The AFFO measure is not defined under GAAP and should not be substituted for netincome or cash flows from operating activities established in accordance with GAAPin measuring our performance. Our method of calculating AFFO may differ from themethods used by other trusts, and therefore cannot be used for comparison.
The following table presents a reconciliation of FFO and AFFO based on the sector’sstandard definition for the 12-month periods ended December 31, 2007 and 2006:
A D J U S T E D F U N D S F R O M O P E R AT I O N S
For the years ended December 31, 2007 2006 ∆$
FFO 72,338 55,655 16,683+ Amortization of deferred financing costs
and other assets 735 550 185+ Compensation costs related to unit option plan 217 179 38+ Accretion on liability component
of convertible debentures 9 — 9- Deferred rentals (2,060) (1,754) (306)- Amortization of (below-market)/above-market leases (250) 120 (370)- Deferred financing costs (503) (384) (119)- Amortization of fair value adjustments
on assumed mortgages payable (52) — (52)- Non-recoverable capital expenditures (1) (656) (1,195) 539- Leasing costs (2) (9,746) (7,479) (2,267)AFFO 60,032 45,692 14,330+- Unusual item (422) 554 (976)Recurring AFFO 59,610 46,246 13,364
Per unit information: ∆%AFFO per unit (basic) 1.44 1.33 0.11 8.3AFFO per unit (fully diluted) 1.42 1.29 0.13 10.1Recurring AFFO per unit (basic) 1.43 1.35 0.08 5.9Recurring AFFO per unit (fully diluted) 1.41 1.30 0.11 8.5
(1) Non-recoverable capital expenditures represent actual expenses incurred by Cominar to maintain its property portfolio, which are not recoverable from customers.
(2) Leasing costs represent actual leasing costs incurred, including those related to development projects.
Fully diluted recurring AFFO posted a significant increase of 8.5% in 2007 over theprevious year, due to acquisitions and developments completed during the yearand strong organic growth.
M A N A GE M E N T ’ S DIS C U S S ION A N D A N A LY S IS
1.601.55
2005
2007
2006
1.751.701.651.50
1.64
1.73
1.58

15 } 20 07 A N N U A L R E P ORT
M A N A GE M E N T ’ S DIS C U S S ION A N D A N A LY SIS
TRACK RECORD OF ADJUSTED FUNDS FROM OPERATIONS PER UNIT(Financial Performance Indicator)
For the years ended December 31, 2007 2006 2005
AFFO per unit (basic) 1.44 1.33 1.26Recurring AFFO per unit (basic) 1.43 1.35 1.26
Management believes that AFFO, calculated using the previously describedmethod, represents a key measure of Cominar’s ability to generate cash flows byeliminating most non-cash items from net income, and accounting for expendituresmade during the period, such as non-recoverable capital expenditures and leasingcosts. During the three years presented in the historical table below, AFFO hasalways been higher than the distributions per unit made by Cominar. Managementdoes not expect this situation to reverse in coming fiscal years.
R E C U R R I N G A F FO P E R U N I T
L iquidity and Capital Resources
LONG-TERM DEBTThe following table presents Cominar’s debt balances as at December 31, 2007,including mortgages payable and convertible debentures, by year of maturity andweighted average interest rates:
LO N G -T E R M D E B T
Balance of Convertible Balance of Mortgages Weighted AverageYears of Maturity Debentures ($) Payable ($) Interest Rate (%)
2008 133,315 6.092009 54,750 5.582010 25,788 5.102011 6,110 7.992012 21,499 7.042013 8,115 7.312014 214,617 42,581 5.912015 14,215 5.132016 — —2017 132,296 5.382018 30,717 5.512019 17,692 6.672020 — —2021 98,284 5.552022 34,774 5.35Total 214,617 620,136 5.79
MORTGAGES PAYABLEAs at December 31, 2007, mortgages payable amounted to $620.1 million, comparedwith $270.6 million as at December 31, 2006. This $349.5 million increase in mort-gages payable is due mainly to recent acquisitions. At 2007 year-end, the weightedaverage interest rate was 5.79%, down from 6.24% as at December 31, 2006.
Cominar has staggered mortgage expiry dates over a number of years to reduce therisks related to renewal. As at December 31, 2007, the residual average term ofmortgages payable was 7.0 years.
In 2008, balances of $132.1 million in mortgages payable will mature, of which$81.3 million relate to Place de la Cité in Québec City, one of Cominar’s most prestigious properties.
1.251.20
2005
2007
2006
1.451.401.351.301.15
1.35
1.43
1.26

20 07 A N N U A L R E P ORT { 16
On March 13, 2008, Cominar repaid $50.8 million in balances outstanding using itsavailable credit facilities.
The following table presents the changes in mortgages payable in 2007:
M O R T G A G E S PAYA B L E
Weighted$ average rate
Balances of mortgages payable as at December 31, 2006 270.6 6.24%Mortgages payable contracted 168.4 5.37% Assumption of mortgages payable for acquisitions 248.5 6.02%Repayment of balances at maturity (53.1) —Monthly repayment of principal (14.3) —Balances of mortgages payable as at December 31, 2007 620.1 5.78%
The following table shows mortgage repayments for the coming years:
M O R T G A G E R E PAY M E N T S
Years ending Repayment Balance at % ofDecember 31, of principal maturity Total total
2008 14,348 132,098 146,446 23.62009 11,918 52,341 64,259 10.42010 12,055 24,070 36,125 5.82011 12,330 5,056 17,386 2.82012 12,209 16,380 28,589 4.62013 11,550 4,841 16,391 2.72014 11,259 32,209 43,468 7.02015 10,573 11,073 21,646 3.52016 10,817 — 10,817 1.82017 9,815 109,423 119,238 19.22018 8,848 — 8,848 1.42019 3,987 4,141 8,128 1.32020 3,987 — 3,987 0.72021 2,396 67,963 70,359 11.32022 262 24,187 24,449 3.9Total 136,354 483,782 620,136 100.0
CONVERTIBLE DEBENTURESCominar considers convertible debentures a highly flexible means of financingbecause they leave properties free of liens.
Due to the significant increase in Cominar’s unit price since the issue in September2004 of Series A unsecured subordinated convertible debentures bearing interest at6.3% per annum, a large number of convertible debentures have been convertedinto units. Of the original $100.0 million issue, only $24.1 million remained outstanding as at December 31, 2007. Each debenture is convertible into units ofthe REIT at a conversion price of $17.40 per unit.
On May 8, 2007, Cominar issued $80.5 million in Series B unsecured subordinatedconvertible debentures bearing interest at a rate of 5.70% per annum and maturingin June 2014. Each debenture is convertible into units of the REIT at a conversionprice of $27.50 per unit.
On October 10, 2007, Cominar issued $110.0 million in Series C unsecured subor-dinated convertible debentures bearing interest at a rate of 5.80% per annum andmaturing in September 2014. Each debenture is convertible into units of the REITat a conversion price of $25.25 per unit.
BANK INDEBTEDNESSIn 2007, Cominar obtained additional acquisition credit facilities of $62 million fromCanadian chartered banks. As at December 31, 2007, Cominar had operating andacquisition credit facilities of $180 million, renewable annually, at interest rates of0.00% to 0.50% above prime. These credit facilities were secured by movable andimmovable hypothecs on specific assets. They are provided by three different finan-cial institutions, and management has reason to believe that they will remain available in the future. As at December 31, 2007, bank indebtedness totalled $35.3 million. Thus, Cominar had available credit facilities of $144.7 million.
M A N A GE M E N T ’ S DIS C U S S ION A N D A N A LY S IS

17 } 20 07 A N N U A L R E P ORT
M A N A GE M E N T ’ S DIS C U S S ION A N D A N A LY SIS
DEBT RATIOThe following table presents debt ratios as at December 31, 2007 and December 31, 2006:
D E B T TO G R O S S B O O K VA L U E R AT I O
As at December 31, 2007 2006
Mortgages payable 619,755 270,142Convertible debentures 203,852 39,984Bank indebtedness 35,321 73,616Total long-term debt 858,928 383,742Portfolio gross book value 1,535,478 845,960Overall debt ratio (1) (2) 55.9% 45.4%Debt ratio (excluding convertible debentures) 42.7% 40.5%Borrowing power - 65% of gross book value 397,000 —Borrowing power - 60% (maximum allowed prior to 2007) 156,000 305,000
(1) The overall debt to gross book value ratio is equal to total bank indebtedness, mortgages payable and convertible debentures divided by the gross book value of the property portfolio (total value of assets plus accumulated depreciation).
(2) This ratio is not defined by GAAP and may differ from similar measures presented by other entities.
DEBT RATIO TRACK RECORD(Financial Performance Indicator)
For the years ended December 31, 2007 2006 2005 2004 2003
Overall debt ratio 55.9 45.4 49.0 49.3 43.7Debt ratio (excluding convertible debentures) 42.7 40.5 36.3 35.7 43.7Maximum borrowing power
allowed by the Contract of Trust ($M) 397 305 211 195 253
As at December 31, 2007, Cominar maintained a debt ratio of 55.9%, which is lessthan the maximum debt ratio of 65.0% allowed by its Contract of Trust if conver-tible debentures are outstanding. Management believes that this disciplined andconservative practice contributes to ensure the stability of future distributions andthe prudent growth of the Trust.
D E B T R AT I O (%)
The following table presents the interest coverage ratio as at December 31, 2007and December 31, 2006:
I N T E R E S T C O V E R A G E R AT I O
As at December 31, 2007 2006
Net income 29,241 34,075- Net income from discontinued operations (8) (1,508)
+ Unusual items (422) 554- Other revenues (394) (489)
+ Interest on borrowings 35,711 20,712+ Depreciation of income properties 35,514 15,261+ Amortization of deferred leasing costs 6,965 6,139+ Amortization of other assets 196 177EBITDA (1) 106,803 74,921Interest expense 36,951 22,572
Interest coverage ratio ((2 (3)) 2.89 3.32
(1) EBITDA is earnings before interest, income taxes, depreciation and amortization.(2) The interest coverage ratio is equal to EBITDA (measure not defined by GAAP) divided by interest
expense.(3) This ratio is not defined by GAAP and may differ from similar measures presented by other entities.
4020
2003
2004
2005
2006
2007
10080600 10 30 50 70 90
49.3
49.0
45.4
55.9
43.7
20 07 A N N U A L R E P ORT { 18
The interest coverage ratio is used to assess Cominar’s ability to pay interest on itsdebt using its operating revenues. As at December 31, 2007, the interest coverageratio was 2.89:1, compared with 3.32:1 as at December 31, 2006, down slightly dueto the financing of the recent acquisitions, but considered quite adequate by management.
UNITSAs was the case during the acquisition of the Alexis Nihon properties, as necessary,Cominar uses public offerings as a supplementary means of financing. The “Issuedand Outstanding Units” section on page 43 of this MD&A provides further informa-tion in this regard.
CONTRACTUAL OBLIGATIONSCominar’s most significant contractual obligations relate to its debt, includingmortgages payable, convertible debentures and bank indebtedness, as well as pay-ments required under emphyteutic leases on land for income properties, asdescribed in further detail in note 23, “Commitments” to the financial statements.
Property Portfo l io
The following table presents information about our property portfolio:
As at December 31, 2007 2006
Income properties (at cost) 1,415,779 770,946Properties under development and land held
for future development 61,280 24,232Other assets 58,419 50,782Portfolio gross book value 1,535,478 845,960
Number of properties 208 139Leasable area (in thousands of sq. ft.) 17,022 10,190
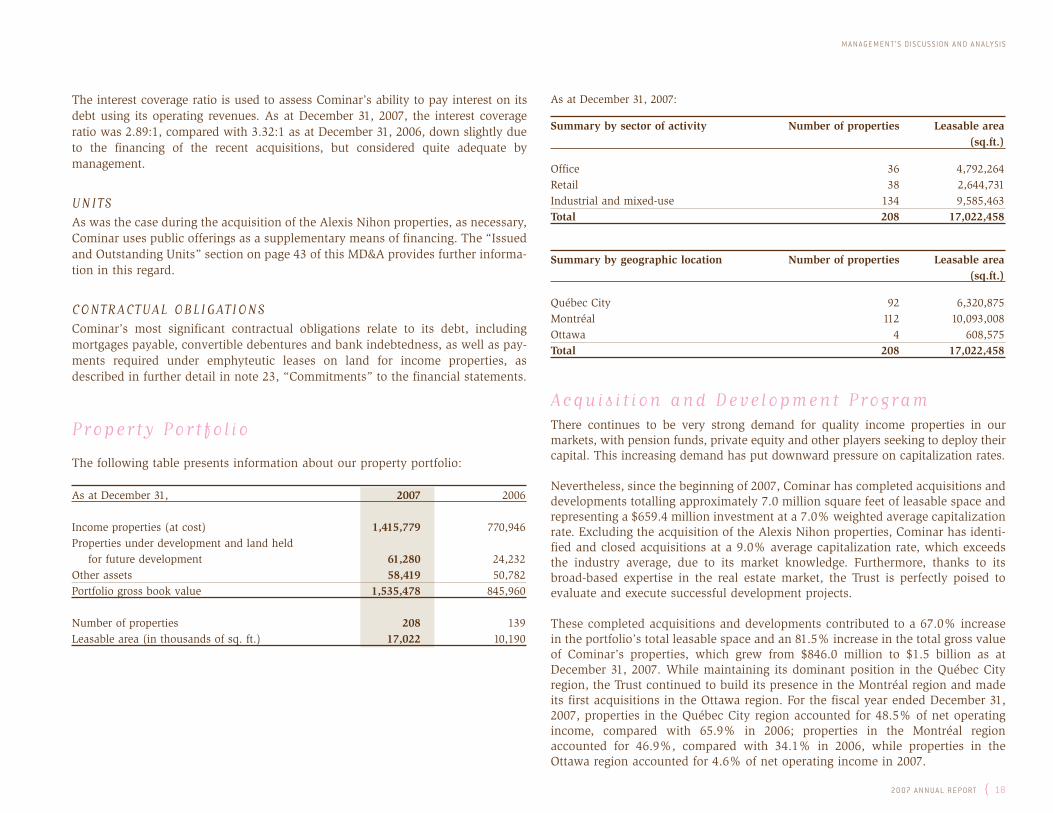
As at December 31, 2007:
Summary by sector of activity Number of properties Leasable area(sq.ft.)
Office 36 4,792,264Retail 38 2,644,731Industrial and mixed-use 134 9,585,463Total 208 17,022,458
Summary by geographic location Number of properties Leasable area(sq.ft.)
Québec City 92 6,320,875Montréal 112 10,093,008Ottawa 4 608,575Total 208 17,022,458
Acquis i t ion and Development ProgramThere continues to be very strong demand for quality income properties in our markets, with pension funds, private equity and other players seeking to deploy theircapital. This increasing demand has put downward pressure on capitalization rates.
Nevertheless, since the beginning of 2007, Cominar has completed acquisitions anddevelopments totalling approximately 7.0 million square feet of leasable space andrepresenting a $659.4 million investment at a 7.0% weighted average capitalizationrate. Excluding the acquisition of the Alexis Nihon properties, Cominar has identi-fied and closed acquisitions at a 9.0% average capitalization rate, which exceedsthe industry average, due to its market knowledge. Furthermore, thanks to itsbroad-based expertise in the real estate market, the Trust is perfectly poised to evaluate and execute successful development projects.
These completed acquisitions and developments contributed to a 67.0% increasein the portfolio’s total leasable space and an 81.5% increase in the total gross valueof Cominar’s properties, which grew from $846.0 million to $1.5 billion as atDecember 31, 2007. While maintaining its dominant position in the Québec Cityregion, the Trust continued to build its presence in the Montréal region and madeits first acquisitions in the Ottawa region. For the fiscal year ended December 31,2007, properties in the Québec City region accounted for 48.5% of net operatingincome, compared with 65.9% in 2006; properties in the Montréal region accounted for 46.9%, compared with 34.1% in 2006, while properties in theOttawa region accounted for 4.6% of net operating income in 2007.
M A N A GE M E N T ’ S DIS C U S S ION A N D A N A LY S IS

19 } 20 07 A N N U A L R E P ORT
M A N A GE M E N T ’ S DIS C U S S ION A N D A N A LY SIS
ACQUISIT IONSDetailed information about property acquisitions in 2007 is presented in the following table:
Sector of Closing Leasable area Purchase price CapitalizationIncome property City activity (1) date (sq.ft.) ($) rate (%)
19100 Trans-Canada Highway Baie d’Urfé I 01/07 25,564 2,100 9.4115 de Vaudreuil St. Longueuil I 03/07(2) 16,297 6,100 9.03600 Matte Blvd. Brossard I 03/07(2) 27,074 — —3650 Matte Blvd. Brossard I 03/07(2) 43,211 — —120 de l’Hôpital Blvd. Gatineau R 03/07 67,140 9,750 9.1565-585 Charest Blvd. East Québec City O 03/07 104,375 11,030 9.3795 Craig St. Saint-Nicolas I 05/07 23,041 1,000 9.8375 Sir-Wilfrid-Laurier Blvd. St-Hilaire O 06/07(3) 49,855 26,400 8.8 325 H Charbonneau Blvd. St-Hilaire O 06/07(3) 19,259 — —370 Sir-Wilfrid-Laurier Blvd. St-Hilaire R 06/07(3) 46,074 — —353 Sir-Wilfrid-Laurier Blvd. St-Hilaire R 06/07(3) 71,174 — —345 H Charbonneau Blvd. St-Hilaire R 06/07(3) 24,175 — —383 Sir-Wilfrid-Laurier Blvd. St-Hilaire R 06/07(3) 9,318 — —Alexis Nihon REIT (described on page 25) 06/07 6,290,208 592,000 6.8Total/weighted average capitalization rate:- Excluding Alexis Nihon REIT 526,557 56,380 9.0- Including Alexis Nihon REIT 6,816,765 648,380 7.0
(1) I = Industrial and mixed-use, R = Retail, O = Office(2) These three properties were acquired pursuant to a single transaction for $6.1 million.(3) These six properties were acquired pursuant to a single transaction for $26.4 million.

20 07 A N N U A L R E P ORT { 20
DEVELOPMENT PROGRAM
Completed DevelopmentsIn 2007, the Trust converted four properties under development into income pro-perties at a 9.9% rate of return. These properties represent a total additional
leasable area of 218,308 square feet and a $11.0 million investment. The followingtable details the developments completed:
M A N A GE M E N T ’ S DIS C U S S ION A N D A N A LY S IS
Sector of Completion Leasable area Investment Capitalization LeasingDevelopment City activity (1) date (sq.ft.) ($) rate (%) status (%)
2900 J.-A. Bombardier Laval I Q1-2007 104,308 6,200 10.1 91.4275 St-Sacrement Québec City I Q4-2007 61,853 2,200 9.6 55.91255 des Artisans Québec City I Q4-2007 42,427 2,100 9.5 80.1579 Godin Québec City I Q4-2007 9,720 500 9.4 100.0Total/weighted average capitalization rate 218,308 11,000 9.9
(1) I = Industrial and mixed-use
Ongoing DevelopmentsAs at December 31, 2007, Cominar’s ongoing development pipeline included threeproperties totaling $0.2 million square feet and a $17.9 million total investment, asdetailed in the following table:
Sector of Scheduled Leasable area Investment Capitalization LeasingDevelopment City Activity (1) completion (sq.ft.) ($) rate (%) status (%)
3025 J.-A. Bombardier Laval I Q1-2008 78,757 5,300 9.9 38.8St-Bruno Power Centre (Phase 1 & 2) St-Bruno R Q2-2008 110,240 12,600 9.8 20.0Total/weighted average capitalization rate 188,997 17,900 9.8
(1) I = Industrial and mixed-use, R = Retail
Upcoming DevelopmentsConsistent with its growth strategy, Cominar is pursuing its property developmentactivities, which allows it to obtain higher returns than acquisitions in the currentreal estate market in Quebec.
The economy in the Québec City region is one of the strongest in Canada. Theunemployment rate is one of the lowest nationwide, GDP growth is sustained, the
job creation rate is high, business start-up and operating costs are low and thequality of life is excellent. Combined, these factors generate strong economicgrowth in the region and lead to a shortage of office rental space.
In January 2008, Cominar undertook a large-scale project on Laurier Boulevard inQuébec City. One of the largest thoroughfares in Quebec City, located at the exit ofthe bridges connecting the two shores of the St. Laurence River, Laurier Boulevard

U P C O M I N G D E V E LO P M E N T S(as at December 31, 2007)
Sector of Scheduled Leasable area Investment CapitalizationDevelopment City activity (1) completion (sq.ft.) ($) rate (%)
Laurier Blvd. – Phase 1 Quebec City O, R 2009 396,000 74,000 9.3Laurier Blvd. – Phase 2 Quebec City O, R 2010 324,000 36,000 9.3Promenades Beauport Quebec City 7,900
- renovation R 2008 65,000 9.3- expansion project O 2008 50,000
4th Avenue – Phase 1 Lévis I 2008 50,000 2,900 9.6Chemin du Tremblay Boucherville I 2008 28,600 5,500 9.8Total/weighted average capitalization rate 913,600 126,300 9.3
(1) I = Industrial and mixed-use, O=Office, R = Retail
21 } 20 07 A N N U A L R E P ORT
M A N A GE M E N T ’ S DIS C U S S ION A N D A N A LY SIS
is one of the gateways into the city, with its many hotels, office buildings and shopping centres. This future property, which will enjoy an enviable geographiclocation, will have a leasable area of more than 720,000 square feet, of whichapproximately 100,000 square feet will be used for retail purposes, leaving over620,000 square feet of office space. The construction cost is estimated at $110 mil-lion and the capitalization rate is estimated at 9.3%.
This project will be completed in two phases. The first will extend over a period ofabout 18 months, will represent 396,000 square feet and a cost of approximately$74 million.
In the second quarter of 2008, Cominar also plans to begin the final phase of revi-talizing Les Promenades Beauport shopping centre, located on du Carrefour Boulevard in Québec City. This project consists of the renovation of a leasable areaof 65,000 square feet and a 50,000 square-foot expansion, which will bring thisshopping centre’s total area to approximately 551,000 square feet. The expansionwill be used primarily for office space. The total cost of the project is estimated at$7.9 million, at a 9.3% capitalization rate.
In addition, a two-storey industrial and mixed-use property covering a leasable areaof 50,000 square feet will be built on 4th Avenue in Lévis, at a cost of $2.9 million and a 9.6% capitalization rate. This construction, which will begin inthe first quarter of fiscal 2008, represents the first phase of a project involving threeindustrial properties totaling over 170,000 square feet.
In February 2008, Cominar initiated construction of a 28,600 square-foot industrialand mixed-use property, located in Boucherville in the Montréal region, and repre-senting a $5.5 million investment. Its capitalization rate is estimated at 9.8%. Thisproperty will be fully occupied by a single tenant beginning in the third quarter offiscal 2008.
Combined, these projects represent an investment of more than $126 million overthe next two years. The average capitalization rate is 9.3%, much higher thanreturns obtained following acquisitions.
With these development projects, Cominar intends to take advantage of the strongQuébec economy, especially in the Québec City region where current demand farexceeds supply.

20 07 A N N U A L R E P ORT { 22
M A N A GE M E N T ’ S DIS C U S S ION A N D A N A LY S IS
Real Estate Operat ionsThe following table presents our operational performance indicators as at December 31,2007 and 2006:
As at December 31, 2007 2006
Occupancy rate 94.7% 94.4% Tenant retention rate 82.1% 85.6%
OCCUPANCY RATECominar consistently strives to maximize occupancy rates throughout its portfolioand has successfully maintained 95.0% average occupancy since its inception. Asat December 31, 2007, occupancy stood at 94.7%, compared with 94.4% as atDecember 31, 2006, an increase of 0.3%.
OCCUPANCY TRACK RECORD(Operational Performance Indicator)
The following table presents occupancy rates by sector of activity over the past five years:
As at December 31, 2007 2006 2005 2004 2003
Sector of activity (%)Office 94.7 96.0 95.0 94.7 92.8Retail 96.0 94.3 93.6 94.0 95.7Industrial and mixed-use 94.4 93.7 96.2 95.2 97.3Total portfolio 94.7 94.4 95.3 94.8 96.0
Occupancy is regarded by Cominar’s management as a key indicator of customersatisfaction. Customer satisfaction is defined as customer perception and judgmentof our ability to meet their needs and expectations. Our average occupancy rate hasfluctuated very little over the past five years, remaining at about 95%, attesting tothe fact that our efforts have borne fruit.
Office. In 2007, the occupancy rate in this sector was down by 1.3% from the recordhigh posted in 2006. We nevertheless consider the 2007 year-end rate satisfactory,since it stood at approximately 93.3% when the Alexis Nihon properties wereacquired.
O C C U PA N C Y R AT E - O F F I C E (%)
Retail. The occupancy rate in the retail sector grew 1.7% in 2007 to 96.0%: a recordhigh since the inception of the Trust.
O C C U PA N C Y R AT E - R E TA I L (%)
7060
2003
2004
2005
2006
2007
100908050
94.7
95.0
96.0
94.7
92.8
7060
2003
2004
2005
2006
2007
100908050
94.0
93.6
94.3
96.0
95.7

23 } 20 07 A N N U A L R E P ORT
M A N A GE M E N T ’ S DIS C U S S ION A N D A N A LY SIS
Industrial and Mixed-Use. As at December 31, the occupancy rate in the indus-trial and mixed-use sector was up by 0.7% over the same date in 2006, and by 1.2%over the occupancy rate as at June 30, 2007, just after we took possession the AlexisNihon properties. Cominar’s management attributes these results to the efforts of itsleasing team, favourable market conditions and our operational strategy.
O C C U PA N C Y R AT E - I N D U S T R I A L & M I X E D - U S E (%)
LEASING ACTIVITYThe following table contains a summary of Cominar’s leasing activity in 2007:
L E A S E E X P I R I E S A N D R E N E WA L S B Y S E C TO R
Industrial Office Retail and mixed-use Total
Expiring leases/2007Number of customers 158 126 189 473Leasable area (sq.ft.) 558,364 284,456 1,476,439 2,319,259Average net rent/sq.ft. ($) 9.42 9.77 5.29 6.83
Renewed leasesNumber of customers 107 85 126 318Leasable area (sq.ft.) 400,359 270,699 1,233,019 1,904,077Average net rent/sq.ft. ($) 9.75 10.67 5.66 7.23% renewal 71.7% 95.2% 83.5% 82.1%
New leasesNumber of customers 46 45 71 162Leasable area (sq.ft.) 192,112 87,626 507,950 787,688Average net rent/sq.ft. ($) 10.75 9.97 5.52 7.29
As indicated in the above table, leasing activity remained strong across our portfolio in 2007, especially in the retail sector where 95.2% of expiring leases wererenewed. Our leasing team stepped up its efforts to renew an aggregate 82.1% ofleases expiring in 2007, thereby achieving a highly satisfactory performance. Wealso signed new leases representing 0.8 million square feet of leasable area. Ourrenewal rates are up in all three sectors of activity, with increases of 2.7%, 9.7%and 4.8% respectively for the office, retail and industrial sectors.
RETENTION TRACK RECORD(Operational Performance Indicator)
The following table presents our retention rates over the past five years:
For the years ended December 31, 2007 2006 2005 2004 2003
Retention rate (%) 82.1 85.6 75.4 76.3 76.5
Cominar considers retention rate a second indicator of customer satisfaction withthe services received. We are very proud of the fact that our retention rate hasremained above 75.0% in each of the past eight years.
R E T E N T I O N R AT E (%)
7060 65 75 85 95
2003
2004
2005
2006
2007
100908050 55
95.2
96.2
93.7
94.4
97.3
40302010
2003
2004
2005
2006
2007
10080 907060500
76.3
75.4
85.6
82.1
76.5

20 07 A N N U A L R E P ORT { 24
The following table details our lease maturity profile for the next five years:
L E A S E M AT U R I T Y
2008 2009 2010 2011 2012
OfficeLeasable area (sq.ft.) 660,214 429,987 537,744 320,337 734,581Lease rate/square foot ($) 9.86 11.20 9.37 10.06 10.58% of office portfolio 13.8 9.0 11.2 6.7 15.3
RetailLeasable area (sq.ft.) 351,598 237,639 240,960 322,066 362,708Lease rate/square foot ($) 8.21 11.66 11.70 10.38 11.11% of retail portfolio 13.3 9.0 9.1 12.2 13.7
Industrial and mixed-useLeasable area (sq.ft.) 1,602,096 1,204,845 1,396,690 1,005,133 1,134,745Lease rate/square foot ($) 5.59 5.47 5.45 5.93 6.54% of industrial and mixed-use portfolio 16.7 12.6 14.6 10.5 11.8
Portfolio totalLeasable area (sq.ft.) 2,613,908 1,872,471 2,175,394 1,647,536 2,232,034Lease rate/square foot ($) 7.02 7.57 7.11 7.61 8.61% of portfolio 15.4 11.0 12.8 9.7 13.1
15.4% of our leases are up for renewal in 2008, representing 2.6 million square feetof leasable area. As of March 13, 2008, we have successfully renewed, at higher rents,22.7% of the leases expiring in 2008, covering 0.6 million square feet of leasable area.Based on our solid renewal track record and the demand for rental properties in ourtwo main geographic markets, we remain confident that we will be able to renew asignificant proportion of expiring leases at higher rents per square foot.
The following table summarizes average lease term information as at December 31, 2007:
Average remaining Average customer Average in-placelease term (years) size (sq.ft.) net rent / sq.ft. ($)
Office 4.8 5,300 10.56Retail 5.3 3,400 10.47Industrial and mixed-use 3.8 11,200 5.59Portfolio average 4.3 7,000 7.81
We have approximately 2,300 customers, occupying on average 7,000 square feetof space. Our broad customer base is highly diversified. Our three largest customers, Société immobilière du Québec, a Québec government corporation,Ericsson Canada and Public Works Canada, account respectively for approxima-tely 5.66%, 2.95% and 6.81% of our revenues. The stability and quality of our cashflows from operating activities are enhanced by the fact that approximately 14.3%stems from government agencies.
The table below presents the percentage contribution to revenue of our ten largestcustomers:
Customer % of revenues Leased space (sq.ft.)
Public Works Canada 6.81 722,284Société immobilière du Québec 5.66 982,639Ericsson Canada Inc. 2.95 175,060LDC Logistics Development Corp. 1.74 527,000Hudsons Bay Company 1.45 349,312National Bank of Canada 1.23 145,094City of Montréal 1.13 116,226Metro Richelieu Inc. 1.02 287,970Wal-Mart Canada Inc. 0.88 129,638Alcan Packaging Canada Ltd. 0.85 162,000Total 23.72 3,597,223
Issued and Outstanding Unit DataOwnership interests in Cominar are represented by a single class of units, unlimitedin number. Units represent a unitholder’s proportionate and undivided ownershipinterest in Cominar. Each unit confers the right to one vote at any unitholders’ meeting and to participate equally and ratably in any Cominar distributions.
ISSUED UNITSOn June 5, 2007, Cominar issued 7,113,000 units for aggregate net proceeds of$164.1 million on the exchange of subscription receipts issued pursuant to theprospectus dated April 27, 2007. This exchange was conditional on the acquisitionof the Alexis Nihon portfolio’s office and industrial and mixed-use properties.
M A N A GE M E N T ’ S DIS C U S S ION A N D A N A LY S IS
25 } 20 07 A N N U A L R E P ORT
M A N A GE M E N T ’ S DIS C U S S ION A N D A N A LY SIS
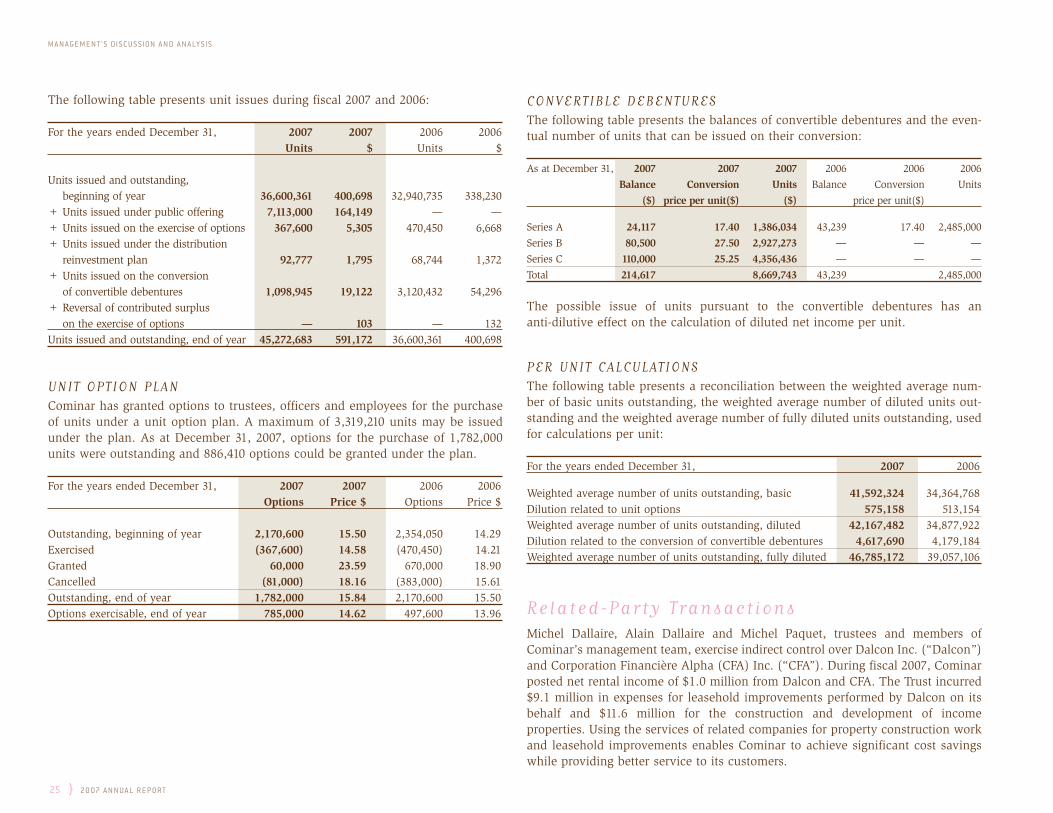
The following table presents unit issues during fiscal 2007 and 2006:
For the years ended December 31, 2007 2007 2006 2006Units $ Units $
Units issued and outstanding, beginning of year 36,600,361 400,698 32,940,735 338,230
+ Units issued under public offering 7,113,000 164,149 — —+ Units issued on the exercise of options 367,600 5,305 470,450 6,668+ Units issued under the distribution
reinvestment plan 92,777 1,795 68,744 1,372+ Units issued on the conversion
of convertible debentures 1,098,945 19,122 3,120,432 54,296+ Reversal of contributed surplus
on the exercise of options — 103 — 132Units issued and outstanding, end of year 45,272,683 591,172 36,600,361 400,698
UNIT OPTION PLANCominar has granted options to trustees, officers and employees for the purchaseof units under a unit option plan. A maximum of 3,319,210 units may be issuedunder the plan. As at December 31, 2007, options for the purchase of 1,782,000units were outstanding and 886,410 options could be granted under the plan.
For the years ended December 31, 2007 2007 2006 2006Options Price $ Options Price $
Outstanding, beginning of year 2,170,600 15.50 2,354,050 14.29Exercised (367,600) 14.58 (470,450) 14.21Granted 60,000 23.59 670,000 18.90Cancelled (81,000) 18.16 (383,000) 15.61Outstanding, end of year 1,782,000 15.84 2,170,600 15.50Options exercisable, end of year 785,000 14.62 497,600 13.96
CONVERTIBLE DEBENTURESThe following table presents the balances of convertible debentures and the even-tual number of units that can be issued on their conversion:
As at December 31, 2007 2007 2007 2006 2006 2006
Balance Conversion Units Balance Conversion Units
($) price per unit($) ($) price per unit($)
Series A 24,117 17.40 1,386,034 43,239 17.40 2,485,000
Series B 80,500 27.50 2,927,273 — — —Series C 110,000 25.25 4,356,436 — — —Total 214,617 8,669,743 43,239 2,485,000
The possible issue of units pursuant to the convertible debentures has an anti-dilutive effect on the calculation of diluted net income per unit.
PER UNIT CALCULATIONSThe following table presents a reconciliation between the weighted average num-ber of basic units outstanding, the weighted average number of diluted units out-standing and the weighted average number of fully diluted units outstanding, usedfor calculations per unit:
For the years ended December 31, 2007 2006
Weighted average number of units outstanding, basic 41,592,324 34,364,768 Dilution related to unit options 575,158 513,154Weighted average number of units outstanding, diluted 42,167,482 34,877,922Dilution related to the conversion of convertible debentures 4,617,690 4,179,184Weighted average number of units outstanding, fully diluted 46,785,172 39,057,106
Related-Party Transact ionsMichel Dallaire, Alain Dallaire and Michel Paquet, trustees and members ofCominar’s management team, exercise indirect control over Dalcon Inc. (“Dalcon”)and Corporation Financière Alpha (CFA) Inc. (“CFA”). During fiscal 2007, Cominarposted net rental income of $1.0 million from Dalcon and CFA. The Trust incurred$9.1 million in expenses for leasehold improvements performed by Dalcon on itsbehalf and $11.6 million for the construction and development of income properties. Using the services of related companies for property construction workand leasehold improvements enables Cominar to achieve significant cost savingswhile providing better service to its customers.

20 07 A N N U A L R E P ORT { 26
Selected Quarter ly InformationThe following table presents, in summary form, Cominar’s quarterly financialinformation for fiscal 2007 and 2006:
M A N A GE M E N T ’ S DIS C U S S ION A N D A N A LY S IS
For the quarters ended Dec. 31, Sept. 30, June 30, March 31, Dec. 31, Sept. 30, June 30, March 31,2007 2007 2007 2007 2006 2006 2006 2006
Operating revenues (1) 53,300 53,077 41,476 34,271 32,258 31 042 31,946 31,504Operating expenses (1) 20,918 19,590 16,726 15,119 11,887 11,338 12,626 13,848Net operating income (1) 32,382 33,487 24,750 19,152 20,371 19,704 19,320 17,656Net income 6,359 6,868 8,690 7,324 10,447 9,100 8,364 6,164Net income per unit (basic) 0.14 0.15 0.22 0.20 0.30 0.26 0.25 0.19Net income per unit (diluted) 0.14 0.15 0.22 0.20 0.30 0.26 0.25 0.18
DI 17,886 18,307 15,436 11,608 13,394 12,919 12,030 9,718DI per unit (fully diluted) 0.39 0.40 0.38 0.31 0.36 0.36 0.34 0.29
Funds from operations 20,248 20,830 17,644 13,616 15,338 14,778 13,923 11,616Funds from operations per unit (fully diluted) 0.43 0.45 0.43 0.36 0.41 0.41 0.39 0.34
Distributions 16,230 14,640 13,206 11,378 11,655 10,744 10,305 10,020Distributions per unit 0.358 0.325 0.312 0.306 0.316 0.306 0.306 0.302
(1) Certain amounts for fiscal 2006 and 2007 have been reclassified as “discontinued operations” in conformity with GAAP.
Over the past two years, Cominar has steadily improved its operating revenues, distributable income and funds from operations through new acquisitions and newdevelopments, higher average rents and relatively stable occupancy rates. Historical
trends show that first-quarter performance tends to be weaker due to increasedenergy consumption and snow removal over the winter months.

27 } 20 07 A N N U A L R E P ORT
M A N A GE M E N T ’ S DIS C U S S ION A N D A N A LY SIS
Fourth Quarter 2007 ResultsThe following table compares results for the fourth quarter of 2007 with those forthe corresponding period of 2006:
For the quarters ended December 31, 2007 2006 ∆$
Operating revenues (1) 53,300 32,258 21,042Operating expenses (1) 20,918 11,887 9,031Net operating income (1) 32,382 20,371 12,011Interest on borrowings 11,418 5,074 6,344Depreciation of income properties 12,104 3,934 8,170Amortization of deferred leasing costs 1,785 1,538 247Amortization of deferred financing costs
and other assets 35 49 (14)Trust administrative expenses 767 502 265Other revenues 86 288 (202)Net income from continuing operations 6,359 9,562 (3,203)Net income from discontinued operations — 885 (885)Net income 6,359 10,447 (4,088)
Per unit information: ∆%Net income per unit (basic) 0.14 0.29 (0.15) (51.7)Net income per unit (diluted) 0.14 0.28 (0.14) (50.0)
(1) Certain amounts for fiscal 2006 and 2007 have been reclassified as “discontinued operations” in conformity with GAAP.
For the fourth quarter ended December 31, 2007, operating revenues grew 65.2%,thereby contributing significantly to the 59.0% increase in fourth-quarter NOI. Asa result of the greater depreciation expense attributable to new acquisitions anddevelopments completed, as described in further detail under “Depreciation ofIncome Properties” on page 28 of this Annual Report, net income posted a $4.1 million decline for the fourth quarter.
DISTRIBUTABLE INCOMEDistributable income for the fourth quarter was as follows:
For the quarters ended December 31, 2007 2006 ∆$
Net income (GAAP) 6,359 10,447 (4,088)+ Depreciation of income properties 12,104 4,188 7,916+ Amortization of (below-market)/
above-market leases (72) 30 (102)+ Compensation costs related to unit option plan 48 34 14+ Accretion on liability component
of convertible debentures 9 — 9- Deferred leasing costs (510) (470) (40)- Gain on sale of real estate assets — (835) 835- Amortization of fair value adjustments
on assumed mortgages payable (52) — (52)DI 17,886 13,394 4,492
DISTRIBUTIONS TO UNITHOLDERS 16,230 11,655 4,575
Per unit information: ∆%DI per unit (basic) 0.40 0.37 0.03 8.1DI per unit (fully diluted) 0.39 0.36 0.03 8.3Weighted average number of units outstanding (basic) 45,198 36,339Weighted average number of units outstanding
(fully diluted) 53,853 39,559
DISTRIBUTIONS PER UNIT 0.358 0.316 0.042

20 07 A N N U A L R E P ORT { 28
The following table presents a reconciliation between funds from operations anddistributable income for the quarters ended December 31, 2007 and 2006:
For the quarters ended December 31, 2007 2006 ∆$
Cash flows from operating activities (GAAP) 25,025 18,304 6,721- Deferred leasing costs (510) (470) (40)- Amortization of deferred leasing costs (1,785) (1,538) (247)- Amortization of deferred financing costs and other assets (329) (193) (136)- Change in non-cash operating working capital items (4,515) (2,709) (1,806)DI 17,886 13,394 4,492
FUNDS FROM OPERATIONSFunds from operations for the fourth quarter were as follows:
For the quarters ended December 31, 2007 2006 ∆$
Net income (GAAP) 6,359 10,447 (4,088)+ Depreciation of income properties 12,104 4,188 7,916+ Amortization of deferred leasing costs 1,785 1,538 247- Gain on sale of real estate assets — (835) 835
FFO 20,248 15,338 4,910
Per unit information: ∆%FFO per unit (basic) 0.45 0.42 0.03 7.1FFO per unit (diluted) 0.43 0.41 0.02 4.9
As indicated in the above table, funds from operations for the fourth quarter of2007 increased by $4.9 million over the fourth quarter of 2006 as a result of acqui-sitions and developments completed during fiscal 2007.
ADJUSTED FUNDS FROM OPERATIONSThe following table presents a reconciliation of funds from operations and adjusted funds from operations based on the sector’s standard definition for thequarters ended December 31, 2007 and 2006:
A D J U S T E D F U N D S F R O M O P E R AT I O N S
For the quarters ended December 31, 2007 2006 ∆$
FFO 20,248 15,338 4,910+ Amortization of deferred financing costs and other assets 295 356 (61)+ Compensation expense related to unit options 48 34 14+ Accretion of liability component of convertible debentures 9 — 9- Deferred leasing costs (510) (469) (41)- Amortization of (below-market)/above-market leases (72) 30 (102)- Deferred financing costs 126 (83) 209- Amortization of fair value adjustments
on assumed mortgages payable (52) — (52)- Non-recoverable capital expenditures (108) (504) 396- Leasing costs (2,575) (2,227) (348)
AFFO 17,409 12,475 4,934
Per unit information: ∆%AFFO per unit (basic) 0.39 0.34 0.05 14.7AFFO per unit (fully diluted) 0.38 0.33 0.05 15.2
M A N A GE M E N T ’ S DIS C U S S ION A N D A N A LY S IS

29 } 20 07 A N N U A L R E P ORT
M A N A GE M E N T ’ S DIS C U S S ION A N D A N A LY SIS
Subsequent EventsIn February 2008, Cominar acquired the remaining interest in industrial and mixed-use properties located in Montréal that were previously co-owned. As a result of thisacquisition transaction, Cominar is now the sole owner of these income properties.The purchase price amounted to $18.3 million and the combined capitalization rate,including Cominar’s initial interest acquired in 2007, is estimated at 6.8%.
In February 2008, Cominar acquired land covering an area of 212,000 square feet,on which will be built a 28,600 square-foot industrial and mixed-use property. Thisproperty will be 100% occupied by a single tenant.
Unitholder Taxat ionFor Canadian unitholders, distributions are treated as follows for tax purposes:
For the years ended December 31, 2007 2006
Taxable to unitholders as other income 45.03% 59.50%Taxable to unitholders as capital gains income 0.39% 0.36%Tax deferral 54.58% 40.14%Total 100.00% 100.00%
Disclosure Controls and Procedures
DISCLOSURE CONTROLS AND PROCEDURESThe President and Chief Executive Officer and the Executive Vice-President andChief Financial Officer of Cominar are responsible for establishing and maintai-ning disclosure controls and procedures, as defined under Multilateral Instrument52-109 of the Canadian Securities Administrators. They are assisted in this respon-sibility by the Disclosure Committee, which consists of officers of the Trust.
Under the supervision of the President and Chief Executive Officer and theExecutive Vice-President and Chief Financial Officer, an assessment was conducted to measure the effectiveness of the disclosure controls and proceduresused for the preparation of filings, including this MD&A, the consolidated annualfinancial statements, the Annual Information Form and the Management ProxyCircular. Based on that assessment, the President and Chief Executive Officer andthe Executive Vice-President and Chief Financial Officer of Cominar concluded thatthe disclosure controls and procedures were effective at the close of the fiscal yearended December 31, 2007 and, more specifically, that the design of these controlsand procedures provides reasonable assurance that significant information aboutthe Trust, including its consolidated subsidiaries, is communicated to them duringthe period in which these filings are prepared.
INTERNAL CONTROL OVER FINANCIAL REPORTINGManagement is responsible for establishing and maintaining adequate internalcontrol over financial reporting to provide reasonable assurance regarding the reli-ability of financial reporting and the preparation of financial statements for external purposes in accordance with GAAP.
No changes were made in our internal control over financial reporting during thefiscal year ended December 31, 2007, that have materially affected, or are reasonably likely to materially affect, our internal control over financial reporting.
OutlookCominar’s objectives for fiscal 2008 remain unchanged, specifically to provideunitholders with growing distributions and to maximize unit value through proactive management and expansion of our property portfolio.
In December 2007, Cominar announced an increase in our monthly distribution,raising it from 11.0 cents to 11.3 cents per unit, or $1.356 per unit on an annua-lized basis for fiscal 2008, which represents a 4.2% increase over 2007.
The demand for high-quality retail properties remains strong in Cominar’s markets.In 2008, the Trust will continue to establish our presence in selected markets byseeking and seizing acquisition opportunities that match our rigorous selection criteria. We will also carry out several development and existing property enhance-ment projects, which should yield a solid return on investment.
20 07 A N N U A L R E P ORT { 30
Cominar has a portfolio of high-quality properties located in strategic locations,providing it with an excellent base to continue delivering a growing return oninvestment to unitholders. As for the properties acquired in 2007, we are strivingto control costs and achieve operational efficiencies. Our property occupancy ratesare high and stable and the demand for retail space remains strong in the regionsin which we operate.
Signif icant Accounting Pol ic ies Adopted byCominar and Use of Est imatesOur MD&A is based upon Cominar’s consolidated financial statements, prepared inaccordance with Canadian generally accepted accounting principles (GAAP). Thepreparation and presentation of the consolidated financial statements and anyother financial information contained in the MD&A involves a judicious choice ofappropriate accounting principles and methods whose application requires mana-gement to make estimates and informed judgments. Our estimates are based uponassumptions which we believe to be reasonable, such as those often based uponpast experience. They represent the basis of our judgments regarding the carryingamount of assets and liabilities that, in reality, would not be available from othersources. Use of other methods of estimation might have yielded different amountsthan those presented. Actual results could differ from these estimates.
ACQUISIT ION OF INCOME PROPERTIESSince September 12, 2003, Cominar has applied the CICA’s EIC-140, “Accountingfor Operating Leases Acquired in Either an Asset Acquisition or a BusinessCombination”. In accordance with this Abstract, the CICA requires that a portionof the purchase price of an income property be allocated to in-place operating leases, based on their fair value, to the fair value of customer relationships and tothe fair value of leasehold improvements. This allocation is based on assumptionsand estimates made by management.
These estimates have an impact on operating revenues and on depreciation ofincome properties.
DEPRECIATION OF INCOME PROPERTIESWhen income properties are acquired, management allocates a significant propor-tion of the acquisition cost to the “building” component. Management must thenestimate the useful life of the building in order to depreciate it on an annual basis.Should the allocation of cost to the “building” component or estimated useful lifebe different, the depreciation of income properties recorded during the periodcould prove inadequate.
PROPERTIES UNDER DEVELOPMENT AND LAND HELD FOR FUTURE DEVELOPMENTCapitalization of costs to properties under development continues until the pro-perty reaches its accounting completion date, the determination of which is basedon achieving a satisfactory occupancy level.
IMPAIRMENT OF LONG-LIVED ASSETSReal estate assets are reviewed for impairment whenever events or changes in circumstances indicate that the carrying amount of an asset may not be reco-verable. Impairment is assessed by comparing the carrying amount of an asset withits expected future net undiscounted cash flows from use together with its residualvalue. If such assets are considered to be impaired, the impairment to be recog-nized is measured by the amount by which the carrying amount of the assetsexceeds the fair value.
CONVERTIBLE DEBENTURESThe CICA requires that Cominar’s management estimate at its fair value the conversion option included in the convertible debentures. This estimate, if it wereinadequate, would have an impact on the interest expense for the period presen-ted in the financial statements.
UNIT OPTION PLANThe compensation expense related to unit options is measured at fair value andamortized using the graded vesting method based on the Black-Scholes option pricing model. This model requires the input of various estimates, including volatility,weighted average distribution return and weighted average risk-free interest rate.
M A N A GE M E N T ’ S DIS C U S S ION A N D A N A LY S IS

31 } 20 07 A N N U A L R E P ORT
M A N A GE M E N T ’ S DIS C U S S ION A N D A N A LY SIS
FINANCIAL INSTRUMENTSCICA Handbook Section 3855 establishes standards for recognizing and measuringfinancial assets, financial liabilities and non-financial derivatives. Financial instru-ments must initially be measured at their fair value. The subsequent evaluationwill depend on the classification by Cominar of the financial instrument as finan-cial assets held for trading, loans and receivables, or other financial liabilities.
Cominar must also estimate and annually disclose the fair value of mortgagespayable and convertible debentures for reporting purposes. The estimated fairvalue of the debts is based on assumptions as to the interest rates used in the calculation models.
Recently Publ ished Accounting Changes
HARMONIZATION OF CANADIAN AND INTERNATIONAL STANDARDSIn March 2006, the Accounting Standards Board of the CICA released its new stra-tegic plan which proposed to abandon Canadian GAAP and effect a complete convergence to the International Financial Reporting Standards. At the end of atransitional period of approximately five years, Canadian GAAP will cease to existas a separate, distinct basis of financial reporting for public companies. We willclosely monitor changes arising from this convergence in order to comply there-with by the prescribed deadline.
In the fourth quarter of 2007, the CICA issued three new Handbook sections regar-ding capital and financial instruments, i.e. Sections 1535, 3862 and 3863, which areeffective for interim and annual financial statements relating to fiscal years begin-ning on or after October 1, 2007. The Trust does not foresee that these new sectionswill have a material effect on its results, financial position and cash flows.
Section 1535 “Capital Disclosures” establishes standards for disclosing informationabout an entity’s capital and how it is managed.
Section 3862 “Financial Instruments – Disclosure” modifies the disclosure require-ments for financial instruments that were included in Section 3861 “FinancialInstruments – Disclosure and Presentation”.
Section 3863 “Financial Instruments – Presentation” carries forward unchangedthe presentation requirements of the old Section 3861 “Financial Instruments –Disclosure and Presentation”.
New Accounting Pol ic ies Adopted in 2007In the first quarter of 2007, the Trust adopted the following new accounting standards issued by the CICA:
Section 1530, “Comprehensive Income”, requires that the presentation of compre-hensive income and its components should be given the same importance in theconsolidated financial statements as all other statements which form part of theconsolidated financial statements. Comprehensive income represents changes innet assets of an enterprise derived from operations, events, and circumstancesunrelated to unitholder contributions and the distributions made to them.
Section 3855, “Financial Instruments — Recognition and Measurement”, esta-blishes standards for recognizing and measuring financial assets, financial liabi-lities and non-financial derivatives. These financial instruments must be classifiedin defined categories. The classification determines the manner in which eachinstrument is evaluated and the presentation of related gains and losses. Section3855 also provides guidelines for the accounting of transaction costs incurred fromissuance of debt instruments. These transaction costs must be deducted fromfinancial liabilities and amortized using the effective interest rate method over theestimated life of the related liabilities.
Risks and Uncertaint iesLike any real estate entity, Cominar is exposed to certain risk factors in the normalcourse of business including:
GENERAL BUSINESS AND ECONOMIC CONDITIONSInterest rates, consumer spending, business investment, government spending, thelevel of capital market activity and volatility, and inflation: each impact the busi-ness and economic environments in which we operate and, ultimately, the level ofbusiness activity we conduct and the earnings we generate.
EXECUTION OF OUR STRATEGYOur ability to achieve our objectives and implement our strategy impacts our finan-cial performance. If our strategic objectives are not met with success or there is achange in our strategic objectives, our financial results could be adversely affected.
20 07 A N N U A L R E P ORT { 32
ACQUISIT IONSAlthough we regularly explore opportunities for strategic acquisitions of entities inour lines of business, there is no assurance that we will be able to complete acqui-sitions on terms and conditions that meet our investment criteria. There is also noassurance that we will achieve our financial or strategic objectives or that we willachieve anticipated cost savings following acquisitions. Our performance is contin-gent on retaining the customers and key employees of acquired entities, and thereis no assurance that we will always succeed in doing so.
OPERATIONAL RISKAll immovable property investments are subject to elements of risk. Such invest-ments are affected by general economic conditions, local real estate markets,demand for leased premises, competition from other vacant premises and variousother factors.
The value of immovable property and improvements thereto may also depend onthe solvency and financial stability of the tenants and the economic environmentin which they operate. Our income and DI would be adversely affected if one ormore major tenants or a significant number of tenants were unable to meet theirobligations under their leases or if a significant amount of available space in ourproperties could not be leased on economically favourable lease terms. However,this risk is minimized by the diversification of Cominar’s portfolio, which allowsus to maintain foreseeable cash flow. This risk is also mitigated by the fact that tenants occupy an average area of about 7,000 square feet.
As a fully integrated real estate investment trust, Cominar can also exercise tighterpreventive control over its operations while developing a relationship of trust withits customers and improving its operational and financial performance.
DEBT AND REFINANCINGThe Trust is subject to the risks associated with debt financing, including the riskthat existing mortgages secured by its properties cannot be refinanced or that theterms of such refinancing will not be as favourable as the terms of existing mort-gages. The Trust’s profitability may be impacted by interest rate changes, as interest on borrowings represents a significant cost in the ownership of real estate
investments. Cominar seeks to reduce interest rate risks by spreading the maturityof its long-term debt and limiting the use of floating rate debt as much as possible.As at December 31, 2007, none of Cominar’s long-term debt bore interest at floating interest rates.
In 2008, balances of mortgages payable totalling $132.1 million will become due,of which $81.3 million relate to the Place de la Cité property in Québec City, oneof Cominar’s most prestigious properties.
As at March 13, 2008, Cominar repaid $50.8 million in balances of mortgagespayable using its available credit facilities.
UNITHOLDER LIABILITYUnder the heading “Operating Principles”, the Contract of Trust states that any written document identifying an immovable hypothec or, in the opinion of thetrustees, a material obligation, must contain terms limiting liability to Cominar’sassets exclusively, and specifying that no recourse may be taken against unitholders.
COMPETITIONThe Trust competes for suitable immovable property investments with third partiesthat are presently seeking or may seek in the future immovable property invest-ments similar to those it desires. An increase in the availability of investment fundsand interest in immovable property investments may tend to increase competitionfor immovable property investments, thereby increasing purchase prices andreducing their yield.
In addition, numerous developers, managers and owners of properties competewith the Trust in seeking tenants. The existence of competing developers, mana-gers and owners and competition for its tenants could have an adverse effect on its ability to lease space in its properties and on the rents charged, and couldadversely affect its revenues.
M A N A GE M E N T ’ S DIS C U S S ION A N D A N A LY S IS
33 } 20 07 A N N U A L R E P ORT
M A N A GE M E N T ’ S DIS C U S S ION A N D A N A LY SIS
GOVERNMENT REGULATIONThe Trust and its properties are subject to various governmental legislation andregulations. Any change in such legislation or regulation adverse to the Trust andits properties could affect its financial results.
By their very nature, Cominar’s assets and business are not subject to a high envi-ronmental risk. In accordance with the operating principles stipulated in itsContract of Trust, Cominar must conduct an environmental audit before acquiringa new property. Environmental audits are conducted on its existing propertieswhen deemed appropriate. In its leases, Cominar requires that tenants conducttheir business in compliance with environmental legislation, and that they be heldresponsible for any damage resulting from their use of the leased premises.
INCOME TAXESCominar currently qualifies as a mutual fund trust for income tax purposes. We arerequired by our Contract of Trust to annually distribute all of our taxable income tounitholders and thus are generally not subject to tax on such amount. In order to main-tain our current mutual fund status, we are required to comply with specific restric-tions regarding our activities and the investments held by us. If we were to cease toqualify as a mutual fund trust, the consequences could be material and adverse.
NEW TAX PLANIn connection with its tax fairness plan, the federal Department of Finance intro-duced legislation to implement new tax measures to levy a tax on distributions ofspecified investment flow-through (SIFT) trusts in order to bring the taxation ofthese entities closer into line with that of corporations. Bill C-52 implementingthese measures received royal assent on June 22, 2007.
In short, a SIFT trust is a trust that resides in Canada, its investments are listed ortraded on a stock exchange or other public market and it holds one or more non-portfolio properties.
The new rules apply as of taxation year 2007 for SIFT trusts. However, existing SIFTtrusts as of October 31, 2006 whose future growth will not exceed normal growthbenefit from a four-year transitional period before the new rules apply.
REIT EXCEPTIONThe new tax system does not apply to SIFT trusts that qualify as real estate invest-ment trusts (“REITs”) for a given taxation year. Generally, to qualify as a REIT, atrust must be resident in Canada and meet the following conditions: (i) the only“non-portfolio properties” it owns during the year are “qualified REIT properties”,(ii) at least 95% of its income for the taxation year is from one or more of the fol-lowing sources: “rent from real or immovable properties”; interest, capital gainsfrom the disposition of real or immovable properties; dividends and royalties, (iii)at least 75% of its income for the taxation year is from one or more of the following sources: “rent from real or immovable properties” to the extent that it isfrom such properties situated in Canada; interest from mortgages, or hypothecs, onreal or immovable properties situated in Canada and capital gains from disposi-tions of real or immovable properties situated in Canada and (iv) at no time in thetaxation year is the total fair market value of all properties held by the trust, eachof which is a real or immovable property situated in Canada, an amount, or generally, a debt payable to the Government of Canada or to certain public agencies, less than 75% of the equity value of the trust at that time.
As of December 31, 2007, Cominar met all of these conditions and qualified as aREIT. As a result, the new SIFT trust tax rules do not apply to Cominar.
Cominar’s management intends to take the necessary steps to meet these condi-tions on a regular basis in the future.
CONSTRUCTION RISKDue to the Trust’s involvement in development and construction activities, it issubject to related risks such as construction cost overruns and other unforeseeabledelays. Such risks are minimized by the fact that major projects are done in pha-ses, which allows it to better assess the demand for a project in particular.
ABILITY TO ATTRACT AND RETAIN KEY EMPLOYEESCompetition for qualified employees and executives is intense. If we are unable to retainand attract qualified employees and executives, our results of operations and financialcondition, including our competitive position, may be materially adversely affected.

20 07 A N N U A L R E P ORT { 34
Selected F inancial InformationThe following table presents a summary of selected financial information for thefiscal years indicated below:
For the years ended December 31, 2007 2006 2005
Income Statement DataOperating revenues 182,124 126,750 121,561Net operating income 109,771 77,051 73,644Net income 29,241 34,075 31,327DI 63,237 48,061 44,749Distributions 55,454 42,724 39,549
Per unit information:Net income (basic) 0.70 0.99 0.96Net income (diluted) 0.69 0.98 0.95DI 1.52 1.40 1.37DI (fully diluted) 1.49 1.35 1.31Distributions 1.301 1.230 1.210
Weighted average number of units (basic) (000’s) 41,592 34,365 32,585Weighted average number of units (fully diluted) (000’s) 46,785 39,058 38,795
Balance Sheet DataIncome properties 1,323,095 711,441 658,855Properties under development andland held for future development 61,280 24,232 22,020Total assets 1,442,794 786,455 725,582Mortgages payable 619,755 270,142 253,581Convertible debentures 203,852 39,984 97,535Bank indebtedness 35,321 73,616 25,811
M A N A GE M E N T ’ S DIS C U S S ION A N D A N A LY S IS
35 } 20 07 A N N U A L R E P ORT
M A N A GE M E N T ’ S DIS C U S S ION A N D A N A LY SIS
Management ’s Responsibi l i ty for F inancial Report ing
The accompanying consolidated financial statements of Cominar Real Estate
Investment Trust (“Cominar”) were prepared by management, which is respon-
sible for the integrity and fairness of the information presented, including the many
amounts that must of necessity be based on estimates and judgments. These
consolidated financial statements were prepared in accordance with Canadian
gene-rally accepted accounting principles (“GAAP”). Financial information
appearing throughout our MD&A is consistent with these consolidated financial
statements.
In discharging our responsibility for the integrity and fairness of the consolidated
financial statements and for the accounting systems from which they are derived,
we maintain the necessary system of internal controls designed to ensure that trans-
actions are authorized, assets are safeguarded and proper records are maintained.
As at December 31, 2007, the President and Chief Executive Officer and the
Executive Vice President and Chief Financial Officer of Cominar had an evaluation
carried out, under their direct supervision, of the effectiveness of the controls and
procedures used for the preparation of filings, as defined in Multilateral Instrument
52-109 of the Canadian Securities Administrators. Based on that evaluation, they
concluded that the disclosure controls and procedures were effective.
The Board of Trustees oversees management’s responsibility for financial reporting
through an Audit Committee, which is composed entirely of Trustees who are not
members of Cominar’s management or personnel. This Committee reviews our
consolidated financial statements and recommends them to the Board for approval.
Other key responsibilities of the Audit Committee include reviewing our existing
internal control procedures and planned revisions to those procedures, and advi-
sing the trustees on auditing matters and financial reporting issues.
Ernst & Young LLP, Independent Chartered Accountants appointed by the unit-
holders of Cominar upon the recommendation of the Board, have performed an
independent audit of the Consolidated Financial Statements and their report
follows. The auditors have full and unrestricted access to the Audit Committee to
discuss their audit and related findings.
Michel Dallaire, P.Eng. Michel Berthelot, CA
President and Chief Executive Officer Executive Vice President
and Chief Financial Officer
Quebec City, March 13, 2008
20 07 A N N U A L R E P ORT { 36
Auditors ’ Report
To the unitholders ofCominar Real Estate Investment Trust ,
We have audited the consolidated balance sheets of Cominar Real Estate
Investment Trust as at December 31, 2007 and 2006 and the consolidated state-
ments of income and comprehensive income, unitholders’ equity and cash flows
for the years then ended. These financial statements are the responsibility of the
Trust’s management. Our responsibility is to express an opinion on these financial
statements based on our audits.
We conducted our audits in accordance with Canadian generally accepted auditing
standards. Those standards require that we plan and perform an audit to obtain
reasonable assurance whether the financial statements are free of material
misstatement. An audit includes examining, on a test basis, evidence supporting
the amounts and disclosures in the financial statements. An audit also includes
assessing the accounting principles used and significant estimates made by
management, as well as evaluating the overall financial statement presentation.
In our opinion, these consolidated financial statements present fairly, in all
material respects, the financial position of the Trust as at December 31, 2007 and
2006 and the results of its operations and its cash flows for the years then ended
in accordance with Canadian generally accepted accounting principles.
Chartered Accountants
Quebec City, CanadaFebruary 7, 2008[except as to note 24 which is as of February 29, 2008]
M A N A GE M E N T ’ S DIS C U S S ION A N D A N A LY S IS
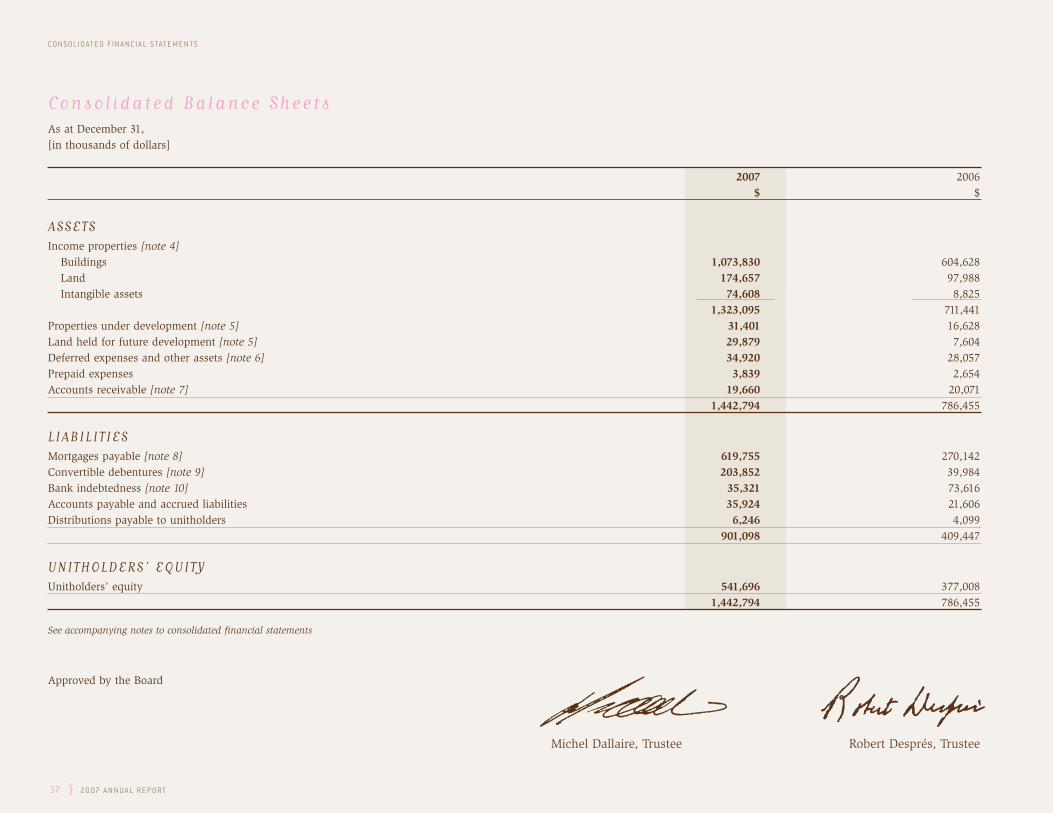
37 } 20 07 A N N U A L R E P ORT
CONS OLIDAT E D F IN A NCI A L S TAT E M E N T S
Consol idated Balance SheetsAs at December 31,[in thousands of dollars]
2007 2006$ $
ASSETSIncome properties [note 4]
Buildings 1,073,830 604,628Land 174,657 97,988Intangible assets 74,608 8,825
1,323,095 711,441Properties under development [note 5] 31,401 16,628Land held for future development [note 5] 29,879 7,604Deferred expenses and other assets [note 6] 34,920 28,057Prepaid expenses 3,839 2,654Accounts receivable [note 7] 19,660 20,071
1,442,794 786,455
LIABILIT IES Mortgages payable [note 8] 619,755 270,142Convertible debentures [note 9] 203,852 39,984Bank indebtedness [note 10] 35,321 73,616Accounts payable and accrued liabilities 35,924 21,606Distributions payable to unitholders 6,246 4,099
901,098 409,447
UNITHOLDERS’ EQUITYUnitholders’ equity 541,696 377,008
1,442,794 786,455
See accompanying notes to consolidated financial statements
Approved by the Board
Michel Dallaire, Trustee Robert Després, Trustee

20 07 A N N U A L R E P ORT { 38
CONS OLIDAT E D F IN A NCI A L S TAT E M E N T S
Consol idated Statements of Unitholders ’ EquityYears ended December 31,[in thousands of dollars]
2007 2006$ $
Unitholders’ contributions [note 11]Balance, beginning of year 400,698 338,230Issue of units 196,378 62,468Underwriters’ fees and offering (5,904) —Balance, end of year 591,172 400,698
Cumulative net incomeBalance, beginning of year 218,538 184,463Net income 29,241 34,075Balance, end of year 247,779 218,538
Cumulative distributionsBalance, beginning of year (242,626) (199,902)Distributions to unitholders (55,454) (42,724)Balance, end of year (298,080) (242,626)
Contributed surplusBalance, beginning of year 398 351Unit option plan 115 47Balance, end of year 513 398
Other equity componentConvertible debentures equity component 312 —Unitholders’ equity 541,696 377,008
See accompanying notes to consolidated financial statements

39 } 20 07 A N N U A L R E P ORT
CONS OLIDAT E D F IN A NCI A L S TAT E M E N T S
Consol idated Statements of Income and Comprehensive IncomeYears ended December 31,[in thousands of dollars except per-unit amounts]
2007 2006 $ $
Operating revenuesRental revenue from income properties 182,124 126,750
Operating expensesOperating costs 35,126 24,579 Realty taxes and services 35,470 24,123 Property management expenses 1,757 997
72,353 49,699
Operating income before the undernoted 109,771 77,051
Interest on borrowings 35,711 20,712 Depreciation of income properties 35,514 15,261 Amortization of deferred leasing costs 6,965 6,139 Amortization of other assets 196 177
78,386 42,289
Operating income from real estate assets 31,385 34,762
Trust administrative expenses 2,968 2,130
Other revenues 394 489
Unusual items [note 21] 422 (554)
Net income from continuing operations 29,233 32,567
Net income from discontinued operations [note 20] 8 1,508
Net income and comprehensive income 29,241 34,075
Basic net income per unit [note 13] 0.703 0.992
Diluted net income per unit [note 13] 0.693 0.977
See accompanying notes to consolidated financial statements

20 07 A N N U A L R E P ORT { 40
CONS OLIDAT E D F IN A NCI A L S TAT E M E N T S
Consol idated Statements of Cash F lowsYears ended December 31,[in thousands of dollars]
2007 2006 $ $
OPERATING ACTIVIT IESNet income 29,241 34,075 Items not affecting cash
Depreciation of income properties 36,132 16,276 Amortization of above- (below-) market leases (250) 120 Amortization of deferred leasing costs 6,965 6,139 Amortization of deferred financing costs and other assets 930 728 Amortization of fair value adjustments on assumed indebtedness (52) —Accretion of liability component of convertible debentures 9 —Compensation costs related to unit option plan 217 179 Gain on disposals of income properties — (835)
73,192 56,682
Change in non-cash operating working capital items [note 16] 10,255 (5,269) 83,447 51,413
INVESTING ACTIVIT IESAcquisitions of income properties:
- from Alexis Nihon REIT property portfolio [note 4] (365,330) —- other acquisitions (53,052) (59,260)
Additions to properties under development and land held for future development (47,863) (15,122) Net proceeds on disposal of income properties [note 22] 30,000 393 Leasing costs (9,746) (7,479) Other assets (322) (225)
(446,313) (81,693)
FINANCING ACTIVIT IESMortgages payable 167,987 59,267 Repayments of mortgages payable (67,389) (42,584) Net proceeds from issue of convertible debentures [note 9] 182,720 —Bank indebtedness (38,394) 47,805Net proceeds from issue of units [note 11] 169,454 6,668 Distributions to unitholders (51,512) (40,876)
362,866 30,280
Net change in cash and cash equivalents — —Cash and cash equivalents, beginning of year — —Cash and cash equivalents, end of year — —
See accompanying notes to consolidated financial statements

41 } 20 07 A N N U A L R E P ORT
CONS OLIDAT E D F IN A NCI A L S TAT E M E N T S
Notes to Consol idated F inancial StatementsDecember 31, 2007 and 2006[in thousands of dollars except per-unit amounts]
1 . DESCRIPTION OF THE TRUSTCominar Real Estate Investment Trust (“Cominar”) is an unincorporated closed-end real estate investment trust created by the Contract of Trust on March 31, 1998under the laws of the Province of Québec.
2. NEW ACCOUNTING POLICIES
ADOPTED IN 2007In the first quarter of 2007, Cominar adopted the following new accounting stan-dards issued by the Canadian Institute of Chartered Accountants (CICA):
Section 1530, “Comprehensive Income”, requires that the presentation of compre-hensive income and its components should be given the same importance in theconsolidated financial statements as all other statements which form part of theconsolidated financial statements. Comprehensive income represents the changesin net assets of an enterprise derived from operations, events, and circumstancesunrelated to the unitholders’ contributions and the distributions made to them.
Section 3855, “Financial Instruments – Recognition and Measurement”, establishesstandards for recognizing and measuring financial assets, financial liabilities andnon-financial derivatives. These financial instruments must be classified in definedcategories. The classification determines the manner in which each instrument isevaluated and the presentation of related gains and losses.
Cominar used the following classifications:- Cash and cash equivalents are classified as “Financial Assets Held for Trading”.
They are measured at their fair value and the gains/losses resulting from the period-end revaluations are recorded in net income.
- Accounts receivable, including loans to certain customers, are classified as “Loans and Receivables”. They are initially measured at fair value and subse-quently remeasured at amortized cost using the effective interest rate method. For Cominar, the measured amount generally corresponds to cost.
- Mortgages payable, convertible debentures, bank indebtedness, accounts payable and accrued liabilities, and distributions payable to unitholders are classified as “Other Financial Liabilities”. They are initially measured at fair value and subsequently remeasured at amortized cost using the effective interest rate method. For Cominar, the measured amount generally corresponds to cost.
These new standards have to be applied without restatement of prior periodamounts. Upon initial application, all adjustments to the carrying amount of finan-cial assets and liabilities must be recognized as an adjustment to the opening balance of cumulative net income or accumulated other comprehensive income,depending on the classification of existing financial assets and liabilities. The appli-cation of these new standards had no effect on Cominar’s consolidated financialstatements.
Section 3855 also provides guidelines for the accounting of transaction costsincurred from issuance of debt instruments. These transaction costs must bededucted from financial liabilities and amortized using the effective interest ratemethod over the estimated life of the related liabilities.
RECENTLY PUBLISHEDCapital and Financial Instruments: In December 2006, the CICA issued three newsections regarding capital and financial instruments. Sections 1535, 3862 and 3863apply to interim and annual financial statements relating to fiscal years beginningon or after October 1, 2007. The Trust does not anticipate that the application ofthese new sections in 2008 will have a material impact on its results, financial posi-tion and cash flows.
Section 1535 “Capital Disclosures” establishes standards for disclosing informationabout an entity’s capital and how it is managed. These standards require an entity to disclose the following:
- its objectives, policies and processes for managing capital;- summary quantitative data about what it manages as capital;- whether during the period it complied with any externally imposed capital
requirements to which it is subject;- when the entity has not complied with such requirements, the consequences
of such non-compliance.
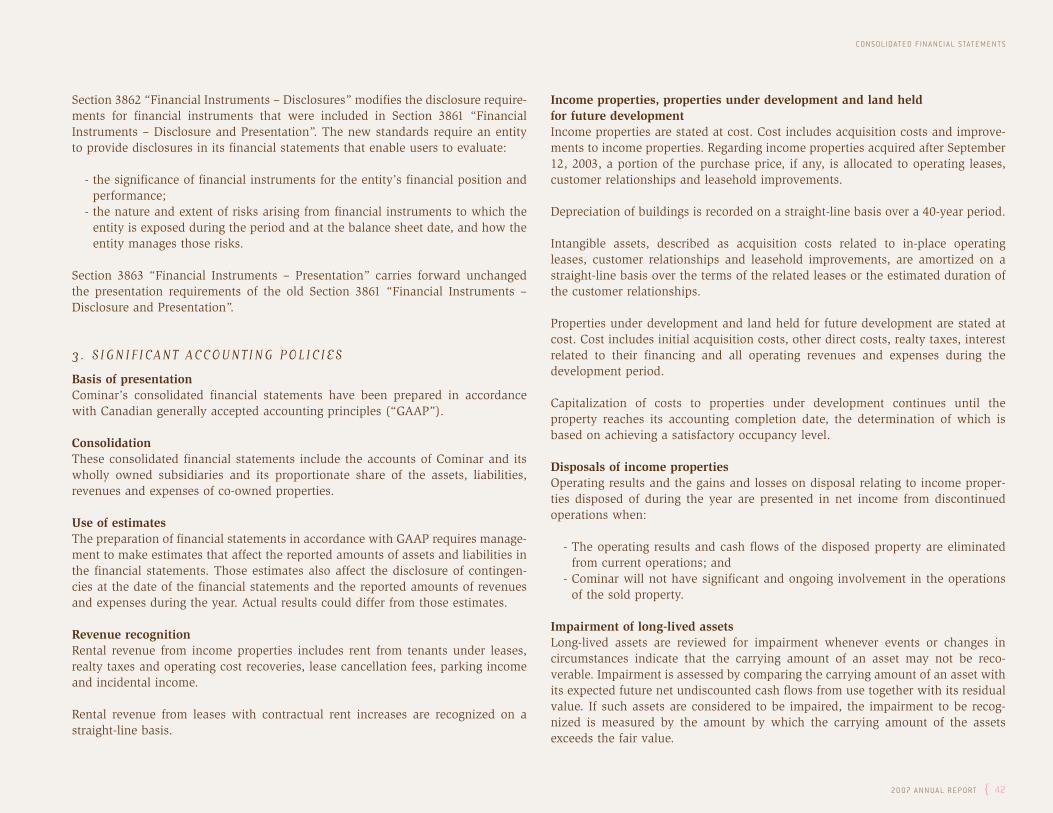
20 07 A N N U A L R E P ORT { 42
CONS OLIDAT E D F IN A NCI A L S TAT E M E N T S
Section 3862 “Financial Instruments – Disclosures” modifies the disclosure require-ments for financial instruments that were included in Section 3861 “FinancialInstruments – Disclosure and Presentation”. The new standards require an entityto provide disclosures in its financial statements that enable users to evaluate:
- the significance of financial instruments for the entity’s financial position and performance;
- the nature and extent of risks arising from financial instruments to which the entity is exposed during the period and at the balance sheet date, and how the entity manages those risks.
Section 3863 “Financial Instruments – Presentation” carries forward unchangedthe presentation requirements of the old Section 3861 “Financial Instruments –Disclosure and Presentation”.
3. S IGNIFICANT ACCOUNTING POLICIES
Basis of presentationCominar’s consolidated financial statements have been prepared in accordancewith Canadian generally accepted accounting principles (“GAAP”).
ConsolidationThese consolidated financial statements include the accounts of Cominar and itswholly owned subsidiaries and its proportionate share of the assets, liabilities, revenues and expenses of co-owned properties.
Use of estimatesThe preparation of financial statements in accordance with GAAP requires manage-ment to make estimates that affect the reported amounts of assets and liabilities inthe financial statements. Those estimates also affect the disclosure of contingen-cies at the date of the financial statements and the reported amounts of revenuesand expenses during the year. Actual results could differ from those estimates.
Revenue recognitionRental revenue from income properties includes rent from tenants under leases,realty taxes and operating cost recoveries, lease cancellation fees, parking incomeand incidental income.
Rental revenue from leases with contractual rent increases are recognized on astraight-line basis.
Income properties, properties under development and land held for future developmentIncome properties are stated at cost. Cost includes acquisition costs and improve-ments to income properties. Regarding income properties acquired after September12, 2003, a portion of the purchase price, if any, is allocated to operating leases,customer relationships and leasehold improvements.
Depreciation of buildings is recorded on a straight-line basis over a 40-year period.
Intangible assets, described as acquisition costs related to in-place operating leases, customer relationships and leasehold improvements, are amortized on astraight-line basis over the terms of the related leases or the estimated duration ofthe customer relationships.
Properties under development and land held for future development are stated atcost. Cost includes initial acquisition costs, other direct costs, realty taxes, interestrelated to their financing and all operating revenues and expenses during the development period.
Capitalization of costs to properties under development continues until the property reaches its accounting completion date, the determination of which isbased on achieving a satisfactory occupancy level.
Disposals of income propertiesOperating results and the gains and losses on disposal relating to income proper-ties disposed of during the year are presented in net income from discontinuedoperations when:
- The operating results and cash flows of the disposed property are eliminated from current operations; and
- Cominar will not have significant and ongoing involvement in the operations of the sold property.
Impairment of long-lived assetsLong-lived assets are reviewed for impairment whenever events or changes in circumstances indicate that the carrying amount of an asset may not be reco-verable. Impairment is assessed by comparing the carrying amount of an asset withits expected future net undiscounted cash flows from use together with its residualvalue. If such assets are considered to be impaired, the impairment to be recog-nized is measured by the amount by which the carrying amount of the assetsexceeds the fair value.
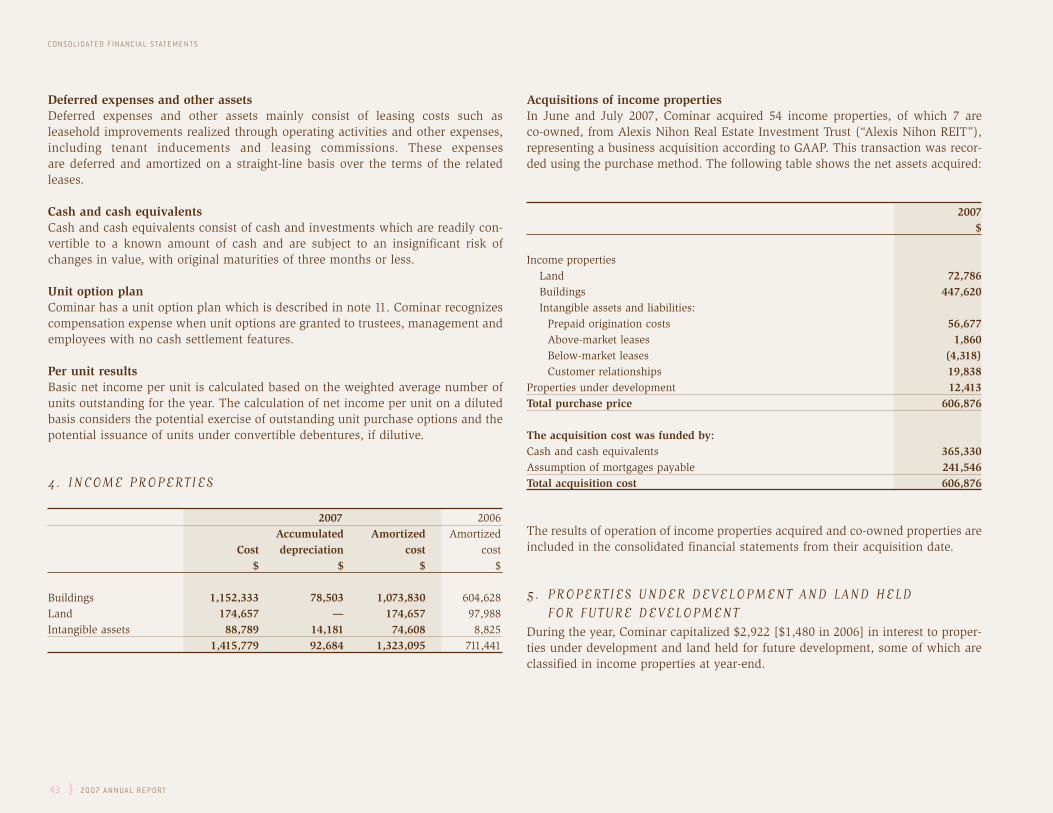
43 } 20 07 A N N U A L R E P ORT
CONS OLIDAT E D F IN A NCI A L S TAT E M E N T S
Deferred expenses and other assetsDeferred expenses and other assets mainly consist of leasing costs such as leasehold improvements realized through operating activities and other expenses,including tenant inducements and leasing commissions. These expenses are deferred and amortized on a straight-line basis over the terms of the relatedleases.
Cash and cash equivalentsCash and cash equivalents consist of cash and investments which are readily con-vertible to a known amount of cash and are subject to an insignificant risk ofchanges in value, with original maturities of three months or less.
Unit option planCominar has a unit option plan which is described in note 11. Cominar recognizescompensation expense when unit options are granted to trustees, management andemployees with no cash settlement features.
Per unit resultsBasic net income per unit is calculated based on the weighted average number ofunits outstanding for the year. The calculation of net income per unit on a dilutedbasis considers the potential exercise of outstanding unit purchase options and thepotential issuance of units under convertible debentures, if dilutive.
4. INCOME PROPERTIES
2007 2006Accumulated Amortized Amortized
Cost depreciation cost cost$ $ $ $
Buildings 1,152,333 78,503 1,073,830 604,628Land 174,657 — 174,657 97,988Intangible assets 88,789 14,181 74,608 8,825
1,415,779 92,684 1,323,095 711,441
Acquisitions of income propertiesIn June and July 2007, Cominar acquired 54 income properties, of which 7 are co-owned, from Alexis Nihon Real Estate Investment Trust (“Alexis Nihon REIT”), representing a business acquisition according to GAAP. This transaction was recor-ded using the purchase method. The following table shows the net assets acquired:
2007$
Income propertiesLand 72,786 Buildings 447,620 Intangible assets and liabilities:
Prepaid origination costs 56,677 Above-market leases 1,860 Below-market leases (4,318) Customer relationships 19,838
Properties under development 12,413 Total purchase price 606,876
The acquisition cost was funded by:Cash and cash equivalents 365,330 Assumption of mortgages payable 241,546 Total acquisition cost 606,876
The results of operation of income properties acquired and co-owned properties areincluded in the consolidated financial statements from their acquisition date.
5. PROPERTIES UNDER DEVELOPMENT AND LAND HELD FOR FUTURE DEVELOPMENT
During the year, Cominar capitalized $2,922 [$1,480 in 2006] in interest to proper-ties under development and land held for future development, some of which areclassified in income properties at year-end.

20 07 A N N U A L R E P ORT { 44
CONS OLIDAT E D F IN A NCI A L S TAT E M E N T S
6. DEFERRED EXPENSES AND OTHER ASSETS
2007 2006$ $
At amortized costLeasing costs 34,077 27,339Other assets 843 718
34,920 28,057
7. ACCOUNTS RECEIVABLE
2007 2006$ $
Accounts receivable 8,301 6,391Deferred accounts receivable 6,674 5,448Other accounts receivable, bearing interest at a weighted
average rate of 7.40% [7.50% as at December 31, 2006] 2,504 2,545Balances of sale [note 20] — 5,687Restricted funds 2,181 —
19,660 20,071
8. MORTGAGES PAYABLEMortgages payable are secured by immovable hypothecs on income properties having a carrying value of $1,014,227 [$422,315 as at December 31, 2006]. Theybear interest at rates ranging from 4.68% to 11.00% per annum [5.72% to 11.00%as at December 31, 2006] representing a weighted average year-end rate of 5.78%[6.24% as at December 31, 2006] and are renewable at various dates from January2008 to March 2022.
Certain loans on income properties assumed in connection with acquisitions com-pleted during the year were adjusted to their fair value using market rates in effectat the date of acquisition. These fair value adjustments are amortized throughincome under “Interest on borrowings” over the residual term to maturity of theloans using the effective interest rate method.
Transaction costs related to mortgages payable are deducted from these loans,amortized using the effective interest rate method over the terms of the relatedmortgages and recorded under “Interest on borrowings.”
Mortgage repayments are as follows:
Principal Balance atrepayments maturity Total
Years ending December 31, $ $ $
2008 14,348 132,098 146,4462009 11,918 52,341 64,2592010 12,055 24,070 36,1252011 12,330 5,056 17,3862012 12,209 16,380 28,5892013 11,550 4,841 16,3912014 and thereafter 61,944 248,996 310,940
136,354 483,782 620,136
Plus: fair value adjustments on assumed indebtedness 465Less: unamortized financing costs (846)
619,755
Mortgages payable with fixed rates amount to $620,136 [$263,809 as at Decem-ber 31, 2006] and those with variable rates were repaid during the year [$6,840 asat December 31, 2006].
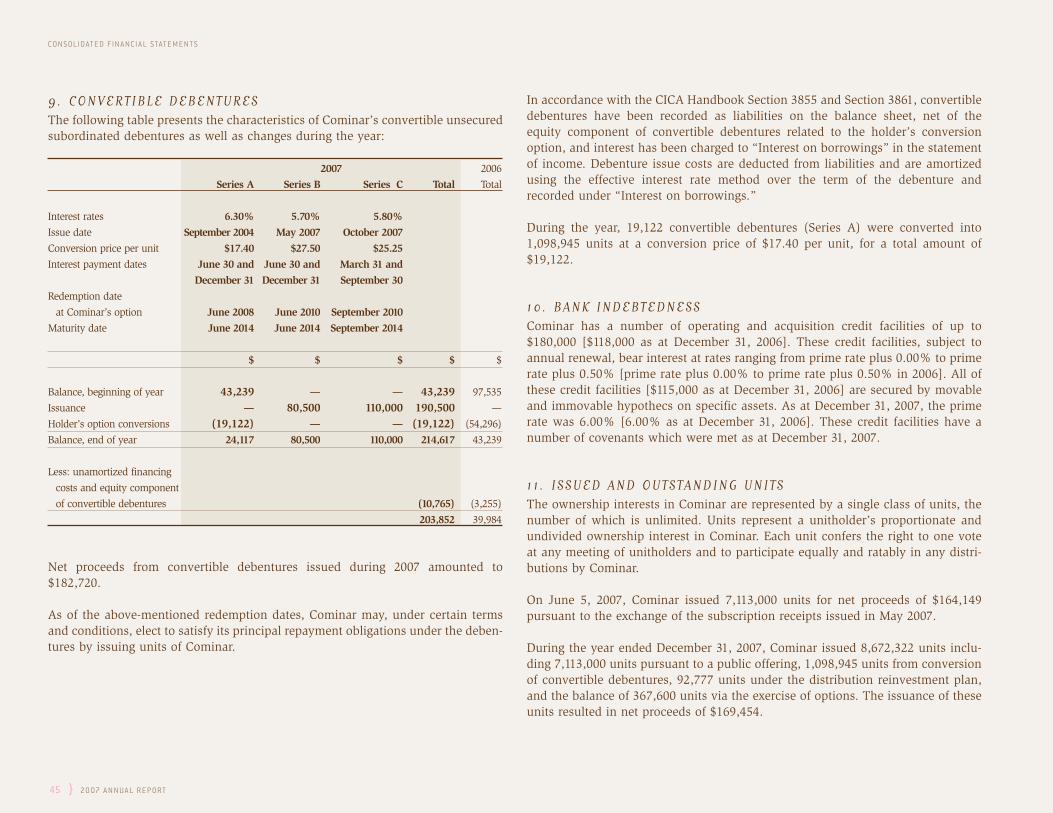
45 } 20 07 A N N U A L R E P ORT
CONS OLIDAT E D F IN A NCI A L S TAT E M E N T S
9. CONVERTIBLE DEBENTURESThe following table presents the characteristics of Cominar’s convertible unsecuredsubordinated debentures as well as changes during the year:
2007 2006
Series A Series B Series C Total Total
Interest rates 6.30% 5.70% 5.80%
Issue date September 2004 May 2007 October 2007
Conversion price per unit $17.40 $27.50 $25.25
Interest payment dates June 30 and June 30 and March 31 and
December 31 December 31 September 30
Redemption date
at Cominar’s option June 2008 June 2010 September 2010
Maturity date June 2014 June 2014 September 2014
$ $ $ $ $
Balance, beginning of year 43,239 — — 43,239 97,535
Issuance — 80,500 110,000 190,500 —
Holder’s option conversions (19,122) — — (19,122) (54,296)
Balance, end of year 24,117 80,500 110,000 214,617 43,239
Less: unamortized financing
costs and equity component
of convertible debentures (10,765) (3,255)
203,852 39,984
Net proceeds from convertible debentures issued during 2007 amounted to$182,720.
As of the above-mentioned redemption dates, Cominar may, under certain termsand conditions, elect to satisfy its principal repayment obligations under the deben-tures by issuing units of Cominar.
In accordance with the CICA Handbook Section 3855 and Section 3861, convertibledebentures have been recorded as liabilities on the balance sheet, net of the equity component of convertible debentures related to the holder’s conversionoption, and interest has been charged to “Interest on borrowings” in the statementof income. Debenture issue costs are deducted from liabilities and are amortizedusing the effective interest rate method over the term of the debenture and recorded under “Interest on borrowings.”
During the year, 19,122 convertible debentures (Series A) were converted into1,098,945 units at a conversion price of $17.40 per unit, for a total amount of$19,122.
10. BANK INDEBTEDNESSCominar has a number of operating and acquisition credit facilities of up to$180,000 [$118,000 as at December 31, 2006]. These credit facilities, subject toannual renewal, bear interest at rates ranging from prime rate plus 0.00% to primerate plus 0.50% [prime rate plus 0.00% to prime rate plus 0.50% in 2006]. All ofthese credit facilities [$115,000 as at December 31, 2006] are secured by movableand immovable hypothecs on specific assets. As at December 31, 2007, the primerate was 6.00% [6.00% as at December 31, 2006]. These credit facilities have anumber of covenants which were met as at December 31, 2007.
11 . ISSUED AND OUTSTANDING UNITSThe ownership interests in Cominar are represented by a single class of units, thenumber of which is unlimited. Units represent a unitholder’s proportionate andundivided ownership interest in Cominar. Each unit confers the right to one voteat any meeting of unitholders and to participate equally and ratably in any distri-butions by Cominar.
On June 5, 2007, Cominar issued 7,113,000 units for net proceeds of $164,149 pursuant to the exchange of the subscription receipts issued in May 2007.
During the year ended December 31, 2007, Cominar issued 8,672,322 units inclu-ding 7,113,000 units pursuant to a public offering, 1,098,945 units from conversionof convertible debentures, 92,777 units under the distribution reinvestment plan,and the balance of 367,600 units via the exercise of options. The issuance of theseunits resulted in net proceeds of $169,454.
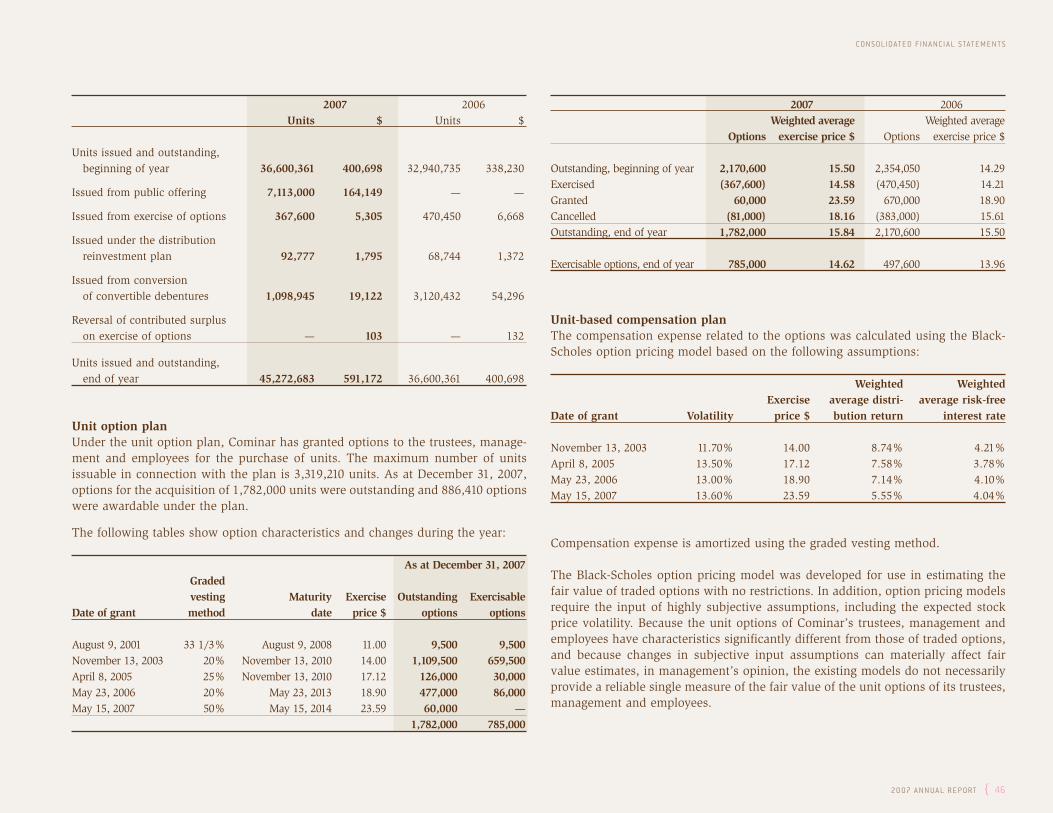
20 07 A N N U A L R E P ORT { 46
CONS OLIDAT E D F IN A NCI A L S TAT E M E N T S
2007 2006Units $ Units $
Units issued and outstanding, beginning of year 36,600,361 400,698 32,940,735 338,230
Issued from public offering 7,113,000 164,149 — —
Issued from exercise of options 367,600 5,305 470,450 6,668
Issued under the distribution reinvestment plan 92,777 1,795 68,744 1,372
Issued from conversion of convertible debentures 1,098,945 19,122 3,120,432 54,296
Reversal of contributed surplus on exercise of options — 103 — 132
Units issued and outstanding, end of year 45,272,683 591,172 36,600,361 400,698
Unit option planUnder the unit option plan, Cominar has granted options to the trustees, manage-ment and employees for the purchase of units. The maximum number of unitsissuable in connection with the plan is 3,319,210 units. As at December 31, 2007,options for the acquisition of 1,782,000 units were outstanding and 886,410 optionswere awardable under the plan.
The following tables show option characteristics and changes during the year:
As at December 31, 2007Gradedvesting Maturity Exercise Outstanding Exercisable
Date of grant method date price $ options options
August 9, 2001 33 1/3% August 9, 2008 11.00 9,500 9,500November 13, 2003 20% November 13, 2010 14.00 1,109,500 659,500April 8, 2005 25% November 13, 2010 17.12 126,000 30,000May 23, 2006 20% May 23, 2013 18.90 477,000 86,000May 15, 2007 50% May 15, 2014 23.59 60,000 —
1,782,000 785,000
2007 2006Weighted average Weighted average
Options exercise price $ Options exercise price $
Outstanding, beginning of year 2,170,600 15.50 2,354,050 14.29Exercised (367,600) 14.58 (470,450) 14.21Granted 60,000 23.59 670,000 18.90Cancelled (81,000) 18.16 (383,000) 15.61Outstanding, end of year 1,782,000 15.84 2,170,600 15.50
Exercisable options, end of year 785,000 14.62 497,600 13.96
Unit-based compensation planThe compensation expense related to the options was calculated using the Black-Scholes option pricing model based on the following assumptions:
Weighted Weighted Exercise average distri- average risk-free
Date of grant Volatility price $ bution return interest rate
November 13, 2003 11.70% 14.00 8.74% 4.21%April 8, 2005 13.50% 17.12 7.58% 3.78%May 23, 2006 13.00% 18.90 7.14% 4.10%May 15, 2007 13.60% 23.59 5.55% 4.04%
Compensation expense is amortized using the graded vesting method.
The Black-Scholes option pricing model was developed for use in estimating thefair value of traded options with no restrictions. In addition, option pricing modelsrequire the input of highly subjective assumptions, including the expected stockprice volatility. Because the unit options of Cominar’s trustees, management andemployees have characteristics significantly different from those of traded options,and because changes in subjective input assumptions can materially affect fairvalue estimates, in management’s opinion, the existing models do not necessarilyprovide a reliable single measure of the fair value of the unit options of its trustees,management and employees.
47 } 20 07 A N N U A L R E P ORT
CONS OLIDAT E D F IN A NCI A L S TAT E M E N T S
Distribution reinvestment planCominar adopted a distribution reinvestment plan under which unitholders mayelect to have all cash distributions of Cominar automatically reinvested in addi-tional units. The plan provides plan participants with a number of units amounting to 105% of the cash distributions. During 2007, 92,777 units wereissued at a weighted average price of $19.34 for a total consideration of $1,795 pursuant to the distribution reinvestment plan.
12. INCOME TAXESCominar is taxed as a “Mutual Fund Trust” for income tax purposes. Pursuant tothe Contract of Trust, the trustees intend to distribute or designate all taxableincome directly earned by Cominar to unitholders of Cominar and to deduct suchdistributions and designations for income tax purposes. Therefore, no provision forincome taxes is required.
Cominar’s subsidiaries are Canadian-based enterprises which are subject to tax on their taxable income under the Income Tax Act (Canada) at an average rateof approximately 32%. There is no provision required for the period endedDecember 31, 2007.
The carrying value of Cominar’s net assets as at December 31, 2007 exceeded thetax basis by approximately $82,000 [$83,700 as at December 31, 2006].
New tax systemIn connection with its Tax Fairness Plan, the federal Department of Finance intro-duced legislation to implement new tax measures to levy a tax on distributions ofspecified investment flow-through (SIFT) trusts in order to bring taxation of theseentities closer into line with that of corporations. Bill C-52 implementing thesemeasures received royal assent on June 22, 2007.
In short, a SIFT trust is a trust that resides in Canada, its investments are listed ortraded on a stock exchange or other public market and it holds one or more non-portfolio properties.
Application of new rulesThe new rules apply as of taxation year 2007 for SIFT trusts. However, existing SIFTtrusts as at October 31, 2006, whose future growth will not exceed normal growth,benefit from a four-year transition period before the new rules apply.
REIT exceptionThe new tax system does not apply to SIFT trusts that qualify as real estate invest-ment trusts (REITs) for a given taxation year. Generally, to qualify as a REIT, a trustmust be resident in Canada and meet the following conditions: (i) the only “non-portfolio properties” it owns during the year are “qualified REIT properties,” (ii) atleast 95% of its income for the taxation year is from one or more of the followingsources: “rent from real or immovable properties;” interest, capital gains from thedisposition of real or immovable properties; dividends and royalties, (iii) at least75% of its income for the taxation year is from one or more of the followingsources: “rent from real or immovable properties” to the extent that it is from suchproperties located in Canada; interest from mortgages on real or immovable properties located in Canada and capital gains from dispositions of real or immovable properties located in Canada; and (iv) at no time in the taxation yearis the total fair market value of all properties held by the trust, each of which is areal or immovable property located in Canada, an amount, or generally, a debtpayable to the Government of Canada or to certain public agencies, less than 75%of the equity value of the trust at that time.
As at December 31, 2007, Cominar met all of these conditions and qualifies as aREIT. As a result, the new SIFT trust tax rules do not apply to Cominar.
Cominar’s management intends to take the necessary steps to meet these condi-tions on a regular basis in the future.
13. PER-UNIT RESULTSThe following table provides a reconciliation of the weighted average number ofunits outstanding used to calculate basic and diluted net income per unit.
2007 2006
Weighted average number of units outstanding – basic 41,592,324 34,364,768Effect of dilutive unit options 575,158 513,154Weighted average number of units outstanding – diluted 42,167,482 34,877,922
The potential issuance of units under convertible debentures has an anti-dilutiveeffect on the calculation of the diluted net income per unit.
20 07 A N N U A L R E P ORT { 48
CONS OLIDAT E D F IN A NCI A L S TAT E M E N T S
14. DISTRIBUTIONSCominar is governed by a Contract of Trust that requires it to distribute 85% ormore of its distributable income to unitholders. The distributable income gene-rally means net income determined in accordance with GAAP, adjusted for depre-ciation of income properties and amortization of above-and below-market leases,compensation costs related to unit options, accretion of liability component of con-vertible debentures, deferred rental income, gains or losses on disposals of incomeproperties and amortization of fair value adjustments on assumed indebtedness.
2007 2006 $ $
Distributions to unitholders 55,454 42,724Distributions per unit 1.301 1.230
15) INVESTMENTS IN CO-OWNED PROPERTIESCominar’s proportionate share of the assets, revenues and net income of co-ownedproperties acquired in 2007 are as follows:
2007 2006$ $
Operating revenues 708 —
Net income 174 —
Co-owned properties account for approximately 1% of the carrying value ofCominar’s total assets.
16. SUPPLEMENTAL CASH FLOW INFORMATIONChange in non-cash working capital items is as follows:
2007 2006$ $
Prepaid expenses (1,184) (299) Accounts receivable (423) (4,066)Accounts payable and accrued liabilities 11,862 (904)
10,255 (5,269)
Additional informationInterest paid 36,810 25,129Unpaid leasing costs 5,280 1,325Additions to income properties and properties under
development by assumption of mortgages payable 249,004 —
Unpaid additions to income properties and propertiesunder development 3,707 6,075
Properties under development transferred to income properties 10,428 14,288
17 . RELATED-PARTY TRANSACTIONSDuring the year, Cominar entered into transactions with companies controlled byunitholders who are also members of the Trust’s management. These transactions,made in the normal course of business, have been measured at the exchangeamount and have been reflected in the financial statements as follows:
2007 2006 $ $
Rental revenue from income properties 990 1,178Other revenues 254 384Income properties and properties under development 11,641 14,871Deferred expenses and other assets 9,121 8,629Accounts receivable 305 473Accounts payable and accrued liabilities 7,147 8,146
49 } 20 07 A N N U A L R E P ORT
CONS OLIDAT E D F IN A NCI A L S TAT E M E N T S
18. F INANCIAL INSTRUMENTSCominar is exposed to financial risks that arise from fluctuations in interest ratesand in the credit quality of its tenants.
Interest rate riskAccounts receivable, except for the balances of sale mentioned in note 7, andaccounts payable and accrued liabilities bear no interest.
The interest rates on mortgages payable, convertible debentures and bank indeb-tedness are disclosed in notes 8, 9 and 10 respectively.
Credit riskCredit risk arises from the possibility that tenants may experience financial diffi-culty and be unable to fulfill their lease commitments. Cominar mitigates this riskvia geographic and sector diversification of its portfolio and a varied tenant mix.
Fair valueThe fair value of Cominar’s financial assets and liabilities, such as accounts recei-vable, cash and cash equivalents, bank indebtedness, accounts payable and accruedliabilities and distributions payable to unitholders, approximated the carrying valueas at December 31, 2007 due to their short-term nature or because they are basedon current market rates.
As at December 31, 2007, the fair value of mortgages payable was approximately$8,262 greater than the carrying value [$5,693 as at December 31, 2006] due tochanges in interest rates since the dates on which the individual mortgages payablewere obtained. The fair value of mortgages payable has been estimated based oncurrent market rates for mortgages of similar terms and maturities.
As at December 31, 2007, the fair value of convertible debentures exceeded theircarrying value by approximately $6,891 [$2,292 as at December 31, 2006] due tothe change in interest rates since the issuance dates. The fair value of convertibledebentures was estimated using current market rates for convertible debentureswith similar terms and maturities.
19. SEGMENTED INFORMATIONCominar’s activities include three property types located in the greater QuebecCity, Montreal and Ottawa areas. The accounting policies followed for each property type are the same as those disclosed in the significant accounting policies.
The following table indicates the financial information from continuing operationsrelated to these property types:
Industrial andOffice Retail mixed-use
properties properties properties Total Year ended December 31, 2007 $ $ $ $
Rental revenue from income properties 75,107 44,344 62,673 182,124Depreciation of income properties 16,859 5,765 12,890 35,514Net operating income(1) 43,135 25,872 40,764 109,771Income properties (amortized cost) 587,324 243,618 492,153 1,323,095
Industrial andOffice Retail mixed-use
properties properties properties Total Year ended December 31, 2006 $ $ $ $
Rental revenue from income properties 41,413 41,130 44,207 126,750Depreciation of income properties 5,256 5,047 4,958 15,261Net operating income(1) 24,820 23,651 28,580 77,051Income properties (amortized cost) 259,869 223,453 228,119 711,441
(1) Net operating income is “Operating income before the undernoted” in the statement of income.
20. DISCONTINUED OPERATIONSOn September 1, 2007, the Centre hospitalier de l’Université de Montréal (CHUM)took possession of the office property located at 300 Viger Street, in Montréal. Anotice of expropriation had been served on this property in 2006. Since the defin-itive indemnity amount has not yet been set, Cominar has not recognized any relat-ed gain or loss. (See note 22a).
On December 21, 2006, Cominar sold an industrial and mixed-use property for$3,662, the proceeds of which were received in January 2007. This amount is presented in balances of sale in note 7. A $632 gain on disposal was realized.
The following table summarizes the financial information relating to the propertysold and the property expropriated in accordance with CICA Handbook Section3475, “Disposal of Long-Lived Assets and Discontinued Operations”.

20 07 A N N U A L R E P ORT { 50
CONS OLIDAT E D F IN A NCI A L S TAT E M E N T S
2007 2006$ $
Net operating income 1,866 3,751Depreciation of income properties (618) (1,015)Interest on borrowings (1,240) (1,860)Net income 8 876Gain on disposal — 632Income from discontinued operations 8 1,508Basic net income per unit 0.000 0.044 Diluted net income per unit 0.000 0.043
21. UNUSUAL ITEMSDuring the second quarter of 2007, Cominar recorded non-recurring interest revenue amounting to $422 arising from the investment of the subscription receiptsissued in May 2007 and converted into units on June 5, 2007.
In connection with its growth strategy, Cominar incurred, in the first quarter of2006, costs totalling $554 related to its offer to acquire all the outstanding units ofthe Alexis Nihon REIT, which was not completed in 2006. These costs were recor-ded in the statement of income of the first quarter of 2006, in accordance with theprovisions of CICA Emerging Issues Committee Abstract EIC-94, which states that,in cases where the entity ceases to be engaged on a regular and ongoing basis withcompletion of the specifically identified transaction and it is not likely that activi-ties with respect to completion of the particular transaction will resume within thenext three months, the costs incurred at that date must be immediately expensed.
22. CONTINGENCIESa) An expropriation process was initiated in June 2006 by the CHUM for the property located at 300 Viger Street in Montréal, Québec.
The expropriation procedure is currently at the definitive indemnity setting stage,as a property transfer notice was served to Cominar on August 27, 2007, effectiveSeptember 1, 2007, and the Québec Administrative Court awarded Cominar, onSeptember 10, 2007, a provisional indemnity pursuant to applicable legislation.The provisional indemnity amounts to $30 million which was received during2007. The definitive indemnity will either be set by the Québec AdministrativeCourt, or it will be settled by the parties in the coming year. At this stage, it isimpossible to estimate or assess the amount of the definitive indemnity.
b) Letters of guarantee outstanding as at December 31, 2007 amount to $2,500.This amount has been given as a performance guarantee to execute requiredrepairs under mortgage agreements.
23. COMMITMENTSThe annual future payments required under emphyteutic leases, expiring between2046 and 2047, on land for two income properties having a total carrying value of$57,345, are as follows:
TotalYears ending December 31, $
2008 4762009 4762010 4862011 4912012 5262013 and thereafter 25,275
24. SUBSEQUENT EVENTOn February 29, 2008, Cominar acquired the remaining interest in industrial andmixed-use properties located in Montréal that were previously co-owned. Cominar,as a result of this acquisition transaction, is now the sole owner of these incomeproperties. The purchase price amounted to $18.3 million and the combined capi-talization rate, including Cominar’s initial interest acquired in 2007, is estimated at 6.8%.
25. COMPARATIVE FIGURESCertain 2006 figures have been reclassified to conform to the current year presentation.

51 } 20 07 A N N U A L R E P ORT
{ Corporate Information }
B o a r d o f Tr u s te e s
R O B E R T D E S P R É S , O. C . , G . O. Q . (1)(3)
Chairman of the Board of TrusteesCominar Real Estate Investment TrustCorporate Director
M I C H E L D A LL A I R E , P. E n g .President and Chief Executive OfficerCominar Real Estate Investment Trust
Y VA N C A R O N ( 1 ) ( 2 ) ( 4 )
Consultant
M E G É R A R D C O U LO M B E , Q . C . ( 2 ) ( 3 )
Senior PartnerLavery De Billy
A L A I N D A LL A I R EExecutive Vice President, OperationsCominar Real Estate Investment Trust
D I N O F U O C O ( 1 ) ( 4 )
President, Matvet Inc.
P I E R R E G I N G R A S ( 4 )
President, Placements Moras
G H I S L A I N E L A B E R G E ( 2 ) ( 3 )
Real Estate Investment Consultant
M I C H E L PA Q U E TExecutive Vice President, Legal Affairs and Secretary Cominar Real Estate Investment Trust
O f f i c e r s
M I C H E L D A LL A I R E , P . E n g .President and Chief Executive Officer
M I C H E L B E R T H E LOT, C AExecutive Vice President and Chief Financial Officer
R E N É B É R U B É , C . A p p .Vice President, Leasing - Quebec City
WA LLY C O M M I S S OVice President, Property Management - Montreal
A L A I N D A LL A I R EExecutive Vice President, Operations
A N N E - M A R I E D U B O I SVice President, Leasing - Montreal
M I C H E L L E C L E R CVice President, Property Management - Quebec City
J E A N - G U Y M O R E A UVice President, Development
R I C H A R D N O LI NVice-président, Retail
M I C H E L O U E LL E T T E , C . A p p .Executive Vice President,Acquisitions and Development
M E M I C H E L PA Q U E TExecutive Vice President,Legal Affairs and Secretary
R O G E R T U R P I NVice President, Treasurer
(1) Member of the Audit Committee(2) Member of the Compensation Committee(3) Member of the Governance and Nominating Committee(4) Member of the Investment Committee

20 07 A N N U A L R E P ORT { 52
C O M I N A R R E A L E S TAT E I N V E S T M E N T T R U S T455 Du Marais St.Quebec City (QC) CanadaG1M 3A2
Tel.: (418) 681-8151(418) COM-INAR
Fax: (418) 681-2946Toll free: 1 866 COMINAR
Email: [email protected]: www.cominar.com
LI S T I N GThe units and convertible debentures of Cominar Real Estate Investment Trust are listed on the Toronto Stock Exchange under the trading symbols“CUF.UN” and “CUF.DB”, “CUF.DB.B” and “CUF.DB.C”.
T R A N S F E R A G E N TComputershare Trust Company of Canada100 University Avenue, 9th floorToronto (ON) CanadaM5J 2Y1
Tel.: (514) 982-7555Fax: (416) 263-9394Toll free: 1 800 564-6253
Email: [email protected]
TA X A B I LI T Y O F D I S T R I B U T I O N SIn 2007, 54.6% of the distributions made by Cominar to unitholders were tax deferred.
L E G A L C O U N S E LDavies Ward Phillips & Vineberg LLP
A U D I TO R SErnst & Young LLP
A N N U A L M E E T I N G O F U N I T H O L D E R SMay 14, 200811:00 a.m.
Château Bonne EntenteChemin Sainte-FoyQuebec City (Qc)
{ Unitholder Information }
U N I T H O L D E R D I S T R I B U T I O N R E I N V E S T M E N T PL A N
Cominar Real Estate Investment Trust offers unitholders the opportunity to parti-
cipate in its Unitholder Distribution Reinvestment Plan (the “DRIP”). The DRIP
allows participants to have their monthly distributions reinvested in additional
units of Cominar. In addition, participants will be entitled to receive an addi-tional distribution equal to 5% of each cash distribution reinvested pursuantto the DRIP, which will be reinvested in additional units.
For further information about the DRIP, please refer to the DRIP section of our
website at www.cominar.com or contact us by email at [email protected] or
contact the Plan agent: Computershare Trust Company of Canada, 100 University
Avenue, 9th floor, Toronto, Ontario, Canada, M5J 2Y1, Tel.: (514) 982-7555,
Toll free: 1 800 564-6253, Fax: (416) 263-9394, Email: [email protected]
COMINAR REAL ESTATE INVESTMENT TRUST455 Du Marais St., Quebec (QC) Canada G1M 3A2
www.cominar.com