management’s responsibility for financial reportingfunds.rbcgam.com/pdf/fs/annual/rbf556_e.pdf ·...
TRANSCRIPT

The accompanying financial statements have been prepared by RBC Global Asset Management Inc. (“RBC GAM”) as manager of the
RBC GAM Investment Funds (the “Funds”) and approved by the Board of Directors of RBC GAM. We are responsible for the information contained
within the financial statements.
We have maintained appropriate procedures and controls to ensure that timely and reliable financial information is produced. The financial
statements have been prepared in compliance with International Financial Reporting Standards (“IFRS”) (and they include certain amounts that are
based on estimates and judgments). The significant accounting policies, which we believe are appropriate for the Funds, are described in Note 3
to the financial statements.
PricewaterhouseCoopers LLP, Chartered Professional Accountants, Licensed Public Accountants, have performed an independent audit of the
financial statements in accordance with IFRS. Their report is set out on the next page.
Damon G. Williams, FSA, FCIA, CFA Heidi Johnston, CPA, CAChief Executive Officer Chief Financial OfficerRBC Global Asset Management Inc. RBC GAM Funds
March 11, 2020
MANAGEMENT’S RESPONSIBILITY FOR FINANCIAL REPORTING

To the Unitholders and Trustee of
RBC FUNDS AND RBC PRIVATE POOLSRBC Canadian T-Bill FundRBC Canadian Money Market FundRBC Premium Money Market FundRBC $U.S. Money Market FundRBC Premium $U.S. Money Market FundRBC Canadian Short-Term Income FundRBC $U.S. Short-Term Corporate Bond FundRBC Monthly Income Bond FundRBC Canadian Bond Index FundRBC Canadian Government Bond Index FundRBC Bond FundRBC Vision Bond Fund RBC Global Bond FundRBC Global Bond & Currency FundRBC $U.S. Investment Grade Corporate Bond FundRBC Global Corporate Bond FundRBC High Yield Bond FundRBC $U.S. High Yield Bond FundRBC Global High Yield Bond FundRBC Strategic Income Bond FundRBC $U.S. Strategic Income Bond FundRBC Emerging Markets Foreign Exchange FundRBC Emerging Markets Bond FundRBC Emerging Markets Bond Fund (CAD Hedged)BlueBay Global Monthly Income Bond FundBlueBay Global Sovereign Bond Fund (Canada)BlueBay Global Investment Grade Corporate Bond Fund (Canada)BlueBay European High Yield Bond Fund (Canada)BlueBay Emerging Markets Bond Fund (Canada)BlueBay Emerging Markets Local Currency Bond Fund (Canada)BlueBay Emerging Markets Corporate Bond FundBlueBay Global Convertible Bond Fund (Canada)BlueBay $U.S. Global Convertible Bond Fund (Canada)RBC Conservative Bond PoolRBC Core Bond Pool RBC Core Plus Bond PoolRBC Managed Payout SolutionRBC Managed Payout Solution – EnhancedRBC Managed Payout Solution – Enhanced PlusRBC Monthly Income FundRBC U.S. Monthly Income Fund RBC Balanced FundRBC Global Balanced FundRBC Vision Balanced FundRBC Emerging Markets Balanced FundRBC Conservative Growth & Income FundRBC Balanced Growth & Income FundRBC Global Growth & Income FundRBC Select Very Conservative PortfolioRBC Select Conservative PortfolioRBC Select Balanced Portfolio RBC Select Growth PortfolioRBC Select Aggressive Growth PortfolioRBC Select Choices Conservative PortfolioRBC Select Choices Balanced PortfolioRBC Select Choices Growth PortfolioRBC Select Choices Aggressive Growth PortfolioRBC Global Very Conservative PortfolioRBC Global Conservative PortfolioRBC Global Balanced PortfolioRBC Global Growth PortfolioRBC Global All-Equity Portfolio RBC Retirement Income SolutionRBC Retirement 2020 PortfolioRBC Retirement 2025 PortfolioRBC Retirement 2030 PortfolioRBC Retirement 2035 PortfolioRBC Retirement 2040 Portfolio
RBC Retirement 2045 PortfolioRBC Retirement 2050 PortfolioRBC Target 2020 Education FundRBC Target 2025 Education FundRBC Target 2030 Education FundRBC Target 2035 Education FundRBC Canadian Dividend FundRBC Canadian Equity FundRBC QUBE Canadian Equity FundRBC QUBE Low Volatility Canadian Equity FundRBC Trend Canadian Equity FundRBC Vision Canadian Equity FundRBC Canadian Index FundRBC O’Shaughnessy Canadian Equity FundRBC O’Shaughnessy All-Canadian Equity FundRBC Canadian Equity Income FundRBC Canadian Small & Mid-Cap Resources FundRBC North American Value FundRBC North American Growth FundRBC U.S. Dividend FundRBC U.S. Dividend Currency Neutral FundRBC U.S. Equity Fund RBC U.S. Equity Currency Neutral FundRBC QUBE U.S. Equity FundRBC QUBE Low Volatility U.S. Equity FundRBC QUBE Low Volatility U.S. Equity Currency Neutral FundRBC U.S. Equity Value FundRBC U.S. Index FundRBC U.S. Index Currency Neutral FundRBC O’Shaughnessy U.S. Value Fund (Unhedged)RBC O’Shaughnessy U.S. Value FundRBC U.S. Mid-Cap Growth Equity FundRBC U.S. Mid-Cap Growth Equity Currency Neutral Fund RBC U.S. Mid-Cap Value Equity FundRBC U.S. Small-Cap Core Equity FundRBC U.S. Small-Cap Value Equity FundRBC O’Shaughnessy U.S. Growth FundRBC O’Shaughnessy U.S. Growth Fund IIRBC Life Science and Technology FundRBC International Dividend Growth FundRBC International Equity FundRBC International Equity Currency Neutral FundRBC International Index Currency Neutral FundRBC O’Shaughnessy International Equity FundRBC European Dividend FundRBC European Equity FundRBC European Mid-Cap Equity FundRBC Asian Equity FundRBC Asia Pacific ex-Japan Equity FundRBC Japanese Equity FundRBC Emerging Markets Multi-Strategy Equity FundRBC Emerging Markets Dividend FundRBC Emerging Markets Equity FundRBC Emerging Markets Equity Focus FundRBC Emerging Markets Small-Cap Equity FundRBC Global Dividend Growth FundRBC Global Dividend Growth Currency Neutral FundRBC Global Equity FundRBC Global Equity Focus FundRBC Global Equity Focus Currency Neutral FundRBC QUBE Global Equity FundRBC QUBE Low Volatility Global Equity FundRBC QUBE Low Volatility Global Equity Currency Neutral FundRBC Vision Global Equity FundRBC Vision Fossil Fuel Free Global Equity Fund RBC O’Shaughnessy Global Equity FundRBC QUBE All Country World Equity FundRBC QUBE Low Volatility All Country World Equity FundRBC Global Energy FundRBC Global Precious Metals FundRBC Global Resources Fund
RBC Global Technology FundRBC Private Short-Term Income PoolRBC Private Canadian Corporate Bond PoolRBC Private Income PoolRBC Private Canadian Dividend PoolRBC Private Fundamental Canadian Equity Pool (formerly, RBC Private Canadian Growth and Income Equity Pool)RBC Private Canadian Equity PoolRBC Private Canadian Growth Equity PoolRBC Private Canadian Mid-Cap Equity PoolRBC Private U.S. Large-Cap Value Equity Pool RBC Private U.S. Large-Cap Value Equity Currency Neutral PoolRBC Private U.S. Growth Equity PoolRBC Private U.S. Large-Cap Core Equity Pool RBC Private U.S. Large-Cap Core Equity Currency Neutral PoolRBC Private U.S. Small-Cap Equity PoolRBC Private EAFE Equity PoolRBC Private Overseas Equity PoolRBC Private World Equity Pool
PH&N FUNDSPhillips, Hager & North Canadian Money Market FundPhillips, Hager & North $U.S. Money Market FundPhillips, Hager & North Short Term Bond & Mortgage FundPhillips, Hager & North Bond FundPhillips, Hager & North Total Return Bond FundPhillips, Hager & North Inflation-Linked Bond FundPhillips, Hager & North High Yield Bond FundPhillips, Hager & North Long Inflation-linked Bond FundPhillips, Hager & North Monthly Income FundPhillips, Hager & North Balanced FundPhillips, Hager & North Dividend Income FundPhillips, Hager & North Canadian Equity FundPhillips, Hager & North Canadian Equity Value FundPhillips, Hager & North Canadian Equity Underlying FundPhillips, Hager & North Canadian Equity Underlying Fund IIPhillips, Hager & North Canadian Growth Fund Phillips, Hager & North Canadian Income FundPhillips, Hager & North Vintage FundPhillips, Hager & North U.S. Dividend Income FundPhillips, Hager & North U.S. Multi-Style All-Cap Equity FundPhillips, Hager & North U.S. Equity FundPhillips, Hager & North Currency-Hedged U.S. Equity FundPhillips, Hager & North U.S. Growth Fund Phillips, Hager & North Overseas Equity FundPhillips, Hager & North Currency-Hedged Overseas Equity FundPhillips, Hager & North Global Equity FundPhillips, Hager & North LifeTime 2015 Fund Phillips, Hager & North LifeTime 2020 FundPhillips, Hager & North LifeTime 2025 FundPhillips, Hager & North LifeTime 2030 FundPhillips, Hager & North LifeTime 2035 FundPhillips, Hager & North LifeTime 2040 FundPhillips, Hager & North LifeTime 2045 FundPhillips, Hager & North LifeTime 2050 FundPhillips, Hager & North LifeTime 2055 FundPhillips, Hager & North Conservative Pension Trust Phillips, Hager & North Balanced Pension TrustPhillips, Hager & North Growth Pension Trust Phillips, Hager & North Conservative Equity Income FundPhillips, Hager & North Canadian Equity Pension TrustPhillips, Hager & North Small Float FundPhillips, Hager & North Canadian Equity Plus Pension Trust
(individually, a Fund)
INDEPENDENT AUDITOR’S REPORT

Our opinionIn our opinion, the accompanying December 31, 2019 financial statements of each Fund present fairly, in all material respects, the financial
position of each Fund, its financial performance and its cash flows as at and for the periods indicated in note 2 in accordance with International
Financial Reporting Standards (IFRS).
What we have auditedThe financial statements of each Fund comprise:
• the statements of financial position as at the period-end dates indicated in note 2;
• the statements of comprehensive income for the periods indicated in note 2;
• the statements of cash flow for the periods indicated in note 2;
• the statements of changes in net assets attributable to holders of redeemable units (NAV) for the periods indicated in note 2; and
• the notes to the financial statements, which include a summary of significant accounting policies.
Basis for opinionWe conducted our audit in accordance with Canadian generally accepted auditing standards. Our responsibilities under those standards are
further described in the Auditor’s responsibilities for the audit of the financial statements section of our report.
We believe that the audit evidence we have obtained is sufficient and appropriate to provide a basis for our opinion.
IndependenceWe are independent of each Fund in accordance with the ethical requirements that are relevant to our audit of the financial statements in
Canada. We have fulfilled our other ethical responsibilities in accordance with these requirements.
Other informationManagement is responsible for the other information of each Fund. The other information comprises the 2019 Annual Management Report of
Fund Performance of each Fund.
Our opinion on the financial statements does not cover the other information and we do not express any form of assurance conclusion thereon.
In connection with our audit of the financial statements of each Fund, our responsibility is to read the other information identified above and,
in doing so, consider whether the other information is materially inconsistent with the financial statements of each Fund or our knowledge
obtained in the audit, or otherwise appears to be materially misstated.
If, based on the work we have performed, we conclude that there is a material misstatement of this other information, we are required to report
that fact. We have nothing to report in this regard.
Responsibilities of management and those charged with governance for the financial statementsManagement is responsible for the preparation and fair presentation of the financial statements of each Fund in accordance with IFRS, and
for such internal control as management determines is necessary to enable the preparation of financial statements that are free from material
misstatement, whether due to fraud or error.
In preparing the financial statements, management is responsible for assessing the ability of each Fund to continue as a going concern,
disclosing, as applicable, matters related to going concern and using the going concern basis of accounting unless management either intends
to liquidate any Fund or to cease operations, or has no realistic alternative but to do so.
Those charged with governance are responsible for overseeing the financial reporting process of each Fund.
INDEPENDENT AUDITOR’S REPORT
Auditor’s responsibilities for the audit of the financial statementsOur objectives are to obtain reasonable assurance about whether the financial statements as a whole for each Fund are free from material
misstatement, whether due to fraud or error, and to issue an auditor’s report that includes our opinion. Reasonable assurance is a high level of
assurance, but is not a guarantee that an audit conducted in accordance with Canadian generally accepted auditing standards will always detect a
material misstatement when it exists. Misstatements can arise from fraud or error and are considered material if, individually or in the aggregate,
they could reasonably be expected to influence the economic decisions of users taken on the basis of the financial statements of each Fund.
As part of an audit in accordance with Canadian generally accepted auditing standards, we exercise professional judgment and maintain
professional skepticism throughout the audit. We also:
• Identify and assess the risks of material misstatement of the financial statements of each Fund, whether due to fraud or error, design and
perform audit procedures responsive to those risks, and obtain audit evidence that is sufficient and appropriate to provide a basis for our
opinion. The risk of not detecting a material misstatement resulting from fraud is higher than for one resulting from error, as fraud may
involve collusion, forgery, intentional omissions, misrepresentations, or the override of internal control.
• Obtain an understanding of internal control relevant to the audit in order to design audit procedures that are appropriate in the
circumstances, but not for the purpose of expressing an opinion on the effectiveness of the internal control of each Fund.
• Evaluate the appropriateness of accounting policies used and the reasonableness of accounting estimates and related disclosures made
by management.
• Conclude on the appropriateness of management’s use of the going concern basis of accounting and, based on the audit evidence
obtained, whether a material uncertainty exists related to events or conditions that may cast significant doubt on the ability of each Fund
to continue as a going concern. If we conclude that a material uncertainty exists, we are required to draw attention in our auditor’s report
to the related disclosures in the financial statements of each Fund or, if such disclosures are inadequate, to modify our opinion. Our
conclusions are based on the audit evidence obtained up to the date of our auditor’s report. However, future events or conditions may
cause any Fund to cease to continue as a going concern.
• Evaluate the overall presentation, structure and content of the financial statements of each Fund, including the disclosures, and whether
the financial statements represent the underlying transactions and events in a manner that achieves fair presentation.
We communicate with those charged with governance regarding, among other matters, the planned scope and timing of the audit and
significant audit findings, including any significant deficiencies in internal control that we identify during our audit.
Chartered Professional Accountants, Licensed Public Accountants
Toronto, OntarioMarch 11, 2020
INDEPENDENT AUDITOR’S REPORT
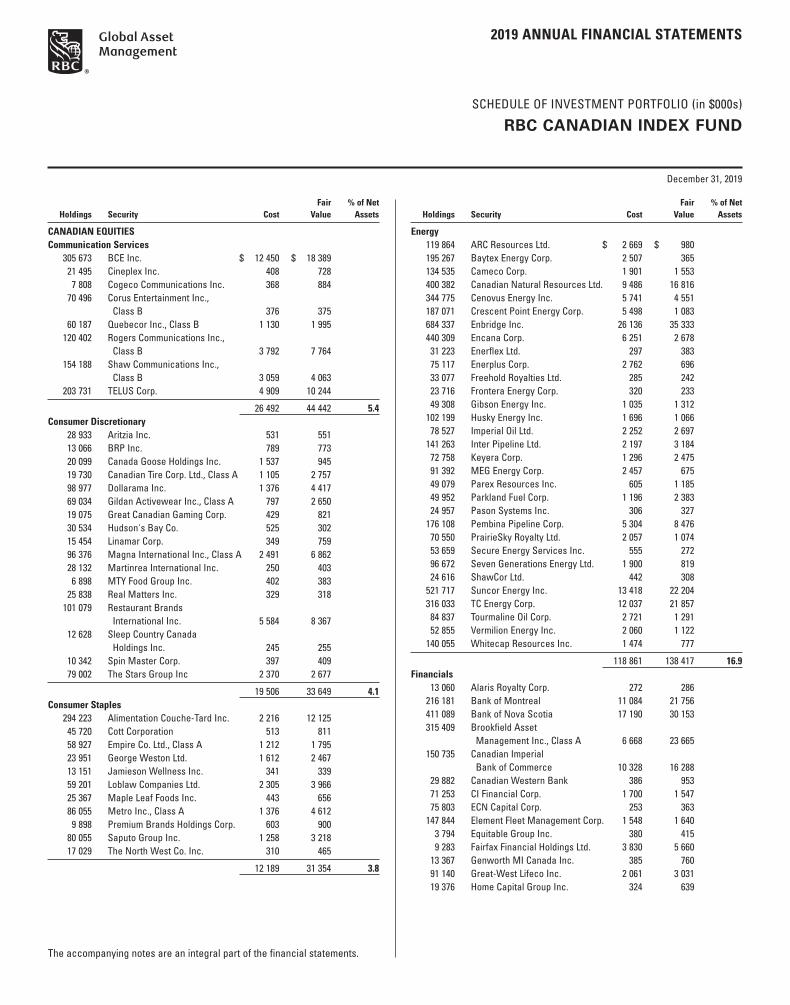
SCHEDULE OF INVESTMENT PORTFOLIO (in $000s)
SCHEDULE OF INVESTMENT PORTFOLIO (in $000s)
2019 ANNUAL FINANCIAL STATEMENTS
December 31, 2019
The accompanying notes are an integral part of the financial statements.
RBC CANADIAN INDEX FUND
Fair % of Net Holdings Security Cost Value Assets
CANADIAN EQUITIESCommunication Services 305 673 BCE Inc. $ 12 450 $ 18 389 21 495 Cineplex Inc. 408 728 7 808 Cogeco Communications Inc. 368 884 70 496 Corus Entertainment Inc.,
Class B 376 375 60 187 Quebecor Inc., Class B 1 130 1 995 120 402 Rogers Communications Inc.,
Class B 3 792 7 764 154 188 Shaw Communications Inc.,
Class B 3 059 4 063 203 731 TELUS Corp. 4 909 10 244
26 492 44 442 5.4Consumer Discretionary 28 933 Aritzia Inc. 531 551 13 066 BRP Inc. 789 773 20 099 Canada Goose Holdings Inc. 1 537 945 19 730 Canadian Tire Corp. Ltd., Class A 1 105 2 757 98 977 Dollarama Inc. 1 376 4 417 69 034 Gildan Activewear Inc., Class A 797 2 650 19 075 Great Canadian Gaming Corp. 429 821 30 534 Hudson's Bay Co. 525 302 15 454 Linamar Corp. 349 759 96 376 Magna International Inc., Class A 2 491 6 862 28 132 Martinrea International Inc. 250 403 6 898 MTY Food Group Inc. 402 383 25 838 Real Matters Inc. 329 318 101 079 Restaurant Brands
International Inc. 5 584 8 367 12 628 Sleep Country Canada
Holdings Inc. 245 255 10 342 Spin Master Corp. 397 409 79 002 The Stars Group Inc 2 370 2 677
19 506 33 649 4.1Consumer Staples 294 223 Alimentation Couche-Tard Inc. 2 216 12 125 45 720 Cott Corporation 513 811 58 927 Empire Co. Ltd., Class A 1 212 1 795 23 951 George Weston Ltd. 1 612 2 467 13 151 Jamieson Wellness Inc. 341 339 59 201 Loblaw Companies Ltd. 2 305 3 966 25 367 Maple Leaf Foods Inc. 443 656 86 055 Metro Inc., Class A 1 376 4 612 9 898 Premium Brands Holdings Corp. 603 900 80 055 Saputo Group Inc. 1 258 3 218 17 029 The North West Co. Inc. 310 465
12 189 31 354 3.8
Fair % of Net Holdings Security Cost Value Assets
Energy 119 864 ARC Resources Ltd. $ 2 669 $ 980 195 267 Baytex Energy Corp. 2 507 365 134 535 Cameco Corp. 1 901 1 553 400 382 Canadian Natural Resources Ltd. 9 486 16 816 344 775 Cenovus Energy Inc. 5 741 4 551 187 071 Crescent Point Energy Corp. 5 498 1 083 684 337 Enbridge Inc. 26 136 35 333 440 309 Encana Corp. 6 251 2 678 31 223 Enerflex Ltd. 297 383 75 117 Enerplus Corp. 2 762 696 33 077 Freehold Royalties Ltd. 285 242 23 716 Frontera Energy Corp. 320 233 49 308 Gibson Energy Inc. 1 035 1 312 102 199 Husky Energy Inc. 1 696 1 066 78 527 Imperial Oil Ltd. 2 252 2 697 141 263 Inter Pipeline Ltd. 2 197 3 184 72 758 Keyera Corp. 1 296 2 475 91 392 MEG Energy Corp. 2 457 675 49 079 Parex Resources Inc. 605 1 185 49 952 Parkland Fuel Corp. 1 196 2 383 24 957 Pason Systems Inc. 306 327 176 108 Pembina Pipeline Corp. 5 304 8 476 70 550 PrairieSky Royalty Ltd. 2 057 1 074 53 659 Secure Energy Services Inc. 555 272 96 672 Seven Generations Energy Ltd. 1 900 819 24 616 ShawCor Ltd. 442 308 521 717 Suncor Energy Inc. 13 418 22 204 316 033 TC Energy Corp. 12 037 21 857 84 837 Tourmaline Oil Corp. 2 721 1 291 52 855 Vermilion Energy Inc. 2 060 1 122 140 055 Whitecap Resources Inc. 1 474 777
118 861 138 417 16.9Financials 13 060 Alaris Royalty Corp. 272 286 216 181 Bank of Montreal 11 084 21 756 411 089 Bank of Nova Scotia 17 190 30 153 315 409 Brookfield Asset
Management Inc., Class A 6 668 23 665 150 735 Canadian Imperial
Bank of Commerce 10 328 16 288 29 882 Canadian Western Bank 386 953 71 253 CI Financial Corp. 1 700 1 547 75 803 ECN Capital Corp. 253 363 147 844 Element Fleet Management Corp. 1 548 1 640 3 794 Equitable Group Inc. 380 415 9 283 Fairfax Financial Holdings Ltd. 3 830 5 660 13 367 Genworth MI Canada Inc. 385 760 91 140 Great-West Lifeco Inc. 2 061 3 031 19 376 Home Capital Group Inc. 324 639
SCHEDULE OF INVESTMENT PORTFOLIO (in $000s)
December 31, 2019
The accompanying notes are an integral part of the financial statements.
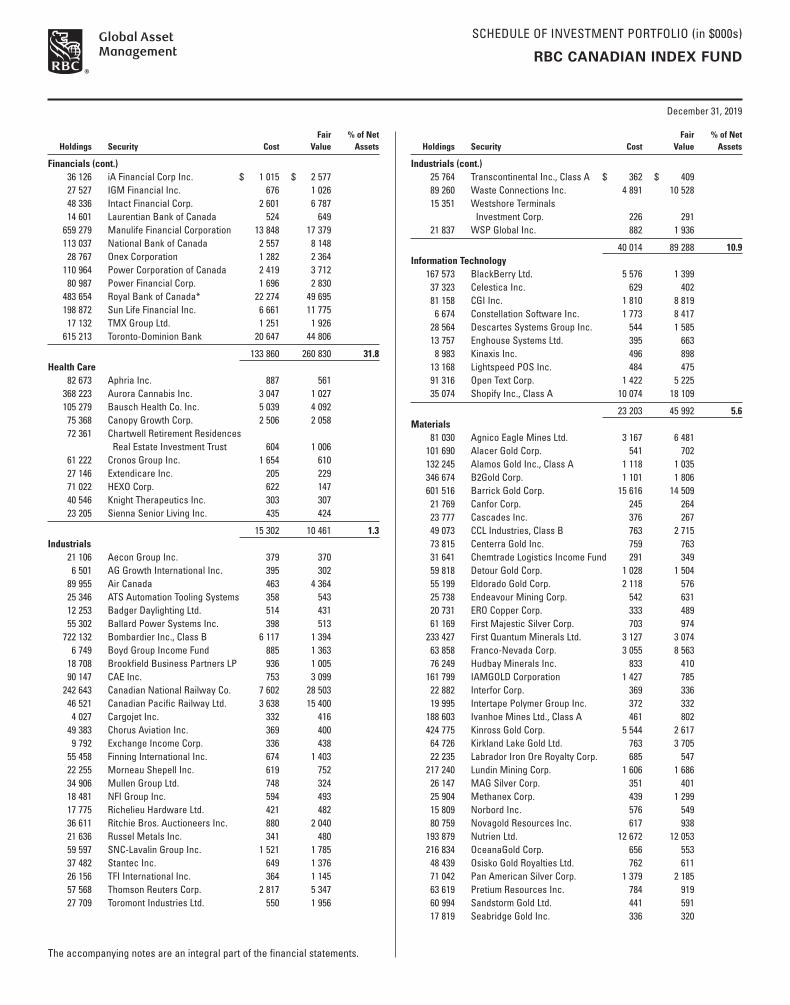
SCHEDULE OF INVESTMENT PORTFOLIO (in $000s)
RBC CANADIAN INDEX FUND
Fair % of Net Holdings Security Cost Value Assets
Financials (cont.) 36 126 iA Financial Corp Inc. $ 1 015 $ 2 577 27 527 IGM Financial Inc. 676 1 026 48 336 Intact Financial Corp. 2 601 6 787 14 601 Laurentian Bank of Canada 524 649 659 279 Manulife Financial Corporation 13 848 17 379 113 037 National Bank of Canada 2 557 8 148 28 767 Onex Corporation 1 282 2 364 110 964 Power Corporation of Canada 2 419 3 712 80 987 Power Financial Corp. 1 696 2 830 483 654 Royal Bank of Canada* 22 274 49 695 198 872 Sun Life Financial Inc. 6 661 11 775 17 132 TMX Group Ltd. 1 251 1 926 615 213 Toronto-Dominion Bank 20 647 44 806
133 860 260 830 31.8Health Care 82 673 Aphria Inc. 887 561 368 223 Aurora Cannabis Inc. 3 047 1 027 105 279 Bausch Health Co. Inc. 5 039 4 092 75 368 Canopy Growth Corp. 2 506 2 058 72 361 Chartwell Retirement Residences
Real Estate Investment Trust 604 1 006 61 222 Cronos Group Inc. 1 654 610 27 146 Extendicare Inc. 205 229 71 022 HEXO Corp. 622 147 40 546 Knight Therapeutics Inc. 303 307 23 205 Sienna Senior Living Inc. 435 424
15 302 10 461 1.3Industrials 21 106 Aecon Group Inc. 379 370 6 501 AG Growth International Inc. 395 302 89 955 Air Canada 463 4 364 25 346 ATS Automation Tooling Systems 358 543 12 253 Badger Daylighting Ltd. 514 431 55 302 Ballard Power Systems Inc. 398 513 722 132 Bombardier Inc., Class B 6 117 1 394 6 749 Boyd Group Income Fund 885 1 363 18 708 Brookfield Business Partners LP 936 1 005 90 147 CAE Inc. 753 3 099 242 643 Canadian National Railway Co. 7 602 28 503 46 521 Canadian Pacific Railway Ltd. 3 638 15 400 4 027 Cargojet Inc. 332 416 49 383 Chorus Aviation Inc. 369 400 9 792 Exchange Income Corp. 336 438 55 458 Finning International Inc. 674 1 403 22 255 Morneau Shepell Inc. 619 752 34 906 Mullen Group Ltd. 748 324 18 481 NFI Group Inc. 594 493 17 775 Richelieu Hardware Ltd. 421 482 36 611 Ritchie Bros. Auctioneers Inc. 880 2 040 21 636 Russel Metals Inc. 341 480 59 597 SNC-Lavalin Group Inc. 1 521 1 785 37 482 Stantec Inc. 649 1 376 26 156 TFI International Inc. 364 1 145 57 568 Thomson Reuters Corp. 2 817 5 347 27 709 Toromont Industries Ltd. 550 1 956
Fair % of Net Holdings Security Cost Value Assets
Industrials (cont.) 25 764 Transcontinental Inc., Class A $ 362 $ 409 89 260 Waste Connections Inc. 4 891 10 528 15 351 Westshore Terminals
Investment Corp. 226 291 21 837 WSP Global Inc. 882 1 936
40 014 89 288 10.9Information Technology 167 573 BlackBerry Ltd. 5 576 1 399 37 323 Celestica Inc. 629 402 81 158 CGI Inc. 1 810 8 819 6 674 Constellation Software Inc. 1 773 8 417 28 564 Descartes Systems Group Inc. 544 1 585 13 757 Enghouse Systems Ltd. 395 663 8 983 Kinaxis Inc. 496 898 13 168 Lightspeed POS Inc. 484 475 91 316 Open Text Corp. 1 422 5 225 35 074 Shopify Inc., Class A 10 074 18 109
23 203 45 992 5.6Materials 81 030 Agnico Eagle Mines Ltd. 3 167 6 481 101 690 Alacer Gold Corp. 541 702 132 245 Alamos Gold Inc., Class A 1 118 1 035 346 674 B2Gold Corp. 1 101 1 806 601 516 Barrick Gold Corp. 15 616 14 509 21 769 Canfor Corp. 245 264 23 777 Cascades Inc. 376 267 49 073 CCL Industries, Class B 763 2 715 73 815 Centerra Gold Inc. 759 763 31 641 Chemtrade Logistics Income Fund 291 349 59 818 Detour Gold Corp. 1 028 1 504 55 199 Eldorado Gold Corp. 2 118 576 25 738 Endeavour Mining Corp. 542 631 20 731 ERO Copper Corp. 333 489 61 169 First Majestic Silver Corp. 703 974 233 427 First Quantum Minerals Ltd. 3 127 3 074 63 858 Franco-Nevada Corp. 3 055 8 563 76 249 Hudbay Minerals Inc. 833 410 161 799 IAMGOLD Corporation 1 427 785 22 882 Interfor Corp. 369 336 19 995 Intertape Polymer Group Inc. 372 332 188 603 Ivanhoe Mines Ltd., Class A 461 802 424 775 Kinross Gold Corp. 5 544 2 617 64 726 Kirkland Lake Gold Ltd. 763 3 705 22 235 Labrador Iron Ore Royalty Corp. 685 547 217 240 Lundin Mining Corp. 1 606 1 686 26 147 MAG Silver Corp. 351 401 25 904 Methanex Corp. 439 1 299 15 809 Norbord Inc. 576 549 80 759 Novagold Resources Inc. 617 938 193 879 Nutrien Ltd. 12 672 12 053 216 834 OceanaGold Corp. 656 553 48 439 Osisko Gold Royalties Ltd. 762 611 71 042 Pan American Silver Corp. 1 379 2 185 63 619 Pretium Resources Inc. 784 919 60 994 Sandstorm Gold Ltd. 441 591 17 819 Seabridge Gold Inc. 336 320

SCHEDULE OF INVESTMENT PORTFOLIO (in $000s)
December 31, 2019
The accompanying notes are an integral part of the financial statements.
SCHEDULE OF INVESTMENT PORTFOLIO (in $000s)
RBC CANADIAN INDEX FUND
Fair % of Net Holdings Security Cost Value Assets
Materials (cont.) 117 502 Semafo Inc. $ 565 $ 317 60 006 Silvercorp Metals Inc. 350 440 41 673 SSR Mining Inc. 850 1 041 20 451 Stella-Jones Inc. 912 767 164 852 Teck Resources Ltd., Class B 3 347 3 712 29 589 Torex Gold Resources Inc. 520 607 46 549 Wesdome Gold Mines Ltd. 280 473 17 133 West Fraser Timber Co. Ltd. 619 981 151 143 Wheaton Precious Metals Corp. 2 764 5 840 10 635 Winpak Ltd. 505 500 322 612 Yamana Gold Inc. 2 642 1 658
79 310 92 677 11.3Real Estate 39 487 Allied Properties Real Estate
Investment Trust 1 008 2 056 13 576 Altus Group Ltd. 371 515 42 609 Artis Real Estate Investment Trust 385 507 12 684 Boardwalk Real Estate
Investment Trust 272 583 119 260 Brookfield Property Partners LP 3 319 2 830 53 830 Canadian Apartment Properties
Real Estate Investment Trust 904 2 854 87 269 Choice Properties Real Estate
Investment Trust 1 066 1 214 9 734 Colliers International Group Inc. 313 984 61 606 Cominar Real Estate
Investment Trust 863 872 30 333 Crombie Real Estate
Investment Trust 430 484 23 125 CT Real Estate Investment Trust 369 373 36 584 Dream Industrial Real Estate
Investment Trust 431 481 15 971 Dream Office Real Estate
Investment Trust 322 497 58 790 First Capital Real Estate
Investment Trust 1 045 1 215 11 056 FirstService Corp. 264 1 337 16 776 Granite Real Estate
Investment Trust 654 1 107 97 139 H&R Real Estate Investment Trust 1 767 2 050 41 082 InterRent Real Estate
Investment Trust 588 643 30 895 Killam Apartment Real Estate
Investment Trust 589 585 20 804 Northview Apartment Real Estate
Investment Trust 500 617 37 801 NorthWest Healthcare Properties
Real Estate Investment Trust 432 451 103 387 RioCan Real Estate
Investment Trust 1 860 2 767 43 189 SmartCentres Real Estate
Investment Trust 925 1 348 38 866 Summit Industrial Income
Real Estate Investment Trust 459 469 49 900 Tricon Capital Group Inc. 542 530
19 678 27 369 3.3
Fair % of Net Holdings Security Cost Value Assets
Utilities 177 372 Algonquin Power &
Utilities Corp. $ 1 974 $ 3 258 94 162 AltaGas Ltd. 2 471 1 863 25 156 Atco Ltd., Class I, Non-Voting 494 1 252 25 068 Boralex Inc., Class A 483 613 99 178 Brookfield Infrastructure
Partners LP 5 552 6 433 41 849 Brookfield Renewable Partners LP 1 772 2 523 40 643 Canadian Utilities Ltd., Class A 756 1 592 35 808 Capital Power Corp. 898 1 231 81 286 Emera Inc. 2 533 4 535 146 812 Fortis Inc. 4 818 7 910 103 129 Hydro One Ltd. 2 419 2 586 43 346 Innergex Renewable Energy Inc. 510 731 53 606 Northland Power Inc. 963 1 458 59 105 Superior Plus Corp. 736 742 95 795 TransAlta Corp. 1 794 889 35 808 TransAlta Renewables Inc. 456 556
28 629 38 172 4.7TOTAL CANADIAN EQUITIES 517 044 812 651 99.1UNDERLYING FUNDS 178 552 iShares Core S&P/TSX
Capped Composite Index ETF 4 811 4 844
TOTAL UNDERLYING FUNDS 4 811 4 844 0.6TOTAL INVESTMENTS $ 521 855 817 495 99.7OTHER NET ASSETS ATTRIBUTABLE TO HOLDERS OF REDEEMABLE UNITS 2 356 0.3NET ASSETS ATTRIBUTABLE TO HOLDERS OF REDEEMABLE UNITS $ 819 851 100.0
* Investment in related party (see note 8 in the generic notes).

FINANCIAL STATEMENTS
The accompanying notes are an integral part of these financial statements.
SCHEDULE OF INVESTMENT PORTFOLIO (in $000s)
RBC CANADIAN INDEX FUND
Statements of Financial Position (in $000s except per unit amounts)
(see note 2 in the generic notes)December 31
2019December 31
2018
ASSETSInvestments at fair value $ 817 495 $ 681 355Cash 801 2 048Due from investment dealers 1 045 6 119Subscriptions receivable 682 759Dividends receivable, interest accrued and other assets 1 893 2 187TOTAL ASSETS 821 916 692 468LIABILITIESDue to investment dealers 1 060 5 968Redemptions payable 541 2 402Distributions payable 6 –Accounts payable and accrued expenses 458 382TOTAL LIABILITIES EXCLUDING NET ASSETS ATTRIBUTABLE TO HOLDERS OF REDEEMABLE UNITS 2 065 8 752NET ASSETS ATTRIBUTABLE TO HOLDERS OF REDEEMABLE UNITS (“NAV”) $ 819 851 $ 683 716
Investments at cost $ 521 855 $ 503 780
NAV SERIES A $ 777 599 $ 663 165 SERIES F $ 42 238 $ 20 551 SERIES O $ 14 $ –NAV PER UNIT SERIES A $ 31.83 $ 26.83 SERIES F $ 11.77 $ 9.93 SERIES O $ 10.19 $ –
Statements of Comprehensive Income (in $000s except per unit amounts)
For the periods ended December 31 (see note 2 in the generic notes) 2019 2018
INCOME (see note 3 in the generic notes)Dividends $ 23 218 $ 23 584Interest for distribution purposes 10 9Income from investment trusts 886 471Net realized gain (loss) on investments 9 180 23 028Change in unrealized gain (loss) on investments 118 065 (113 007)TOTAL NET GAIN (LOSS) ON INVESTMENTS AND DERIVATIVES 151 359 (65 915)Securities lending revenue (see note 7 in the generic notes) 727 287Net gain (loss) on foreign cash balances 8 3TOTAL OTHER INCOME (LOSS) 735 290TOTAL INCOME (LOSS) 152 094 (65 625)EXPENSES (see notes – Fund Specific Information)Management fees 3 779 3 685Administration fees 784 755Independent Review Committee costs 2 2GST/HST 476 465Transaction costs 64 22TOTAL EXPENSES 5 105 4 929INCREASE (DECREASE) IN NAV $ 146 989 $ (70 554)INCREASE (DECREASE) IN NAV SERIES A $ 141 527 $ (68 728) SERIES F $ 5 462 $ (1 826) SERIES O $ – $ –INCREASE (DECREASE) IN NAV PER UNIT SERIES A $ 5.78 $ (2.79) SERIES F $ 1.99 $ (1.18) SERIES O $ 1.06 $ –

FINANCIAL STATEMENTS
The accompanying notes are an integral part of these financial statements.
Statements of Cash Flow (in $000s)
For the periods ended December 31 (see note 2 in the generic notes) 2019 2018
CASH FLOWS FROM OPERATING ACTIVITIESIncrease (decrease) in NAV $ 146 989 $ (70 554)ADJUSTMENTS TO RECONCILE NET CASH PROVIDED BY (USED IN) OPERATIONSInterest for distribution purposes – –Non-cash distributions from underlying funds – –Net realized loss (gain) on investments (9 180) (22 980)Change in unrealized loss (gain) on investments (118 065) 113 007(Increase) decrease in accrued receivables 294 (212)Increase (decrease) in accrued payables 76 (52)(Increase) decrease in margin accounts – –Cost of investments purchased* (125 071) (58 227)Proceeds from sale and maturity of investments* 116 342 68 282NET CASH PROVIDED BY (USED IN) OPERATING ACTIVITIES 11 385 29 264CASH FLOWS FROM FINANCING ACTIVITIESProceeds from issue of redeemable units* 119 267 93 107Cash paid on redemption of redeemable units* (131 410) (121 093)Distributions paid to holders of redeemable units (489) (398)NET CASH PROVIDED BY (USED IN) FINANCING ACTIVITIES $ (12 632) $ (28 384)Net increase (decrease) in cash for the period (1 247) 880Cash (bank overdraft), beginning of period 2 048 1 168CASH (BANK OVERDRAFT), END OF PERIOD $ 801 $ 2 048
Interest received (paid)† $ 10 $ 9Income received from investment trusts† $ 839 $ 466Dividends received, net of withholding taxes† $ 23 559 $ 23 377
* Excludes in-kind transactions.† Classified as part of operating activities.
RBC CANADIAN INDEX FUND

FINANCIAL STATEMENTS
The accompanying notes are an integral part of these financial statements.
RBC CANADIAN INDEX FUND
Statements of Changes in NAV (in $000s)
For the periods ended December 31 (see note 2 in the generic notes)
Series A Series F Series O Total2019 2018 2019 2018 2019 2018 2019 2018
NAV AT BEGINNING OF PERIOD $ 663 165 $ 773 029 $ 20 551 $ 11 234 $ – $ – $ 683 716 $ 784 263INCREASE (DECREASE) IN NAV 141 527 (68 728) 5 462 (1 826) – – 146 989 (70 554)Early redemption fees 1 2 – – – – 1 2Proceeds from redeemable units issued 106 017 90 328 22 714 14 534 14 – 128 745 104 862Reinvestments of distributions to holders of redeemable units 17 774 16 934 949 517 – – 18 723 17 451Redemption of redeemable units (132 860) (131 209) (6 245) (3 250) – – (139 105) (134 459)NET INCREASE (DECREASE) FROM REDEEMABLE UNIT TRANSACTIONS (9 068) (23 945) 17 418 11 801 14 – 8 364 (12 144)Distributions from net income (18 025) (17 191) (1 193) (658) – – (19 218) (17 849)Distributions from net gains – – – – – – – –Distributions from capital – – – – – – – –TOTAL DISTRIBUTIONS TO HOLDERS OF REDEEMABLE UNITS (18 025) (17 191) (1 193) (658) – – (19 218) (17 849)NET INCREASE (DECREASE) IN NAV 114 434 (109 864) 21 687 9 317 14 – 136 135 (100 547)NAV AT END OF PERIOD $ 777 599 $ 663 165 $ 42 238 $ 20 551 $ 14 $ – $ 819 851 $ 683 716

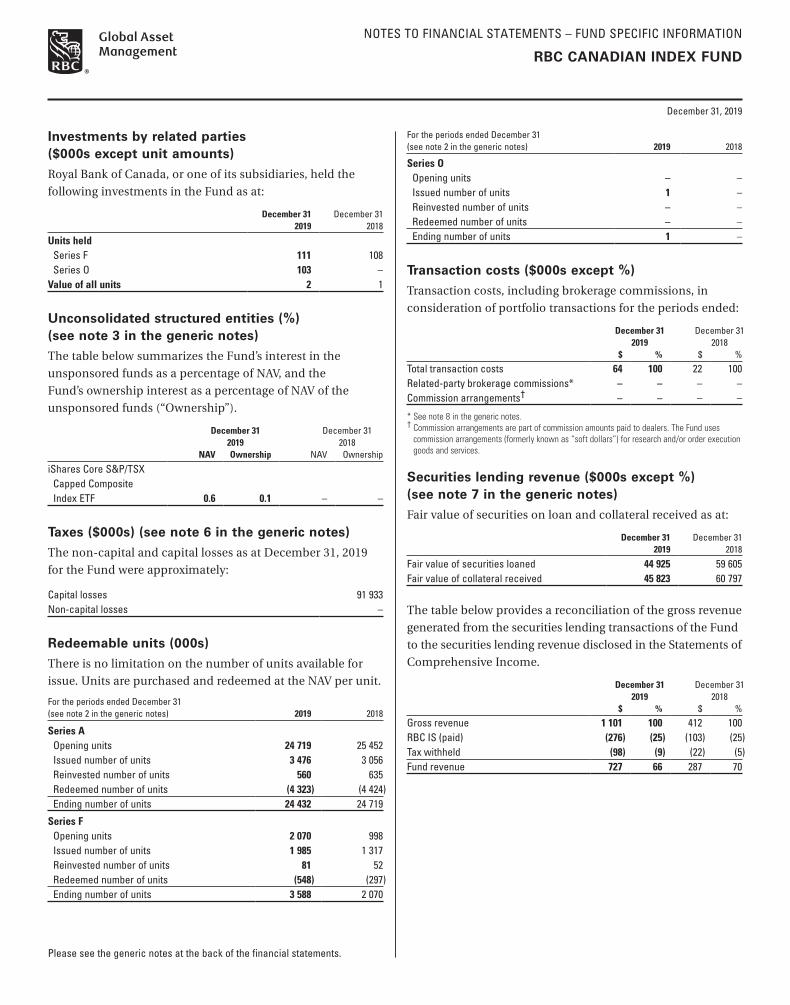
NOTES TO FINANCIAL STATEMENTS – FUND SPECIFIC INFORMATION
Please see the generic notes at the back of the financial statements.
December 31, 2019
RBC CANADIAN INDEX FUND
General information (see note 1 in the generic notes)
The investment objective of the Fund is to provide long-term
capital growth by tracking the performance of the S&P/TSX
Capped Composite Total Return Index.
Series O units were started April 26, 2019.
Financial instrument risk and capital management (see note 5 in the generic notes)
Concentration risk (%)
The table below summarizes the Fund’s investment exposure
(after consideration of derivative products, if any) as at:
Investment mixDecember 31
2019December 31
2018
Financials 31.8 34.1 Energy 16.9 18.3 Materials 11.3 11.9 Industrials 10.9 10.9 Information Technology 5.6 3.2 Communication Services 5.4 6.0 Utilities 4.7 3.1 Consumer Discretionary 4.1 4.1 Consumer Staples 3.8 4.1 Real Estate 3.3 2.6 Health Care 1.3 1.3 Underlying Funds 0.6 – Cash/Other 0.3 0.4 Total 100.0 100.0
Other price risk (% impact on NAV)
The table below shows the impact of a 1% change in the
broad-based index (noted below) on the Fund’s NAV, using a
36-month historical correlation of data of the Fund’s return
and the index, with all other factors kept constant, as at:
December 31 2019
December 31 2018
S&P/TSX Capped Composite Total Return Index + or - 1.0 + or - 1.0
Since historical correlation may not be representative of
future correlation, actual results could differ from this
sensitivity analysis and the difference could be material.
Fair value hierarchy ($000s except % amounts) (see note 3 in the generic notes)
The following is a summary of the inputs used as of
December 31, 2019 and 2018.
December 31, 2019 Level 1 Level 2 Level 3 Total
Equities 812 651 – – 812 651Underlying funds 4 844 – – 4 844Fixed-income and debt securities – – – –Short-term investments – – – –Derivatives – assets – – – –Derivatives – liabilities – – – –Total financial instruments 817 495 – – 817 495% of total portfolio 100.0 – – 100.0
December 31, 2018 Level 1 Level 2 Level 3 Total
Equities 681 355 – – 681 355Underlying funds – – – –Fixed-income and debt securities – – – –Short-term investments – – – –Derivatives – assets – – – –Derivatives – liabilities – – – –Total financial instruments 681 355 – – 681 355% of total portfolio 100.0 – – 100.0
For the periods ended December 31, 2019 and 2018, there
were no transfers of financial instruments between Level 1,
Level 2 and Level 3.
Management fees and administration fees (see note 8 in the generic notes)
Management fees and administration fees of each series
of the Fund are payable to RBC GAM and calculated at the
following annual percentages, before GST/HST, of the daily
NAV of each series of the Fund.
Management fees Administration fees
Series A 0.50% 0.10%Series F 0.05% 0.10%Series O n/a* 0.02%
* Series O unitholders pay a negotiated management fee directly to RBC GAM for investment-counselling services.
NOTES TO FINANCIAL STATEMENTS – FUND SPECIFIC INFORMATION
Please see the generic notes at the back of the financial statements.
December 31, 2019
RBC CANADIAN INDEX FUND
Investments by related parties ($000s except unit amounts)
Royal Bank of Canada, or one of its subsidiaries, held the
following investments in the Fund as at:
December 31 2019
December 31 2018
Units held Series F 111 108 Series O 103 –Value of all units 2 1
Unconsolidated structured entities (%) (see note 3 in the generic notes)
The table below summarizes the Fund’s interest in the
unsponsored funds as a percentage of NAV, and the
Fund’s ownership interest as a percentage of NAV of the
unsponsored funds (“Ownership”).
December 31 2019
December 31 2018
NAV Ownership NAV Ownership
iShares Core S&P/TSX Capped Composite Index ETF 0.6 0.1 – –
Taxes ($000s) (see note 6 in the generic notes)
The non-capital and capital losses as at December 31, 2019
for the Fund were approximately:
Capital losses 91 933Non-capital losses –
Redeemable units (000s)
There is no limitation on the number of units available for
issue. Units are purchased and redeemed at the NAV per unit.
For the periods ended December 31 (see note 2 in the generic notes) 2019 2018
Series AOpening units 24 719 25 452 Issued number of units 3 476 3 056 Reinvested number of units 560 635 Redeemed number of units (4 323) (4 424)Ending number of units 24 432 24 719
Series FOpening units 2 070 998 Issued number of units 1 985 1 317 Reinvested number of units 81 52 Redeemed number of units (548) (297)Ending number of units 3 588 2 070
For the periods ended December 31 (see note 2 in the generic notes) 2019 2018
Series OOpening units – –Issued number of units 1 –Reinvested number of units – –Redeemed number of units – –Ending number of units 1 –
Transaction costs ($000s except %)
Transaction costs, including brokerage commissions, in
consideration of portfolio transactions for the periods ended:
December 31 2019
December 31 2018
$ % $ %
Total transaction costs 64 100 22 100Related-party brokerage commissions* – – – –Commission arrangements† – – – –
* See note 8 in the generic notes.† Commission arrangements are part of commission amounts paid to dealers. The Fund uses
commission arrangements (formerly known as “soft dollars”) for research and/or order execution goods and services.
Securities lending revenue ($000s except %) (see note 7 in the generic notes)
Fair value of securities on loan and collateral received as at:
December 31 2019
December 31 2018
Fair value of securities loaned 44 925 59 605Fair value of collateral received 45 823 60 797
The table below provides a reconciliation of the gross revenue
generated from the securities lending transactions of the Fund
to the securities lending revenue disclosed in the Statements of
Comprehensive Income.
December 31 2019
December 31 2018
$ % $ %
Gross revenue 1 101 100 412 100RBC IS (paid) (276) (25) (103) (25)Tax withheld (98) (9) (22) (5)Fund revenue 727 66 287 70

GENERIC NOTES TO FINANCIAL STATEMENTS
December 31, 2019
(also see Fund Specific Information)
1. The Funds
The Funds (“Fund” or “Funds”) are open-ended mutual
fund trusts governed by the laws of the Province of Ontario
or British Columbia. RBC GAM is the manager and portfolio
manager of the Funds and its head office is located at
155 Wellington Street West, 22nd Floor, Toronto, Ontario.
RBC GAM is also the trustee of those Funds governed by the
laws of the Province of Ontario. These financial statements
were approved for issuance by the Board of Directors of
RBC GAM on March 11, 2020.
The Funds may issue an unlimited number of units in some
or all of Series A, Advisor Series, Advisor T5 Series, Series T5,
Series T8, Series H, Series D, Series DZ, Series F, Series FT5,
Series FT8, Series I, Series N and Series O.
Series A units have no sales charges and are available to all
investors through authorized dealers.
Advisor Series units and Advisor T5 Series units are available
to all investors through authorized dealers with an initial
sales charge or low-load sales charge option. For certain of
the Funds, Advisor Series units and Advisor T5 Series units are
available with a deferred sales charge option. Under the initial
sales charge option, investors pay a sales charge ranging from
0% to 5% of the amount invested. Under the deferred sales
charge or low-load sales charge option, sales charges may be
applicable, as described in the Simplified Prospectus.
Series T5 units and Series T8 units have no sales charges and
are available to all investors through authorized dealers.
Series H units have no sales charges, have lower fees than
Series A units and are only available to investors who invest
and maintain the required minimum balance through
authorized dealers.
Series D units and Series DZ units have no sales charges
and have lower fees than Series A units. Series D units and
Series DZ units may be available to investors who have
accounts with RBC Direct Investing Inc., Phillips, Hager &
North Investment Funds Ltd. (“PH&N IF”) or certain other
authorized dealers (primarily discount brokers).
Series F units, Series FT5 units and Series FT8 units have no
sales charges and have lower fees than Series A units. Series F
units, Series FT5 units and Series FT8 units are only available
to investors who have fee-based accounts with their dealer.
Series I units have no sales charges, have lower fees than
Series F units, Series FT5 units and Series FT8 units and
are only available to investors who invest and maintain
the required minimum balance and who have accounts
with dealers who have signed a fee-based agreement with
RBC GAM.
Series N units are only available to related funds.
Series O units are only available to large private or
institutional investors or dealers. No management fees
are payable by the Funds in respect to Series O units.
Unitholders pay a negotiated fee directly to RBC GAM for
investment-counselling services.
2. Financial year
The information provided in these financial statements
and notes thereto is as at December 31, 2019 and
December 31, 2018, as applicable, and for the 12-month
periods ended December 31, 2019 and December 31, 2018,
as applicable, except for Funds or series established during
either period, in which case the information for the Fund,
or series, is provided for the period from the start date as
described in the Notes to Financial Statements – Fund Specific
Information of the Fund.
3. Summary of significant accounting policies
These financial statements have been prepared in accordance
with International Financial Reporting Standards (“IFRS”).
The significant accounting policies of the Funds are
as follows:
Classification and Measurement of Financial Assets, Liabilities and Derivatives Each of the Funds classify
their investment portfolio based on the business model
for managing the portfolio and the contractual cash flow
characteristics. The investment portfolio of financial assets
and liabilities is managed and performance is evaluated on
a fair value basis. The contractual cash flows of the Funds’
debt securities that are solely principal and interest are
neither held for the purpose of collecting contractual cash
flows nor held both for collecting contractual cash flows
and for sale. The collection of contractual cash flows is only
incidental to achieving the Funds’ business model objectives.
Consequently, all investments are measured at fair value
through profit and loss (“FVTPL”). Derivative assets and
liabilities are also measured at FVTPL.

GENERIC NOTES TO FINANCIAL STATEMENTS
December 31, 2019
(also see Fund Specific Information)
The Funds’ obligation for net assets attributable to holders
of redeemable units represents a financial liability and is
measured at the redemption amount, which approximates
fair value as of the reporting date. All other financial assets
and liabilities are measured at amortized cost.
Offsetting Financial Assets and Liabilities In the normal
course of business, the Funds may enter into various
International Swaps and Derivatives Association master
netting agreements or other similar arrangements with
certain counterparties that allow for related amounts to
be offset in certain circumstances, such as bankruptcy or
termination of contracts. Offsetting information, where
applicable, is presented in the Notes to Financial
Statements – Fund Specific Information.
Classification of Redeemable Units The Funds have multiple
features across the different series of the Funds. Consequently,
the Funds’ outstanding redeemable units are classified as
financial liabilities in accordance with the requirements of
IAS 32 Financial Instruments: Presentation.
Unconsolidated Structured Entities The Funds may invest in
other Funds and exchange-traded funds (“ETFs”) managed
by the manager or an affiliate of the manager (“sponsored
funds”) and may invest in other funds and ETFs managed
by unaffiliated entities (“unsponsored funds”); collectively,
“underlying funds.” The underlying funds are determined to
be unconsolidated structured entities, as decision making
in the underlying fund is not governed by the voting rights
or other similar rights held by the Fund. The investments
in underlying funds are subject to the terms and conditions
of the offering documents of the respective underlying
funds and are susceptible to market price risk arising from
uncertainties about future values of those underlying funds.
The underlying funds’ objectives are generally to achieve
long-term capital appreciation and/or current income by
investing in a portfolio of securities and other funds in line
with each of their documented investment strategies. The
underlying funds apply various investment strategies to
accomplish their respective investment objectives.
The underlying funds finance their operations by issuing
redeemable units which are puttable at the unitholder’s
option, and entitle the unitholder to a proportional stake in
the respective underlying funds’ NAV.
The Funds do not consolidate their investment in underlying
funds but account for these investments at fair value. The
manager has determined that the Funds are investment
entities in accordance with IFRS 10 Consolidated Financial
Statements, since the Funds meet the following criteria:
(i) The Funds obtain capital from one or more investors for
the purpose of providing those investors with investment
management services,
(ii) The Funds commit to their investors that their business
purpose is to invest funds solely for the returns from
capital appreciation, investment income or both, and
(iii) The Funds measure and evaluate the performance of
substantially all of their investments on a fair value basis.
Therefore, the fair value of investments in the underlying
funds is included in the Schedule of Investment Portfolio
and included in “Investments at fair value” in the Funds’
Statements of Financial Position. The change in fair value
of the investment held in the underlying funds is included
in “Change in unrealized gain (loss) on investments” in the
Statements of Comprehensive Income.
Certain Funds may invest in mortgage-related or other
asset-backed securities. These securities include commercial
mortgage-backed securities, asset-backed securities,
collateralized debt obligations and other securities that
directly or indirectly represent a participation in, or are
securitized by and payable from, mortgage loans on real
property. Mortgage-related securities are created from
pools of residential or commercial mortgage loans while
asset-backed securities are created from many types of
assets, including auto loans, credit card receivables, home
equity loans and student loans. The Funds account for these
investments at fair value. The fair value of such securities, as
disclosed in the Schedule of Investment Portfolio, represents
the maximum exposure to losses at that date.
Determination of Fair Value The fair value of a financial
instrument is the amount at which the financial instrument
could be exchanged in an arm’s-length transaction between
knowledgeable and willing parties under no compulsion to
act. In determining fair value, a three-tier hierarchy based on
inputs is used to value the Funds’ financial instruments.
The hierarchy of inputs is summarized below:
GENERIC NOTES TO FINANCIAL STATEMENTS
December 31, 2019
(also see Fund Specific Information)
Level 1 – quoted prices (unadjusted) in active markets for
identical assets or liabilities;
Level 2 – inputs other than quoted prices included in
Level 1 that are observable for the asset or liability, either
directly (i.e., as prices) or indirectly (i.e., derived from prices),
including broker quotes, vendor prices and vendor fair value
factors; and
Level 3 – inputs for the asset or liability that are not based on
observable market data (unobservable inputs).
Changes in valuation methods may result in transfers into or
out of an investment’s assigned level.
The three-tier hierarchy of investments and derivatives is
included in Notes to Financial Statements – Fund Specific
Information.
Investments and derivatives are recorded at fair value, which
is determined as follows:
Equities – Common shares and preferred shares are valued at
the closing price recorded by the security exchange on which
the security is principally traded. In circumstances where the
closing price is not within the bid-ask spread, management will
determine the points within the bid-ask spread that are most
representative of the fair value.
Fixed-Income and Debt Securities – Bonds, mortgage-backed
securities, loans, debentures and other debt securities are
valued at the mid price quoted by major dealers or independent
pricing vendors in such securities.
NHA-approved mortgages are valued at an amount, which produces a yield equivalent to the prevailing rate of return on mortgages of similar type and term.
Short-Term Investments – Short-term investments are valued at cost plus accrued interest, which approximates fair value.
Options – Options give the purchaser the right, but not the obligation, to buy (call) or sell (put) an underlying security or financial instrument at an agreed exercise or strike price during the specified period or on a specified date.
Listed options are valued at the closing price on the recognized exchange on which the option is traded. In circumstances where the closing price is not within the bid-ask spread, management will determine the points within the bid-ask spread that are most representative of the fair value.
Options purchased and options written (sold) are recorded as investments in the Statements of Financial Position. These investments are reported at fair value in the Statements of Financial Position, and unrealized gain or loss at the close of business on each valuation date is recorded in “Change in unrealized gain (loss) on investments” in the Statements of Comprehensive Income.
When an option is exercised and the underlying securities are acquired or delivered, the acquisition cost or sale proceeds are adjusted by the amount of the premium. When an option is closed the Fund will realize a gain or loss equal to the difference between the premium and the cost to close the position. When an option expires, gains or losses are realized equivalent to the amount of premiums received or paid, respectively. The net realized gains (losses) on written and purchased options are included in the Statements of Comprehensive Income in “Net realized gain (loss) on investments.”
Warrants – Warrants are valued using a recognized option pricing model, which includes factors such as the terms of the warrant, time value of money and volatility inputs that are significant to such valuation.
Forward Contracts – Forward contracts are valued at the gain or loss that would arise as a result of closing the position at the valuation date. The receivable/payable on forward contracts is recorded separately in the Statements of Financial Position. Any unrealized gain or loss at the close of business on each valuation date is recorded as “Change in unrealized gain (loss) on investments” and realized gain or loss on foreign exchange contracts is included in “Derivative income” in the Statements of Comprehensive Income.
Total Return Swaps – A total return swap is an agreement by which one party makes payments based on a set rate, either fixed or variable, while the other party makes payments based on the return of an underlying asset, which includes both the income it generates and any capital gains. Total return swap contracts are marked to market daily based upon quotations from the market makers and the change in value, if any, is recorded in “Change in unrealized gain (loss) on investments” in the Statements of Comprehensive Income. When the swap contract is terminated early, the Fund records a realized gain or loss equal to the difference between the current net present value and the executed net present value in “Derivative income” in the Statements of Comprehensive Income.
GENERIC NOTES TO FINANCIAL STATEMENTS
December 31, 2019
(also see Fund Specific Information)
Unrealized gains and losses are recorded as “Receivable on open swap contracts” or “Payable on open swap contracts” in the Statements of Financial Position, as applicable. The risks of total return swap contracts include changes in market conditions and the possible inability of the counterparty to fulfill its obligations under the agreement.
Futures Contracts – Futures contracts entered into by the
Funds are financial agreements to purchase or sell a financial
instrument at a contracted price on a specified future date.
However, the Funds do not intend to purchase or sell the
financial instrument on the settlement date; rather, they
intend to close out each futures contract before settlement
by entering into equal, but offsetting, futures contracts.
Futures contracts are valued at the gain or loss that would
arise as a result of closing the position at the valuation date.
Any gain or loss at the close of business on each valuation
date is recorded as “Derivative income” in the Statements
of Comprehensive Income. The receivable/payable on
futures contracts is recorded separately in the Statements of
Financial Position.
Credit Default Swap Contracts – Credit default swaps are
agreements between a protection buyer and protection
seller. The protection buyer pays a periodic fee in exchange
for a payment by the protection seller contingent on the
occurrence of a credit event, such as a default, bankruptcy
or restructuring, with respect to a referenced entity.
Periodic fees paid or received are recorded as “Interest for
distribution purposes” in the Statements of Comprehensive
Income. When the contract is terminated or expires, the
payments received or paid are recorded as “Derivative
income” in the Statements of Comprehensive Income.
Credit default swap contracts are valued based on quotations
from independent sources.
Underlying Funds – Underlying funds that are not exchange-
traded funds are valued at their respective NAV per unit
from fund companies on the relevant valuation dates and
underlying funds that are exchange-traded funds are valued
at market close on the relevant valuation dates.
Fair Valuation of Investments – The Funds have procedures
to determine the fair value of securities and other financial
instruments for which market prices are not readily available
or which may not be reliably priced. Procedures are in place
to determine the fair value of foreign securities traded in
countries outside of North America daily to avoid stale prices
and to take into account, among other things, any significant
events occurring after the close of a foreign market.
Management also has procedures where the Funds primarily
employ a market-based approach, which may use related
or comparable assets or liabilities, NAV per unit (for
exchange-traded funds), recent transactions, market
multiples, book values and other relevant information for
the investment to determine its fair value. The Funds may
also use an income-based valuation approach in which
the anticipated future cash flows of the investment are
discounted to calculate fair value. Discounts may also be
applied due to the nature or duration of any restrictions
on the disposition of the investments, but only if they arise
as a feature of the instrument itself. Due to the inherent
uncertainty of valuations of such investments, the fair values
may differ significantly from the values that would have been
used had an active market existed.
All security valuation techniques are periodically reviewed
by the Valuation Committee (“VC”) of the manager and are
approved by the manager. The VC provides oversight of the
Funds’ valuation policies and procedures.
Cash Cash is comprised of cash and deposits with banks and
is recorded at amortized cost. The carrying amount of cash
approximates its fair value because it is short term in nature.
Margin Margin accounts represent margin deposits held with
brokers in respect of futures contracts.
Functional Currency The Funds, with the exceptions below,
have their subscriptions, redemptions and performance
denominated in Canadian dollars and, consequently, the
Canadian dollar is the functional currency for the Funds.
Phillips, Hager & North $U.S. Money Market Fund,
RBC $U.S. Money Market Fund, RBC Premium $U.S.
Money Market Fund, RBC $U.S. Short-Term Corporate
Bond Fund, RBC $U.S. Investment Grade Corporate Bond
Fund, RBC $U.S. High Yield Bond Fund, RBC $U.S. Strategic
Income Bond Fund, BlueBay Emerging Markets Bond Fund
(Canada), BlueBay Emerging Markets Local Currency Bond
Fund (Canada), BlueBay Emerging Markets Corporate Bond
Fund, BlueBay $U.S. Global Convertible Bond Fund (Canada)
and RBC U.S. Monthly Income Fund (collectively, the
“USD Funds”) have their subscriptions, redemptions and
performance denominated in U.S. dollars and, consequently,
the U.S. dollar is the functional currency for these Funds.

GENERIC NOTES TO FINANCIAL STATEMENTS
December 31, 2019
(also see Fund Specific Information)
Foreign Exchange The value of investments and other
assets and liabilities in foreign currencies is translated
into Canadian dollars (U.S. dollars in the case of the USD
Funds) at the rate of exchange on each valuation date.
Gains/losses on foreign cash balances are included in “Net
gain (loss) on foreign cash balances” in the Statements of
Comprehensive Income. Purchases and sales of investments,
income and expenses are translated at the rate of exchange
prevailing on the respective dates of such transactions.
Realized foreign exchange gains/losses on spot and forward
currency contracts are included in “Derivative income” in the
Statements of Comprehensive Income.
Valuation of Series A different NAV is calculated for each
series of units of a Fund. The NAV of a particular series of
units is computed by calculating the value of the series’
proportionate share of the assets and liabilities of the Fund
common to all series less the liabilities of the Fund attributable
only to that series. Expenses directly attributable to a series
are charged to that series. Other expenses are allocated
proportionately to each series based upon the relative NAV of
each series. Expenses are accrued daily.
Investment Transactions Investment transactions are
accounted for as of the trade date. Transaction costs, such as
brokerage commissions, incurred by the Funds are recorded
in the Statements of Comprehensive Income for the period.
The unrealized gain and loss on investments is the difference
between fair value and average cost for the period. The basis
of determining the cost of portfolio assets, and realized
and unrealized gains and losses on investments, is average
cost which does not include amortization of premiums or
discounts on fixed-income and debt securities with the
exception of zero coupon bonds.
Income Recognition Dividend income is recognized on the
ex-dividend date and interest for distribution purposes is
coupon interest recognized on an accrual basis and/or
imputed interest on zero coupon bonds. “Income from
investment trusts” includes income from underlying funds
and other trusts. Any premiums paid or discounts received
on the purchase of zero coupon bonds are amortized. Interest
payments made by the Funds to counterparties on the
payable leg of derivative contracts are recorded as “Interest
expense” in the Statements of Comprehensive Income.
Increase (Decrease) in NAV per Unit Increase (decrease) in
NAV per unit in the Statements of Comprehensive Income
represents the increase (decrease) in net assets attributable to
holders of redeemable units by series, divided by the average
units outstanding per series during the period.
Early Redemption Fees Early redemption fees (short-term
trading fees) are paid directly to a Fund and are designed
to deter excessive trading and its associated costs. With the
exception of money market funds, a Fund may apply a fee
of 2% of the current value of units if the unitholder redeems
or switches out units within seven days of purchasing
or previously switching into a Fund. These amounts are
included in the Statements of Changes in NAV.
Foreign Currencies The following is a list of abbreviations
used in the Schedule of Investment Portfolio:
ARS – Argentinian pesoAUD – Australian dollarBRL – Brazilian realCAD – Canadian dollarCHF – Swiss francCLP – Chilean pesoCNY – Chinese renminbiCOP – Colombian pesoCZK – Czech korunaDKK – Danish kroneEGP – Egyptian poundEUR – EuroGBP – Pound sterlingHKD – Hong Kong dollarHUF – Hungarian forintIDR – Indonesian rupiahILS – Israeli new shekelINR – Indian rupeeJPY – Japanese yen
KRW – South Korean wonMXN – Mexican pesoMYR – Malaysian ringgitNGN – Nigerian nairaNOK – Norwegian kroneNZD – New Zealand dollarPEN – Peruvian nuevo solPHP – Philippine pesoPLN – Polish zlotyRON – Romanian leuRUB – Russian rubleSEK – Swedish kronaSGD – Singapore dollarTHB – Thailand bahtTRY – Turkish new liraTWD – New Taiwan dollarUSD – United States dollarUYU – Uruguay pesoZAR – South African rand
4. Critical accounting judgments and estimates
The preparation of financial statements requires the use
of judgment in applying the Funds’ accounting policies
and making estimates and assumptions about the future.
The following discusses the most significant accounting
judgments and estimates that management has made in
preparing the financial statements.
Fair value measurement of securities not quoted in an active market
The Funds have established policies and control procedures
that are intended to ensure these estimates are well
controlled, independently reviewed and consistently applied
from period to period. The estimates of the value of the
Funds’ assets and liabilities are believed to be appropriate as
at the reporting date.
GENERIC NOTES TO FINANCIAL STATEMENTS
December 31, 2019
(also see Fund Specific Information)
The Funds may hold financial instruments that are not quoted
in active markets. Note 3 discusses the policies used by
management for the estimates used in determining fair value.
5. Financial instrument risk and capital management
RBC GAM is responsible for managing each Fund’s
capital, which is its NAV and consists primarily of
its financial instruments.
A Fund’s investment activities expose it to a variety of
financial risks. RBC GAM seeks to minimize potential adverse
effects of these risks on a Fund’s performance by employing
professional, experienced portfolio managers, daily monitoring
of the Fund’s holdings and market events, diversifying its
investment portfolio within the constraints of its investment
objectives and, in some cases, periodically hedging certain risk
exposures through the use of derivatives. To assist in managing
risks, RBC GAM also uses internal guidelines, maintains a
governance structure that oversees each Fund’s investment
activities and monitors compliance with the Fund’s investment
strategies, internal guidelines and securities regulations.
Financial instrument risk, as applicable to a Fund, is disclosed
in its Notes to Financial Statements – Fund Specific Information.
These risks include a Fund’s direct risks and pro rata exposure to
the risks of underlying funds, as applicable.
Liquidity risk
Liquidity risk is the possibility that investments in a Fund
cannot be readily converted into cash when required. A Fund
is exposed to daily cash redemptions of redeemable units.
Liquidity risk is managed by investing the majority of a Fund’s
assets in investments that are traded in an active market and
that can be readily disposed. In accordance with securities
regulations, a Fund must maintain at least 90% of its assets in
liquid investments. In addition, a Fund aims to retain sufficient
cash and cash equivalent positions to maintain liquidity, and
has the ability to borrow up to 5% of its NAV for the purpose
of funding redemptions. All non-derivative financial liabilities,
other than redeemable units, are due within 90 days.
Credit risk
Credit risk is the risk that a loss could arise from a security
issuer or counterparty not being able to meet its financial
obligations. The carrying amount of investments and other
assets represents the maximum credit risk exposure as
disclosed in a Fund’s Statements of Financial Position. The
Funds measure credit risk and expected credit losses using
probability of default, exposure at default and loss given
default. Management considers both historical analysis and
forward-looking information in determining any expected
credit loss. All other receivables, amounts due from brokers,
cash and short-term deposits are held with counterparties
with a credit rating of AA/Aa or higher. Management
considers the probability of default to be close to zero as
the counterparties have a strong capacity to meet their
contractual obligations in the near term. As a result, no
loss allowance has been recognized based on 12-month
expected credit losses as any such impairment would be
wholly insignificant to the Funds. The fair value of fixed-
income and debt securities includes a consideration of the
creditworthiness of the debt issuer. Credit risk exposure
to over-the-counter derivative instruments is based on a
Fund’s unrealized gain on the contractual obligations with
the counterparty. Credit risk exposure is mitigated for those
Funds participating in a securities lending program (see
note 7). RBC GAM monitors each Fund’s credit exposure and
counterparty ratings daily.
Concentration risk
Concentration risk arises as a result of net financial
instrument exposures to the same category, such as
geographical region, asset type, industry sector or market
segment. Financial instruments in the same category have
similar characteristics and may be affected similarly by
changes in economic or other conditions.
Interest rate risk
Interest rate risk is the risk that the fair value of a Fund’s
interest-bearing investments will fluctuate due to changes
in market interest rates. The value of fixed-income and debt
securities, such as bonds, debentures, mortgages or other
income-producing securities, is affected by interest rates.
Generally, the value of these securities increases if interest
rates fall and decreases if interest rates rise.
Currency risk
Currency risk is the risk that the value of investments
denominated in currencies, other than the functional
currency of a Fund, will fluctuate due to changes in foreign
exchange rates. The value of investments denominated in a
currency other than the functional currency is affected by
changes in the value of the functional currency in relation

GENERIC NOTES TO FINANCIAL STATEMENTS
December 31, 2019
(also see Fund Specific Information)
to the value of the currency in which the investment is
denominated. When the value of the functional currency falls
in relation to foreign currencies, then the value of the foreign
investments rises. When the value of the functional currency
rises, the value of the foreign investments falls. The currency
risk as disclosed in the Fund Specific Information in the
Notes to Financial Statements represents the monetary and
non-monetary foreign exchange exposure of a Fund.
Other price risk
Other price risk is the risk that the value of financial
instruments will fluctuate as a result of changes in market
prices (other than those arising from interest rate or currency
risk), whether caused by factors specific to an individual
investment, its issuer, or all factors affecting all instruments
traded in a market or market segment.
6. Taxes
The Funds qualify as open-ended mutual fund trusts or unit
trusts under the Income Tax Act (Canada). In general, the
Funds are subject to income tax; however, no income tax
is payable on net income and/or net realized capital gains
which are distributed to unitholders. Since the Funds do
not record income taxes, the tax benefit of capital and
non-capital losses has not been reflected in the Statements
of Financial Position as a deferred income tax asset. In
addition, for mutual fund trusts, income taxes payable on
net realized capital gains are refundable on a formula basis
when units of the Funds are redeemed. It is the intention of
the Funds to pay out all net income and realized capital gains
each year so that the Funds will not be subject to income
taxes. Accordingly, no provision for income taxes is recorded.
Capital losses are available to be carried forward indefinitely
and applied against future capital gains. Non-capital losses
may be carried forward to reduce future taxable income for
up to 20 years.
7. Securities lending revenueCertain of the Funds lend portfolio securities from time to time in order to earn additional income. Income from securities lending is included in the Statements of Comprehensive Income of a Fund. Each such Fund will have entered into a securities lending program with its custodian, RBC Investor Services Trust (“RBC IS”). The aggregate market value of all securities loaned by a Fund cannot exceed 50% of the assets of a Fund. The Fund receives collateral, with an
approved credit rating of at least A, of at least 102% of the value of securities on loan. The Fund is indemnified by RBC IS for any collateral credit or market loss. As such, the credit risk associated with securities lending is considered minimal.
8. Administrative and other related-party transactions
Manager and Portfolio Manager
RBC GAM is an indirect wholly owned subsidiary of
Royal Bank of Canada (“Royal Bank”). RBC GAM is the
manager and portfolio manager of the Funds. RBC GAM is
responsible for the Funds’ day-to-day operations, provides
investment advice and portfolio management services to the
Funds and appoints distributors for the Funds. RBC GAM
is paid a management fee by the Funds as compensation
for its services. The management fee is calculated and
accrued daily as a percentage of the NAV of each series
of units of the Funds. No management fees are paid by
the Funds with respect to Series O units. Unitholders of
Series O units pay a negotiated fee directly to RBC GAM for
investment-counselling services.
The Funds pay a fixed administration fee to RBC GAM. The
fixed administration fee is calculated and accrued daily as a
percentage of the NAV of each series of units of the Funds.
RBC GAM in turn pays certain operating expenses of the
Funds. These expenses include regulatory filing fees and
other day-to-day operating expenses including, but not
limited to, recordkeeping, accounting and fund valuation
costs, custody fees, audit and legal fees and the costs of
preparing and distributing annual and interim reports,
prospectuses, statements and investor communications.
Notwithstanding the fixed administration fee, the Funds
also pay certain operating expenses directly, including
the costs related to the Independent Review Committee
of the Funds, and the cost of any new government or
regulatory requirements introduced and any borrowing costs
(collectively, “other fund costs”), and taxes (including, but not
limited to, GST/HST). Effective January 1, 2020, RBC GAM,
not the Funds, will be responsible for the costs related to
annual fees, meeting fees and reimbursement for expenses to
members of the Independent Review Committee. The Funds
will continue to be responsible for paying any Independent
Review Committee costs that are not related to annual fees,
meeting fees and reimbursement for expenses to members
of the Independent Review Committee. Other fund costs will
be allocated proportionately to each series based upon the

GENERIC NOTES TO FINANCIAL STATEMENTS
December 31, 2019
(also see Fund Specific Information)
relative NAV of each series. RBC GAM may, in some years
and in certain cases, absorb a portion of operating expenses.
The decision to absorb the operating expenses is reviewed
annually and determined at the discretion of RBC GAM,
without notice to unitholders.
Certain Funds may invest in units of other Funds managed
by RBC GAM or its affiliates (“underlying funds”). A Fund will
not invest in units of an underlying fund if the Fund would be
required to pay any management or incentive fees in respect
of that investment that a reasonable person would believe
duplicates a fee payable by the underlying fund for the same
service. To the extent a Fund invests in underlying funds
managed by RBC GAM or its affiliates, the fees and expenses
payable by the underlying funds are in addition to the fees
and expenses payable by the Fund. However, a Fund may
only invest in one or more underlying funds provided that no
management fees or incentive fees are payable that would
duplicate a fee payable by the underlying fund for the same
service. The Fund’s ownership interest in underlying funds
is disclosed in the Notes to Financial Statements – Fund
Specific Information.
RBC GAM or its affiliates may earn fees and spreads in connection with various services provided to, or transactions with, the Funds, such as banking, brokerage, securities lending, foreign exchange and derivatives transactions. RBC GAM or its affiliates may earn a foreign exchange spread when unitholders switch between series of funds denominated in different currencies. The Funds also maintain bank accounts and overdraft provisions with Royal Bank for which Royal Bank may earn a fee. Affiliates of RBC GAM that provide services to the Funds in the course of their normal business, all of which are wholly owned subsidiaries of Royal Bank of Canada, are discussed below.
Sub-Advisors
RBC Global Asset Management (U.S.) Inc. is the sub-advisor
for the RBC $U.S. Investment Grade Corporate Bond Fund,
RBC U.S. Mid-Cap Growth Equity Fund, RBC U.S. Mid-Cap
Growth Equity Currency Neutral Fund, RBC U.S. Mid-Cap
Value Equity Fund, RBC U.S. Small-Cap Core Equity Fund,
RBC U.S. Small-Cap Value Equity Fund and Phillips,
Hager & North U.S. Multi-Style All-Cap Equity Fund (for a
portion of the Fund). RBC Global Asset Management (UK)
Limited is the sub-advisor for the RBC Global Bond Fund
(for a portion of the Fund), RBC Global Corporate Bond
Fund (for a portion of the Fund), RBC U.S. Monthly Income
Fund (for a portion of the Fund), RBC Balanced Fund (for
the European equity portion of the Fund), RBC Global
Balanced Fund (for the European equity portion of the Fund),
RBC International Dividend Growth Fund, RBC International
Equity Fund (for the European equity portion of the Fund),
RBC European Dividend Fund, RBC European Equity
Fund, RBC European Mid-Cap Equity Fund, RBC Emerging
Markets Dividend Fund, RBC Emerging Markets Equity Fund,
RBC Emerging Markets Equity Focus Fund, RBC Emerging
Markets Small-Cap Equity Fund, RBC Global Dividend Growth
Fund, RBC Global Dividend Growth Currency Neutral Fund,
RBC Global Equity Fund, RBC Global Equity Focus Fund,
RBC Vision Global Equity Fund, RBC Vision Fossil Fuel
Free Global Equity Fund, Phillips, Hager & North Overseas
Equity Fund and Phillips, Hager & North Global Equity
Fund. RBC Investment Management (Asia) Limited is the
sub-advisor for the RBC Balanced Fund (for the Asian equity
portion of the Fund), RBC Global Balanced Fund (for the
Asian equity portion of the Fund), RBC Vision Balanced Fund
(for the Asian equity portion of the Fund), RBC International
Dividend Growth Fund (for the Asian equity portion of the
Fund), RBC International Equity Fund (for the Asian equity
portion of the Fund), RBC Asian Equity Fund, RBC Asia
Pacific Ex-Japan Equity Fund and RBC Japanese Equity Fund.
BlueBay Asset Management LLP is the sub-advisor of the
BlueBay Global Monthly Income Bond Fund, BlueBay Global
Sovereign Bond Fund (Canada), BlueBay Global Investment
Grade Corporate Bond Fund (Canada), BlueBay European
High Yield Bond Fund (Canada), BlueBay Emerging Markets
Bond Fund (Canada), BlueBay Emerging Markets Local
Currency Bond Fund (Canada), BlueBay Emerging Markets
Corporate Bond Fund, BlueBay Global Convertible Bond
Fund (Canada) and BlueBay $U.S. Global Convertible Bond
Fund (Canada).
The sub-advisors earn a fee which is calculated and accrued
daily as a percentage of the NAV of each series of units of the
Funds. The sub-advisors are paid by the manager from the
management fee paid by the Funds.
Trustee
RBC GAM is the trustee for the Funds governed by the laws of the Province of Ontario. RBC IS is the trustee for the Funds governed by the laws of the Province of British Columbia. The trustee holds title to the Funds’ property on behalf of the unitholders. The trustee earns a fee, which is paid by the manager from the fixed administration fee paid by the Funds.
GENERIC NOTES TO FINANCIAL STATEMENTS
December 31, 2019
(also see Fund Specific Information)
Distributors
RBC GAM, Royal Mutual Funds Inc., RBC Direct Investing Inc., RBC Dominion Securities Inc. and PH&N IF are principal distributors of, or may distribute certain series of units of, the Funds. Dealers receive an ongoing commission based on the total value of their clients’ Series A, Advisor Series, Advisor T5 Series, Series T5, Series T8, Series H and Series D units.
Custodian
RBC IS is the custodian and holds the assets of the Funds.
RBC IS earns a fee as the custodian, which is paid by the
manager from the fixed administration fee paid by the Funds.
Registrars
RBC GAM, RBC IS or Royal Bank (or a combination thereof)
are the registrars of the Funds and keep records of who owns
the units of the Funds. The registrars also process orders and
issue account statements. The registrars earn a fee, which is
paid by the manager from the fixed administration fee paid
by the Funds.
Brokers and Dealers
The Funds have established or may establish standard
brokerage agreements and dealing agreements at
market rates with related parties such as RBC Dominion
Securities Inc., RBC Capital Markets, LLC, RBC Europe
Limited, NBC Securities Inc. and Royal Bank of Canada.
Securities Lending Agent
To the extent a Fund may engage in securities lending
transactions, RBC IS may act as the Fund’s securities lending
agent. Any revenue earned on such securities lending is split
between the Fund and the securities lending agent.
Other Related-Party Transactions
Pursuant to applicable securities legislation, the Funds
relied on the standing instructions from the Independent
Review Committee with respect to one or more of the
following transactions:
Related-Party Trading Activities(a) trades in securities of Royal Bank;
(b) investments in the securities of issuers for which
a related-party dealer acted as an underwriter during
the distribution of such securities and the 60-day period
following the conclusion of such distribution of the
underwritten securities to the public;
(c) purchases of equity and debt securities from or sales of
equity or debt securities to a related-party dealer, where it
acted as principal; and
Inter-Fund Trading(d) purchases or sales of securities of an issuer from or to
another investment fund or managed account managed
by RBC GAM.
The applicable standing instructions require that Related-Party
Trading Activities and Inter-Fund Trading be conducted in
accordance with RBC GAM policy and that RBC GAM advise
the Independent Review Committee of a material breach
of any standing instruction. RBC GAM policy requires that
an investment decision in respect of Related-Party Trading
Activities (i) is made free from any influence of Royal Bank
or its associates or affiliates and without taking into account
any consideration relevant to Royal Bank or its affiliates
or associates, (ii) represents the business judgment of the
portfolio manager, uninfluenced by considerations other
than the best interests of the Funds, (iii) is in compliance with
RBC GAM policies and procedures, and (iv) achieves a fair and
reasonable result for the Funds. RBC GAM policy requires that
an investment decision in respect of Inter-Fund Trading is in
the best interests of each Fund.
9. Revision of comparative information
Where applicable, comparative figures on the Statements of
Cash Flow have been revised. Amounts previously recorded
as “Dividends received, net of withholding taxes” are now
recorded as “Income received from investment trusts.”