management plan for walleye in michigan’s inland waters
TRANSCRIPT

1
Management Plan for Walleye in Michigan’s Inland Waters
DRAFT
Authors: Seth Herbst, Daniel Hayes, Kevin Wehrly, Christian LeSage, Dave Clapp, Jennifer
Johnson, Patrick Hanchin, Emily Martin, Frank Lupi, Tim Cwalinski
2
Introduction
Walleye is a high priority species for management in Michigan because of its ecological,
social, and cultural significance. Walleye provide fishing opportunities for anglers and play a
significant ecological role as a top predator. There are threats to Walleye populations in
Michigan and there will be increasing management challenges related to the protection and
conservation of this native species in Michigan. To formalize management and prepare for
emerging threats to Walleye populations in Michigan, the Department has developed this plan to
guide management efforts with the overarching goal to maximize angler satisfaction and
ecological benefits derived from Walleye fisheries. Management actions to achieve this high-
level goal will be implemented in a manner that considers the potential limitations associated
with operational costs, available funding, fisheries management priorities, and the best available
science. The focus of this plan are Walleye populations in inland waters, primarily inland lakes,
because Great Lakes populations are primarily addressed in various other existing management
or rehabilitation plans (e.g., Lake Erie Walleye Management Plan 2015-2019 (Lake Erie
Committee, 2015); Strategy and options for completing the recovery of Walleye in Saginaw Bay
(Fielder and Baker, 2004), Michigan; Walleye management strategy for Little Bay de Noc, Lake
Michigan (Michigan DNR Fisheries Division, 2012)) and robust resident riverine populations
that are not directly connected to Great Lakes waters are fairly limited. Management strategies
for inland Walleye have also been previously published and still contain relevant information
(e.g., Walleye management guidelines for the Northern Lake Michigan Management Unit 2011-
2016 (Michigan DNR Fisheries Division, 2011); Ecology, management, and status of Walleye,
Sauger, and Yellow Perch in Michigan (Schneider et al. 2007)), but the Department felt it
prudent to update goals, objectives, and strategies to guide statewide Walleye management in
future years.

3
The State of Michigan recognizes several treaties between the United States government
and tribes residing in Michigan. Tribal governments’ signatory to the 1836 and 1842 treaties
retained hunting, fishing, and gathering rights for tribal members. Tribal governments and the
State often co-manage Walleye fisheries and populations in inland waters. State management of
waters within these treaty areas may deviate from concepts described within this plan as
differences in treaty waters may reflect special needs or different strategies and objectives
stemming from the co-management process.
Status of Inland Walleye Populations
Biological synopsis
Distribution - Walleye have a wide distribution throughout the state, but their prevalence
is higher in lakes in northern latitudes because those lakes typically have habitat characteristics
that are more suitable for Walleye. Walleye are also distributed in southern portions of
Michigan’s Lower Peninsula, despite marginal habitat suitability, because of previous stocking
efforts to create fishing opportunities for this recreationally popular species. In 2002, the
Michigan Department of Natural Resources (MDNR) compiled a list of waters where Walleye
occur using MDNR stocking records (1995-1999), MDNR biological survey records (1980-
2002), and a questionnaire sent to biologists in each MDNR Fisheries Management Units. The
previously compiled list is documented in Schneider et al. (2007). As part of the development of
this plan, Fisheries Division created an updated list of inland lakes where Walleye occur that is
based on MDNR stocking records and biological survey records from 2000 to 2019, and a
questionnaire sent to biologists in each MDNR Fisheries Management Unit (FMU) in 2019 to
4
assess the Walleye populations based on reproductive characteristics (i.e., sustained natural
recruitment or dependent on stocking). Appendix A contains the updated list of Walleye lakes
and is categorized by FMUs because MDNR manages fisheries resources based on those units,
which are geographic units delineated by the watersheds that drain to each of the Great Lakes
(Figure 1). That information was used to create a nearly complete list of inland lakes where
Walleye are likely present, regardless of the lake’s predicted habitat suitability for Walleye. The
list contains approximately 375 inland lakes and represents where strategic actions described
throughout this plan are most likely to achieve the desired goals in a cost-effective manner.

5
Figure 1. Map with names and boundaries of Fisheries Management Units (FMUs) that are used
by the Michigan DNR to manage Michigan’s fish populations. The boundaries are based on
major watersheds that drain to each of the Great Lakes. The Fisheries Management Unit label
abbreviations are as follows: Western Lake Superior = WLS, Eastern Lake Superior = ELS,
Northern Lake Michigan = NLM , Central Lake Michigan = CLM, Southern Lake Michigan =
SLM, Northern Lake Huron = NLH, Southern Lake Huron = SLH, Lake Erie = LE.
6
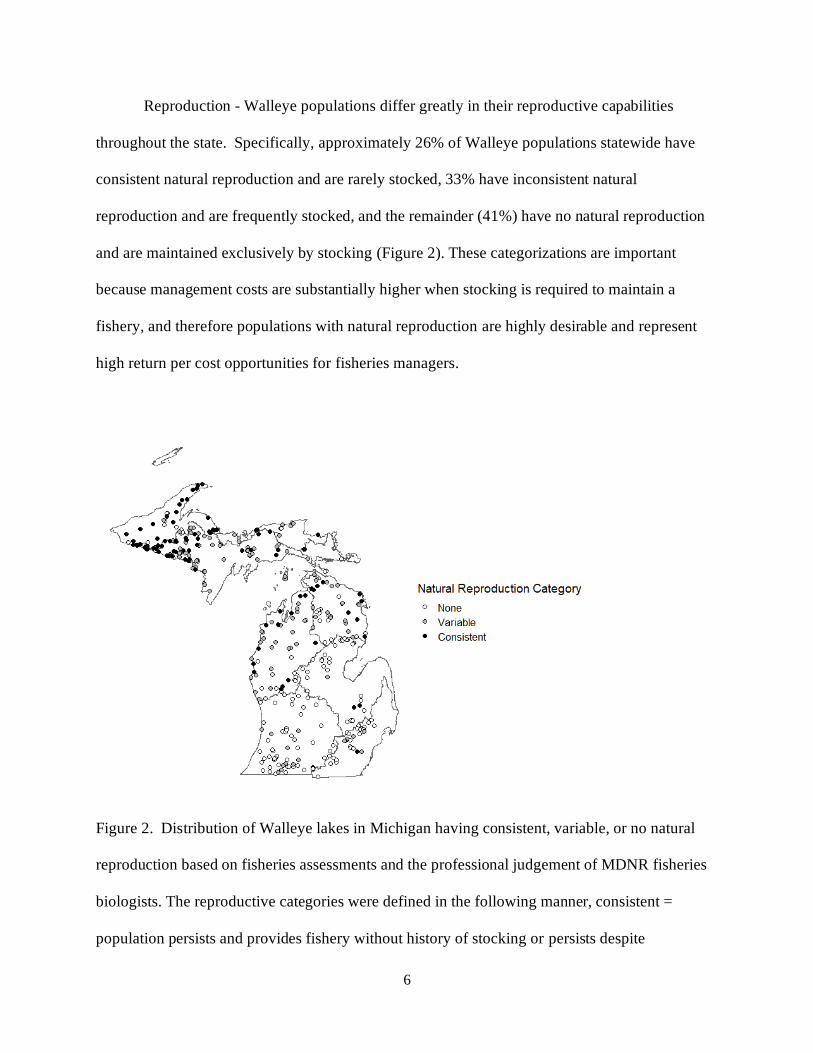
Reproduction - Walleye populations differ greatly in their reproductive capabilities
throughout the state. Specifically, approximately 26% of Walleye populations statewide have
consistent natural reproduction and are rarely stocked, 33% have inconsistent natural
reproduction and are frequently stocked, and the remainder (41%) have no natural reproduction
and are maintained exclusively by stocking (Figure 2). These categorizations are important
because management costs are substantially higher when stocking is required to maintain a
fishery, and therefore populations with natural reproduction are highly desirable and represent
high return per cost opportunities for fisheries managers.
Figure 2. Distribution of Walleye lakes in Michigan having consistent, variable, or no natural
reproduction based on fisheries assessments and the professional judgement of MDNR fisheries
biologists. The reproductive categories were defined in the following manner, consistent =
population persists and provides fishery without history of stocking or persists despite
7
discontinued stocking activities; variable = population produces a year class of natural
reproduced Walleye too infrequently to maintain a population without stocking, although a
residual Walleye population may be maintained and provide a marginal fishery; no natural
reproduction = persistence of population and fishery are solely dependent on routine stocking.
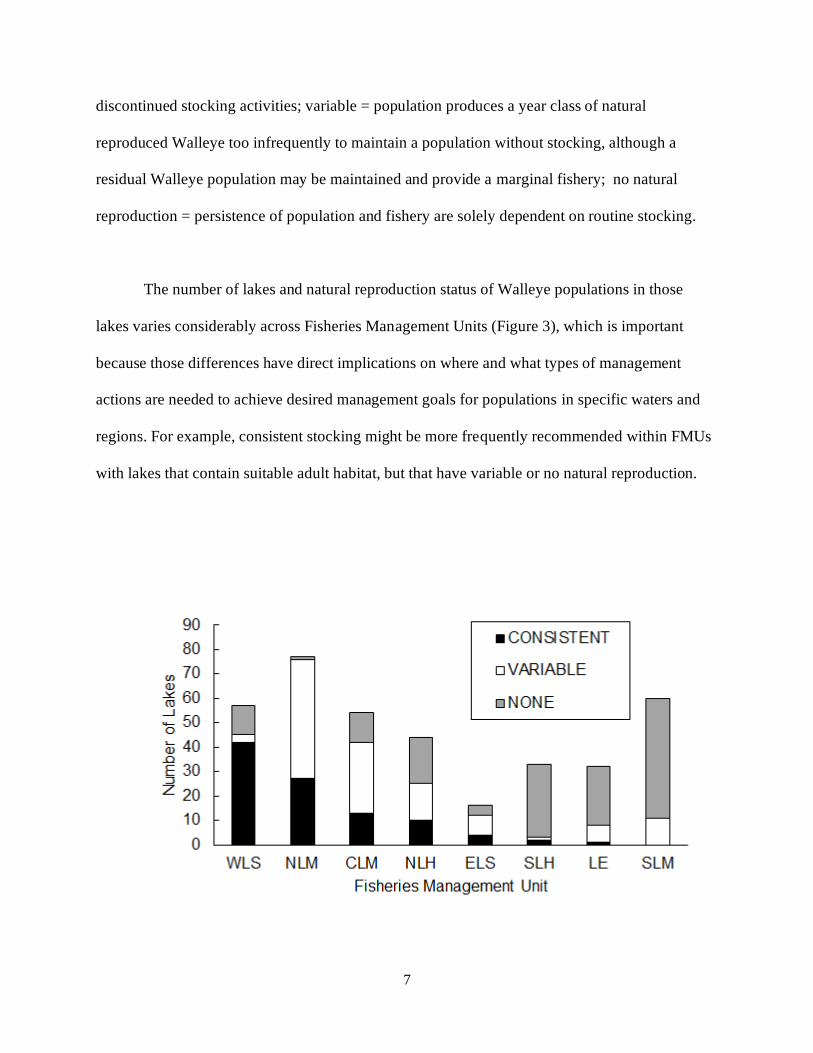
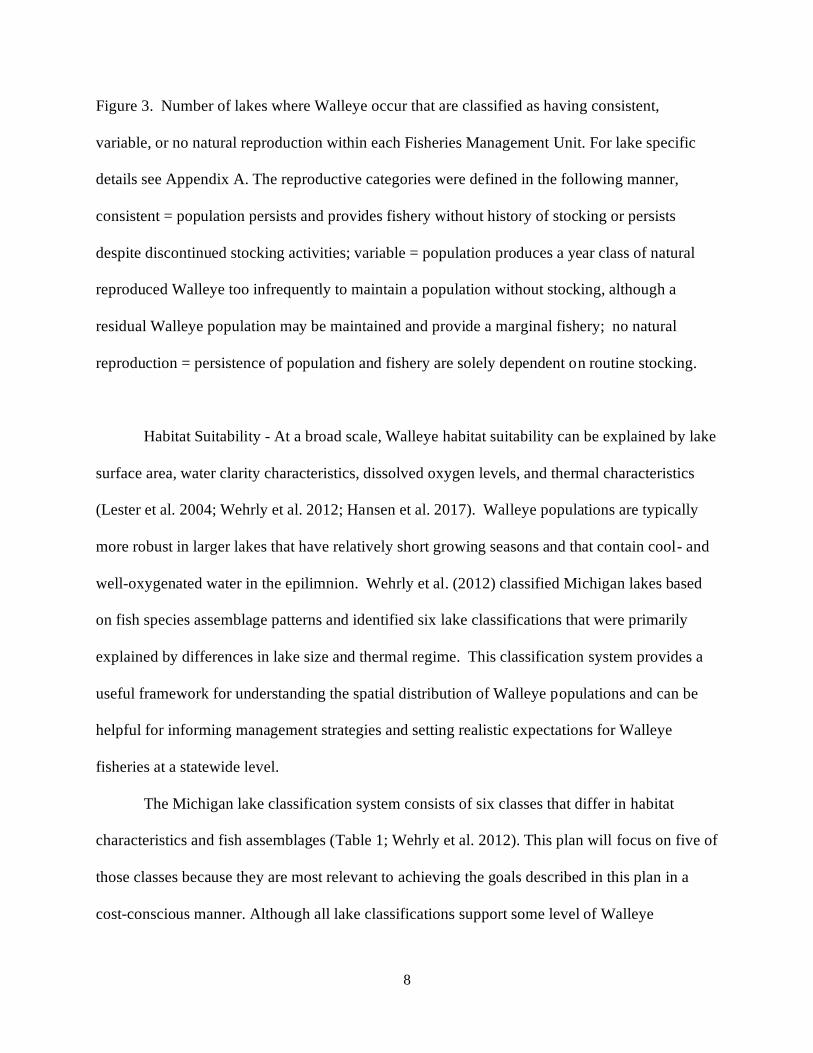
The number of lakes and natural reproduction status of Walleye populations in those
lakes varies considerably across Fisheries Management Units (Figure 3), which is important
because those differences have direct implications on where and what types of management
actions are needed to achieve desired management goals for populations in specific waters and
regions. For example, consistent stocking might be more frequently recommended within FMUs
with lakes that contain suitable adult habitat, but that have variable or no natural reproduction.
8
Figure 3. Number of lakes where Walleye occur that are classified as having consistent,
variable, or no natural reproduction within each Fisheries Management Unit. For lake specific
details see Appendix A. The reproductive categories were defined in the following manner,
consistent = population persists and provides fishery without history of stocking or persists
despite discontinued stocking activities; variable = population produces a year class of natural
reproduced Walleye too infrequently to maintain a population without stocking, although a
residual Walleye population may be maintained and provide a marginal fishery; no natural
reproduction = persistence of population and fishery are solely dependent on routine stocking.
Habitat Suitability - At a broad scale, Walleye habitat suitability can be explained by lake
surface area, water clarity characteristics, dissolved oxygen levels, and thermal characteristics
(Lester et al. 2004; Wehrly et al. 2012; Hansen et al. 2017). Walleye populations are typically
more robust in larger lakes that have relatively short growing seasons and that contain cool- and
well-oxygenated water in the epilimnion. Wehrly et al. (2012) classified Michigan lakes based
on fish species assemblage patterns and identified six lake classifications that were primarily
explained by differences in lake size and thermal regime. This classification system provides a
useful framework for understanding the spatial distribution of Walleye populations and can be
helpful for informing management strategies and setting realistic expectations for Walleye
fisheries at a statewide level.
The Michigan lake classification system consists of six classes that differ in habitat
characteristics and fish assemblages (Table 1; Wehrly et al. 2012). This plan will focus on five of
those classes because they are most relevant to achieving the goals described in this plan in a
cost-conscious manner. Although all lake classifications support some level of Walleye

9
populations, class 3 lakes contain the most suitable Walleye habitat and have more Walleye
populations with consistent natural reproduction (Figure 4; Wehrly et al. 2012). In comparison,
the lakes categorized as class 1 should not be prioritized for Walleye management. Class 1 lakes
have the lowest habitat suitability, poor levels of natural reproduction, and have historically been
maintained mostly through stocking. Therefore, Walleye management goals are expected to be
more challenging to achieve and efforts will be more cost-ineffective in class 1 lakes. It is
important to recognize that lakes with marginal habitat suitability might have previously received
stocking, but they are a lower priority for future efforts directed specifically at Walleye
management because of the low return on investment.
10
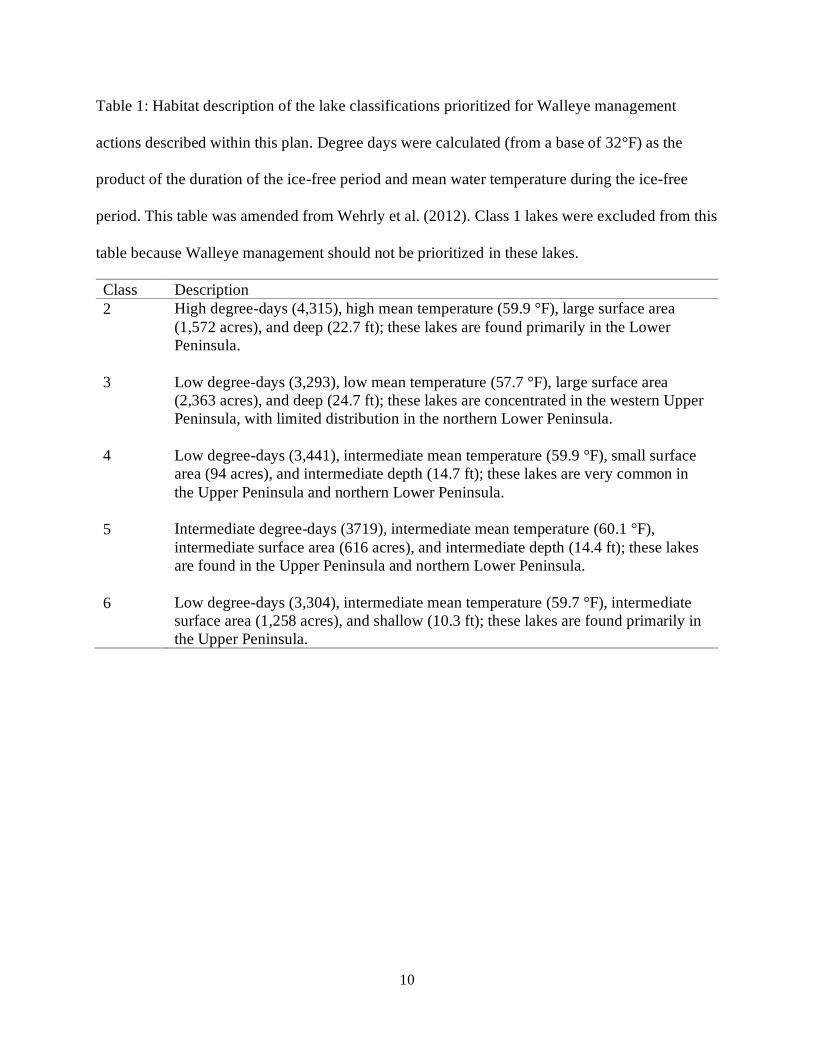
Table 1: Habitat description of the lake classifications prioritized for Walleye management
actions described within this plan. Degree days were calculated (from a base of 32°F) as the
product of the duration of the ice-free period and mean water temperature during the ice-free
period. This table was amended from Wehrly et al. (2012). Class 1 lakes were excluded from this
table because Walleye management should not be prioritized in these lakes.
Class Description
2 High degree-days (4,315), high mean temperature (59.9 °F), large surface area
(1,572 acres), and deep (22.7 ft); these lakes are found primarily in the Lower
Peninsula.
3 Low degree-days (3,293), low mean temperature (57.7 °F), large surface area
(2,363 acres), and deep (24.7 ft); these lakes are concentrated in the western Upper
Peninsula, with limited distribution in the northern Lower Peninsula.
4 Low degree-days (3,441), intermediate mean temperature (59.9 °F), small surface
area (94 acres), and intermediate depth (14.7 ft); these lakes are very common in
the Upper Peninsula and northern Lower Peninsula.
5 Intermediate degree-days (3719), intermediate mean temperature (60.1 °F),
intermediate surface area (616 acres), and intermediate depth (14.4 ft); these lakes
are found in the Upper Peninsula and northern Lower Peninsula.
6 Low degree-days (3,304), intermediate mean temperature (59.7 °F), intermediate
surface area (1,258 acres), and shallow (10.3 ft); these lakes are found primarily in
the Upper Peninsula.

11
Figure 4. Number of Walleye lakes, as identified by MDNR survey data and biologist’s
professional expertise, having consistent, variable, or no natural reproduction in each lake
classification (Wehrly et al. 2012). The reproductive categories were defined in the following
manner, consistent = population persists and provides fishery without history of stocking or
persists despite discontinued stocking activities; variable = population produces a year class of
natural reproduced Walleye too infrequently to maintain a population without stocking, although
a residual Walleye population may be maintained and provide a marginal fishery; no natural
reproduction (None) = persistence of population and fishery are solely dependent on routine
stocking. See Table 1 for habitat descriptions of the different lake classes.
The lakes with the highest habitat suitability for Walleye, class 3 lakes, are relatively
large and deep lakes that have a low number of degree days and an abundance of cool water in
the epilimnion (Wehrly et al. 2012). There are approximately fifty Walleye lakes classified as
class 3 and the majority of those lakes support consistent natural reproduction (Figure 4). These
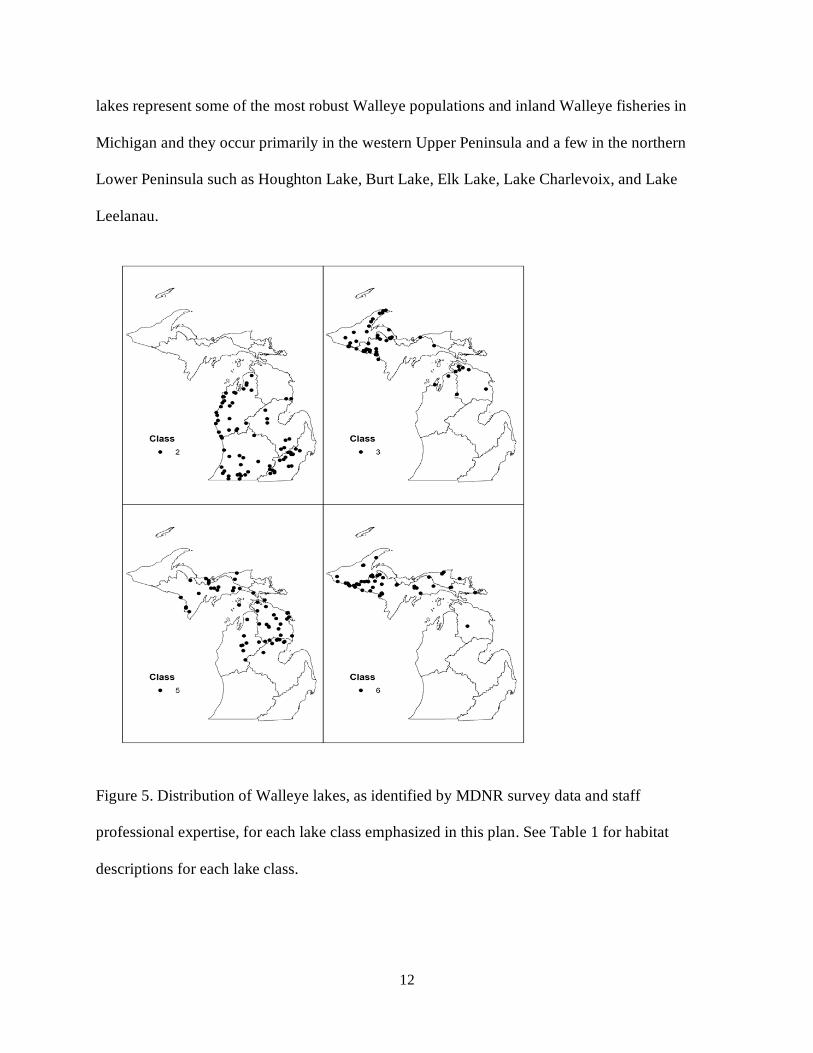
12
lakes represent some of the most robust Walleye populations and inland Walleye fisheries in
Michigan and they occur primarily in the western Upper Peninsula and a few in the northern
Lower Peninsula such as Houghton Lake, Burt Lake, Elk Lake, Lake Charlevoix, and Lake
Leelanau.
Figure 5. Distribution of Walleye lakes, as identified by MDNR survey data and staff
professional expertise, for each lake class emphasized in this plan. See Table 1 for habitat
descriptions for each lake class.

13
Lakes in classes 4, 5 and 6 tend to be smaller and shallower and have relatively
intermediate-to-warmer mean temperatures in the epilimnion compared to lakes in class 3.
However, lakes in classes 4, 5, and 6 are found primarily in the northern portion of the state
where the cooler climate results in a relatively low number of degree days, making them
moderately suitable for Walleye. Despite the relatively marginal habitat suitability based on lake
size and depth, natural reproduction does occur in several lakes within these classes, with classes
4 and 6 having similar levels of consistent and variable natural reproduction (Figure 5). The
majority of lakes in class 5 do not support consistent natural reproduction, but instead primarily
have variable or no Walleye natural reproduction. Class 4, 5, and 6 lakes are distributed across
the Upper Peninsula, with class 5 also being common in the higher elevation region of the
Northern Lower Peninsula (Figure 5). Warmwater species such as Largemouth Bass and
Bluegill are common in these lakes and predation or competition will likely affect the success of
Walleye management efforts, such as stocking to enhance Walleye populations.
Lakes in class 2 have a larger surface area (>400 acres) which results in slightly cooler
mean temperatures in the epilimnion. The lakes in this classification represent unique
opportunities for Walleye in the southern Lower Peninsula because of their large size and cooler
temperatures, relative to other lakes in similar latitudes. Similar to class 6, lakes in class 2 are
primarily maintained through inconsistent natural reproduction and stocking because the
majority of these waters are unable to annually support reliable natural reproduction (Figure 4).
Lakes in class 2 are dominated by warmwater species such as Largemouth Bass and Bluegill, but
often also support cool-water species such as Yellow Perch, Northern Pike, Rock Bass, and
Smallmouth Bass (Wehrly et al. 2012). Fisheries managers will have to critically consider the
habitat types and diversity of the fish community when making management decisions for lakes
14
within this classification because all these factors add complexities that influence the likelihood
of achieving desired management goals. Despite those complexities, these lakes can also provide
unique Walleye fishing opportunities in southern Michigan where those fisheries are relatively
limited.
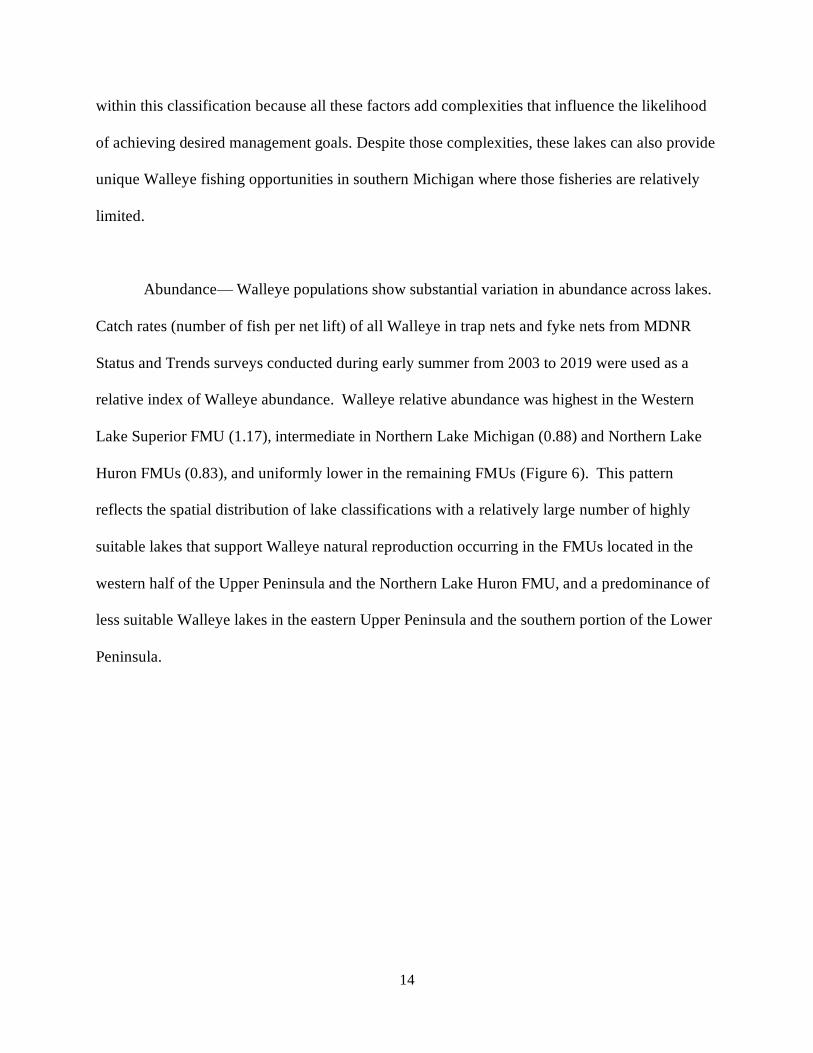
Abundance— Walleye populations show substantial variation in abundance across lakes.
Catch rates (number of fish per net lift) of all Walleye in trap nets and fyke nets from MDNR
Status and Trends surveys conducted during early summer from 2003 to 2019 were used as a
relative index of Walleye abundance. Walleye relative abundance was highest in the Western
Lake Superior FMU (1.17), intermediate in Northern Lake Michigan (0.88) and Northern Lake
Huron FMUs (0.83), and uniformly lower in the remaining FMUs (Figure 6). This pattern
reflects the spatial distribution of lake classifications with a relatively large number of highly
suitable lakes that support Walleye natural reproduction occurring in the FMUs located in the
western half of the Upper Peninsula and the Northern Lake Huron FMU, and a predominance of
less suitable Walleye lakes in the eastern Upper Peninsula and the southern portion of the Lower
Peninsula.

15
Figure 6. Mean Walleye catch rates in trap and fyke nets used in Status and Trends surveys
conducted from 2002-2019 for each Fisheries Management Unit. Error bars represent 1 standard
error.
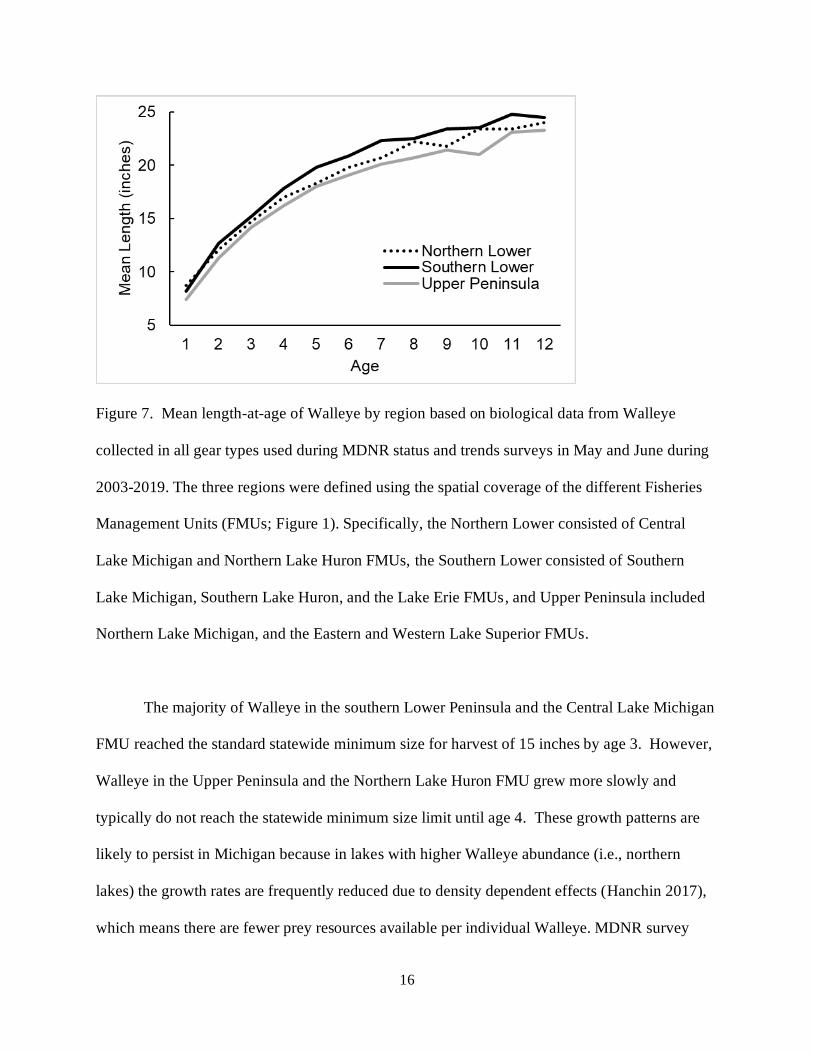
Growth and Size Structure—Mean length-at-age and length data from inland lake Status
and Trends surveys 2002-2019 was used to characterize patterns of Walleye growth and size
structure. Walleye growth rates were associated with latitude and the slowest growth occurs in
populations in the Upper Peninsula, intermediate in the northern Lower Peninsula, and highest in
the southern Lower Peninsula (Figure 7). The same general pattern exists for overall size
structure with larger fish on average in southern portions of the state and smaller fish on average
in northern latitudes (Figure 7).
16
Figure 7. Mean length-at-age of Walleye by region based on biological data from Walleye
collected in all gear types used during MDNR status and trends surveys in May and June during
2003-2019. The three regions were defined using the spatial coverage of the different Fisheries
Management Units (FMUs; Figure 1). Specifically, the Northern Lower consisted of Central
Lake Michigan and Northern Lake Huron FMUs, the Southern Lower consisted of Southern
Lake Michigan, Southern Lake Huron, and the Lake Erie FMUs, and Upper Peninsula included
Northern Lake Michigan, and the Eastern and Western Lake Superior FMUs.
The majority of Walleye in the southern Lower Peninsula and the Central Lake Michigan
FMU reached the standard statewide minimum size for harvest of 15 inches by age 3. However,
Walleye in the Upper Peninsula and the Northern Lake Huron FMU grew more slowly and
typically do not reach the statewide minimum size limit until age 4. These growth patterns are
likely to persist in Michigan because in lakes with higher Walleye abundance (i.e., northern
lakes) the growth rates are frequently reduced due to density dependent effects (Hanchin 2017),
which means there are fewer prey resources available per individual Walleye. MDNR survey
17
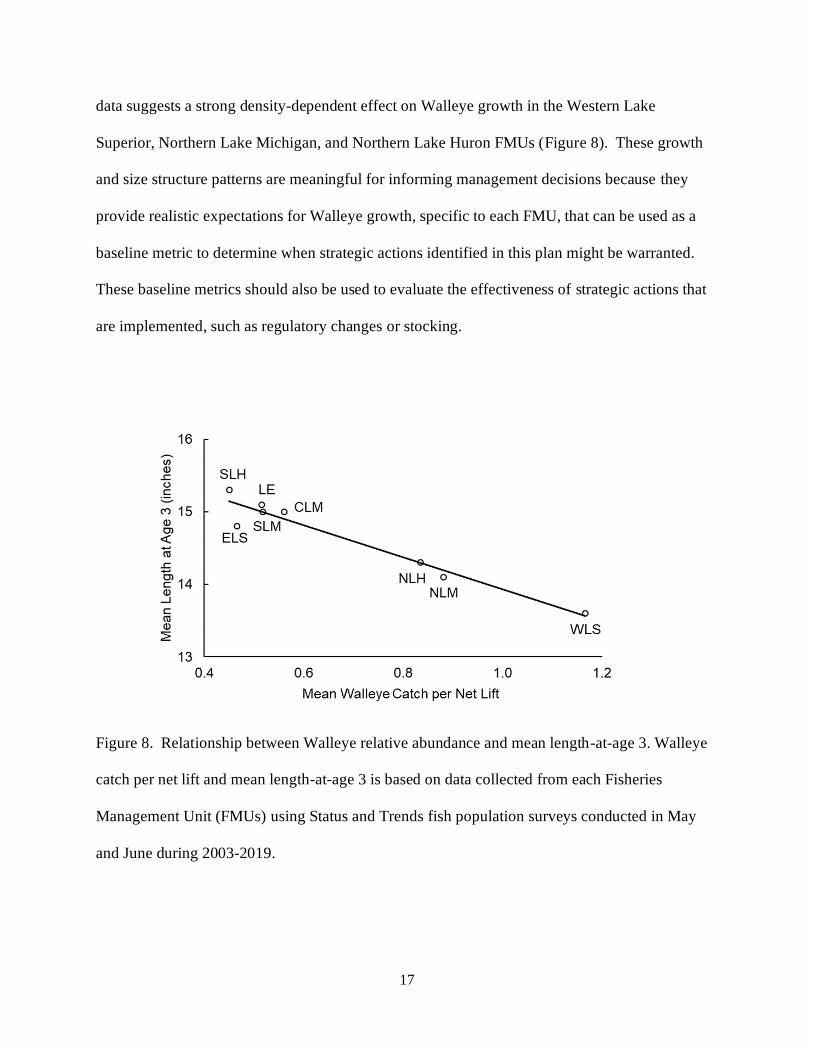
data suggests a strong density-dependent effect on Walleye growth in the Western Lake
Superior, Northern Lake Michigan, and Northern Lake Huron FMUs (Figure 8). These growth
and size structure patterns are meaningful for informing management decisions because they
provide realistic expectations for Walleye growth, specific to each FMU, that can be used as a
baseline metric to determine when strategic actions identified in this plan might be warranted.
These baseline metrics should also be used to evaluate the effectiveness of strategic actions that
are implemented, such as regulatory changes or stocking.
Figure 8. Relationship between Walleye relative abundance and mean length-at-age 3. Walleye
catch per net lift and mean length-at-age 3 is based on data collected from each Fisheries
Management Unit (FMUs) using Status and Trends fish population surveys conducted in May
and June during 2003-2019.

18
Community role – Adult Walleye are a top predator, with a flexible feeding strategy
(summarized by Chipps and Graeb 2011), allowing them to feed on a wide variety of prey
organisms across various habitats. In addition to foraging on small fishes, Walleye are also
known to feed on crayfishes and aquatic invertebrates (e.g., Herbst et al. 2016). As such,
management efforts taken to maintain or enhance Walleye populations have the capacity to alter
the density and size structure of panfish such as Yellow Perch, Bluegill and other panfish, forage
fish including minnows and shad, and non-native prey such as Rainbow Smelt and Round
Gobies (Krueger and Hrabik 2005; Schneider and Lockwood 1997; Schneider 1995). Their
impact on prey fishes further has the potential for affecting the trophic cascade in lakes, leading
to effects on the base of the food web (e.g., zooplankton and algal communities) within lakes
(Krueger and Hrabik 2005).
Walleye are also affected by lower trophic levels. For example, newly hatched Walleye
(i.e., fry) depend on abundant zooplankton resources for early growth and survival. Many
factors affect zooplankton abundance and size structure, but basic limnological productivity is a
critical determinant. The introduction and proliferation of Zebra and Quagga Mussels in
Michigan’s inland lakes has emerged as a contributing factor that limits zooplankton abundance,
and therefore has the potential to reduce natural recruitment of Walleye (MacWilliams 2013,
MDNR unpublished data). The pattern of reduced recruitment resulting from aquatic invasive
species (AIS) establishments is not unique to Michigan. Walleye populations in other Great
Lakes states and provinces have also been negatively influenced (Hansen et al. 2020; Chu et al.
2004). As such, Walleye management needs to account for limitations imposed by aquatic
invasive species and potential benefits resulting from prevention and control efforts.
19
Angler Behavior and Perceptions
Angler behaviors and perceptions are important considerations when making fisheries
management decisions. The MDNR has relied on two survey types of licensed anglers to collect
this information: (1) a long-term (2008 to 2018) mail survey distributed monthly to a random
sample of licensed anglers, and (2) an internet survey conducted in 2019 of licensed anglers that
provided their email address to the MDNR. These surveys were used to provide representative
information from Michigan anglers. In addition to these surveys, the MDNR also gathers
information through various stakeholder groups and committees along with feedback provided
by individual anglers when considering management issues.
The long-term mail survey provided information on fishing activities and angler
behaviors over the past 12 months as well as details about an angler’s most recent fishing trip.
Not all surveyed anglers fished in the past 12 months (~5% had not fished), so information from
anglers that did fish was used to summarize angler behavior for the purpose of informing
management strategies in this plan. Of active anglers, 47% of licensed anglers indicated they
targeted Walleye at least one time in the previous 12 months and 15% of anglers targeted
Walleye on their most recent fishing trip. Of these, 74% were to lakes (inland and Great Lakes)
and 26% were to rivers, with most trips occurring between late Spring and early Fall (~85% from
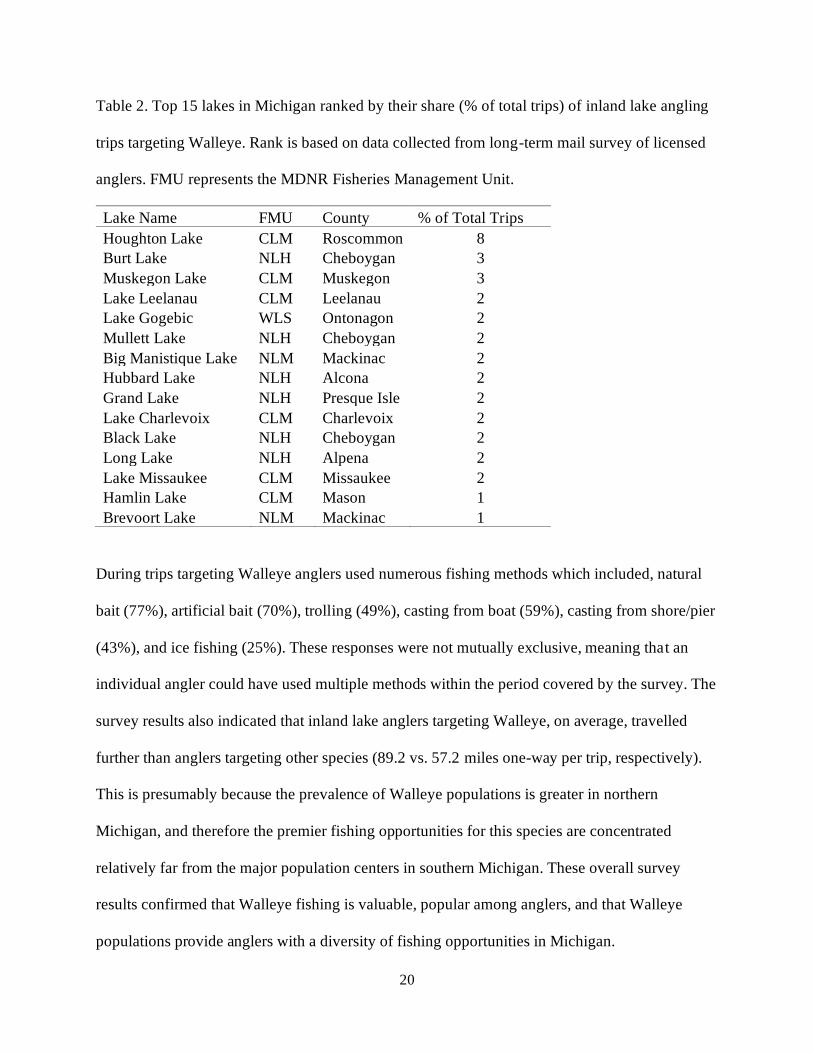
April to October). Anglers targeted Walleye at 465 unique lakes in Michigan. However, eight
lakes accounted for 25% of Walleye trips, 15 lakes accounted for 36% of trips (Table 2), and 108
lakes accounted for roughly 75% of overall trips targeting Walleye. The remaining 25% of trips
were distributed across over 350 lakes.
20
Table 2. Top 15 lakes in Michigan ranked by their share (% of total trips) of inland lake angling
trips targeting Walleye. Rank is based on data collected from long-term mail survey of licensed
anglers. FMU represents the MDNR Fisheries Management Unit.
Lake Name FMU County % of Total Trips
Houghton Lake CLM Roscommon 8
Burt Lake NLH Cheboygan 3
Muskegon Lake CLM Muskegon 3
Lake Leelanau CLM Leelanau 2
Lake Gogebic WLS Ontonagon 2
Mullett Lake NLH Cheboygan 2
Big Manistique Lake NLM Mackinac 2
Hubbard Lake NLH Alcona 2
Grand Lake NLH Presque Isle 2
Lake Charlevoix CLM Charlevoix 2
Black Lake NLH Cheboygan 2
Long Lake NLH Alpena 2
Lake Missaukee CLM Missaukee 2
Hamlin Lake CLM Mason 1
Brevoort Lake NLM Mackinac 1
During trips targeting Walleye anglers used numerous fishing methods which included, natural
bait (77%), artificial bait (70%), trolling (49%), casting from boat (59%), casting from shore/pier
(43%), and ice fishing (25%). These responses were not mutually exclusive, meaning that an
individual angler could have used multiple methods within the period covered by the survey. The
survey results also indicated that inland lake anglers targeting Walleye, on average, travelled
further than anglers targeting other species (89.2 vs. 57.2 miles one-way per trip, respectively).
This is presumably because the prevalence of Walleye populations is greater in northern
Michigan, and therefore the premier fishing opportunities for this species are concentrated
relatively far from the major population centers in southern Michigan. These overall survey
results confirmed that Walleye fishing is valuable, popular among anglers, and that Walleye
populations provide anglers with a diversity of fishing opportunities in Michigan.

21
The internet survey of anglers provided additional information related to angler behaviors
and perceptions that provided the MDNR with insights into potential management goals,
strategies, and regulatory options. This survey was marketed as a Walleye angler survey that was
meant to inform the development of this plan, and therefore is likely less representative of all
Michigan anglers and instead more representative of active or dedicated Walleye anglers that
provided their email addresses to the MDNR. This presumption was corroborated by responses
that indicated the majority (89%) of respondents fished for Walleye in the last 12 months and
57% indicated Walleye fishing was their most important fishing activity, which was greater than
responses for the long-term mail survey.
The internet survey provided angler perceptions on characteristics of “successful”
Walleye angling trips that can be used as metrics to evaluate management actions. Specifically,
the internet survey indicated that approximately 66% of anglers mostly or always harvest the
legal sized Walleye. In addition, approximately 45% of anglers responded that a successful
inland Walleye fishing trip meant catching three or more fish, while roughly 19% indicated that
five or more fish would need to be caught to be considered a successful trip. In addition, when
considering a successful trip based solely on the size of fish caught, about 41% of anglers said a
successful trip would be catching Walleye with an average size of 17 inches, whereas lesser
percentages (23 and 4%) indicated a greater average size (19 and 22 inches) would be required
for a successful trip. Finally, to help gauge success of Walleye management, the MDNR
commonly seeks angler feedback regarding their satisfaction. The internet survey illustrated that
the level of satisfaction with Michigan Walleye opportunities was relatively balanced with most
anglers indicating neutral satisfaction and about the same levels of satisfaction as dissatisfaction.
22
Management goals in this plan are diverse and understanding public perceptions on how
to achieve those goals with angler support is essential. The internet survey provided useful
information for fisheries managers that will be used to inform the strategic actions described
within this plan. For example, the survey indicated that if “trophy” management is the goal then
strategies need to produce 25-inch Walleye in inland waters to align with angler perceptions for
trophy management. Alternatively, communications strategies would need to be implemented to
educate anglers, so expectations align more appropriately with realistic growth and size structure
metrics for Walleye populations in inland waters. Additionally, when considering other Walleye
management goals, the internet survey indicated that about 75% of anglers were somewhat or
strongly supportive of restrictive Walleye regulations in locations where Walleye are stocked as
a predatory biocontrol to promote panfish size structure. Similarly, 75% of respondents
supported restrictive regulations to protect naturally reproducing Walleye populations.
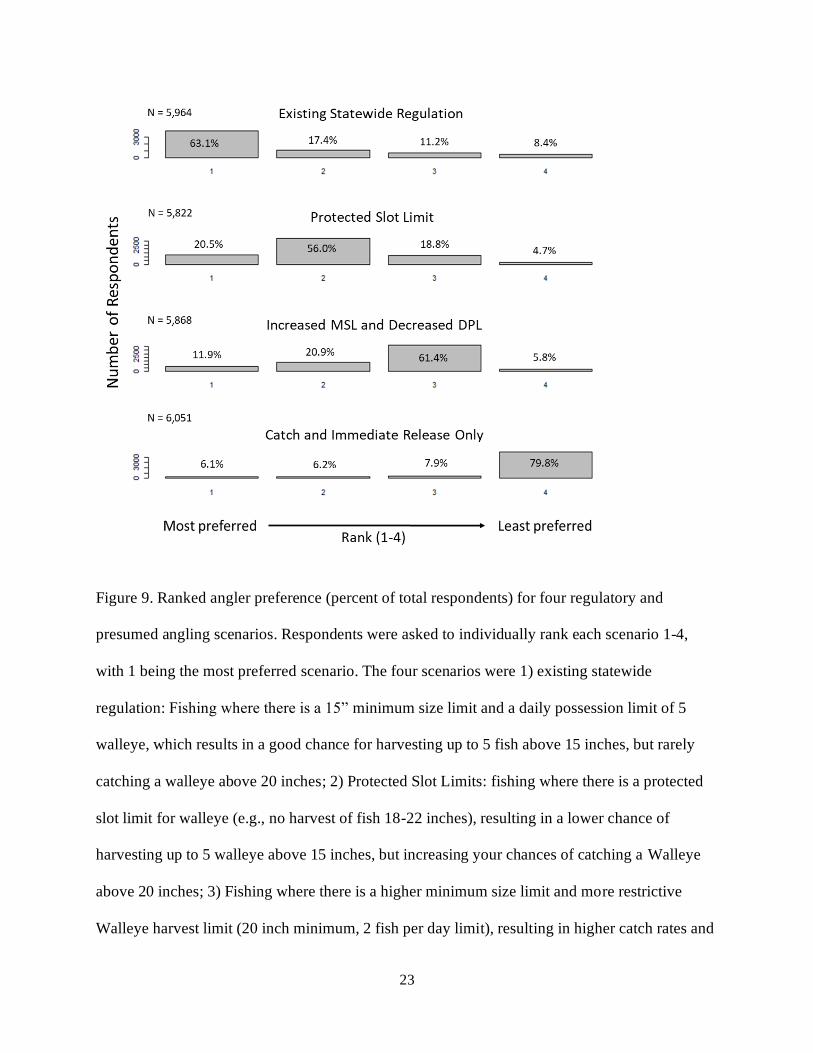
Furthermore, the internet survey provided useful results of what anglers generally prefer in terms
of angling experiences and regulations. Specifically, anglers were asked to rank four specific
regulatory scenarios and were linked with unique trip characteristics (Figure 9) and the rankings
revealed a clear preference (63.1% of respondents) for the existing statewide regulation (i.e., 15-
inch min. size limit and five fish daily possession limit), followed by 20.5% of respondents that
selected using protected slot limits as their most preferred regulatory option. There was little
preference (6.1%) for imposing catch and release to improve catch rates and the potential to
catch a trophy sized fish, which is likely driven by overall angler preference for harvesting legal
size Walleye.
23
Figure 9. Ranked angler preference (percent of total respondents) for four regulatory and
presumed angling scenarios. Respondents were asked to individually rank each scenario 1-4,
with 1 being the most preferred scenario. The four scenarios were 1) existing statewide
regulation: Fishing where there is a 15” minimum size limit and a daily possession limit of 5
walleye, which results in a good chance for harvesting up to 5 fish above 15 inches, but rarely
catching a walleye above 20 inches; 2) Protected Slot Limits: fishing where there is a protected
slot limit for walleye (e.g., no harvest of fish 18-22 inches), resulting in a lower chance of
harvesting up to 5 walleye above 15 inches, but increasing your chances of catching a Walleye
above 20 inches; 3) Fishing where there is a higher minimum size limit and more restrictive
Walleye harvest limit (20 inch minimum, 2 fish per day limit), resulting in higher catch rates and
24
an above average chance of catching a trophy, but would limit your ability to harvest many
Walleye; and 4) Fishing where there is a catch-and-release only regulation for Walleye, resulting
in highest possible catch rates and highest chance of catching a trophy, but prohibiting your
ability to keep fish for eating or to mount as a trophy. MSL = minimum size limit and DPL =
daily possession limit. N represents the total number of angler responses received for each
scenario from an internet survey conducted by the MDNR in 2019.
History of Walleye Management in Michigan
Biological assessments
Walleye are an actively managed fish species in Michigan because of their popularity
among recreational and tribal fishers and because of their role as a top predator. As such, many
types of biological assessments have been implemented during the history of Walleye
management in Michigan. These surveys are conducted to collect information on population
demographics to address various management goals, and those survey types are described in
more detail below.
Population estimates
Spring mark-recapture surveys are conducted to quantify abundance, growth rate, mortality rate,
and size structure of adult Walleye populations. Data collected using this protocol when
combined with a creel survey, or angler tag returns if fish were marked with a uniquely
identifiable tag, can also be used to estimate angler exploitation rates. Surveys conducted using
these standardized protocols provide a robust means to assess the status of Walleye populations
in individual waterbodies, and allows for population level comparisons among lakes.
25
Recruitment surveys
Fall shoreline electrofishing surveys are used to index juvenile Walleye year-class
strength and to determine the primary recruitment source of populations (i.e., stocked vs. natural
reproduction). Juvenile Walleye (i.e., young-of-year (YOY) and yearling < 15 in.) are collected
at night during the fall using an electrofishing boat because Walleye are more likely to be
concentrated near shore during this timeframe. The number of age-0 and age-1 Walleye
collected per mile of electrofishing is used as an index of relative abundance. Measures of
relative abundance from individual lakes can then be compared to reference points to predict
year class strength (Ziegler and Schneider 2000), but the relationship between year class strength
and juvenile catch rates is often variable or weakly related, and therefore can be uninformative.
This is an area of research that could result in determining new methods to better predict year
class strength, which would inform management decisions related to stocking. Primary
recruitment source can also be determined by sampling juvenile Walleye in non-stocked years or
by utilizing a distinguishable and permanent mark (i.e., oxytetracycline or OTC) that is applied
to Walleye fry during stocked years. Fall electrofishing surveys can be used to evaluate stocking
efforts and determine occurrence and relative contribution of natural reproduction. Results from
these efforts can then be used to adjust stocking rates, determine stocking priorities, and evaluate
the effects of environmental and habitat conditions on Walleye recruitment.
Large lake surveys
A survey program of large (>1,000 acres) lakes was initiated by the MDNR - Fisheries
Division in 2001 with the primary goal of developing and refining an assessment and monitoring
program for highly valued game fish species. Twenty-two lakes were surveyed from 2001–2010
targeting Walleye, Northern Pike (Esox lucius), Smallmouth Bass (Micropterus dolomieu), and
26
Muskellunge (Esox masquinongy). The main objectives of the program were to estimate
abundance, growth, mortality and harvest of these species in each of these lakes, and to compare
various methods for estimating abundance and exploitation. Individual reports were published
for each lake and a final report synthesized results from the first 10 years of study (Hanchin
2017). The final report provided recommendations on methods for estimating Walleye
abundance and provided useful insights on angler behavior, exploitation, and regulations for
many of the large and frequently fished lakes in Michigan.
Status and Trends surveys
Fisheries Division started to implement the Inland Lake Status and Trends Program
(ILSTP) in 2002 (Hayes et al. 2003). The objectives of the ILSTP are to 1) maintain a
comparable inventory of inland habitat and fish community characteristics statewide; 2) develop
reference points for local, regional, and statewide management needs; and 3) to assess the status
of, and detect changes to, aquatic habitats and fish communities across Michigan. The ILSTP
surveys aquatic habitats and fish communities using standardized methods (Wehrly et al. in
press) in randomly selected lakes that are representative of the broad range of waters found in
Michigan. Status and Trends fish surveys are conducted in early summer and can be used to
evaluate relative abundance (catch per unit effort), growth rate, and size structure of adult
Walleye populations. Limnology surveys are conducted in late summer and can be used to
evaluate chemical, physical, and biological habitat characteristics. Walleye population and
habitat characteristics collected using ILSTP methods from an individual lake can be compared
to statewide and FMU reference points summarized in Wehrly et al. (2015) to determine if
management efforts are achieving desired outcomes.

27
Stocking
Walleye stocking has been used as a management tool in Michigan since 1882, and this
activity continues to be a significant aspect of current Walleye management strategies to create
new fisheries, rehabilitate populations, enhance small populations, and as a predatory control for
abundant and slow-growing panfish populations. Walleye production, on average over the past
decade, has provided approximately 10.5 million Walleye annually for stocking efforts at an
average annual cost of approximately $330,600. These estimates include the stocking of all life
stages in lakes and rivers by MDNR, but excludes those waters stocked exclusively under private
permit or by tribal co-managers.
Walleye stocking was a common practice statewide in the early stages of MDNR
Fisheries Division (pre-1950). In fact, fry stocking occurred at many lakes during this period
because originally the state had relatively few inland waters with Walleye populations. As time
progressed and scientific knowledge increased, so did the Michigan stocking program. The
MDNR began to enhance capacity by working with partners to build and maintain state- and
privately-owned Walleye rearing ponds to satisfy the growing desire for Walleye stocking
among Michigan’s anglers.
Interest in Walleye stocking surged in the 1970s through 1990s as spring fingerling
production was improved. Stocking was conducted using a trial and error approach for many
waterbodies during this period and this continued for numerous years. Although these efforts
sometimes created naturally reproducing populations, many stocking efforts failed to create a
fishery. As additional information was gained on the effectiveness of Walleye stocking efforts,
the MDNR Walleye stocking strategies have been refined to maximize the return on investment
and the likelihood of achieving the management goal associated with any given Walleye

28
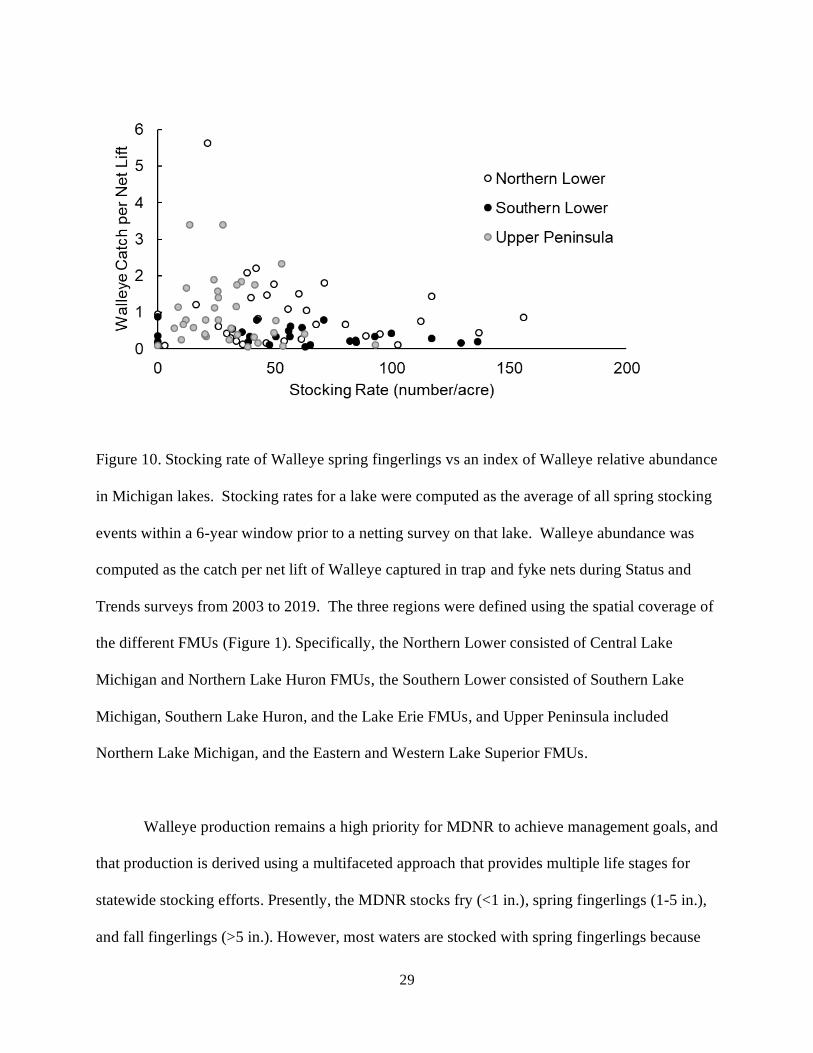
stocking effort. For example, stocking densities have been refined over the years based on results
indicating that increased stocking densities have not resulted in proportional increases in relative
Walleye abundance (Figure 10). Additionally, stocking has been eliminated on many waters after
several attempts that did not result in creating a sustainable fishery. In addition, in more recent
years the MDNR has needed to be more strategic by accounting for the tradeoffs between the
cost of increased stocking rates and the expected contribution to a fishery because reduced
budgets no longer allow for the extensive stocking activities that were historically common.
Mechanisms describing historic stocking failures in Michigan waters were not always evaluated,
but there is now robust information that provides guidance and criteria for how to increase the
likelihood of stocking success (e.g., Raabe et al. 2019). During the creation of this plan, MDNR
updated Walleye stocking guidelines to incorporate the current knowledge base related to how to
maximize the success of stocking efforts and that guidance is further described in Appendix B.
29
Figure 10. Stocking rate of Walleye spring fingerlings vs an index of Walleye relative abundance
in Michigan lakes. Stocking rates for a lake were computed as the average of all spring stocking
events within a 6-year window prior to a netting survey on that lake. Walleye abundance was
computed as the catch per net lift of Walleye captured in trap and fyke nets during Status and
Trends surveys from 2003 to 2019. The three regions were defined using the spatial coverage of
the different FMUs (Figure 1). Specifically, the Northern Lower consisted of Central Lake
Michigan and Northern Lake Huron FMUs, the Southern Lower consisted of Southern Lake
Michigan, Southern Lake Huron, and the Lake Erie FMUs, and Upper Peninsula included
Northern Lake Michigan, and the Eastern and Western Lake Superior FMUs.
Walleye production remains a high priority for MDNR to achieve management goals, and
that production is derived using a multifaceted approach that provides multiple life stages for
statewide stocking efforts. Presently, the MDNR stocks fry (<1 in.), spring fingerlings (1-5 in.),
and fall fingerlings (>5 in.). However, most waters are stocked with spring fingerlings because
30
that life stage is typically easy to produce in large quantities and are relatively cost-effective after
considering desired stocking densities and post-stocking survival rates. To sustain production
and genetic integrity, Walleye eggs are obtained from wild populations in the Muskegon River
and Little Bay de Noc because they represent genetically distinct populations that are viewed as
representative of populations inhabiting the different peninsulas (see Appendix C). Walleye egg-
take occurs in early spring as returning adults congregate on spawning grounds. The collected
eggs are then sent to one of the three MDNR fish hatcheries with cool-water programs (i.e.,
Thompson State Fish Hatchery, Wolf Lake State Fish Hatchery, and Platte River State Fish
Hatchery) to further develop prior to stocking. After the fry emerge in the hatcheries, they are
then stocked into ponds to grow to the desired stocking size. FMUs are responsible for operating
their own Walleye rearing ponds or shares those duties with other FMUs. In addition, there are
many Walleye ponds owned by external groups with rearing being a collaborative effort between
the public and Fisheries Division.
Walleye produced in these rearing ponds are shared across FMUs as a statewide resource
and are stocked in accordance with MDNR’s Fish Stocking Guidelines, an approved stocking
prescription per Fisheries Division Policy 02.02.019 Development of Fish Stocking
Recommendations, and the Strategy for Stocking Walleyes from Various Brood Source Locations
(Appendix C). In most instances, Walleye from the rearing ponds are stocked into inland lakes or
rivers as spring fingerlings in late May or June. Several ponds are also used to produce fall
fingerlings, which have recently had increased interest from managers because fall fingerlings
are larger and lower stocking densities are required because this life stage typically has higher
post-stocking survival rates (Raabe et al. 2019). The relatively high cost and space needed for
raising fall fingerlings compared to the other life stages results in a lower number of fall
31
fingerlings being available each year, and therefore stocking this life stage is currently relatively
rare in Michigan. Recently MDNR received legislative funding to address space limitations for
Walleye production. In 2020 this funding was used to construct rearing ponds at Thompson State
Fish Hatchery that are estimated to annually produce approximately 250,000 Walleye spring
fingerlings. The new rearing ponds will be a reliable state-owned resource that will
accommodate additional Walleye production and will assist with meeting the demands for
statewide Walleye stocking efforts beginning in 2021.
Regulations
A primary mechanism for protecting and conserving Walleye populations in Michigan is
the use of regulations to limit harvest. Regulatory actions have primarily been implemented to
attempt to protect aggregations of spawning fish, influence population size structure, distribute
harvest equitably, and promote sportsmanship (Schneider et al. 2007). Regulations have evolved
considerably over the last 150 years in response to increases in fishing effort, real or perceived
depletion of fish stocks, gains in science-based information, and changing angler values through
time (Schneider et al. 2007). Current regulations prohibit the commercial harvest of Walleye in
all Michigan waters, meaning that Walleye is a species regulated solely as a recreational fishery.
Walleye populations in Michigan have historically been managed using a range of
regulatory frameworks. In more recent decades, however, Walleye are primarily managed using
consistent, statewide regulations that varies between Michigan’s peninsulas only for the opening
date of the possession season. It should be noted that a relatively few regulatory exemptions to
the statewide norm exist, but those are critically reviewed, supported by biological and/or social
science rationale, and approved by the Natural Resources Commission. The current statewide
regulation for Walleye dates to 1976 and consists of a five fish daily possession limit and a 15-

32
inch minimum size limit (Schneider et al. 2007). The biological justification for this regulation is
associated with the desire to protect juvenile Walleye from harvest prior to maturity and allow
for harvest opportunities of adults that align with sustainable mortality rates. In addition, the
statewide regulations consist of a closed possession season in both peninsulas to provide
protection from harvest during most, if not the entire spawning season when the species is
typically aggregated and vulnerable to harvest. Prior to 1987, the opening possession season date
for fishing inland waters for Walleye in both the Lower and Upper Peninsulas of Michigan was
May 15. This was changed to the last Saturday in April for the Lower Peninsula in 1987 by the
MDNR since it was believed that the delayed possession season was overly restrictive for most
Lower Peninsula inland waters. This regulation remains in place today for the Lower Peninsula,
and past Walleye surveys have shown that most Walleye populations are done spawning by the
end of April. For extra protection, some vulnerable spawning Walleye populations in the
northern Lower Peninsula have an opening fishing date that is May 15. These regulatory
exceptions are implemented using spawning closures and typically involve rivers with
documented spawning activity. Catch-and-immediate-release fishing for Walleye outside of the
possession season is not permitted and predominately lacks support from anglers (Figure 9).
Statewide regulations in the Lower and Upper Peninsula have been deemed sufficiently
conservative to protect most Walleye populations from overfishing. However, recommendations
of other regulatory options that achieve the various management goals in this plan could be
warranted when sufficient data is available to justify an alteration, and when resources are
available to implement robust evaluations to determine if desired outcomes are being achieved.
Therefore, as part of this plan a regulatory toolbox (Appendix D) was created to provide fisheries
33
managers with a suite of regulatory options that can help achieve a variety of management
objectives.
Co-management with Tribes
The state of Michigan is responsible for co-managing inland Walleye fisheries with tribal
governments within treaty-ceded areas associated with the 1836 Treaty of Washington and 1842
Treaty of La Point (Figure 10). Co-management within the 1836 ceded territory was formalized
with the adoption of the 2007 Inland Consent Decree (United States v. Michigan, 2007) that
describes the agreed upon management approaches in that territory, but there is no formal legal
agreement in the 1842 ceded territory. Though co-management is implemented differently in the
1836 and 1842 ceded territories, the overall goal in both areas is to ensure that tribal members
can exercise their treaty rights while maintaining safe harvest levels and properly monitoring
Walleye populations to also support and maintain recreational opportunities for state-licensed
anglers.
In both the 1836 and 1842 ceded territories, Walleye are harvested by tribal and state
recreational fishers. The harvest limits, or quotas, are based on estimates of Walleye population
size. The estimates of population size rely on implementing a labor-intensive mark-recapture (M-
R) survey in the spring during the Walleye spawning season. It is not feasible to annually
estimate population size using M-R surveys for all lakes in the 1836 ceded territory because of
the large number of lakes and the substantial effort required, so when those estimates of
population size are unavailable the population size is predicted using a statistical model that
accounts for lake size and the reproductive status (i.e., natural reproduction or stocked) of a
population for each lake within the 1836 ceded territory. To address similar constraints in the
34
Michigan portion of the 1842 ceded territory, the tribal fishery agencies (Great Lakes Indian Fish
& Wildlife Commission (GLIFWC)) and MDNR have established a rotation to complete
population estimates on priority lakes once every five years. The highest priority lakes for
routine surveys are lakes that have relatively high harvest and fishing pressure. Based on an
agreement described within the 2007 Inland Consent Decree, Walleye harvest limits in lakes in
the 1836 ceded territory typically are set at or below 35% of the estimated adult Walleye
population size for each lake or system of interconnected lakes. However, the tribes can declare
intent to harvest up to 50% of the safe harvest level, which is defined as 17.5% of the adult
Walleye population each year. In the 1842 ceded territory, the tribal harvest declaration is
currently set at 10% of the estimated adult Walleye population.

35
Figure 10. A map delineating the treaty boundaries where the Michigan DNR and tribal agencies
co-manage Walleye populations.
Management Goals and Objectives:
The overarching goal of this management plan is to maximize angler satisfaction and
ecological benefits derived from Walleye fisheries. As stated in the introduction, MDNR
Fisheries Division has developed a set of specific goals to achieve this high-level goal. Under
36
each specific goal, there are objectives that are intended to provide concrete statements of
desired outcomes. MDNR Fisheries Division has also developed a set of recommended strategic
actions intended to guide management activities toward achievement of these objectives. These
strategic actions should be implemented using an adaptive management framework meaning they
are continually evaluated, refined and prioritized, within the fiscal and personnel limitations
experienced by the Fisheries Division.
Goal 1: Provide diverse opportunities for Walleye fishing
The majority of higher-quality inland Walleye populations are in the northern portion of
the state, thereby requiring increased travel costs for much of the angling populace. Efforts to
create and maintain quality Walleye angling opportunities throughout the state are desired to
better serve all anglers. Although this plan is focused on inland waters, Great Lakes, connecting
waters, and seasonal riverine fishing opportunities need be considered because those waters
provide some of the most desirable Walleye fisheries in Michigan. Challenges faced in
achieving this goal include natural variation in the ability of lakes to support self-sustaining or
stocked Walleye populations, as well as the threat that invasive species and climate change pose
to populations that are currently self-supporting. A primary tool for creating or enhancing
fishing opportunities is stocking, which entails a cost to the Fisheries Division, and for which the
return on investment needs to be considered when making management decisions. In addition,
adjusting fishing regulations is a management tool that can be implemented to achieve
population characteristics that align with diverse fisheries, but biological and social science
elements need to be reviewed when regulatory modifications are considered.
37
To achieve this goal, the Fisheries Division will pursue the following objectives
● Objective 1.1: Maintain and when feasible create Walleye populations to provide fishing
opportunities in such a manner that may reduce an angler’s need for long distance travel
to target Walleye.
● Objective 1.2: Provide and promote multiple fishery access types (boat, shore, ice) for
Walleye fisheries distributed throughout Michigan’s diverse assortment of inland waters
(rivers and lakes).
● Objective 1.3: Maintain unique fisheries that already exist within the state (e.g., lakes
with particular aesthetics, notably high catch rates)
The following management strategies are recommended to achieve this goal:
● Strategy 1.1: Use stocking, following guidance provided in Appendix D, to develop or
enhance Walleye populations. The waters selected for stocking will be chosen based on
suitability of habitat conditions to support adult Walleye, proximity to population centers,
and availability of nearby Walleye fishing opportunities. Efforts to develop or enhance
Walleye populations should be prioritized in lakes with suitable habitat (i.e., classes 2, 3,
5, and 6) and characterized as having variable or no natural reproduction.
● Strategy 1.2: In consultation with anglers, identify fisheries that are unique and of
unusually high value, and prioritize management actions at these locations to maintain
and protect the characteristics that make them desirable.
38
● Strategy 1.3: Develop a suite of regulatory options that align with differing management
objectives that are likely to result in diverse Walleye fisheries throughout the state (see
Appendix C).
Goal 2: Manage Walleye populations to achieve desirable fish community characteristics
The intent of this goal is to improve the success of Fisheries Division managers in using
Walleye to enhance fisheries and to structure fish communities through biomanipulation.
Walleye rank as one of the top predators used in biological control programs across North
America (Wiley and Wydoski 1993), and there is a long history of stocking and adjusting
regulations for Walleye to structure fish communities, much of it based on research conducted in
Michigan (e.g., Schneider 1997; Schneider and Lockwood 1997). Goals of these management
actions often include controlling some aspect of panfish population dynamics (Dexter and
O’Neal 2004; Wiley and Wydoski 1993). For example, predator stocking has been shown to
successfully alter Bluegill population attributes (O’Neal 2017; Santucci and Wahl 1993;
Schneider 1975; Forsythe and Wrenn 1979), and there is evidence for the importance of
predation by and on percids (e.g. Walleye, Yellow Perch, darters) in determining structure and
function of fish communities (MacLean and Magnuson 1977).
Mixed results have been documented when using Walleye stocking to structure or
manipulate fish communities. Increasing predation rates through Walleye stocking may make an
ecosystem more resistant and resilient to the effects of aquatic invasive species (Fielder 2004;
Krueger and Hrabik 2005). For example, Walleye stocking that results in robust adult
populations has contributed to suppressing populations of introduced non-native species, such as
Rainbow Smelt (Cwalinski 2010; Krueger and Hrabik 2005). In contrast, undesirable effects of
Walleye stocking can include the reduction in other stocked or native fish populations, especially
39
when alternate prey is scarce (Johnson et al. 2007). These potential outcomes are important to
consider, especially after recognizing that in Michigan Walleye are the most common species
stocked by the public under permit from the state. Therefore, it is important that private stocking
programs be conducted only after fisheries managers weigh possible long-term negative impacts
against intended benefits.
To achieve this goal, the Fisheries Division will pursue the following objectives:
● Objective 2.1: Retain Walleye stocking as a biocontrol option for improving growth rates
and size structure of panfish populations, but only in lakes that have suitable habitat for
adult Walleye.
● Objective 2.2: Adopt an adaptive management approach for using Walleye to control
invasive or undesirable aquatic species (e.g., Round Gobies, Rainbow Smelt, Gizzard
Shad, etc.).
● Objective 2.3: Limit state or private Walleye stocking efforts when there is the potential
to negatively impact other desirable fisheries or populations of species of concern (e.g.,
Yellow Perch, Cisco, salmonids).
The following management strategies are recommended to achieve this goal:
● Strategy 2.1: Inventory waters to determine waters where panfish management is desired
(i.e., systems with sub-optimal panfish populations, including Yellow Perch), and where
Walleye stocking would be an appropriate management tool to achieve goals for panfish
populations. These waters should not include locations where natural Walleye
reproduction occurs consistently.

40
● Strategy 2.2: Identify waters where Walleye stocking could be used to control invasive or
undesirable aquatic species. These waters should not include locations where natural
Walleye reproduction occurs consistently.
● Strategy 2.3: Develop a list of waters where Walleye stocking would be appropriate
because of suitable Walleye habitat. Furthermore, evaluate and refine stocking strategies
based on factors that influence stocking success to develop criteria for increasing efficacy
of future stocking efforts.
● Strategy 2.4: Develop materials to facilitate education of private groups as to the potential
advantages and disadvantages of Walleye stocking, and to the guidelines being used by
Fisheries Division to evaluate requests for private stocking.
Goal 3: Maintain and develop relations with tribal governments and stakeholders
The intent of this goal is to ensure open communication, regular engagement, and
positive relationships that will lead to improved transparency regarding Walleye management.
Several aspects of collaborative Walleye management are described in the 2007 Consent Decree
(United States v. Michigan 2007), such as estimating adult Walleye abundance, assessing
recruitment source, and setting harvest limits for specially regulated fishing methods. While the
framework is already in place to collaborate with tribal governments, further work needs to be
done to maintain and enhance relations with stakeholder groups. citizen advisory committees,
and anglers that are not part of an organized group.
Currently, the MDNR has formal and informal avenues to interact with stakeholders
about Walleye management. One formal venue for interacting with stakeholders about Walleye
management is the MDNR’s Warmwater Resources Steering Committee. While these
41
interactions have been effective, Walleye anglers are generally not organized into formal angling
groups which can be a challenge to efficient communication. As such, biologists also frequently
attempt to increase interactions with individual anglers, angler groups, and lake associations that
are not represented on the Warmwater Resources Steering Committee. This plan is expected to
provide benefits because it will be used as a communication tool to enhance clarity and
transparency regarding Walleye management goals and strategies with stakeholders at all levels
of engagement.
To achieve this goal, the Fisheries Division will pursue the following objectives:
● Objective 3.1: Actively partner with tribal governments to regularly assess and
collaboratively manage Walleye populations within the various treaty-ceded territories
(e.g. Walleye abundance estimates, recruitment evaluations, stocking contribution
evaluations, investigate early life history issues, determine harvest management
strategies).
● Objective 3.2. Garner support for initiatives and management concerns by engaging with
anglers, lake associations, citizen advisory groups, tournament directors, steering
committees, and stakeholder groups. (e.g. Northern Lakes Citizens Advisory Committee,
Warmwater Resources Steering Committee, Western Upper Peninsula Citizens Advisory
Committee, Walleyes for Tomorrow)
● Objective 3.3: Develop, maintain, and enhance new partnerships related to habitat
projects, stocking efforts, and regulation proposals (e.g. Walleye rearing ponds
management, private stocking proposals, special regulations).
42
The following management strategies are recommended to achieve this goal:
● Strategy 3.1: Annually meet with tribal partners to share work plans, stocking plans,
survey data, and to discuss proposed changes to management of Walleye populations.
● Strategy 3.2: Maintain and enhance a statewide database of Walleye population
estimates, stocking, and recruitment data with tribal partners.
● Strategy 3.3: Develop communication tools and promote stakeholder input related to
Walleye management issues and regulatory proposals.
● Strategy 3.4: Regularly promote management efforts, such as population and habitat
assessments, regulatory proposals and review, Walleye egg-takes, and stocking efforts to
communities and stakeholders.
● Strategy 3.5. Develop education and outreach materials that provides anglers with
information on when, where, and how to effectively target Walleye.
● Strategy 3.6: Maintain relationships with conservation groups to provide direction and
professional advice for effective operation of cooperative Walleye rearing ponds.
Goal 4: Maintain self-sustaining Walleye populations
In 2018, Fisheries Division released Charting the Course: Fisheries Division’s
Framework for Managing Aquatic Resources, which is the strategic plan for managing
Michigan’s Fisheries into the future. One of the goals identified was “Ensure Healthy Aquatic
Ecosystems and Sustainable Fisheries” with the objective to “conserve and manage aquatic
species and their habitats”. The strategy to achieve the goal was to focus on protecting and
enhancing natural reproduction of native and desirable naturalized aquatic species. Maintaining
self-sustaining Walleye populations falls within this strategy and is the most economical way to
43
manage Walleye populations. The MDNR emphasizes the importance of maintaining self-
sustaining Walleye populations because doing so reduces stocking costs while still providing
desirable fisheries.
Obstacles to achieving the goal of self-sustaining Walleye populations are overharvest,
habitat degradation or unsuitable habitat, and proliferation of aquatic invasive species. However,
there are many opportunities to overcome these obstacles. These include identifying,
maintaining, and increasing spawning and nursery habitats, maintaining natural shorelines to
reduce sedimentation of suitable spawning substrates, and keeping total annual mortality at
sustainable levels.
To achieve this goal, the Fisheries Division will pursue the following objective:
● Objective 4.1: Identify and maintain self-sustaining Walleye populations.
The following management strategies are recommended to achieve this goal:
● Strategy 4.1: Conduct statewide and targeted monitoring programs of self-sustaining
Walleye populations to determine persistence of natural reproduction. Management
actions should be implemented to address concerning population trends when they are
identified.
● Strategy 4.2: Utilize regulations and collaborate with tribal co-managers in treaty-
ceded waters to manage for sustainable harvest levels.
● Strategy 4.3: Implement and evaluate habitat protection or enhancement projects on
the relevant landscape scale (i.e., watershed, lake, and/or river) to maintain or
enhance naturally reproducing Walleye populations.
44
● Strategy 4.4: Do not recommend stocking Walleye in waters where Walleye are
already known to be consistently naturally reproducing and supporting a viable
fishery, based on available survey data or professional expertise of the managing
Fisheries Management Unit.
Goal 5: Provide production capacity for Walleye stocking
The intent of this goal is to maintain and enhance a network of Walleye rearing ponds
distributed throughout the state where disease-free, health-certified Walleye can be produced to
annually fulfill stocking requests at target levels. Artificial propagation of Walleye is a high
priority for MDNR because several goals described within this plan require the use of stocking.
To achieve this goal, the Fisheries Division will pursue the following objectives:
● Objective 5.1: Optimize survival per cost of stocked Walleye to increase the number
available for harvest in future years.
● Objective 5.2: Maintain the genetic integrity of Walleye populations that source the
annual egg-take operations.
● Objective 5.3: Produce Walleye that are certified as disease free prior to stocking.
● Objective 5.4: Maintain and enhance opportunities for private and tribal groups seeking
to help produce, stock, and evaluate Walleye stocking efforts that are focused on
achieving management goals described within this plan.
45
The following management strategies are recommended to achieve this goal:
● Strategy 5.1: Develop pond specific Walleye rearing protocols and routinely evaluate to
determine if refinements are necessary to achieve desired overall numbers produced,
survival rates, and costs of production and maintenance.
● Strategy 5.2: Develop a system of protocols for management implementation and
evaluation under the scenarios outlined in Strategies 2.1 – 2.3, to include characteristics
of life stage of Walleye stocked, stocking densities, evaluation period, and evaluation
parameters.
● Strategy 5.3: Update Fisheries Division’s Fish Stocking Guidelines to incorporate
protocols developed in Strategy 2.4.
● Strategy 5.4: Implement disinfection procedures, biosecurity measures, and disease
testing regimes to remain vigilant in raising disease certified and healthy stocks of
Walleye.
● Strategy 5.5: Maintain and foster relationships with university staff to enhance and
maintain genetic testing capacity to inform actions needed to maintain diverse and robust
wild broodstock populations.
● Strategy 5.6: Annually meet with peers and partners to share information on how to
maximize Walleye production to increase annual output.
● Strategy 5.7: Evaluate tribal and private partnerships to ensure that stocking efforts are
appropriate, are certified as disease free, and contribute to the fishery.

46
Goal 6: Protect, restore, or enhance habitats supporting Walleye fisheries
Habitat features frequently determine Walleye distribution and abundance, and as such
the purpose of this goal is to maintain and increase habitat required to support harvestable
populations of Walleye. Threats to achieving this goal include point-source and non-point-
source nutrient inputs, aquatic vegetation management, aquatic invasive species, climate change,
landscape development, and barriers including dams, lake-level-control structures, and culverts.
The tools for managing Walleye habitat include land acquisition/conservation easements,
watershed and AIS best-management practices, replacing leaking septic tanks, environmental
permit reviews, and removing barriers that limit accessibility to spawning habitats. Most of
these habitat management actions require participation by private landowners. Consequently, the
development of partnerships will be key to the successful maintenance, rehabilitation, and
protection of Walleye habitat.
To achieve this goal, the Fisheries Division will pursue the following
● Objective 6.1: Maintain and rehabilitate habitat to achieve suitable dissolved oxygen
levels and temperature ranges that are required to support Walleye populations.
● Objective 6.2: Maintain and restore connectivity of waters, including connections with
the Great Lakes, that support Walleye populations.
● Objective 6.3: Prioritize and protect high quality Walleye lakes (e.g., Class 3 lakes) with
a variety of measures such as conservation easements and increased prevention of
invasive species introductions.
● Objective 6.4: Review permits and provide guidance to limit negative effects of aquatic
vegetation management and other habitat manipulations on all life stages of Walleye.

47
The following management strategies are recommended to achieve this goal:
● Strategy 6.1: Identify and implement watershed and riparian best management practices
to reduce sedimentation and nutrient inputs. Prioritize lakes in Classes 2 and 3 for
protection and habitat rehabilitation because they tend to have the highest suitability
based on lake size and thermal regime. Evaluate whether lake size and thermal regime
may be limiting Walleye populations in Classes 5 and 6 before considering habitat
rehabilitation.
● Strategy 6.2: Implement AIS best management practices to reduce the likelihood of
introduction and spread as well as limit the ecological impacts of AIS establishments.
● Strategy 6.3: Participate in the environmental permit review process.
● Strategy 6.4: Seek external funding and prioritize internal opportunities (e.g., Fisheries
Habitat Grant program) to implement projects that result in Walleye habitat
enhancements.
References
Chipps, S.R., and B.D.S. Graeb. 2011. Feeding ecology and energetics. Pages 303-319 in B. A.
Barton, editor. Biology, management, and culture of Walleye and Sauger. American
Fisheries Society, Bethesda, Maryland.
Chu, C., C.K. Minns, J.E. Moore, and E.S. Millard. 2004. Impact of oligotrophication,
temperature, and water levels on Walleye habitat in the Bay of Quinte, Lake Ontario.
Transactions of the American Fisheries Society 133:868-879.
Colby, P. J., P. A. Ryan, D. H. Schupp, and S. L. Serns. 1987. Interactions in north-temperate
lake fish communities. Canadian Journal of Fisheries and Aquatic Sciences. 44:104-128.
Cwalinski, T. 2010. Beaver Lake. Michigan Department of Natural Resources and Environment,
Status of the Fishery Resource Report.
Dexter, J. L., Jr., and R. P. O’Neal, editors. 2004. Michigan Fish Stocking Guidelines. Michigan
Department of Natural Resources, Fisheries Special Report 32, Ann Arbor. Fielder, D. G., and J. P. Baker. 2004. Strategy and options for completing the recovery of
Walleye in Saginaw Bay, Lake Huron. Michigan Department of Natural Resources,
Fisheries Special Report 29, Ann Arbor.
48
Forsythe, T. S. and W. B. Wrenn. 1979. Predator-prey relationships among Walleye and bluegill.
Pages 475-482 Henry Clepper editor. Predator-prey systems in fisheries management.
Sport Fishing Institute, Washington D.C. Gustafson, C. 1996. Pond culture of Walleye in Michigan: fry to advanced fingerling. Pages 153-
155 in R.C. Summerfelt, editor. Walleye culture manual. NCRAC Culture Series #101,
NCRAC Publications Office, Iowa State University, Ames.
Hanchin, P. A. 2017. A summary and analysis of the Large Lakes Survey Program in Michigan
in 2001–2010. Michigan Department of Natural Resources, Fisheries Report 25, Lansing.
Hansen, G.J.A., J.W. Gaeta, J.F. Hansen, and S.R. Carpenter. 2015. Learning to Manage and
Managing to Learn: Sustaining Freshwater Recreational Fisheries in a Changing
Environment. Fisheries 40(2): 56-64.
Hansen, G. J. A., J. S. Read, J. F. Hansen, and L. A. Winslow. 2017. Projected shifts in sport fish
species dominance in Wisconsin lakes under climate change. Global Change Biology 23:
1463–1476
Hansen, G.J.A., T.D. Ahrenstorff, B.J. Bethke, J.D. Dumke, J. Hirsch, K.E. Kovalenko, J.F.
LeDuc, R.P. Maki, H.M. Rantala, and T. Wagner. 2020. Walleye growth declines
following zebra mussel and Bythotrephes invasion. Biological Invasions 22:1481-1495.
Hayes, D., and 14 co-authors. 2003. Developing a standardized sampling program: the
Michigan experience. Fisheries 28: 18-25.
Herbst, S. J., B.M. Roth, D.B. Hayes, and J.D. Stockwell, 2016. Walleye foraging ecology in an
interconnected chain of lakes influenced by nonnative species. Transactions of the
American Fisheries Society 145: 319-333.
Jackson, J. J., D. W. Willis, and D. G. Fielder. 1992. Food habits of young-of-the-year Walleye
in Okobojo Bay of Lake Oahe, South Dakota. Journal of Freshwater Ecology 7:329–341.
Jennings, M. J., J. E. Claussen, and D. P. Philipp. 1996. Evidence for heritable preferences for
spawning habitat between two walleye populations. Transactions of the American
Fisheries Society 125:978-982.
Johnson, J.E., S.P. DeWitt, and J.A. Clevenger. 2007. Causes of variable survival of Chinook
salmon in Lake Huron. Michigan Department of Natural Resources Fisheries Division,
Fisheries Research Report 2086.
Krueger, D.M., and T.R. Hrabik. 2005. Food web alteration that promote native species: the
recovery of cisco (Coregonus artedi) populations through management of native
piscivores. Canadian Journal of Fisheries and Aquatic Science 62: 2177-2188.
Lester, N.P., A.J. Dextrase, R.S. Kushneriuk, M.R. Rawson, and P.A. Ryan. 2004. Light and
temperature: Key factors affecting Walleye abundance and production. Transactions of
the American Fisheries Society. 133:588-605.
Lippert, K.A., J.M. Gunn, and G.E. Morgan. 2007. Effects of colonizing predators on yellow
perch (Perca flavescens) populations in lakes recovering from acidification and metal
stress. Canadian Journal of Fisheries and Aquatic Sciences. 64:1413-1428.
MacLean, J., and J.J. Magnuson. 1977. Species interactions in percid communities. Journal of
the Fisheries Research Board of Canada 34:1941-1951.
MacWilliams, R.D. 2013. Limitations of larval Walleye production in Michigan’s Inland
Waterway. Master’s thesis. Michigan State University, East Lansing, MI.
Northern Lake Michigan Management Unit (NLMMU) 2011. Walleye management guidelines
for the Northern Lake Michigan Management Unit, 2011-2016. Michigan Department of
Natural Resources – Fisheries Division, internal report.
49
O’Neal, R. P. 2017. Muskegon Lake 2015 and 2016 juvenile Walleye surveys. Michigan
Department of Natural Resources, Fisheries Division, Fish Information Collection
System, Lansing.
Raabe J.K., J.A. VanDeHey, D.L Zentner, T.K. Cross, and G.G. Sass. 2019. Walleye inland lake
habitat: considerations for successful natural recruitment and stocking in North Central
North America. Lake and Reservoir Management XX:XX–XX
Roth, B.M., T.R. Hrabik, C.T. Solomon, N. Mercado-Silva, and J.F. Kitchell. 2010. A simulation
of food-web interactions leading to rainbow smelt Osmerus mordax dominance in
Sparkling Lake, Wisconsin. Journal of Fish Biology 77:1379-1405.
Santucci, V. J., and D.H. Wahl. 1993. Factors influencing survival and growth of stocked
Walleye (Stizostedion vitreum) in a centrarchid-dominated impoundment. Canadian
Journal of Fisheries and Aquatic Sciences. 50:1548-1558. Schneider, J. C. 1975. Survival, growth and food of 4-inch Walleyes in ponds with invertebrates,
sunfishes or minnows. Michigan Department of Natural Resources, Fisheries Research
Report 1833, Ann Arbor.
Schneider, J. C. 1983. Experimental Walleye-perch management in a small lake. Michigan
Department of Natural Resources, Fisheries Research Report 1905, Ann Arbor. Schneider, J. C., and R. N. Lockwood. 1997. Experimental management of stunted bluegill lakes.
Michigan Department of Natural Resources, Fisheries Research Report 2040, Ann Arbor.
Schneider, J. C., R.P. O’Neal, and R.D. Clark, Jr. 2007. Ecology, management, and status of
Walleye, Sauger, and Yellow Perch in Michigan. Michigan Department of Natural
Resources, Fisheries Division Special Report 41, Ann Arbor.
Tsehaye, I., B.M. Roth, and G.G. Sass. 2016. Exploring optimal Walleye exploitation rates for
northern Wisconsin ceded territory lakes using a hierarchical Bayesian age-structured
model. Canadian Journal of Fisheries and Aquatic Sciences. 73:1413-1433.
United States v. Michigan, 2007. Consent Decree. United States District Court for the Western
District of Michigan File No. 2:73 CV 26.
Wahl, D.H., Einfalt, L.M., and M.L. Hooe. 1995. Effect of experience with piscivory on foraging
behavior and growth of Walleyes. Transactions of the American Fisheries Society. 124:
756–763.
Wehrly, K.E., G.S. Carter, and J.E. Breck. In press. Standardized sampling methods for the
inland lakes status and trends program. Michigan Department of Natural Resources,
Fisheries Special Report, Ann Arbor.
Wehrly, K.E., J.E. Breck, L. Wang, and L. Szabo-Kraft. 2012. Landscape-based classification
of fish assemblages in sampled and unsampled lakes. Transactions of the American
Fisheries Society 141:414-425.
Wehrly, K.E., D. Hayes, and T.C. Wills. 2015. Status and trends of Michigan inland lake
resources 2002-2007. Michigan Department of Natural Resources, Fisheries Report 08,
Lansing.
Wiley, R.W., and R.S. Wydoski. 1993. Management of undesirable fish species. In: Inland
Fisheries Management in North Amercia (eds. C.C. Kohler and W.A. Hubert), Bethesda,
Maryland, USA: American Fisheries Society.
Ziegler, W., and J.C. Schneider. 2000. Guidelines for evaluating Walleye and Muskie
Recruitment. Chapter 23 in Manual of Fisheries Survey Methods. Michigan Department
of Natural Resources, Fisheries internal document, Ann Arbor.

50

51
Appendices
Appendix A: Michigan’s Walleye Lakes
Table A-1. List of Walleye lakes classified based on stocking records, results of fisheries surveys
(2000-2019), and questionnaires completed by fisheries biologists from each Fisheries
Management Unit (FMU). FMU label abbreviations are as follows: Western Lake Superior =
WLS, Eastern Lake Superior = ELS, Northern Lake Michigan = NLM , Central Lake Michigan =
CLM, Southern Lake Michigan = SLM, Northern Lake Huron = NLH, Southern Lake Huron =
SLH, Lake Erie = LE. Natural reproduction categories 1 and 2 were defined as consistent natural
reproduction meaning a population persists and provides fishery without history of stocking or
persists despite discontinued stocking; 3 and 4 were defined variable natural reproduction
meaning a population produces a year class of natural reproduced Walleye too infrequently to
maintain a population without stocking, although a residual Walleye population may be
maintained and provide a marginal fishery; and 5 was defined as no natural reproduction
meaning persistence of a population and fishery is solely dependent on routine stocking. Lake
class refers to the six lake types in Michigan identified by Wehrly et al. (2012) based on fish
assemblages, lake size, and thermal regime. Predicted suitability of each lake ranged from 0
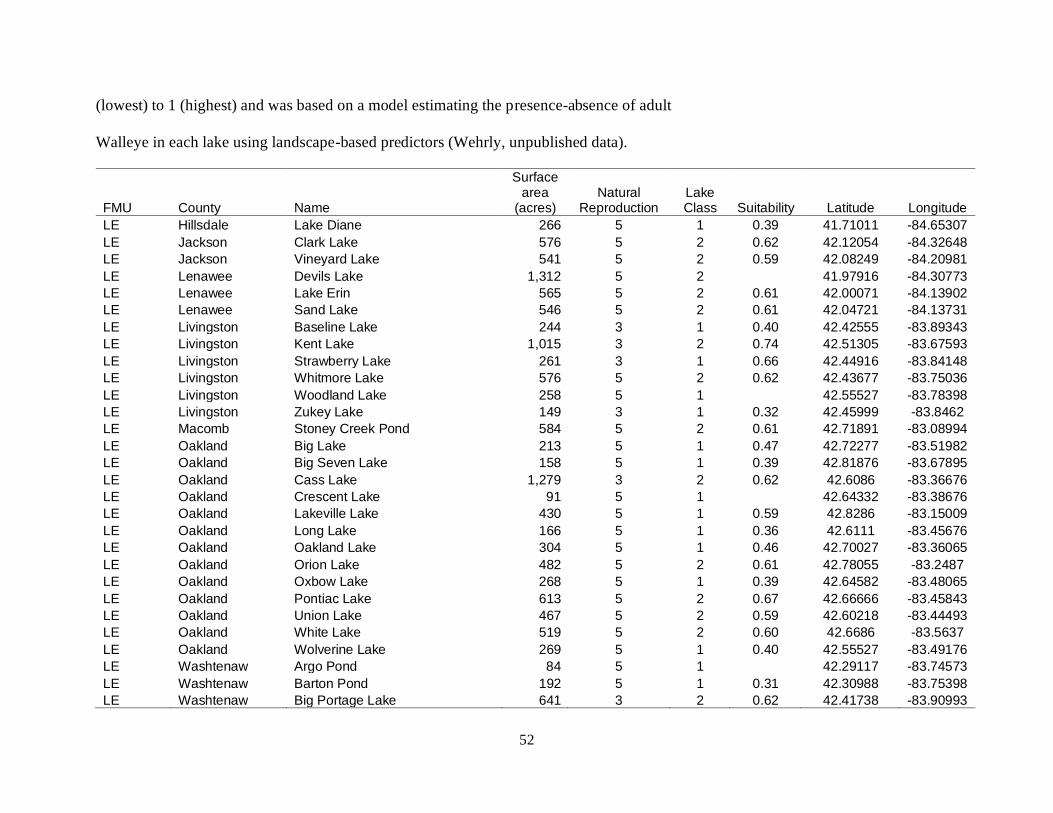
52
(lowest) to 1 (highest) and was based on a model estimating the presence-absence of adult
Walleye in each lake using landscape-based predictors (Wehrly, unpublished data).
FMU County Name
Surface area
(acres) Natural
Reproduction Lake Class Suitability Latitude Longitude
LE Hillsdale Lake Diane 266 5 1 0.39 41.71011 -84.65307
LE Jackson Clark Lake 576 5 2 0.62 42.12054 -84.32648
LE Jackson Vineyard Lake 541 5 2 0.59 42.08249 -84.20981
LE Lenawee Devils Lake 1,312 5 2 41.97916 -84.30773
LE Lenawee Lake Erin 565 5 2 0.61 42.00071 -84.13902
LE Lenawee Sand Lake 546 5 2 0.61 42.04721 -84.13731
LE Livingston Baseline Lake 244 3 1 0.40 42.42555 -83.89343
LE Livingston Kent Lake 1,015 3 2 0.74 42.51305 -83.67593
LE Livingston Strawberry Lake 261 3 1 0.66 42.44916 -83.84148
LE Livingston Whitmore Lake 576 5 2 0.62 42.43677 -83.75036
LE Livingston Woodland Lake 258 5 1 42.55527 -83.78398
LE Livingston Zukey Lake 149 3 1 0.32 42.45999 -83.8462
LE Macomb Stoney Creek Pond 584 5 2 0.61 42.71891 -83.08994
LE Oakland Big Lake 213 5 1 0.47 42.72277 -83.51982
LE Oakland Big Seven Lake 158 5 1 0.39 42.81876 -83.67895
LE Oakland Cass Lake 1,279 3 2 0.62 42.6086 -83.36676
LE Oakland Crescent Lake 91 5 1 42.64332 -83.38676
LE Oakland Lakeville Lake 430 5 1 0.59 42.8286 -83.15009
LE Oakland Long Lake 166 5 1 0.36 42.6111 -83.45676
LE Oakland Oakland Lake 304 5 1 0.46 42.70027 -83.36065
LE Oakland Orion Lake 482 5 2 0.61 42.78055 -83.2487
LE Oakland Oxbow Lake 268 5 1 0.39 42.64582 -83.48065
LE Oakland Pontiac Lake 613 5 2 0.67 42.66666 -83.45843
LE Oakland Union Lake 467 5 2 0.59 42.60218 -83.44493
LE Oakland White Lake 519 5 2 0.60 42.6686 -83.5637
LE Oakland Wolverine Lake 269 5 1 0.40 42.55527 -83.49176
LE Washtenaw Argo Pond 84 5 1 42.29117 -83.74573
LE Washtenaw Barton Pond 192 5 1 0.31 42.30988 -83.75398
LE Washtenaw Big Portage Lake 641 3 2 0.62 42.41738 -83.90993

53
FMU County Name
Surface area
(acres) Natural
Reproduction Lake Class Suitability Latitude Longitude
LE Washtenaw Ford Lake 958 1 2 0.66 42.2064 -83.56044
LE Washtenaw Geddes Pond 195 5 1 42.27105 -83.6716
LE Wayne Belleville Lake 1,253 3 2 0.68 42.21436 -83.44178
NLH Alcona Alcona Dam Pond 975 4 5 0.76 44.56605 -83.80491
NLH Alcona Cedar Lake 1,057 5 5 44.53138 -83.33204
NLH Alcona Crooked Lake 96 4 4 0.43 44.73555 -83.86954
NLH Alcona Hubbard Lake 8,768 1 3 0.77 44.80416 -83.55954
NLH Alpena Beaver Lake 693 2 5 0.75 44.93777 -83.79899
NLH Alpena Long Lake 5,342 1 5 0.77 45.16547 -83.43694
NLH Alpena Winyah Lake (7 mile) 865 4 5 0.75 45.10243 -83.52047
NLH Cheboygan Black Lake 10,113 4 3 0.75 45.46666 -84.26676
NLH Cheboygan Burt Lake 17,395 1 3 0.69 45.46666 -84.66676
NLH Cheboygan Douglas Lake 3,727 4 3 0.75 45.5811 -84.69704
NLH Cheboygan Long Lake 379 4 5 0.69 45.53471 -84.39871
NLH Cheboygan Mullett Lake 16,704 1 3 0.69 45.5361 -84.51676
NLH Chippewa Caribou Lake 829 5 6 0.70 45.99582 -83.99454
NLH Chippewa Carp (Trout) Lake 568 1 6 0.73 46.18332 -85.04177
NLH Chippewa Frenchman's Lake 185 4 6 0.61 46.1836 -85.01565
NLH Crawford Big Bradford Lake 256 4 1 0.66 44.85702 -84.71193
NLH Crawford Big Creek Impoundment 78 5 4 44.79777 -84.37744
NLH Crawford Jones Lake 40 5 4 0.40 44.78416 -84.5926
NLH Emmet Crooked Lake 2,352 1 3 0.77 45.41082 -84.82593
NLH Emmet Pickerel Lake 1,082 1 5 0.77 45.39666 -84.76843
NLH Emmet Round Pond 353 5 1 0.70 45.40693 -84.88926
NLH Iosco Cooke Pond 1,635 5 2 0.73 44.47257 -83.57251
NLH Iosco Five Channels Pond 223 4 1 0.65 44.45588 -83.67721
NLH Iosco Van Etten Lake 1,409 2 2 0.75 44.47221 -83.35982
NLH Mackinac Twin Lakes 560 5 5 45.7486 -84.45843
NLH Montmorency East Twin Lake 820 5 5 0.73 44.86971 -84.30704
NLH Montmorency Ess Lake 119 5 4 0.62 45.11249 -83.98343
NLH Montmorency Long Lake 279 4 5 0.69 45.12777 -83.97315
NLH Montmorency West Twin Lake 1,306 5 6 0.76 44.87749 -84.34954
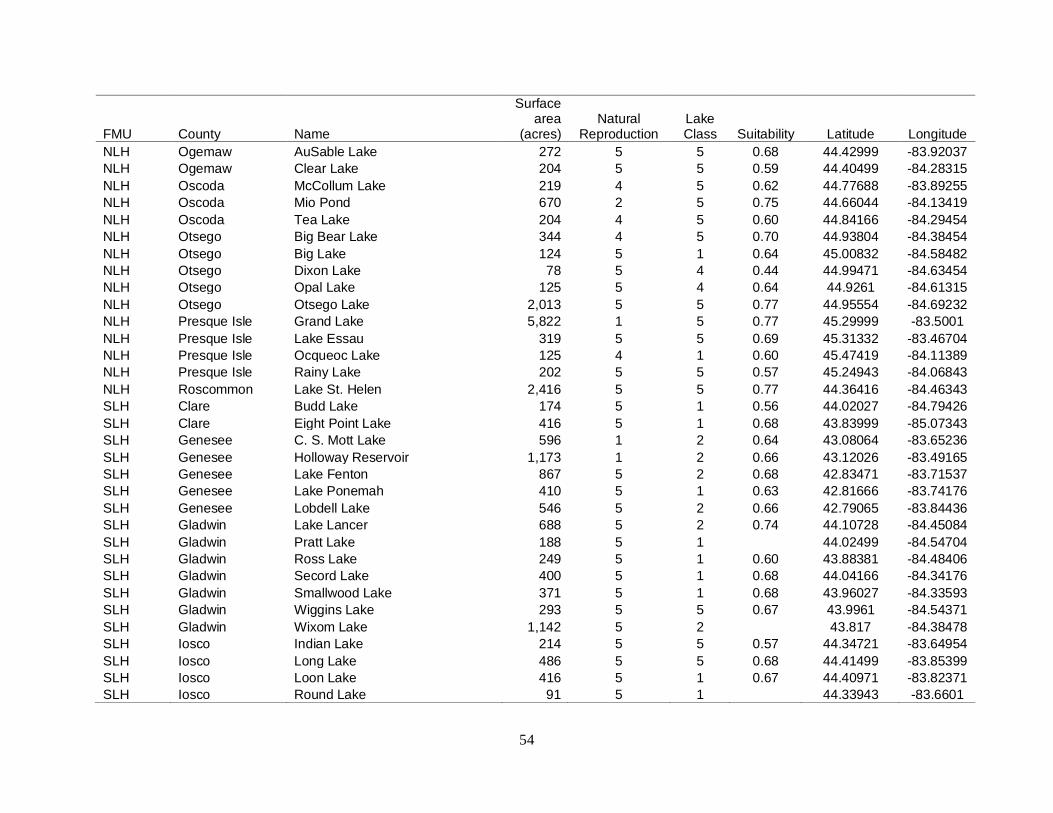
54
FMU County Name
Surface area
(acres) Natural
Reproduction Lake Class Suitability Latitude Longitude
NLH Ogemaw AuSable Lake 272 5 5 0.68 44.42999 -83.92037
NLH Ogemaw Clear Lake 204 5 5 0.59 44.40499 -84.28315
NLH Oscoda McCollum Lake 219 4 5 0.62 44.77688 -83.89255
NLH Oscoda Mio Pond 670 2 5 0.75 44.66044 -84.13419
NLH Oscoda Tea Lake 204 4 5 0.60 44.84166 -84.29454
NLH Otsego Big Bear Lake 344 4 5 0.70 44.93804 -84.38454
NLH Otsego Big Lake 124 5 1 0.64 45.00832 -84.58482
NLH Otsego Dixon Lake 78 5 4 0.44 44.99471 -84.63454
NLH Otsego Opal Lake 125 5 4 0.64 44.9261 -84.61315
NLH Otsego Otsego Lake 2,013 5 5 0.77 44.95554 -84.69232
NLH Presque Isle Grand Lake 5,822 1 5 0.77 45.29999 -83.5001
NLH Presque Isle Lake Essau 319 5 5 0.69 45.31332 -83.46704
NLH Presque Isle Ocqueoc Lake 125 4 1 0.60 45.47419 -84.11389
NLH Presque Isle Rainy Lake 202 5 5 0.57 45.24943 -84.06843
NLH Roscommon Lake St. Helen 2,416 5 5 0.77 44.36416 -84.46343
SLH Clare Budd Lake 174 5 1 0.56 44.02027 -84.79426
SLH Clare Eight Point Lake 416 5 1 0.68 43.83999 -85.07343
SLH Genesee C. S. Mott Lake 596 1 2 0.64 43.08064 -83.65236
SLH Genesee Holloway Reservoir 1,173 1 2 0.66 43.12026 -83.49165
SLH Genesee Lake Fenton 867 5 2 0.68 42.83471 -83.71537
SLH Genesee Lake Ponemah 410 5 1 0.63 42.81666 -83.74176
SLH Genesee Lobdell Lake 546 5 2 0.66 42.79065 -83.84436
SLH Gladwin Lake Lancer 688 5 2 0.74 44.10728 -84.45084
SLH Gladwin Pratt Lake 188 5 1 44.02499 -84.54704
SLH Gladwin Ross Lake 249 5 1 0.60 43.88381 -84.48406
SLH Gladwin Secord Lake 400 5 1 0.68 44.04166 -84.34176
SLH Gladwin Smallwood Lake 371 5 1 0.68 43.96027 -84.33593
SLH Gladwin Wiggins Lake 293 5 5 0.67 43.9961 -84.54371
SLH Gladwin Wixom Lake 1,142 5 2 43.817 -84.38478
SLH Iosco Indian Lake 214 5 5 0.57 44.34721 -83.64954
SLH Iosco Long Lake 486 5 5 0.68 44.41499 -83.85399
SLH Iosco Loon Lake 416 5 1 0.67 44.40971 -83.82371
SLH Iosco Round Lake 91 5 1 44.33943 -83.6601

55
FMU County Name
Surface area
(acres) Natural
Reproduction Lake Class Suitability Latitude Longitude
SLH Iosco Sand Lake 245 5 5 0.65 44.32555 -83.68093
SLH Isabella Coldwater Lake 285 5 1 0.61 43.6611 -84.95593
SLH Isabella Littlefield Lake 140 5 1 43.77249 -84.94509
SLH Lapeer Lake Nepessing 427 5 1 0.64 43.01749 -83.37176
SLH Lapeer Otter Lake 67 5 1 0.25 43.2186 -83.46037
SLH Livingston Lake Chemung 313 5 1 0.55 42.58221 -83.8487
SLH Mecosta Chippewa Lake 791 5 5 0.73 43.75443 -85.29815
SLH Mecosta Pretty Lake 116 5 1 0.57 43.6961 -85.23482
SLH Midland Sanford Lake 1,402 4 2 0.70 43.67693 -84.38009
SLH Montcalm Rock Lake 51 5 1 0.29 43.40832 -84.94287
SLH Ogemaw Devoe Lake 118 5 4 0.58 44.40081 -84.0265
SLH Ogemaw George Lake 186 5 5 0.58 44.39916 -83.97315
SLH Ogemaw Peach Lake 234 5 5 0.68 44.29443 -84.17037
SLH Ogemaw Rifle Lake 185 5 5 0.59 44.41193 -83.98037
SLH Tuscola Murphy Lake 183 5 1 0.39 43.29999 -83.46176
CLM Antrim Bellaire Lake 1,789 3 2 0.74 44.95721 -85.22426
CLM Antrim Birch Lake 325 1 1 0.70 44.93554 -85.38204
CLM Antrim Intermediate Lake 1,571 3 2 0.74 45.0236 -85.22065
CLM Antrim Lake Skegemog 2,766 3 2 0.74 44.82789 -85.35028
CLM Antrim Six Mile Lake 369 3 5 0.68 45.11249 -85.20121
CLM Benzie Little Lime Lake 35 3 1 0.21 44.75471 -85.93287
CLM Benzie Lower Herring Lake 450 4 2 0.68 44.56471 -86.21482
CLM Benzie Platte Lake 2,532 2 2 0.75 44.6911 -86.09232
CLM Benzie Upper Herring Lake 572 4 2 0.70 44.56193 -86.18176
CLM Charlevoix Lake Charlevoix 17,268 2 3 0.77 45.26665 -85.13343
CLM Charlevoix Lake Geneserath 480 3 5 45.59804 -85.53899
CLM Charlevoix Walloon Lake 4,577 2 2 0.74 45.27499 -85.0001
CLM Crawford Lake Margarethe 1,922 4 3 0.69 44.65054 -84.78732
CLM Emmet Paradise Lake 1,912 3 5 0.74 45.68749 -84.7501
CLM Grand Traverse Boardman Lake 317 1 1 0.87 44.75667 -85.61472
CLM Grand Traverse Fife Lake 606 3 5 0.70 44.56029 -85.34403
CLM Grand Traverse Long Lake 2,911 1 2 0.74 44.71165 -85.74843
CLM Grand Traverse Silver Lake 609 3 2 44.69277 -85.68621
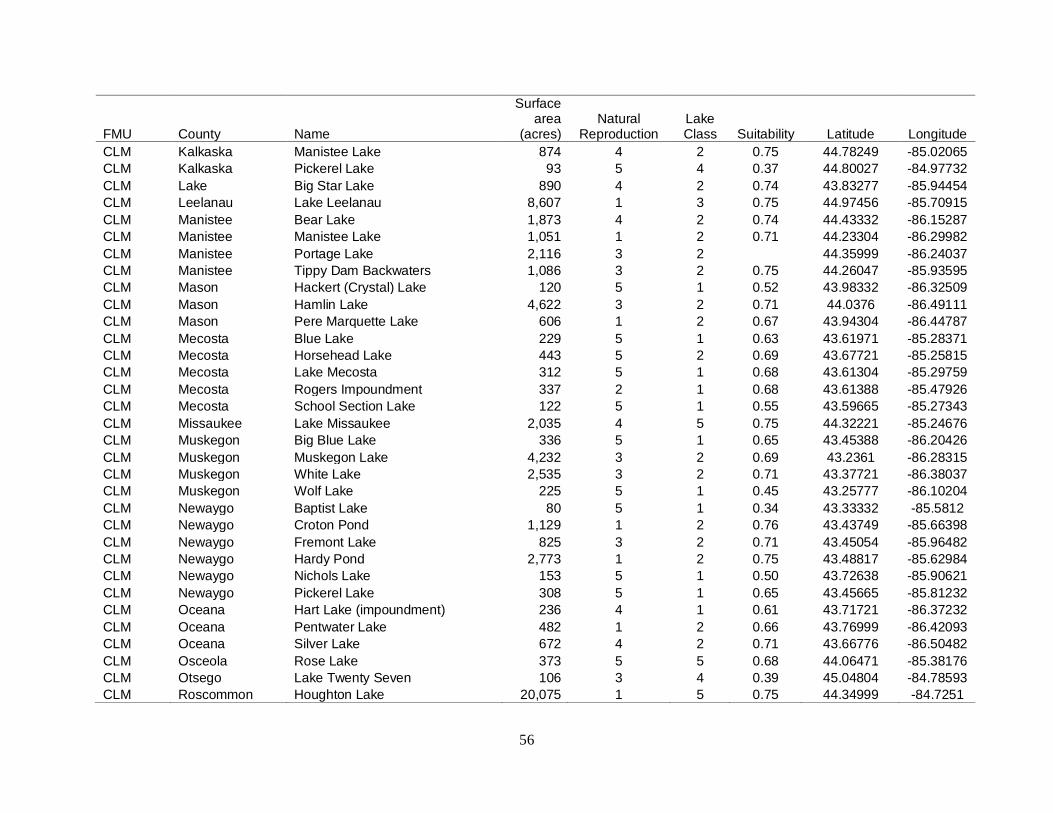
56
FMU County Name
Surface area
(acres) Natural
Reproduction Lake Class Suitability Latitude Longitude
CLM Kalkaska Manistee Lake 874 4 2 0.75 44.78249 -85.02065
CLM Kalkaska Pickerel Lake 93 5 4 0.37 44.80027 -84.97732
CLM Lake Big Star Lake 890 4 2 0.74 43.83277 -85.94454
CLM Leelanau Lake Leelanau 8,607 1 3 0.75 44.97456 -85.70915
CLM Manistee Bear Lake 1,873 4 2 0.74 44.43332 -86.15287
CLM Manistee Manistee Lake 1,051 1 2 0.71 44.23304 -86.29982
CLM Manistee Portage Lake 2,116 3 2 44.35999 -86.24037
CLM Manistee Tippy Dam Backwaters 1,086 3 2 0.75 44.26047 -85.93595
CLM Mason Hackert (Crystal) Lake 120 5 1 0.52 43.98332 -86.32509
CLM Mason Hamlin Lake 4,622 3 2 0.71 44.0376 -86.49111
CLM Mason Pere Marquette Lake 606 1 2 0.67 43.94304 -86.44787
CLM Mecosta Blue Lake 229 5 1 0.63 43.61971 -85.28371
CLM Mecosta Horsehead Lake 443 5 2 0.69 43.67721 -85.25815
CLM Mecosta Lake Mecosta 312 5 1 0.68 43.61304 -85.29759
CLM Mecosta Rogers Impoundment 337 2 1 0.68 43.61388 -85.47926
CLM Mecosta School Section Lake 122 5 1 0.55 43.59665 -85.27343
CLM Missaukee Lake Missaukee 2,035 4 5 0.75 44.32221 -85.24676
CLM Muskegon Big Blue Lake 336 5 1 0.65 43.45388 -86.20426
CLM Muskegon Muskegon Lake 4,232 3 2 0.69 43.2361 -86.28315
CLM Muskegon White Lake 2,535 3 2 0.71 43.37721 -86.38037
CLM Muskegon Wolf Lake 225 5 1 0.45 43.25777 -86.10204
CLM Newaygo Baptist Lake 80 5 1 0.34 43.33332 -85.5812
CLM Newaygo Croton Pond 1,129 1 2 0.76 43.43749 -85.66398
CLM Newaygo Fremont Lake 825 3 2 0.71 43.45054 -85.96482
CLM Newaygo Hardy Pond 2,773 1 2 0.75 43.48817 -85.62984
CLM Newaygo Nichols Lake 153 5 1 0.50 43.72638 -85.90621
CLM Newaygo Pickerel Lake 308 5 1 0.65 43.45665 -85.81232
CLM Oceana Hart Lake (impoundment) 236 4 1 0.61 43.71721 -86.37232
CLM Oceana Pentwater Lake 482 1 2 0.66 43.76999 -86.42093
CLM Oceana Silver Lake 672 4 2 0.71 43.66776 -86.50482
CLM Osceola Rose Lake 373 5 5 0.68 44.06471 -85.38176
CLM Otsego Lake Twenty Seven 106 3 4 0.39 45.04804 -84.78593
CLM Roscommon Houghton Lake 20,075 1 5 0.75 44.34999 -84.7251
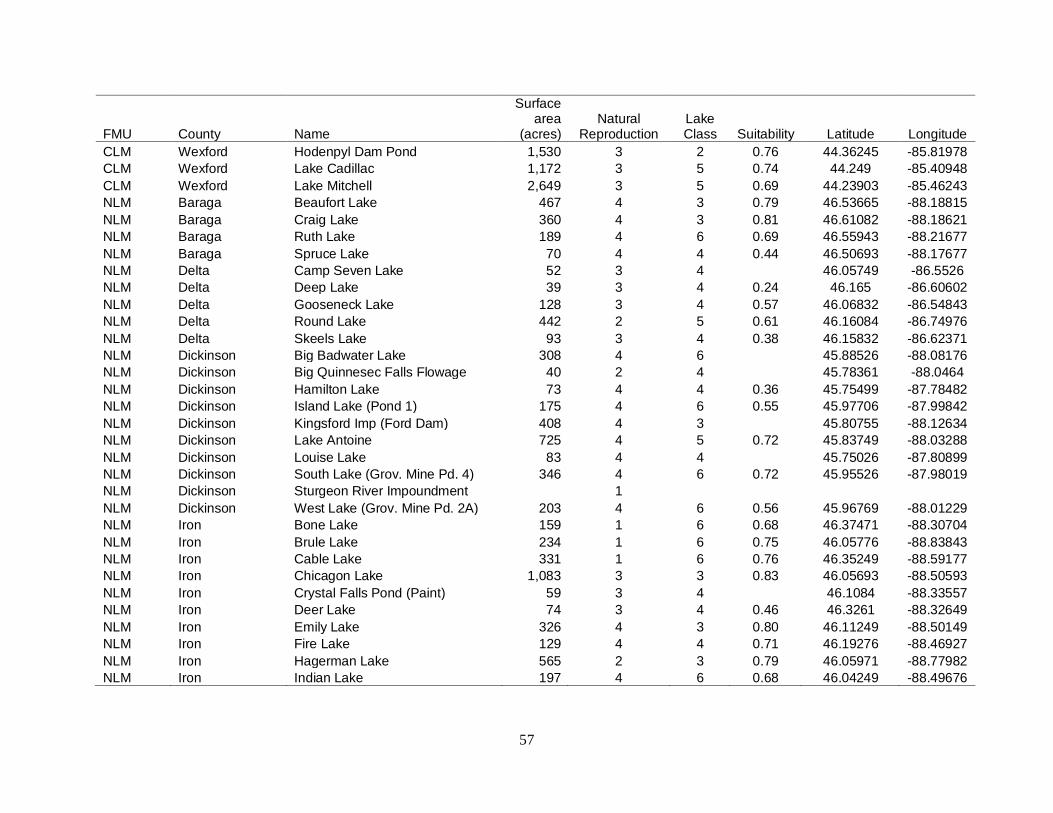
57
FMU County Name
Surface area
(acres) Natural
Reproduction Lake Class Suitability Latitude Longitude
CLM Wexford Hodenpyl Dam Pond 1,530 3 2 0.76 44.36245 -85.81978
CLM Wexford Lake Cadillac 1,172 3 5 0.74 44.249 -85.40948
CLM Wexford Lake Mitchell 2,649 3 5 0.69 44.23903 -85.46243
NLM Baraga Beaufort Lake 467 4 3 0.79 46.53665 -88.18815
NLM Baraga Craig Lake 360 4 3 0.81 46.61082 -88.18621
NLM Baraga Ruth Lake 189 4 6 0.69 46.55943 -88.21677
NLM Baraga Spruce Lake 70 4 4 0.44 46.50693 -88.17677
NLM Delta Camp Seven Lake 52 3 4 46.05749 -86.5526
NLM Delta Deep Lake 39 3 4 0.24 46.165 -86.60602
NLM Delta Gooseneck Lake 128 3 4 0.57 46.06832 -86.54843
NLM Delta Round Lake 442 2 5 0.61 46.16084 -86.74976
NLM Delta Skeels Lake 93 3 4 0.38 46.15832 -86.62371
NLM Dickinson Big Badwater Lake 308 4 6 45.88526 -88.08176
NLM Dickinson Big Quinnesec Falls Flowage 40 2 4 45.78361 -88.0464
NLM Dickinson Hamilton Lake 73 4 4 0.36 45.75499 -87.78482
NLM Dickinson Island Lake (Pond 1) 175 4 6 0.55 45.97706 -87.99842
NLM Dickinson Kingsford Imp (Ford Dam) 408 4 3 45.80755 -88.12634
NLM Dickinson Lake Antoine 725 4 5 0.72 45.83749 -88.03288
NLM Dickinson Louise Lake 83 4 4 45.75026 -87.80899
NLM Dickinson South Lake (Grov. Mine Pd. 4) 346 4 6 0.72 45.95526 -87.98019
NLM Dickinson Sturgeon River Impoundment 1 NLM Dickinson West Lake (Grov. Mine Pd. 2A) 203 4 6 0.56 45.96769 -88.01229
NLM Iron Bone Lake 159 1 6 0.68 46.37471 -88.30704
NLM Iron Brule Lake 234 1 6 0.75 46.05776 -88.83843
NLM Iron Cable Lake 331 1 6 0.76 46.35249 -88.59177
NLM Iron Chicagon Lake 1,083 3 3 0.83 46.05693 -88.50593
NLM Iron Crystal Falls Pond (Paint) 59 3 4 46.1084 -88.33557
NLM Iron Deer Lake 74 3 4 0.46 46.3261 -88.32649
NLM Iron Emily Lake 326 4 3 0.80 46.11249 -88.50149
NLM Iron Fire Lake 129 4 4 0.71 46.19276 -88.46927
NLM Iron Hagerman Lake 565 2 3 0.79 46.05971 -88.77982
NLM Iron Indian Lake 197 4 6 0.68 46.04249 -88.49676

58
FMU County Name
Surface area
(acres) Natural
Reproduction Lake Class Suitability Latitude Longitude
NLM Iron Iron Lake 390 2 3 0.80 46.14471 -88.65232
NLM Iron Lake Mary 270 4 3 0.73 46.05721 -88.22176
NLM Iron Lake Ottawa 532 3 3 0.75 46.0861 -88.76204
NLM Iron Long Lake 83 1 4 0.50 46.40387 -88.32704
NLM Iron Long Lake 60 4 4 0.34 46.12082 -88.44982
NLM Iron Michigamme Falls Reservoir 470 4 3 0.71 45.95601 -88.19692
NLM Iron Michigamme Reservoir (Way) 4,867 1 3 0.83 46.15992 -88.23498
NLM Iron Paint Lake 240 1 6 0.72 46.35221 -88.88927
NLM Iron Paint River Pond 708 1 3 45.96402 -88.24468
NLM Iron Peavy Pond 2,347 1 3 0.80 45.9911 -88.20871
NLM Iron Perch Lake 1,038 3 6 0.81 46.36221 -88.66177
NLM Iron Porter Lake 271 1 3 0.73 46.32999 -88.57732
NLM Iron Snipe Lake 63 1 4 0.39 46.05221 -88.69426
NLM Iron Stager Lake 109 1 4 0.61 45.98415 -88.33149
NLM Iron Stanley Lake 319 1 3 0.81 46.05887 -88.70676
NLM Iron Sunset Lake 531 1 3 0.79 46.13221 -88.59038
NLM Iron Swan Lake 160 1 6 0.67 46.16332 -88.39482
NLM Iron Winslow Lake 259 1 6 0.73 46.34582 -88.76454
NLM Luce N. Manistique Lake 1,709 3 3 0.72 46.28749 -85.73899
NLM Mackinac Big Manistique Lake 10,346 4 6 0.73 46.23332 -85.78343
NLM Mackinac Brevoort Lake 4,315 3 5 0.69 45.99999 -84.93343
NLM Mackinac Milakokia Lake 2,031 1 5 0.74 46.07915 -85.80427
NLM Mackinac Millecoquins Lake 1,123 3 5 0.77 46.1536 -85.51315
NLM Mackinac S. Manistique Lake 4,133 1 5 0.73 46.17499 -85.7626
NLM Marquette Bass Lake 272 3 6 0.69 46.25888 -87.37093
NLM Marquette Fish Lake 152 3 6 0.68 46.49749 -87.9626
NLM Marquette Greenwood Reservoir 1,117 3 3 46.44276 -87.80232
NLM Marquette Keewayden Lake 132 3 6 0.69 46.60238 -88.10683
NLM Marquette Lake Michigamme 4,292 1 3 0.83 46.48486 -88.07377
NLM Marquette Little Lake 460 3 6 0.70 46.27693 -87.34815
NLM Marquette Mehl Lake 90 3 4 0.19 46.26471 -87.94982
NLM Marquette Michigamme River Basin 43 1 4 46.40165 -87.98565
NLM Marquette Pike Lake 90 3 4 0.42 46.26693 -87.57593
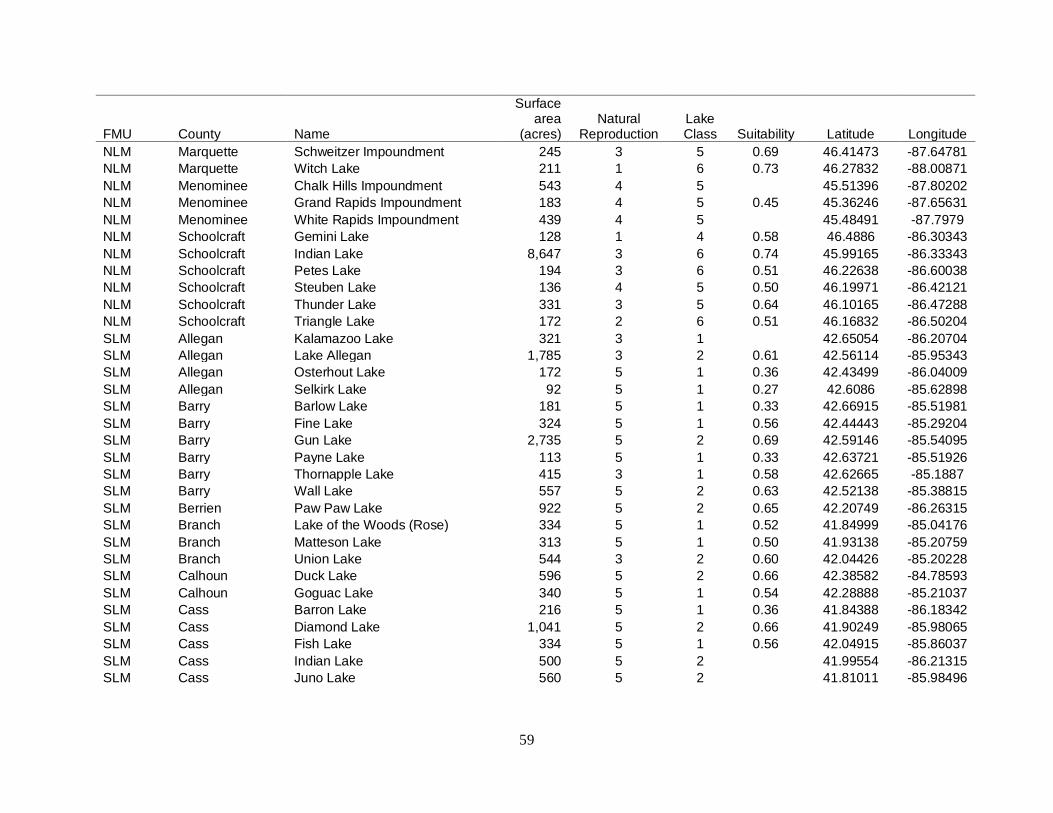
59
FMU County Name
Surface area
(acres) Natural
Reproduction Lake Class Suitability Latitude Longitude
NLM Marquette Schweitzer Impoundment 245 3 5 0.69 46.41473 -87.64781
NLM Marquette Witch Lake 211 1 6 0.73 46.27832 -88.00871
NLM Menominee Chalk Hills Impoundment 543 4 5 45.51396 -87.80202
NLM Menominee Grand Rapids Impoundment 183 4 5 0.45 45.36246 -87.65631
NLM Menominee White Rapids Impoundment 439 4 5 45.48491 -87.7979
NLM Schoolcraft Gemini Lake 128 1 4 0.58 46.4886 -86.30343
NLM Schoolcraft Indian Lake 8,647 3 6 0.74 45.99165 -86.33343
NLM Schoolcraft Petes Lake 194 3 6 0.51 46.22638 -86.60038
NLM Schoolcraft Steuben Lake 136 4 5 0.50 46.19971 -86.42121
NLM Schoolcraft Thunder Lake 331 3 5 0.64 46.10165 -86.47288
NLM Schoolcraft Triangle Lake 172 2 6 0.51 46.16832 -86.50204
SLM Allegan Kalamazoo Lake 321 3 1 42.65054 -86.20704
SLM Allegan Lake Allegan 1,785 3 2 0.61 42.56114 -85.95343
SLM Allegan Osterhout Lake 172 5 1 0.36 42.43499 -86.04009
SLM Allegan Selkirk Lake 92 5 1 0.27 42.6086 -85.62898
SLM Barry Barlow Lake 181 5 1 0.33 42.66915 -85.51981
SLM Barry Fine Lake 324 5 1 0.56 42.44443 -85.29204
SLM Barry Gun Lake 2,735 5 2 0.69 42.59146 -85.54095
SLM Barry Payne Lake 113 5 1 0.33 42.63721 -85.51926
SLM Barry Thornapple Lake 415 3 1 0.58 42.62665 -85.1887
SLM Barry Wall Lake 557 5 2 0.63 42.52138 -85.38815
SLM Berrien Paw Paw Lake 922 5 2 0.65 42.20749 -86.26315
SLM Branch Lake of the Woods (Rose) 334 5 1 0.52 41.84999 -85.04176
SLM Branch Matteson Lake 313 5 1 0.50 41.93138 -85.20759
SLM Branch Union Lake 544 3 2 0.60 42.04426 -85.20228
SLM Calhoun Duck Lake 596 5 2 0.66 42.38582 -84.78593
SLM Calhoun Goguac Lake 340 5 1 0.54 42.28888 -85.21037
SLM Cass Barron Lake 216 5 1 0.36 41.84388 -86.18342
SLM Cass Diamond Lake 1,041 5 2 0.66 41.90249 -85.98065
SLM Cass Fish Lake 334 5 1 0.56 42.04915 -85.86037
SLM Cass Indian Lake 500 5 2 41.99554 -86.21315
SLM Cass Juno Lake 560 5 2 41.81011 -85.98496
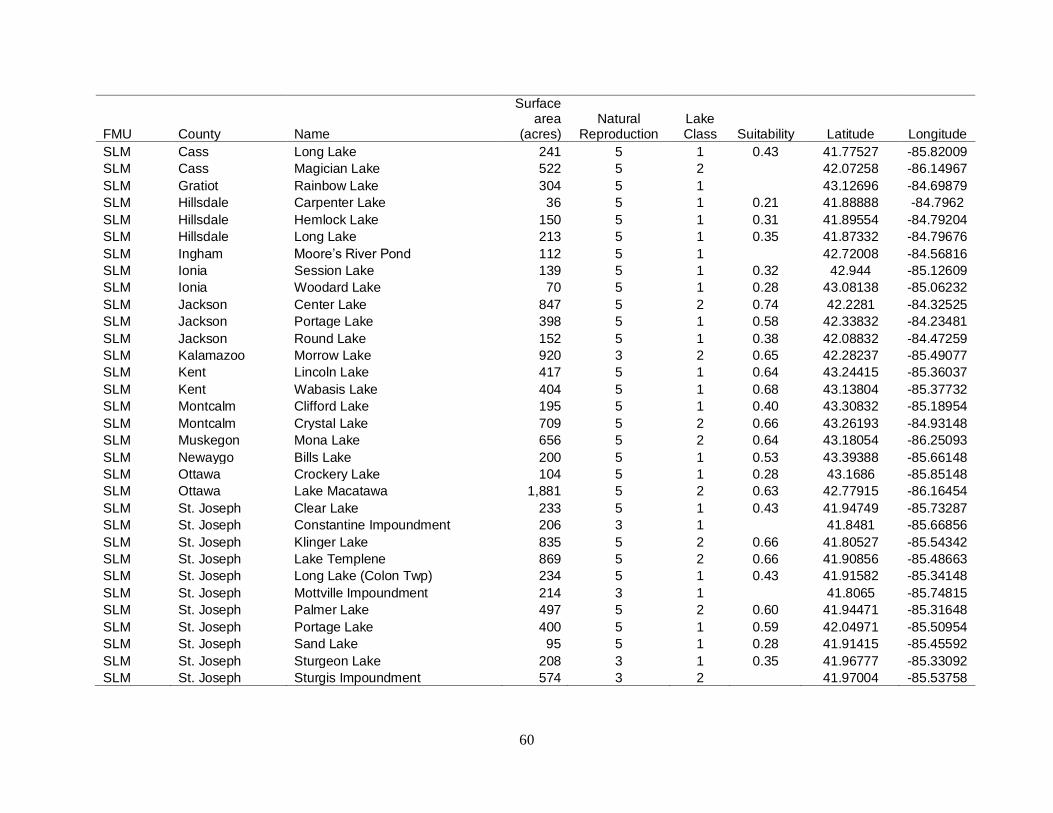
60
FMU County Name
Surface area
(acres) Natural
Reproduction Lake Class Suitability Latitude Longitude
SLM Cass Long Lake 241 5 1 0.43 41.77527 -85.82009
SLM Cass Magician Lake 522 5 2 42.07258 -86.14967
SLM Gratiot Rainbow Lake 304 5 1 43.12696 -84.69879
SLM Hillsdale Carpenter Lake 36 5 1 0.21 41.88888 -84.7962
SLM Hillsdale Hemlock Lake 150 5 1 0.31 41.89554 -84.79204
SLM Hillsdale Long Lake 213 5 1 0.35 41.87332 -84.79676
SLM Ingham Moore’s River Pond 112 5 1 42.72008 -84.56816
SLM Ionia Session Lake 139 5 1 0.32 42.944 -85.12609
SLM Ionia Woodard Lake 70 5 1 0.28 43.08138 -85.06232
SLM Jackson Center Lake 847 5 2 0.74 42.2281 -84.32525
SLM Jackson Portage Lake 398 5 1 0.58 42.33832 -84.23481
SLM Jackson Round Lake 152 5 1 0.38 42.08832 -84.47259
SLM Kalamazoo Morrow Lake 920 3 2 0.65 42.28237 -85.49077
SLM Kent Lincoln Lake 417 5 1 0.64 43.24415 -85.36037
SLM Kent Wabasis Lake 404 5 1 0.68 43.13804 -85.37732
SLM Montcalm Clifford Lake 195 5 1 0.40 43.30832 -85.18954
SLM Montcalm Crystal Lake 709 5 2 0.66 43.26193 -84.93148
SLM Muskegon Mona Lake 656 5 2 0.64 43.18054 -86.25093
SLM Newaygo Bills Lake 200 5 1 0.53 43.39388 -85.66148
SLM Ottawa Crockery Lake 104 5 1 0.28 43.1686 -85.85148
SLM Ottawa Lake Macatawa 1,881 5 2 0.63 42.77915 -86.16454
SLM St. Joseph Clear Lake 233 5 1 0.43 41.94749 -85.73287
SLM St. Joseph Constantine Impoundment 206 3 1 41.8481 -85.66856
SLM St. Joseph Klinger Lake 835 5 2 0.66 41.80527 -85.54342
SLM St. Joseph Lake Templene 869 5 2 0.66 41.90856 -85.48663
SLM St. Joseph Long Lake (Colon Twp) 234 5 1 0.43 41.91582 -85.34148
SLM St. Joseph Mottville Impoundment 214 3 1 41.8065 -85.74815
SLM St. Joseph Palmer Lake 497 5 2 0.60 41.94471 -85.31648
SLM St. Joseph Portage Lake 400 5 1 0.59 42.04971 -85.50954
SLM St. Joseph Sand Lake 95 5 1 0.28 41.91415 -85.45592
SLM St. Joseph Sturgeon Lake 208 3 1 0.35 41.96777 -85.33092
SLM St. Joseph Sturgis Impoundment 574 3 2 41.97004 -85.53758
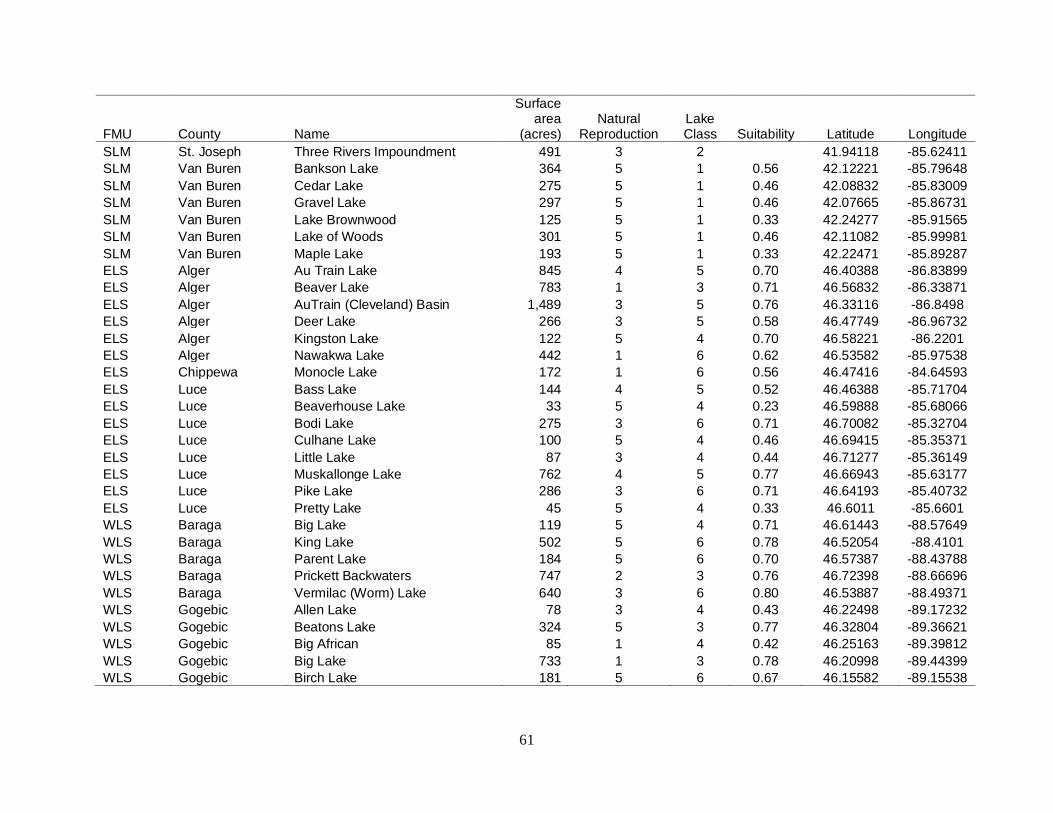
61
FMU County Name
Surface area
(acres) Natural
Reproduction Lake Class Suitability Latitude Longitude
SLM St. Joseph Three Rivers Impoundment 491 3 2 41.94118 -85.62411
SLM Van Buren Bankson Lake 364 5 1 0.56 42.12221 -85.79648
SLM Van Buren Cedar Lake 275 5 1 0.46 42.08832 -85.83009
SLM Van Buren Gravel Lake 297 5 1 0.46 42.07665 -85.86731
SLM Van Buren Lake Brownwood 125 5 1 0.33 42.24277 -85.91565
SLM Van Buren Lake of Woods 301 5 1 0.46 42.11082 -85.99981
SLM Van Buren Maple Lake 193 5 1 0.33 42.22471 -85.89287
ELS Alger Au Train Lake 845 4 5 0.70 46.40388 -86.83899
ELS Alger Beaver Lake 783 1 3 0.71 46.56832 -86.33871
ELS Alger AuTrain (Cleveland) Basin 1,489 3 5 0.76 46.33116 -86.8498
ELS Alger Deer Lake 266 3 5 0.58 46.47749 -86.96732
ELS Alger Kingston Lake 122 5 4 0.70 46.58221 -86.2201
ELS Alger Nawakwa Lake 442 1 6 0.62 46.53582 -85.97538
ELS Chippewa Monocle Lake 172 1 6 0.56 46.47416 -84.64593
ELS Luce Bass Lake 144 4 5 0.52 46.46388 -85.71704
ELS Luce Beaverhouse Lake 33 5 4 0.23 46.59888 -85.68066
ELS Luce Bodi Lake 275 3 6 0.71 46.70082 -85.32704
ELS Luce Culhane Lake 100 5 4 0.46 46.69415 -85.35371
ELS Luce Little Lake 87 3 4 0.44 46.71277 -85.36149
ELS Luce Muskallonge Lake 762 4 5 0.77 46.66943 -85.63177
ELS Luce Pike Lake 286 3 6 0.71 46.64193 -85.40732
ELS Luce Pretty Lake 45 5 4 0.33 46.6011 -85.6601
WLS Baraga Big Lake 119 5 4 0.71 46.61443 -88.57649
WLS Baraga King Lake 502 5 6 0.78 46.52054 -88.4101
WLS Baraga Parent Lake 184 5 6 0.70 46.57387 -88.43788
WLS Baraga Prickett Backwaters 747 2 3 0.76 46.72398 -88.66696
WLS Baraga Vermilac (Worm) Lake 640 3 6 0.80 46.53887 -88.49371
WLS Gogebic Allen Lake 78 3 4 0.43 46.22498 -89.17232
WLS Gogebic Beatons Lake 324 5 3 0.77 46.32804 -89.36621
WLS Gogebic Big African 85 1 4 0.42 46.25163 -89.39812
WLS Gogebic Big Lake 733 1 3 0.78 46.20998 -89.44399
WLS Gogebic Birch Lake 181 5 6 0.67 46.15582 -89.15538
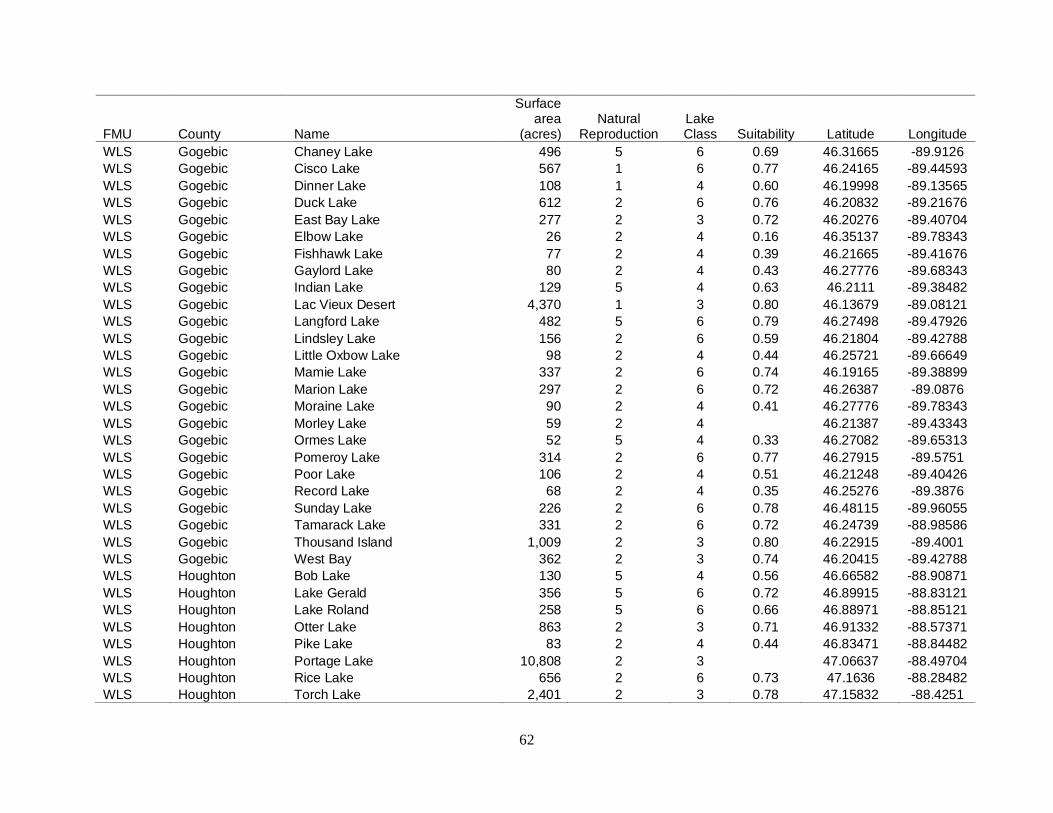
62
FMU County Name
Surface area
(acres) Natural
Reproduction Lake Class Suitability Latitude Longitude
WLS Gogebic Chaney Lake 496 5 6 0.69 46.31665 -89.9126
WLS Gogebic Cisco Lake 567 1 6 0.77 46.24165 -89.44593
WLS Gogebic Dinner Lake 108 1 4 0.60 46.19998 -89.13565
WLS Gogebic Duck Lake 612 2 6 0.76 46.20832 -89.21676
WLS Gogebic East Bay Lake 277 2 3 0.72 46.20276 -89.40704
WLS Gogebic Elbow Lake 26 2 4 0.16 46.35137 -89.78343
WLS Gogebic Fishhawk Lake 77 2 4 0.39 46.21665 -89.41676
WLS Gogebic Gaylord Lake 80 2 4 0.43 46.27776 -89.68343
WLS Gogebic Indian Lake 129 5 4 0.63 46.2111 -89.38482
WLS Gogebic Lac Vieux Desert 4,370 1 3 0.80 46.13679 -89.08121
WLS Gogebic Langford Lake 482 5 6 0.79 46.27498 -89.47926
WLS Gogebic Lindsley Lake 156 2 6 0.59 46.21804 -89.42788
WLS Gogebic Little Oxbow Lake 98 2 4 0.44 46.25721 -89.66649
WLS Gogebic Mamie Lake 337 2 6 0.74 46.19165 -89.38899
WLS Gogebic Marion Lake 297 2 6 0.72 46.26387 -89.0876
WLS Gogebic Moraine Lake 90 2 4 0.41 46.27776 -89.78343
WLS Gogebic Morley Lake 59 2 4 46.21387 -89.43343
WLS Gogebic Ormes Lake 52 5 4 0.33 46.27082 -89.65313
WLS Gogebic Pomeroy Lake 314 2 6 0.77 46.27915 -89.5751
WLS Gogebic Poor Lake 106 2 4 0.51 46.21248 -89.40426
WLS Gogebic Record Lake 68 2 4 0.35 46.25276 -89.3876
WLS Gogebic Sunday Lake 226 2 6 0.78 46.48115 -89.96055
WLS Gogebic Tamarack Lake 331 2 6 0.72 46.24739 -88.98586
WLS Gogebic Thousand Island 1,009 2 3 0.80 46.22915 -89.4001
WLS Gogebic West Bay 362 2 3 0.74 46.20415 -89.42788
WLS Houghton Bob Lake 130 5 4 0.56 46.66582 -88.90871
WLS Houghton Lake Gerald 356 5 6 0.72 46.89915 -88.83121
WLS Houghton Lake Roland 258 5 6 0.66 46.88971 -88.85121
WLS Houghton Otter Lake 863 2 3 0.71 46.91332 -88.57371
WLS Houghton Pike Lake 83 2 4 0.44 46.83471 -88.84482
WLS Houghton Portage Lake 10,808 2 3 47.06637 -88.49704
WLS Houghton Rice Lake 656 2 6 0.73 47.1636 -88.28482
WLS Houghton Torch Lake 2,401 2 3 0.78 47.15832 -88.4251
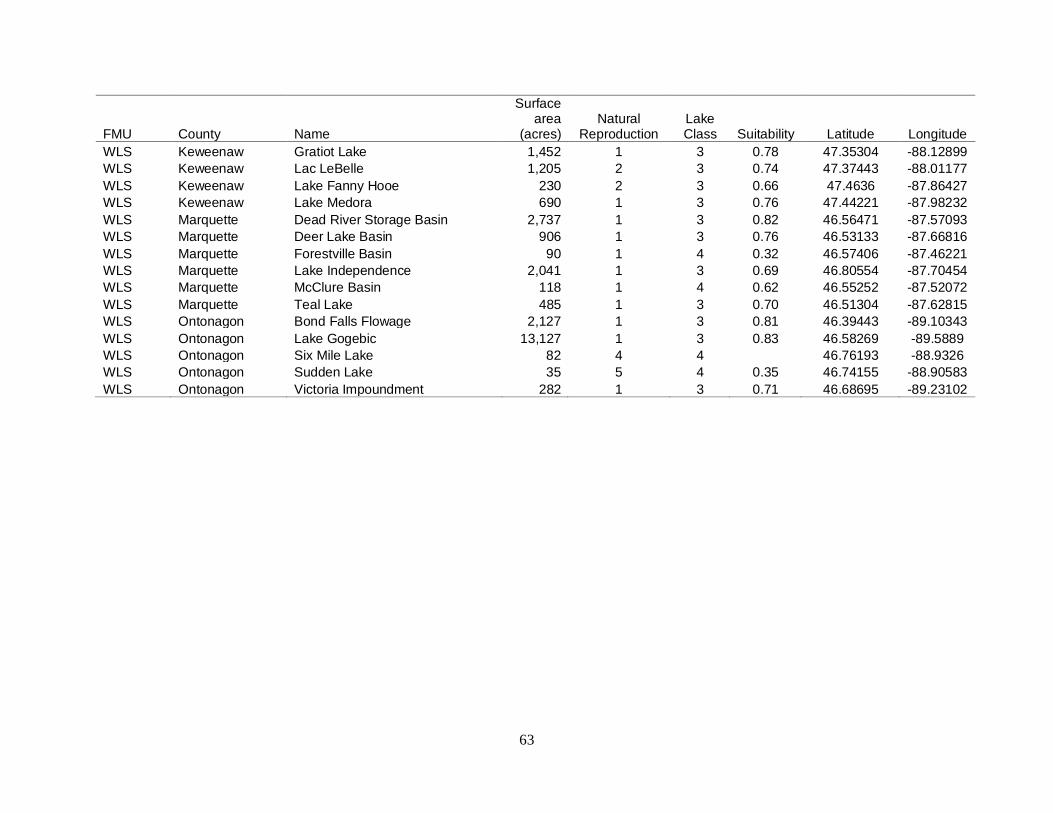
63
FMU County Name
Surface area
(acres) Natural
Reproduction Lake Class Suitability Latitude Longitude
WLS Keweenaw Gratiot Lake 1,452 1 3 0.78 47.35304 -88.12899
WLS Keweenaw Lac LeBelle 1,205 2 3 0.74 47.37443 -88.01177
WLS Keweenaw Lake Fanny Hooe 230 2 3 0.66 47.4636 -87.86427
WLS Keweenaw Lake Medora 690 1 3 0.76 47.44221 -87.98232
WLS Marquette Dead River Storage Basin 2,737 1 3 0.82 46.56471 -87.57093
WLS Marquette Deer Lake Basin 906 1 3 0.76 46.53133 -87.66816
WLS Marquette Forestville Basin 90 1 4 0.32 46.57406 -87.46221
WLS Marquette Lake Independence 2,041 1 3 0.69 46.80554 -87.70454
WLS Marquette McClure Basin 118 1 4 0.62 46.55252 -87.52072
WLS Marquette Teal Lake 485 1 3 0.70 46.51304 -87.62815
WLS Ontonagon Bond Falls Flowage 2,127 1 3 0.81 46.39443 -89.10343
WLS Ontonagon Lake Gogebic 13,127 1 3 0.83 46.58269 -89.5889
WLS Ontonagon Six Mile Lake 82 4 4 46.76193 -88.9326
WLS Ontonagon Sudden Lake 35 5 4 0.35 46.74155 -88.90583
WLS Ontonagon Victoria Impoundment 282 1 3 0.71 46.68695 -89.23102
64
Appendix B: Walleye stocking strategy guidelines
Walleye stocking has been used as a management tool in Michigan since 1882 and this activity
continues to be a significant aspect of current Walleye management strategies to create new
fisheries, rehabilitate populations, enhance small populations, and as a biocontrol for overly
abundant and slow growing panfish populations. Walleye stocking should not be implemented
without specific management goals and objectives previously established. The purpose of this
document is to complement the Department’s existing stocking guidelines, and to provide a
decision support framework to help guide fisheries managers through the process of making
science-based and cost-conscious stocking decisions for allocation of statewide resources.
The Michigan Fish Stocking Guidelines II, developed by the Michigan Department of Natural
Resources Fisheries Division in 2004, has been the primary resource for informing Walleye
stocking in Michigan in recent years. These guidelines are still relevant and rely on stocking
practices that have been implemented and refined to achieve management goals and Walleye
population metrics. Specific to inland lakes, managers have classified Walleye populations with
more than 2 adults/acre as good to excellent fisheries. Populations with 1 adult/acre or less were
ranked from poor to fair. The existing stocking guidelines recommends the target Walleye
density of 2/acre to maintain adequate fishing and justify continuation of stocking programs.
This population metric is particularly relevant when the management goal is associated with
creating, rehabilitating, or enhancing populations for angling opportunities (MI Fish Stocking
Guidelines II, 2004). Maintaining or achieving the target Walleye density is significant because
angler catch rates are correlated with population densities, meaning increased population
densities generally result in greater angler catch rates (Beard et al. 1997).
The Fisheries Division has developed recommendations for Walleye stocking densities in
Michigan waters to maximize success of this statewide program (Table B-1). Stocking success is
often variable and is dependent on many abiotic and biotic factors, but current stocking
guidelines do not provide specific guidance that incorporates these factors. The one exception is
the recommendation to stock Walleye fry in turbid waters for greater success (MI Fish Stocking
Guidelines II, 2004). To maximize success, the MDNR will use a decision tree that provides
recommendations on when Walleye stocking is most appropriate based on a comprehensive
synthesis of Walleye populations and stocking success in the Midwestern states (Raabe et al.
2019; Figure B-1). In addition, the MDNR prioritizes the genetic integrity of the feral
populations that are used as egg source to produce Walleye stocking in Michigan waters. As
such, Fisheries Division developed the Strategy for Stocking Walleyes from Various Brood
Source Locations (Appendix C), which will be a critical aspect of the comprehensive stocking
strategy guidelines provided in this appendix.

65
Table B-1. Recommended stocking densities that have been slightly modified from those listed
in Michigan Fish Stocking Guidelines II to account for results from recent stocking evaluations
conducted by fisheries biologists.
Life history classification Avg. size
(inches)
Stocking density
(fish/acre)
Stocking timeframe
Fry <1 2,000 Spring following hatch
Spring fingerling 1-5 25-100 May to Sept. 1
Fall fingerling >5 4-40 After Sept. 1
Figure B-1. Decision tree that will be used to inform science-based stocking decisions by
Fisheries Division. The diagram was taken from a comprehensive review of Walleye stocking in
Midwestern states and the decision tree represents synthesized results that are meant to increase
the likelihood of a successful stocking event (Raabe et al. 2019).
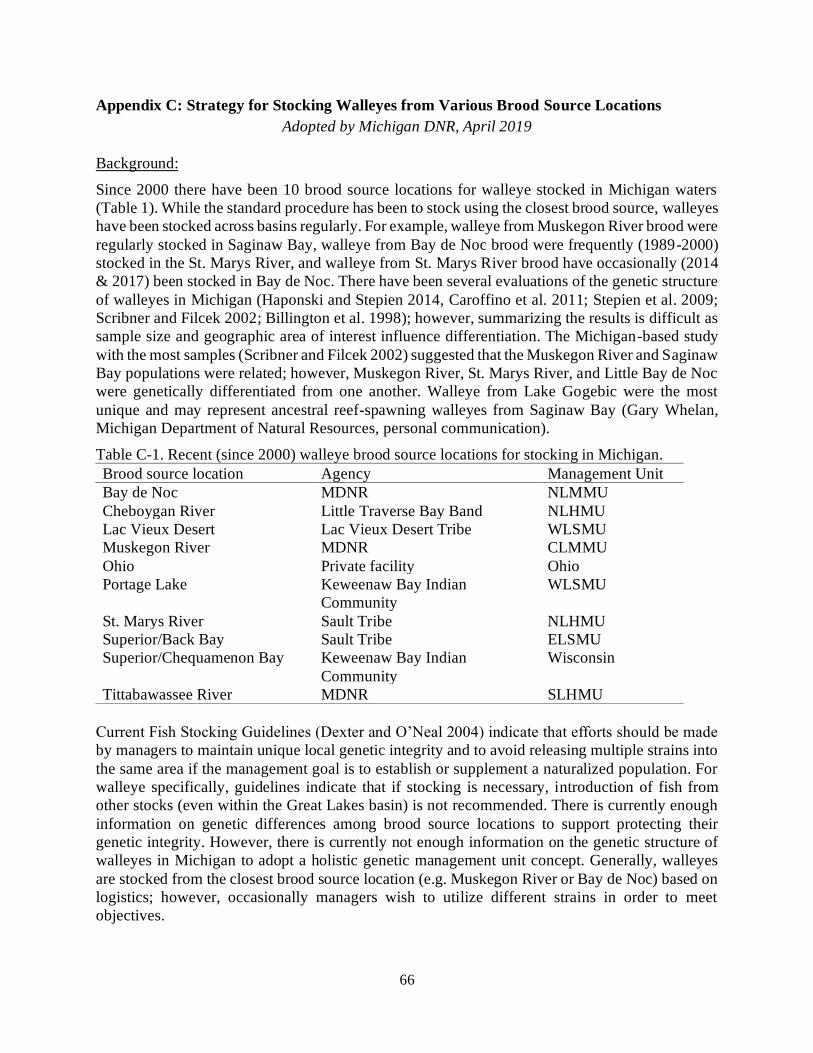
66
Appendix C: Strategy for Stocking Walleyes from Various Brood Source Locations
Adopted by Michigan DNR, April 2019
Background:
Since 2000 there have been 10 brood source locations for walleye stocked in Michigan waters
(Table 1). While the standard procedure has been to stock using the closest brood source, walleyes
have been stocked across basins regularly. For example, walleye from Muskegon River brood were
regularly stocked in Saginaw Bay, walleye from Bay de Noc brood were frequently (1989-2000)
stocked in the St. Marys River, and walleye from St. Marys River brood have occasionally (2014
& 2017) been stocked in Bay de Noc. There have been several evaluations of the genetic structure
of walleyes in Michigan (Haponski and Stepien 2014, Caroffino et al. 2011; Stepien et al. 2009;
Scribner and Filcek 2002; Billington et al. 1998); however, summarizing the results is difficult as
sample size and geographic area of interest influence differentiation. The Michigan-based study
with the most samples (Scribner and Filcek 2002) suggested that the Muskegon River and Saginaw
Bay populations were related; however, Muskegon River, St. Marys River, and Little Bay de Noc
were genetically differentiated from one another. Walleye from Lake Gogebic were the most
unique and may represent ancestral reef-spawning walleyes from Saginaw Bay (Gary Whelan,
Michigan Department of Natural Resources, personal communication).
Table C-1. Recent (since 2000) walleye brood source locations for stocking in Michigan.
Brood source location Agency Management Unit
Bay de Noc MDNR NLMMU
Cheboygan River Little Traverse Bay Band NLHMU
Lac Vieux Desert Lac Vieux Desert Tribe WLSMU
Muskegon River MDNR CLMMU
Ohio Private facility Ohio
Portage Lake Keweenaw Bay Indian
Community
WLSMU
St. Marys River Sault Tribe NLHMU
Superior/Back Bay Sault Tribe ELSMU
Superior/Chequamenon Bay Keweenaw Bay Indian
Community
Wisconsin
Tittabawassee River MDNR SLHMU
Current Fish Stocking Guidelines (Dexter and O’Neal 2004) indicate that efforts should be made
by managers to maintain unique local genetic integrity and to avoid releasing multiple strains into
the same area if the management goal is to establish or supplement a naturalized population. For
walleye specifically, guidelines indicate that if stocking is necessary, introduction of fish from
other stocks (even within the Great Lakes basin) is not recommended. There is currently enough
information on genetic differences among brood source locations to support protecting their
genetic integrity. However, there is currently not enough information on the genetic structure of
walleyes in Michigan to adopt a holistic genetic management unit concept. Generally, walleyes
are stocked from the closest brood source location (e.g. Muskegon River or Bay de Noc) based on
logistics; however, occasionally managers wish to utilize different strains in order to meet
objectives.
67
Recommendation:
We recommend that the stocking of walleye from various brood source locations be based on the
relative risk that it presents to a waterbody, basin, and the overall genetic structure of walleyes in
Michigan. Therefore, the following options listed below have been developed to help guide
managers when determining the best scenario to follow when choosing walleye strains for
stocking. Managers should follow these guidelines when reviewing private stocking permit
applications as well.
1. Waterbodies with no or highly obstructed connection to the Great Lakes and no natural
reproduction may receive walleye from any brood source location.
2. Waterbodies with connection to the Great Lakes and no natural reproduction should receive
walleye from the closest brood source within the basin; however, managers are interested in
having the ability to occasionally stock alternate strains (or approve private stocking of
alternate strains).
3. Waterbodies with documented natural reproduction should use walleye reared from the closest
brood source within the basin or the remnant stock. For most waterbodies this will result in
using one of the three primary brood sources; however, it allows for use of local gametes (e.g.
Little Traverse Bay Band’s use of Cheboygan River walleyes). This recommendation assumes
that there is a relationship between geographic and genetic separation (Wilson et al. 2007).
4. Because there is evidence of genetic differences among the three primary brood source
locations (Muskegon River, Little Bay de Noc, and St. Marys River), connecting waters in the
vicinity of these locations should not be stocked with walleyes from other brood source
locations. Mixing of these stocks may result in outbreeding depression and lower fitness.
Additionally, telemetry studies support relatively strong spawning site fidelity of Great Lakes
walleyes indicating that populations are largely segregated during the spawning season. For
the purposes of this recommendation, grids adjacent to brood source locations were identified
(Figure 1). Walleye stocking in these grids or in tributaries directly connected to these grids
should be limited to the local strain.
5. The stocking of fish from brood source locations with unknown genetic structure (e.g. Lac
Vieux Desert) should be limited to the source location.
Future Work:
There are several outstanding issues that may potentially require additional information. For
example, there is some desire to re-establish a reef-spawning strain in Saginaw Bay. If this
occurred, we would need to identify the most appropriate strain. There is some evidence that the
Lake Gogebic population was established from reef-spawning walleyes from Saginaw Bay.
Similarly, while the current Tittabawassee River/Saginaw Bay population was re-established using
largely Muskegon River walleyes, the genetics of these walleye could potentially be monitored in
the future to determine if they have diverged from other sources. There may be other examples
where additional information would be valuable; thus, further information on the overall genetic
structure of walleye in Michigan should be obtained as opportunities arise.

68
Figure C-1. Primary walleye brood source locations. Highlighted grids represent individual
brood source protection areas where walleyes originating from another source may not be
stocked.
References:
Billington, N.B, B. Sloss, and G. Moyer. 1998. Mitochondrial DNA analysis of walleye
populations from Michigan, Technical Report to Michigan DNR.
Caroffino, D.C., A. M. Mwai, and B. I. Evans. 2011. Population genetics of walleye and yellow
perch in the St. Marys River, Journal of Great Lakes Research 37 Supplement 2:28-34.
Dexter, J.L., Jr., and R.P. O’Neal, editors. 2004. Michigan fish stocking guidelines II: with
periodic updates. Michigan Department of Natural Resources, Fisheries Special Report 32,
Ann Arbor.
Haponski, A.E. and C.A. Stepien. 2014. A population genetic window into the past and future of
the walleye Sander vitreus: relation to historic walleye and the extinct “blue pike” S. v.
“glaucus”, Evolutionary Biology 14:133-X.

69
Scribner, K. and K. Filcek. 2002. Study 723 Final Report. Spatial Genetic Structure of Great
Lakes Populations of Walleye in and around Michigan.
Stepien, C.A., D.J. Murphy, R.N. Lohner, O.J. Sepulveda-Villet, and A.E. Haponski. 2009.
Signatures of vicariance, postglacial dispersal and spawning philopatry: population genetics
of the walleye Sander vitreus, Molecular Ecology 18:3411–3428.
Wilson, C.C., M. Lavender, and J. Black. 2007. Genetic assessment of walleye (Sander vitreus)
restoration efforts and options in Nipigon Bay and Black Bay, Lake Superior, Journal of
Great Lakes Research 33 (Supplement 1):133-144.
70
Appendix D: Walleye regulations toolbox
Fisheries biologists have limited management tools to influence Walleye populations to
achieve desired management goals. Implementing fishing regulations is one such tool that
biologists rely on to protect and conserve populations. Regulations are meant to strike a balance
between providing angling opportunities and ensuring the conservation of a species.
The statewide regulation for Walleye uses a daily possession limit of five fish and a
minimum size limit of 15 inches. The biological justification for this regulation is associated
with the desire to protect juvenile Walleye from harvest prior to maturity and allow for harvest
opportunities of adults that align with sustainable mortality rates. In addition, the closed
possession season in both peninsulas was created to provide protection from harvest during the
spawning season when the species is congregated and vulnerable to harvest.
Fisheries Division has identified a desire to provide a diverse set of angling opportunities,
as described in objective 2 of Charting the course: Fisheries Division’s Framework for
managing aquatic resources, while also striving for simplistic regulations. Walleye population
characteristics and growth potential differs among waters in Michigan and to account for those
differences a limited number of diverse regulation options are warranted. Therefore, the set of
regulatory options listed below were created to provide managers with options to achieve
management goals for the diversity Walleye fisheries in Michigan. Adopting regulatory options
that differ from the widely supported existing statewide regulation (i.e., option 2) should only be
considered by biologists when recent biological and social data for that waterbody are available
and suggest the desired outcome is likely to occur. In addition, the adoption of a new regulation
on any waterbody should be accompanied with an evaluation to determine if desired outcomes
are achieved.
Regulatory options:
1. 15-inch minimum size limit and daily possession limit of 5
Goal: Protect juvenile Walleye from harvest prior to maturity and allow for harvest
opportunities of adults that align with sustainable mortality rates.
2. 13-inch minimum size limit and daily possession limit of 5+
Goal: Provide anglers with increased harvest opportunities while attempting to reduce
density of consistently slow growing populations.
Note: In waters with high density Walleye populations that are hindering prey fish
populations fisheries managers may also consider a daily possession limit that exceeds
five fish.

71
3. 20-inch minimum size limit and daily possession limit of 2
Goal: To maximize the trophy potential and catch rate through catch and release of
quality sized Walleye. In addition, protect adult Walleye from harvest with the intent of
maintaining high density of adult Walleye for predation to improve panfish size structure.
4. No possession of Walleye
Goal: To protect Walleye from harvest with the intent of using Walleye predation to
improve panfish size structure in waters with stunted panfish populations. Also, to
prevent human consumption of contaminated fish.
5. Delayed possession season (May 15th) in the Lower Peninsula
Goal: Protect populations that are congregated during spawning activity in waters that
have colder than average water temperatures compared to other lakes in the Lower
Peninsula.