management of sugarcane harvest residues: consequences for soil carbon and nitrogen
TRANSCRIPT

CSIRO PUBLISHING
www.publish.csiro.au/journals/ajsr Australian Journal of Soil Research, 2007, 45, 13–23
Management of sugarcane harvest residues: consequences for soilcarbon and nitrogen
Fiona A. RobertsonA and Peter J. ThorburnB
ACorresponding author: CRC for Sustainable Sugar Production and BSES Ltd, 50 Meiers Road, Indooroopilly,Qld 4068, Australia. Present Address: Department of Primary Industries, PIRVic., Private Bag 105, Hamilton,Vic. 3300, Australia. Email: [email protected]
BCSIRO Sustainable Ecosystems and CRC for Sustainable Sugar Production, Queensland Bioscience Precinct,306 Carmody Road, St Lucia, Qld 4067, Australia.
Abstract. The Australian sugar industry is moving away from the practice of burning the crop before harvest to asystem of green cane trash blanketing (GCTB). Since the residues that would have been lost in the fire are returned to thesoil, nutrients and organic matter may be accumulating under trash blanketing. There is a need to know if this is the case,to better manage fertiliser inputs and maintain soil fertility. The objective of this work was to determine whether conversionfrom a burning to a GCTB trash management system is likely to affect soil fertility in terms of C and N. Indicators ofshort- and long-term soil C and N cycling were measured in 5 field experiments in contrasting climatic conditions.
The effects of GCTB varied among experiments. Experiments that had been running for 1–2 years (Harwood) showed nosignificant trash management effects. In experiments that had been running for 3–6 years (Mackay and Tully), soil organicC and total N were up to 21% greater under trash blanketing than under burning, to 0.10 or 0.25 m depth (most of this effectbeing in the top 50 mm). Soil microbial activity (CO2 production) and soil microbial biomass also increased under GCTB,presumably as a consequence of the improved C availability. Most of the trash C was respired by the microbial biomassand lost from the system as CO2. The stimulation of microbial activity in these relatively short-term GCTB systems wasnot accompanied by increased net mineralisation of soil N, probably because of the greatly increased net immobilisationof N. It was calculated that, with standard fertiliser applications, the entire trash blanket could be decomposed withoutcompromising the supply of N to the crop. Calculations of possible long-term effects of converting from a burnt to aGCTB production system suggested that, at the sites studied, soil organic C could increase by 8–15%, total soil N couldincrease by 9–24%, and inorganic soil N could increase by 37 kg/ha.year, and that it would take 20–30 years for the soilsto approach this new equilibrium. The results suggest that fertiliser N application should not be reduced in the first 6 yearsafter adoption of GCTB, but small reductions may be possible in the longer term (>15 years).
Additional keywords: residue retention, microbial biomass, N mineralisation, C mineralisation, C sequestration.
Introduction
The Australian sugar (Sacharum spp.) industry is concentratedalong the east coast of Queensland and northern New SouthWales, a region which coincides with many environmentallysensitive natural areas, including the Great Barrier Reef. Nutrientconcentrations in some river and marine systems are believed tohave increased substantially since European settlement due toinputs from agricultural, commercial, and residential activities(Furnas 2002; Productivity Commission 2003). Being locatedprimarily on the coastal plains and river valleys, and being alarge user of nitrogen (N) fertilisers, the sugarcane industry maybe a contributor to the nutrients in these systems (ProductivityCommission 2003).
Recommended N fertiliser applications for sugarcane aregenerally 100–200 kg N/ha.year (Calcino 1994), based on asystem of management where harvest residues (trash) are burntand the soil cultivated several times every year. Over the last25 years, however, sugarcane growers have increasingly adopted
a system of green cane trash blanketing (GCTB), where trashis retained as an undisturbed layer on the soil surface andcultivation is greatly reduced. Around 70% of the Australiansugar crop is currently grown under GCTB (Kingston and Norris2001). The GCTB system is seen as being more environmentallybenign than the traditional burnt system because it reducesrunoff and soil erosion (Prove et al. 1995) and causes noair pollution.
In the burnt system, >70% of the organic matter and nutrientsin the trash are lost to the atmosphere (Mitchell et al. 2000).Conversely, with retention of trash, nutrients and organic mattermay be accumulating in the soil. Increases in total soil N, organiccarbon (C), and N mineralisation have been reported under aGCTB system in northern Australia (Wood 1991; Sutton et al.1996). Retention of crop residues has been shown to increasesoil organic matter and soil nutrient contents in other croppingsystems (Larson et al. 1972; Barber 1979), but the effects of trashconservation on the fertility of canelands is not well understood.
© CSIRO 2007 10.1071/SR06080 0004-9573/07/010013

14 Australian Journal of Soil Research F. A. Robertson and P. J. Thorburn
This knowledge gap needs to be filled if fertiliser inputs are tobe managed appropriately to maintain soil fertility and minimiseenvironmental contamination.
The objective of this work was to determine how theconversion from a burning to a GCTB trash management systemaffected soil C and N fertility. This was done by measuringthe effects of sugarcane trash management (burnt or GCTB)on indicators of short- and long-term soil C and N cycling undercontrasting climatic conditions.
MethodsField experimentsThe field experiments and experimental sites are describedmore fully in Robertson and Thorburn (2007, this issue). Thisstudy was conducted on 5 field experiments that had beenestablished by other researchers to measure the effects oftrash management on sugarcane productivity. They were in3 contrasting climatic zones: Harwood (northern New SouthWales, subtropical), Mackay (central Queensland, tropical), andTully (north Queensland, wet tropical) (Fig. 1, Table 1).
In each experiment (conducted between October 1996 andAugust 1998), 2 trash management treatments were compared:(1) Burnt, trash burnt before or after harvest, and (2) GCTB,sugarcane harvested without burning and trash retained on thesoil surface. In the Mackay and Tully experiments, the burnttreatments were cultivated and the GCTB treatments were not(according to usual grower practice). In Harwood, neither of thetreatments was cultivated. In the GCTB treatments, the trash wasleft as a blanket on the soil surface. In the burnt treatments atHarwood and Mackay, the trash was burnt on the ground afterharvest. In the burnt treatments at Tully, the cane was burnt beforeharvest and residual trash burnt on the ground after harvest. Thecrops were in the first to sixth ratoon of the first crop cycle,meaning that the GCTB treatments had received trash returnsfor 1–6 years.
In both Harwood and Mackay, there were 2 experiments, onewhere the crop was harvested early in the season, and one wherethe crop was harvested late in the season. The Tully experimentwas harvested late in the season. All experiments were designedas randomised complete blocks. The experiments were dividedinto 4 replicate plots at Harwood (15 m by 6 rows) and Mackay(18 m by 4 rows). The Tully experiment had 3 replicate plots
Table 1. Summary of the field experiments
Harwood Mackay Tully
Grid reference 29.50S, 153.20E 21.10S, 149.07E 17.56S, 145.56EAnnual rainfall (mm) 1021 1668 4067Trash management treatments Trash blanket; burnt (post-harvest) Trash blanket; burnt (post-harvest) Trash blanket; burnt (pre- and
post-harvest)Crop harvest treatments Late (December 1996); early Late (November 1996); early Late (October 1996)
(August 1997) (July 1997)Replicates 4 4 3Planting date July 1994 July 1992 July 1990Years of trash return (GCTB) 1 (late); 2 (early) 4 (late); 5 (early) 6 (late)Soil texture (%sand, %silt, %clay) Clay loam (26, 34, 40), reps 1 & 2; Sandy loam (54, 26, 20) Clay (27, 34, 39)
clay (18, 28, 54), reps 3 & 4Previous cropping Sugarcane (burnt), vegetables Sugarcane (burnt) Sugarcane (burnt)
Tully
Mackay
Harwood
TROPIC OF
CAPRICORN Queensland
New South Wales
N
Fig. 1. Map of Australia showing the locations of the experimental sites.
(10 m by 6 rows) but on most occasions only 2 replicateswere sampled in the burnt treatments, due to the inadvertentcultivation of one of the plots. In each case, the row spacing was1.5 m, and the cane variety was Q124.
The crops were fertilised within 6 weeks of harvest(160–200 kg N (as urea), 14–20 kg P, 90–125 kg K, and16–25 kg S) according to standard practices. The fertiliser wasapplied differently at each site: on the surface on either side of therow in Harwood; in the centre of the row using a stool-splitterin Mackay; and on either side of the row in Tully (below thesurface in the burnt treatments, and on the surface of the trashtreatments). The Mackay experiments each received 70 mm ofsprinkler irrigation; the Harwood and Tully experiments werenot irrigated.
In order to measure trash decomposition on the GCTB plots,recently harvested trash was placed within multiple quadrats(1.50 by 0.75 m) after first raking off underlying trash. Thequadrats were held in place by steel pegs, and covered with20-mm mesh netting. There were 7 quadrats per replicate inthe Harwood experiments, 8 in Tully, 7 in Mackay (Early), and9 in Mackay (Late). Over the following year, one quadrat wasdestructively sampled per replicate every 4–6 weeks. First, alltrash that had not become incorporated with the soil (termed‘free trash’) was removed. Trash that had become incorporatedwith the soil (termed ‘incorporated trash’) was then sampled by
Effects of sugarcane trash on soil C and N Australian Journal of Soil Research 15
removing soil and trash from a strip (175 mm wide by 1500 mmlong by about 20 mm deep) down the middle of the quadrat.The soil was then sampled within the quadrat by taking 12 cores(30–34 mm internal diameter) in 2 regular transects from the topof one row, across the inter-row, to the top of the next row. Thecores were cut into depth layers (0–0.02, 0.02–0.05, 0.05–0.10,and 0.10–0.25 m) and samples pooled from each depth. Soil inthe burnt plots was sampled in the same way from an area ofapproximately 1.50 by 0.75 m, although there was no trash.
Soil bulk density was measured on 2 occasions in each of theTully, Mackay (Late) and Mackay (Early) experiments, usingsteel rings (70 mm diameter by 50 mm deep) to 0.25 m depth.
Analytical methodsThe field-moist soils were sieved (<7 mm) and any large piecesof organic material other than trash were removed. Soils werestored at 4◦C for 1–10 days before analysis. Soil water contentwas determined by drying for 24 h at 105◦C. Soil inorganicN (ammonium + nitrate) was determined by extracting 15-gportions of field-moist soil in 45 mL of 2 M potassium chloride,filtering the extract through Whatman 42 filter paper, andmeasuring ammonium and nitrate by automated colourimetricanalysis (Rayment and Higginson 1992, method 7C2). Soilmicrobial biomass C was determined by the chloroformfumigation-extraction method of Vance et al. (1987), whichuses 0.5 M potassium sulfate as an extractant. Organic C inthe extracts was measured by dichromate oxidation (Heanes1984) and spectrophotometry. The determinations were doneon 15-g portions of field-moist soil, made up to a standardgravimetric water content (30% for Mackay soils, 35% forHarwood soils, and 40% for Tully soils) that was approximately80% of water holding capacity. This relatively high proportionof water holding capacity was chosen because it was expectedthat the Tully soils would frequently be wetter than the morecommonly used water content of 50% water holding capacity.The microbial biomass method yielded some negative valuesif C from the unfumigated soil (Cunfum) was subtracted fromC from the fumigated soil (Cfum). However, Cfum was wellcorrelated with Cfum – Cunfum (Table 2). Therefore, Cfum ispresented as an index of microbial biomass C. Where microbialbiomass is shown as kg/ha this has been calculated frompositive values of (Cfum − Cunfum) only, using a Kc factor of 0.38(Vance et al. 1987).
Soil N and C mineralisation were measured as the changein inorganic N (ammonium + nitrate) and the release of carbondioxide, respectively, during a 7-day aerobic incubation at 25◦C.
Table 2. Correlations between Cfum and (Cfum − Cunfum) in the soilmicrobial biomass assay
Negative values of (Cfum − Cunfum) omitted. Pooled data from eachexperiment
Experiment Correlation coefficient P n
Harwood (Late) 0.89 0.001 167Mackay (Late) 0.94 0.001 278Tully 0.88 0.001 138Harwood (Early) 0.92 0.001 245Mackay (Early) 0.91 0.001 221
Again, 15-g portions of field-moist soil were used, made upto the standard water contents above. Carbon dioxide wastrapped in 1 M sodium hydroxide and determined by titrationagainst dilute hydrochloric acid (Zibilske 1994). In soils fromseveral samplings (Mackay late harvest days 124 and 169,and Tully days 1, 210, and 266), some mineralisation ofinorganic N occurred during storage. In those soils, the startinginorganic N content for the incubation was taken as thatdetermined soon after sampling instead of that determinedon the day the incubations commenced. This increased the Nmineralisation value, but had no effect on treatment differencesor time trends. The C : N mineralisation ratio of the incubatedsoils was calculated as the ratio of C mineralisation to Nmineralisation. Where net N mineralisation was negative (i.e. netimmobilisation of N occurred), and where net mineralisationwas <0.2 µg N/g.day, the value of the N mineralisation was setto 0.2 µg N/g.day.
Soil organic C and total N were determined on driedsubsamples ground to <250 µm. Total N was determined byKjeldahl digestion followed by automated colorimetric analysis(Rayment and Higginson 1992, method 7A2). Organic C in soilwas determined by the Heanes dichromate oxidation method,which measures total organic C but not carbonate (Heanes 1984;Rayment and Higginson 1992, method 6B1).
Calculations and statistical analysesThe effects of trash management, soil depth, and samplingtime were tested separately for each experiment by analysisof variance for a randomised complete block design usingthe SYSTATr program (SPSS Inc.). Allowance was made forthe unequal number of replicates in the Tully experiment.Relationships between selected variables were investigatedusing Pearson correlation and linear regression. Unless statedotherwise, effects were taken as significant where Bonferroniprobabilities were ≤0.05.
Cumulative trash returns since the establishment of theoriginal field experiments were estimated using the averagerelationship between trash DM and fresh cane yield measured inthe current experiments (Trash DM = cane fresh weight × 0.1).Cumulative returns of C and N in trash were estimated byassuming concentrations of C = 45% and N = 0.55% (meansfrom the 5 experiments, Robertson and Thorburn 2007).
Where soil measurements are expressed on a kg/ha basis,these were calculated using measured bulk density data for theTully and Mackay experiments and an assumed bulk density(mean of all measurements) for the Harwood experiments.
Results
Soil organic C and total N
Soil organic C and total N were greater under trash blanketingthan under burning in the 0–0.02 and 0.02–0.05 m depth layersof the older (Mackay and Tully) experiments (Figs 2 and 3). Thisdifference between trash and burning was generally significantwhen averaged to 0.10 m at Mackay and to 0.25 m at Tully(data not shown). At Harwood, soil organic C and total N weregenerally not significantly affected by trash management. In thelate-harvested experiment at Harwood, however, there was atrend for greater soil C and N in burnt plots than in GCTB plots.

16 Australian Journal of Soil Research F. A. Robertson and P. J. Thorburn
(a) Harwood (Late)
Burnt
GCTB
0 100 200 300 4000
1
2
3100 200 300 400
Days after harvest
0
1
2
3
Soi
l org
anic
C (
%)
0
1
2
3(b) Harwood (Early)
(c) Mackay (Late) (d ) Mackay (Early)
(e) Tully (Late)
Days after harvest
Fig. 2. Soil total organic C under GCTB and burnt trash management(0–0.05 m depth). Asterisk indicates trash management treatments aresignificantly different (P < 0.05).
This is not considered to be a true treatment effect, but rather aneffect of the growth of algae and moss on the soil surface, andthe presence of broadleaf weed plants and seeds, which occurredin the burnt plots but not in the GCTB plots. Soil organic Cand total N were greater at Harwood than at Mackay and Tully(Figs 2 and 3).
Stratification of soil C and N by depth under GCTB was morepronounced at Tully and Mackay (Tully data shown in Fig. 4a, b).The trash effect on soil organic C and total N increased withcumulative C and N returns from trash (Fig. 5a, b). The slopeof the regression lines suggested that soil organic C increasedby 126 kg/ha for every t C returned, and soil N increased by0.79 kg/ha for every kg N returned (equivalent to approximately560 kg C/ha and 43 kg N/ha for every 100 t fresh cane yield).
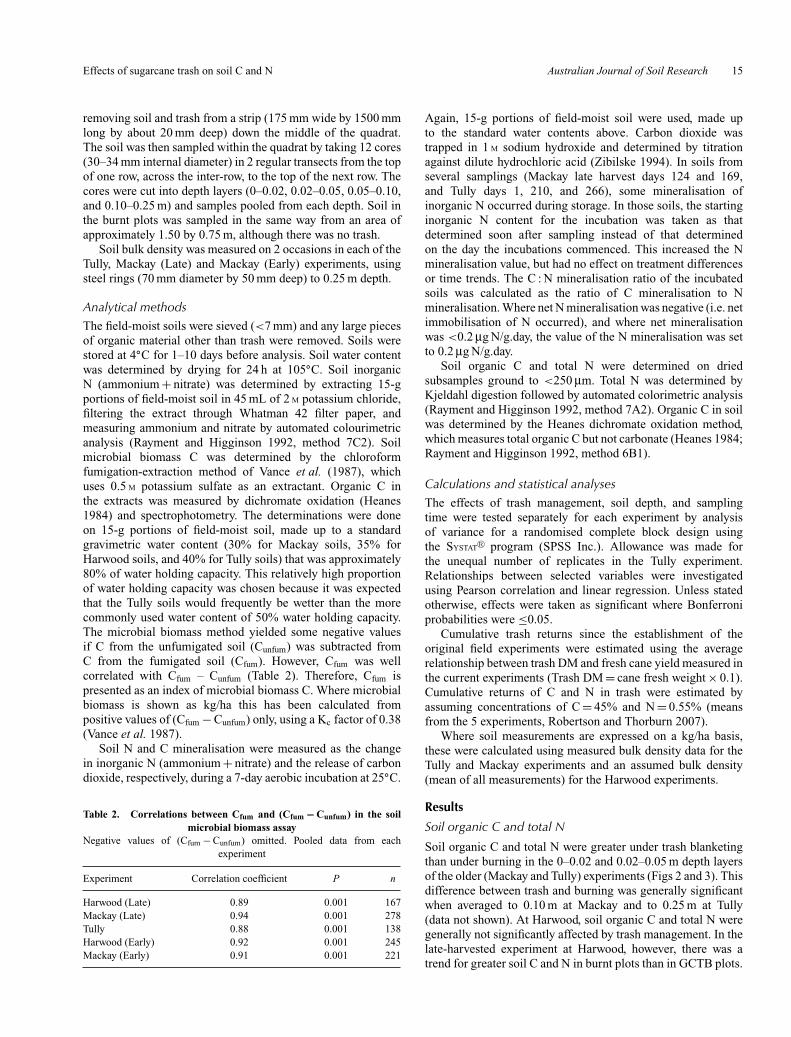
Soil inorganic N
Soil inorganic N concentration increased following fertiliserapplication, and declined to background concentrations withinabout 2–3 months (Fig. 6). Variation among replicates wasextremely large after fertilisation due to the presence ofundissolved fertiliser granules. There were no consistentdifferences between trash management treatments in inorganicN concentration (some statistically significant differences wereobserved, but they are not considered true treatment effects).
0 100 200 300 4000.0
0.1
0.2
0.3
BurntGCTB
0.0
0.1
0.2
0.3
100 200 300 400
0.0
0.1
0.2
0.3 (a) Harwood (Late)
Days after harvestS
oil t
otal
N (
%)
(b) Harwood (Early)
(c) Mackay (Late) (d ) Mackay (Early)
(e) Tully (Late)
Days after harvest
Fig. 3. Soil total N under GCTB and burnt trash management (0–0.05 mdepth). Asterisk indicates trash management treatments are significantlydifferent (P < 0.05).
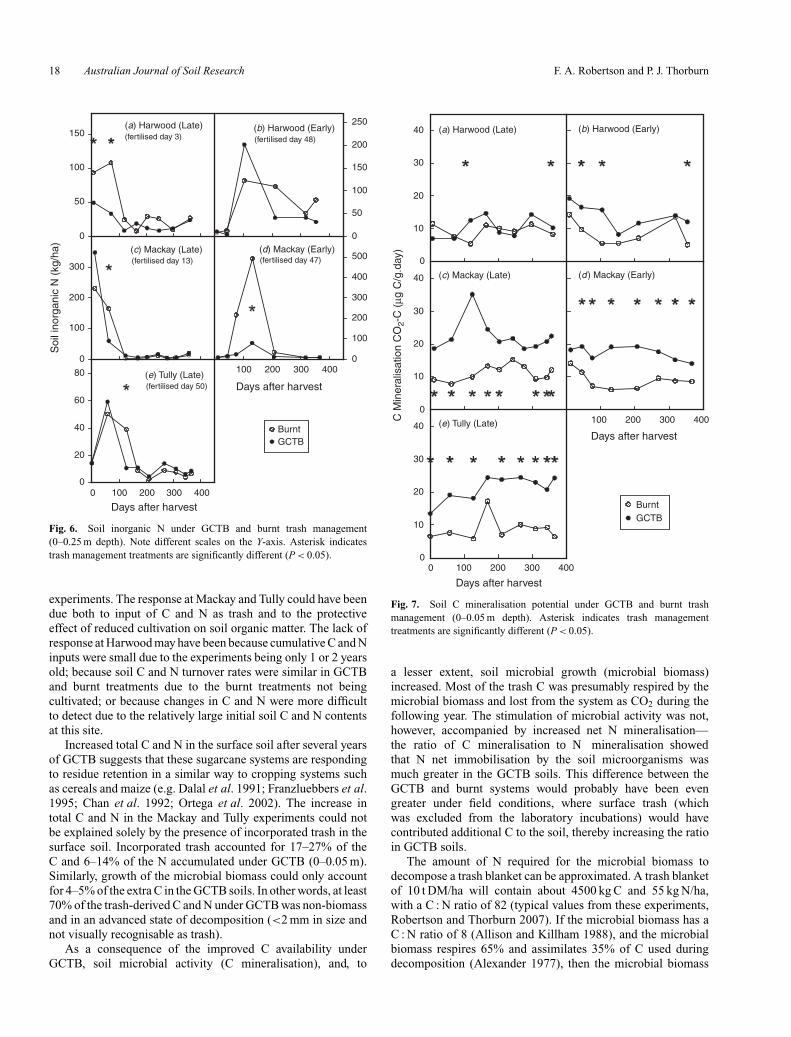
Soil C mineralisation
At most sampling dates, C mineralisation (Fig. 7) was increasedby GCTB in the 0–0.02 m depth, and the effect was generallysignificant when averaged over the top 0.05 m. As with totalorganic C, stratification of C mineralisation activity was greaterunder trash (Tully data shown in Fig. 4c). The size of the trasheffect increased with increasing cumulative C returned in trash(Fig. 5c).
Soil net N mineralisation
Soil net N mineralisation generally did not differ significantlybetween trash management treatments at any depth or at anysampling time, when data from individual experiments andsampling times were analysed separately. However, when datafrom all sampling dates within an experiment were pooled,net N mineralisation was lower in GCTB soils than burnt soilsfrom 0–0.02 m at Mackay (Table 3). Net N mineralisationdid not change significantly with depth (data not shown).Variability among replicates was large, and there were no trendswith time.
Soil C : N mineralisation ratio
The C : N mineralisation ratio of the surface 0.10 m of soilwas greater in GCTB than in burnt treatments, particularly inthe 0–0.02 m depth and in the Mackay and Tully experiments.Means for the 0–0.05 m depth are shown in Fig. 8. The C : N

Effects of sugarcane trash on soil C and N Australian Journal of Soil Research 17
0 0.1 0.2
0.30
0.20
0.10
00 1 2 3
GCTB
Burnt
0 10 20 30 40
0
400 500 600 700
(a) (b)
(c) (d )
Total C (%) Total N (%)
0.30
0.20
0.10
Dep
th (
m)
CO2-C (µg/g.day) Microbial C (µg C/g)
Fig. 4. Soil C and N measurements under GCTB and burnt trashmanagement at Tully, to 0.25 m depth. Data are means from all samplingdates. Asterisk indicates trash management treatments are significantlydifferent (P < 0.05).
0 10 20 30
0
50
100
150
200
0 10 20 300
2
4
6
8
10
0 100 200 300 400
0
100
200
300
400
0
1000
2000
3000
4000
0 10 20 30
(a) (b)
(c) (d )
r 2 = 0.86y = 126X
r 2 = 0.80y = 0.79X
r 2 = 0.80y = 5.3X
r 2 = 0.95y = 0.31X
Cumulative C input (t/ha)
Cumulative C input (t/ha) Cumulative N input (kg/ha)
Tras
h ef
fect
on
CO
2-C
(kg
/ha.
day)
Tras
h ef
fect
on
soil
orga
nic
C (
kg/h
a)
Tras
h ef
fect
on
mic
robi
al C
(kg
/ha)
Tras
h ef
fect
on
soil
tota
l N (
kg/h
a)
Fig. 5. Relationships between cumulative trash C and N inputs and trash effect on soil C and N (0–0.10 m)in the field experiments.
mineralisation ratio showed no consistent trends below 0.10 m,and there were no regular time trends.
Soil microbial biomass C
The soil microbial biomass C index was increased by trashblanketing at Mackay and Tully in the 0–0.02 and 0.02–0.05 mlayers (Fig. 9 shows means for 0–0.05 m). The effect wasgenerally still significant when averaged over the top 0.10 mof soil (data not shown). The microbial biomass index was notsignificantly affected by trash management at Harwood. TheTully soils had more microbial C than the Harwood and Mackaysoils. There was considerable temporal variation in microbialbiomass (except Harwood (Early)). Microbial C in the burntand the GCTB treatments was generally well correlated (overallr = 0.81, P < 0.05).
As for total organic C, the microbial biomass C indexdecreased more markedly with depth in GCTB than in burntsoils (Tully data shown in Fig. 4d). The magnitude of the trashresponse was directly proportional to cumulative C returns intrash, with microbial biomass C increasing by about 5 kg C/hafor every t trash-C returned (equivalent to approximately 22 kg Cfor every 100 t fresh cane yield) (Fig. 5d).
Discussion
Soil C and N cycling
The GCTB system caused total soil C and N to increase inthe Mackay and Tully experiments but not in the Harwood
18 Australian Journal of Soil Research F. A. Robertson and P. J. Thorburn
BurntGCTB
100 200 300 4000
100
200
300
400
500
0
50
100
150
200
250
0 100 200 300 4000
20
40
60
80
0
100
200
300
0
50
100
150(a) Harwood (Late)
Days after harvest
Soi
l ino
rgan
ic N
(kg
/ha)
(b) Harwood (Early)
(c) Mackay (Late) (d) Mackay (Early)
(e) Tully (Late)
Days after harvest
(fertilised day 3) (fertilised day 48)
(fertilised day 13) (fertilised day 47)
(fertilised day 50)
Fig. 6. Soil inorganic N under GCTB and burnt trash management(0–0.25 m depth). Note different scales on the Y-axis. Asterisk indicatestrash management treatments are significantly different (P < 0.05).
experiments. The response at Mackay and Tully could have beendue both to input of C and N as trash and to the protectiveeffect of reduced cultivation on soil organic matter. The lack ofresponse at Harwood may have been because cumulative C and Ninputs were small due to the experiments being only 1 or 2 yearsold; because soil C and N turnover rates were similar in GCTBand burnt treatments due to the burnt treatments not beingcultivated; or because changes in C and N were more difficultto detect due to the relatively large initial soil C and N contentsat this site.
Increased total C and N in the surface soil after several yearsof GCTB suggests that these sugarcane systems are respondingto residue retention in a similar way to cropping systems suchas cereals and maize (e.g. Dalal et al. 1991; Franzluebbers et al.1995; Chan et al. 1992; Ortega et al. 2002). The increase intotal C and N in the Mackay and Tully experiments could notbe explained solely by the presence of incorporated trash in thesurface soil. Incorporated trash accounted for 17–27% of theC and 6–14% of the N accumulated under GCTB (0–0.05 m).Similarly, growth of the microbial biomass could only accountfor 4–5% of the extra C in the GCTB soils. In other words, at least70% of the trash-derived C and N under GCTB was non-biomassand in an advanced state of decomposition (<2 mm in size andnot visually recognisable as trash).
As a consequence of the improved C availability underGCTB, soil microbial activity (C mineralisation), and, to
BurntGCTB
0 100 200 300 4000
10
20
30
40100 200 300 400
0
10
20
30
40
0
10
20
30
40 (a) Harwood (Late)
Days after harvest
(b) Harwood (Early)
(c) Mackay (Late) (d ) Mackay (Early)
(e) Tully (Late)
Days after harvest
C M
iner
alis
atio
n C
O2-
C (
µg C
/g.d
ay)
Fig. 7. Soil C mineralisation potential under GCTB and burnt trashmanagement (0–0.05 m depth). Asterisk indicates trash managementtreatments are significantly different (P < 0.05).
a lesser extent, soil microbial growth (microbial biomass)increased. Most of the trash C was presumably respired by themicrobial biomass and lost from the system as CO2 during thefollowing year. The stimulation of microbial activity was not,however, accompanied by increased net N mineralisation—the ratio of C mineralisation to N mineralisation showedthat N net immobilisation by the soil microorganisms wasmuch greater in the GCTB soils. This difference between theGCTB and burnt systems would probably have been evengreater under field conditions, where surface trash (whichwas excluded from the laboratory incubations) would havecontributed additional C to the soil, thereby increasing the ratioin GCTB soils.
The amount of N required for the microbial biomass todecompose a trash blanket can be approximated. A trash blanketof 10 t DM/ha will contain about 4500 kg C and 55 kg N/ha,with a C : N ratio of 82 (typical values from these experiments,Robertson and Thorburn 2007). If the microbial biomass has aC : N ratio of 8 (Allison and Killham 1988), and the microbialbiomass respires 65% and assimilates 35% of C used duringdecomposition (Alexander 1977), then the microbial biomass

Effects of sugarcane trash on soil C and N Australian Journal of Soil Research 19
Table 3. Soil net N mineralisation (�g/g.day) during incubation,0–0.02 m depth
Data from all sampling dates included (except data from the 2 sampling datesafter fertiliser application)
Site Burnt GCTB SignificanceA
Late harvestHarwood 0.38 0.32 n.s.Mackay 0.32 −0.12 **Tully 0.20 0.03 n.s.
Early harvestHarwood 0.31 0.38 n.s.Mackay 0.37 0.12 n.s.
ASignificance of trash management effect as determined by independentt-test: **P < 0.01, n.s., P > 0.05.
0
50
100
150
200
HE HL ME ML TL
Experiment
C :
N M
iner
alis
atio
n ra
tio
GCTB BURNT
* *
**
*
Fig. 8. Ratio of C : N mineralisation during 7-day incubation of soils fromGCTB and burnt trash management treatments. Data are means from the0–0.05 m depth and all sampling dates. Experiments: HE, Harwood Early;HL, Harwood Late; ME, Mackay Early; ML, Mackay Late; TL, Tully Late.Asterisk indicates trash management treatments are significantly different(P < 0.05).
will immobilise a total of 197 kg N/ha during decompositionof the entire trash blanket. However, because of internalre-cycling of N during mineralisation–immobilisation turnover,the microbial biomass will need less than half this amountof N (Jensen 1997; Ehaliotis et al. 1998), or a maximum of99 kg N/ha. Around 55 kg of this microbial N demand couldbe supplied from the trash, leaving 44 kg N to be suppliedfrom either fertiliser or mineralisation of soil organic matter.If 180 kg N/ha is applied as fertiliser to a 100 t/ha crop with aN requirement of 180 kg N/ha (Calcino 1994, with allowancemade for roots), and 40% of the crop N requirement originatesfrom fertiliser (Vallis et al. 1996a), then the remaining 60% ofits N requirement, or 108 kg N/ha, must be mineralised fromthe soil organic matter. Net N mineralisation during aerobicincubation of 29 sugarcane soils was found by Schroeder andWood (2001) to be equivalent to 10–82 (mean 29) kg N/hafrom the 0–0.20 m depth over a 2-week period. This suggeststhat mineralisation of 108 kg N/ha from soil organic matterover a growing season could be achieved easily. If 20% ofthe applied fertiliser is lost from the root-zone (Vallis et al.1996a), this leaves 144 kg N/ha in the system. So total Ndemand (crop + microorganisms) would be 279 kg N/ha, andtotal N supply (trash + fertiliser + soil) would be 307 kg N/ha.Thus, the entire trash blanket could be decomposed without
0 100 200 300 4000
200
400
600
800
100 200 300 4000
200
400
600
0
200
400
600
Burnt
GCTB
(a) Harwood (Late)
Days after harvest
(b) Harwood (Early)
(c) Mackay (Late) (d ) Mackay (Early)
(e) Tully (Late)
Days after harvest
Mic
robi
al b
iom
ass
C in
dex
(µg
C/g
)
Fig. 9. Soil microbial biomass C index under GCTB and burnt trashmanagement (0–0.05 m depth). Asterisk indicates trash managementtreatments are significantly different (P < 0.05).
compromising the supply of N to the crop. That sufficientN is available in GCTB systems to satisfy both crop andmicrobial biomass is consistent with the finding that equallygood crops can be grown under the burnt and GCTB systemsusing N fertiliser application rates devised for the burntsystem (Chapman 1990). These calculations do, however,suggest that reductions in N fertiliser application would not beappropriate under GCTB, unless significant extra N was beingmineralised from old trash accumulated over many years (to bediscussed later).
The results here showing greater immobilisation of Nunder GCTB are consistent with findings of increased Nimmobilisation in the early years of residue retention inother cropping systems (Christensen 1986; Jensen et al. 1997).In some systems (e.g. cereal production in subtropical Australia),residue retention can stimulate immobilisation to the detrimentof the crop, necessitating larger N fertiliser applications whereresidues are conserved (Thompson 1992). Sugarcane crops donot appear to suffer N stress because of trash conservation,perhaps because the historically large fertiliser inputs havecontributed to larger reserves of mineral or mineralisable soil N.

20 Australian Journal of Soil Research F. A. Robertson and P. J. Thorburn
During the last 20 years, average N applications across the sugarindustry have been 2 kg N/t sugarcane yield, whereas averageN requirements were somewhat less than this (Peter Thorburn,unpublished data). Crop N stress may also be avoided becausethe trash blanket is decomposed gradually over a whole year(Robertson and Thorburn 2007).
The proportion of free trash C remaining on the soil surfacein the GCTB treatments after 1 year (2–18%) was about thesame as the proportion that remains after trash is burnt (2–20%,Mitchell et al. 2000). However, some of the C lost from freetrash became incorporated trash, microbial biomass, and soilorganic matter, thereby effecting the increase in soil C.In contrast to the biologically labile nature of the C returnedunder GCTB, the C remaining after a fire probably containeda significant quantity of charcoal-like material that wasbiologically inert (Skjemstad et al. 1999). Thus, the apparentlysimilar surface retention of trash in the GCTB and burnt systemsbelied the important contribution of the GCTB system to activesoil organic matter.
The magnitude of the trash effect on soil C and N dependedon the cumulative amount of trash returned to the soil.The regression of cumulative trash returns against measuredincreases in soil total C and N suggested that about 13% ofcumulative C inputs and 79% of cumulative N inputs wereretained in the soil (Fig. 5). Most of the remaining C would havebeen lost through microbial respiration, and a small proportionmay have been leached below 0.25 m. The remaining N couldhave been lost by denitrification, leaching or crop uptake.However, this apparent retention of trash C and N was quitevariable (10–20% for C and 40–100% for N). Similar rates ofretention of residue C (11–18% of inputs) have been reportedduring the first 10 years of residue conservation in cerealcropping systems in temperate regions (Barber 1979; Sørensen1987; Duiker and Lal 1999). In the semiarid United States,Rasmussen et al. (1980) reported 18% retention of C and 75%retention of N from wheat straw returns. In subtropical Australia,Dalal et al. (1991) found that 16% of wheat residue C wasretained in the soil after 5 years and that this declined to 3%after 20 years.
The GCTB effect on soil microbial biomass C and Cmineralisation also increased with increasing cumulative trashreturns. This suggests that much of the GCTB effect on theseproperties was due to old trash (>1 year old), i.e. old trashwas biologically active, or else altered the soil environment inways promoting microbial activity. In most residue conservationsystems with minimum tillage, including GCTB, some of theincrease in soil C (relative to burnt and conventionally cultivatedsites) could be due to preservation of soil organic matter fromreduced cultivation. At the Mackay site, Blair (2000) measured areduction in soil organic C after the burnt and GCTB plots werecultivated for 4 years. In wheat cropping systems, Chan et al.(2002) found that cultivation had a greater effect in reducingtotal soil C than stubble burning, although Dalal et al. (1991)found that cultivation had little effect.
Long-term soil C and N status under GCTB
The rates of accumulation and mineralisation of C and N underGCTB measured in these experiments can only be consideredindicative of the first crop cycle (commonly 5–6 years) after
conversion from a burnt to a GCTB system. At the end ofa crop cycle, sugarcane soils are normally cultivated severaltimes to 0.15–0.25 m depth, the effect of which may be toreduce differences in soil C and N between burnt and GCTBtreatments (e.g. Stockfisch et al. 1999; Pankhurst et al. 2002).Since the sampling for this study was completed, the Mackay(Early) experiment has been ploughed out and re-planted withsugarcane, and the trash management effects on soil total C and Nare still evident (Table 4). Rates of C and N accumulation inGCTB systems must be expected to decrease with time andreach an equilibrium level, as happens in other crop and pasturesystems (Russell 1980; Jenkinson 1991), because mineralisationand loss of C and N from the soil (through respiration, leaching,denitrification, plant uptake) increase.
In order to explore possible long-term responses of soil C andN to trash blanketing, we calculated C and N balances for the top0.25 m of soil. We assumed that trash decomposed as 2 pools:fresh (<1 year old) and old trash (>1 year old), both of whichdecomposed according to first-order kinetics, i.e. a ‘doubleexponential’ model, used by several authors to describe short-and medium-term decomposition of plant residues (Jenkinsonand Ayanaba 1977; Ladd et al. 1981; Andren and Paustian1987; Voroney et al. 1989). The calculations for C and Nin trash were:
TF = TH.e−k1.t (1)
TO = TF.e−k2.t (2)
TT = TF + TO (3)
where TF is mass of fresh trash remaining, TO is mass of oldtrash remaining, TT is mass of total trash remaining, TH is massof fresh trash deposited at harvest, k1 and k2 are rate constants,and t is time (= 1 year).
The half-life (t1/2) of C in fresh trash was set at 0.33 years,corresponding to 12% retention per year (based on averageretention of C from the field experiments of 10% as measuredin surface residue; Robertson and Thorburn 2007), and 13% asmeasured soil retention over 1–5 years (Fig. 5a). The t1/2 ofN in fresh trash was set at 3.1 years, corresponding to 80%retention per year. This was based on the observations that(1) around 20% of the N in fresh trash is water-soluble, and
Table 4. Soil total C and N in Mackay (Early) before and afterploughout-replant (0–0.25 m)
Before-ploughout data is from the final sampling in this study (6 July 1998).After-plough-out is 1 year after cultivation and re-planting of all treatments(soil sampled 1 July 1999), data of Ross Mitchell (unpublished). Asteriskindicates trash management treatments are significantly different (P < 0.05)
Measurement TreatmentBurnt GCTB
Before plough-outOrganic C (%) 1.09 1.14 (*)Total N (%) 0.064 0.069 (*)
After plough-outOrganic C (%) 1.01 1.14 (*)Total N (%) 0.067 0.071 (*)

Effects of sugarcane trash on soil C and N Australian Journal of Soil Research 21
presumably labile (FA Robertson and PJ Thorburn unpublisheddata), (2) that 15–30% of 15N-labelled trash could not beaccounted for in soil or trash after almost 1 year of decompositionunder leaching conditions (FA Robertson unpublished data),and (3) that apparent soil retention of trash N over 1–5 yearswas 79% (Fig. 5b). The t1/2 of old trash was assumed to be7 years for C and 9 years for N [based on t1/2 measured byLadd et al. (1981) for slow-phase decomposition of isotopicallylabelled Medicago littoralis residue in South Australia (8.4 yearsfor C and 10.7 years for N), adjusted for the difference inmean annual temperature between the South Australian site(16.2◦C) and Mackay (22◦C) assuming a temperature coefficient(Q10) of 2 (Campbell et al. 1981)]. Use of results from Laddet al. (1981) can be justified from the observation that slow-phase decomposition of plant materials has been found to beremarkably similar among widely differing species, climates,and decomposition conditions (Jenkinson and Ayanaba 1977;Ladd et al. 1981; Voroney et al. 1989). It was assumed that thetrash-induced increase in soil microbial biomass N was 3% ofthe trash-induced increase in total soil N, this being a commonlymeasured proportion of total soil N present as microbial biomass(e.g. Saffigna et al. 1989). Trash-derived N potentially availablefor plant uptake was calculated as trash N returned minustrash-derived N lost minus trash-derived N immobilised by themicrobial biomass. At the start, the Mackay and Tully soilscontained 40 000 kg C and 2400 kg N/ha, and the Harwood soilscontained 76 000 kg C and 6500 kg N/ha. Annual trash returns of10 t DM, 4500 kg C, and 55 kg N/ha were assumed (Robertsonand Thorburn 2007). It was assumed that the systems werealready in steady-state conditions under the burnt system (i.e.that total soil C and N remained constant through time). Theeffects on soil C and N were calculated until the systems hadreached equilibrium.
These calculations suggested that, at equilibrium, total soilC would have increased by 5800 kg (8–15%), and total soil Nwould have increased by 580 kg (9–24%). The system reached90% of equilibrium after 23–28 years. During the first 4 yearsunder GCTB, the amount of N potentially available for plantuptake (if not lost from the system by leaching or denitrification)was negative, i.e. mineralisation of trash-derived N did notcompensate for microbial immobilisation of trash-derived N.Net mineralisation of trash-derived N gradually increased to37 kg N/ha.year at equilibrium, reaching 90% of equilibriumafter 30 years. This is the maximum amount by which N fertiliserrates could be reduced in GCTB systems (with respect to therecommended N fertiliser rate, based on the burnt system),although smaller reductions in fertiliser application could bepossible before this time. However, fertiliser applications maynot be able to be reduced to this extent if, as has been suggested,N loss through leaching (Vallis et al. 1996b) or denitrification(Chapman and Haysom 1991; Weier et al. 1998) is greater inGCTB than in burnt systems.
The above calculations describe only the extra (trash-derived)N in the GCTB system—the total soil N may increase, remainunchanged, or decrease through time depending on non-trash-related factors. In other words, trash retention will not necessarilyincrease total soil C and N, but it will decrease any declinein C and N. Such a case was reported after 20 years of wheatcropping in Queensland, where total soil N declined under both
stubble retention plus minimum cultivation and stubble burningplus conventional cultivation, although the decline was less inthe former (Dalal 1992).
The factors influencing retention and mineralisation of trashC and N are clearly interrelated, and very complex. Whilst theabove calculations may be useful in exploring possible responsesto trash retention in the absence of better information, thesystem interactions are likely to be better understood with theaid of simulation models such as APSIM (Keating et al. 1999;Thorburn et al. 2001). Modelling investigations supported bythis and other field studies are in progress and will be the subjectof future publications.
The effects of crop residue management on soil C and Nhave been little studied in sugarcane production systems. Oneexception is a field experiment in South Africa which hasbeen running for 60 years (Graham et al. 2000, 2002), whichcompared GCTB and trash burning systems similar to thosecompared in the present study. After 59 years, the GCTBtreatments showed a 4% increase in organic C, 30% increasein total N, and >100% increase in net N mineralisation andmicrobial biomass C and N, to 0.30 m soil depth, when comparedwith the burnt treatments (Graham et al. 2000, 2002). Theseincreases in total N and microbial biomass are larger than foundin this study, as could be expected from the difference in agebetween the experiments. The increased N mineralisation underGCTB differed from this study, but agreed with the predictionsfrom the long-term calculations, and suggests that the SouthAfrican GCTB system was at or approaching equilibrium. Thattrash retention will result in a small increase in total soilC and N and a somewhat greater increase in mineralisablesoil N in the long term also accords with findings in othercropping systems in Australia (Thompson 1992) and Europe(Powlson et al. 1987).
Implications for fertiliser management under GCTB
One of the hopes held for the GCTB system is that the returnof nutrients in trash will increase soil nutrient availability toan extent that will allow fertiliser applications to be reduced(Chapman et al. 1992; Vallis et al. 1996b). This study showsthat decreasing N fertiliser application during the first crop cycle(5–6 years) after conversion to GCTB would be inadvisable.This study also suggests that small reductions in N fertiliserapplication (10–20%, or 15–40 kg) may be possible in themedium to long term (3–4 crop cycles, or 15–25 years), providedthat crop yields and N losses to the environment under GCTBare similar to those under the burnt system. Furthermore,the appropriate time scale for reducing N application islikely to vary from site to site. This is an area requiringfurther study.
Acknowledgments
Thank you to Graham Kingston, Alan Hurney, and Les Chapman forallowing this study to be superimposed on their field experiments andproviding supporting data. Thank you to Ross Mitchell for providing datafor Table 4. Thank you to Kaylene Harris, Ruth Mitchell, Kylee Sankowsky,Patricia Nelson and Jody Biggs for assistance with the field and laboratorywork. We acknowledge funding from the Australian Government andSugarcane Industry through the CRC for Sustainable Sugar Production,BSES Ltd, and the Sugar Research and Development Corporation.

22 Australian Journal of Soil Research F. A. Robertson and P. J. Thorburn
References
Alexander M (1977) ‘Introduction to soil microbiology.’ 2nd edn (KriegerPublishing Company: Malabar, FL)
Allison MF, Killham K (1988) Response of soil microbial biomass to strawincorporation. Journal of Soil Science 39, 237–242. doi: 10.1111/j.1365-2389.1988.tb01210.x
Andren O, Paustian K (1987) Barley straw decomposition in the field:a comparison of models. Ecology 68, 1190–1200. doi: 10.2307/1939203
Barber SA (1979) Corn residue management and soil organic matter.Agronomy Journal 71, 625–627.
Blair N (2000) Impact of cultivation and sugar-cane green trash managementon carbon fractions and aggregate stability for a Chromic Luvisolin Queensland, Australia. Soil and Tillage Research 55, 183–191.doi: 10.1016/S0167-1987(00)00113-6
Calcino DV (1994) ‘Australian sugarcane nutrition manual.’ (BSES:Brisbane)
Campbell CA, Myers RJK, Weier KL (1981) Potentially mineralizablenitrogen, decomposition rates and their relationship to temperature forfive Queensland soils. Australian Journal of Soil Research 19, 323–332.doi: 10.1071/SR9810323
Chan KY, Heenan DP, Oates A (2002) Soil carbon fractions and relationshipto soil quality under different tillage and stubble management. Soil andTillage Research 63, 133–139. doi: 10.1016/S0167-1987(01)00239-2
Chan KY, Roberts WP, Heenan DP (1992) Organic carbon and associatedproperties of a Red Earth after 10 years of rotation under different stubbleand tillage practices. Australian Journal of Soil Research 30, 71–83.doi: 10.1071/SR9920071
Chapman LS (1990) Nitrogen fertilisation for trash conservation farmingat Mackay. Proceedings of the Australian Society of Sugar CaneTechnologists 12, 85–89.
Chapman LS, Haysom MBC (1991) Nitrogen fertilisation for fields withsugar cane crop residues. Proceedings of the Australian Society of SugarCane Technologists 13, 53–58.
Chapman LS, Haysom MBC, Saffigna PG (1992) N cycling incane fields from 15N labelled trash and residual fertiliser.Proceedings of the Australian Society of Sugar Cane Technologists14, 84–89.
Christensen BT (1986) Barley straw decomposition under field conditions:effects of placement and initial nitrogen content on weight lossand nitrogen dynamics. Soil Biology and Biochemistry 18, 523–529.doi: 10.1016/0038-0717(86)90010-6
Dalal RC (1992) Long term trends in total nitrogen of a vertisolsubjected to zero-tillage, nitrogen application and stubble retention.Australian Journal of Soil Research 30, 223–231. doi: 10.1071/SR9920223
Dalal RC, Henderson PA, Glashby JM (1991) Organic matter and microbialbiomass in a vertisol after 20 yr of zero-tillage. Soil Biology andBiochemistry 23, 435–441. doi: 10.1016/0038-0717(91)90006-6
Duiker SW, Lal R (1999) Crop residue and tillage effects on carbonsequestration in a Luvisol in central Ohio. Soil and Tillage Research52, 73–81. doi: 10.1016/S0167-1987(99)00059-8
Ehaliotis C, Cadisch G, Giller KE (1998) Substrate amendments canalter microbial dynamics and N availability from maize residues tosubsequent crops. Soil Biology and Biochemistry 30, 1281–1292.doi: 10.1016/S0038-0717(98)00035-2
Franzluebbers AJ, Hons FM, Zuberer DA (1995) Soil organic carbon,microbial biomass, and mineralizable carbon and nitrogen in sorghum.Soil Science Society of America Journal 59, 460–466.
Furnas M (2002) ‘Catchments and corals terrestrial runoff to the GreatBarrier Reef.’ (AIMS and CRC Reef: Townsville, Qld)
Graham MH, Haynes RJ, Meyer JH (2000) Changes in soil fertility inducedby trash retention and fertiliser applications on the long-term trashmanagement trial at Mount Edgecombe. Proceedings of the SouthAfrican Sugar Technologists Association 74, 109–113.
Graham MH, Haynes RJ, Meyer JH (2002) Soil organic matter content andquality: effects of fertilizer applications, burning and trash retention ona long-term sugarcane experiment in South Africa. Soil Biology andBiochemistry 34, 93–102. doi: 10.1016/S0038-0717(01)00160-2
Heanes DL (1984) Determination of total organic-C in soils by animproved chromic acid digestion and spectrophotometric procedure.Communications in Soil Science and Plant Analysis 15, 1191–1213.
Jenkinson DS (1991) The Rothamsted long-term experiments: are they stillof use? Agronomy Journal 83, 2–10.
Jenkinson DS, Ayanaba A (1977) Decomposition of carbon-14 labelledplant material under tropical conditions. Soil Science Society of AmericaJournal 41, 912–915.
Jensen ES (1997) Nitrogen immobilization and mineralization during initialdecomposition of 15N-labelled pea and barley residues. Biology andFertility of Soils 24, 39–44. doi: 10.1007/BF01420218
Jensen LS, Mueller T, Magid J, Nielsen NE (1997) Temporal variation of Cand N mineralization, microbial biomass and extractable organic poolsin soil after oilseed rape straw incorporation in the field. Soil Biology andBiochemistry 29, 1043–1055. doi: 10.1016/S0038-0717(97)00014-X
Keating BA, Robertson MJ, Muchow RC, Huth NI (1999) Modellingsugarcane production systems I. Development and performanceof the sugarcane module. Field Crops Research 61, 253–271.doi: 10.1016/S0378-4290(98)00167-1
Kingston G, Norris C (2001) The green cane harvesting system –an Australian perspective. In ‘Innovative approaches to sugarcaneproductivity in the new millennium. Agronomy Workshop Abstracts’.Miami, Florida. p. 9. (American Society of Sugar Cane Technologists:Miami, FL)
Ladd JN, Oades JM, Amato M (1981) Microbial biomass formed from 14C,15N-labelled plant material decomposing in soils in the field. Soil Biologyand Biochemistry 13, 119–126. doi: 10.1016/0038-0717(81)90007-9
Larson WE, Clapp CE, Pierre WH, Morachan YB (1972) Effects ofincreasing amounts of organic residues on continuous corn. II. Organiccarbon, nitrogen, phosphorus and sulphur. Agronomy Journal 64,204–208.
Mitchell RDJ, Thorburn PJ, Larsen P (2000) Quantifying the loss ofnutrients from the immediate area when sugarcane residues are burnt.Proceedings of the Australian Society of Sugar Cane Technologists 22,206–211.
Ortega RA, Peterson GA, Westfall DG (2002) Residue accumulation andchanges in soil organic matter as affected by cropping intensity in no-tilldryland agroecosystems. Soil Science Society of America Journal 94,944–954.
Pankhurst C, Kirkby C, Hawke B, Harch B (2002) Impact of a changein tillage and crop residue management practice on soil chemicaland microbiological properties in a cereal-producing red duplex soilin NSW, Australia. Biology and Fertility of Soils 35, 189–196.doi: 10.1007/s00374-002-0459-3
Powlson DS, Brookes PC, Christensen BT (1987) Measurement of soilmicrobial biomass provides an early indication of changes in total soilorganic matter due to straw incorporation. Soil Biology and Biochemistry19, 159–164. doi: 10.1016/0038-0717(87)90076-9
Productivity Commission (2003) ‘Industries, land use and water qualityin the Great Barrier Reef catchment.’ Research Report. (ProductivityCommission: Canberra, ACT)
Prove BG, Doogan VJ, Truong PNV (1995) Nature and magnitude ofsoil erosion in sugarcane land on the wet tropical coast of north-eastern Queensland. Australian Journal of Experimental Agriculture 35,641–649.
Rasmussen PE, Allmaras RR, Rohde CR, Roager NC (1980) Crop residueinfluences on soil carbon and nitrogen in a wheat-fallow system. SoilScience Society of America Journal 44, 596–600.
Rayment GE, Higginson FR (1992) ‘Australian laboratory handbook of soiland water chemical methods.’ (Inkata Press: Melbourne)

Effects of sugarcane trash on soil C and N Australian Journal of Soil Research 23
Robertson FA, Thorburn PJ (2007) Decomposition of sugarcane harvestresidue in different climatic zones. Australian Journal of Soil Research45, 1–11.
Russell JS (1980) Crop sequences, crop pasture rotations and soil fertility.In ‘Proceedings of the 1st Australian Agronomy Conference’. Lawes,Queensland. pp. 15–29.
Saffigna PGS, Powlson DS, Brookes PC, Thomas GA (1989) Influence ofsorghum residues and tillage on soil organic matter and soil microbialbiomass in an Australian vertisol. Soil Biology and Biochemistry 21,759–765. doi: 10.1016/0038-0717(89)90167-3
Schroeder BL, Wood AW (2001) Assessment of nitrogen mineralisingpotential of soils in two different landscapes in the Australian sugarindustry – implications for N fertiliser management. Proceedings of theAustralian Society of Sugar Cane Technologists 23, 281–288.
Skjemstad JO, Taylor JA, Janik LJ, Marvanek SP (1999) Soil organic carbondynamics under long-term sugarcane monoculture. Australian Journalof Soil Research 37, 151–164. doi: 10.1071/S98051
Sørensen LH (1987) Organic matter and microbial biomass in asoil incubated in the field for 20 years with 14C-labelled barleystraw. Soil Biology and Biochemistry 19, 39–42. doi: 10.1016/0038-0717(87)90123-4
Stockfisch N, Forstreuter T, Ehlers W (1999) Ploughing effects on soilorganic matter after twenty years of conservation tillage in Lower Saxony,Germany. Soil and Tillage Research 52, 91–101. doi: 10.1016/S0167-1987(99)00063-X
Sutton MR, Wood AW, Saffigna PG (1996) Long term effects of green canetrash retention on Herbert River soils. In ‘Sugarcane: research towardsefficient and sustainable production’. (Eds JR Wilson, DM Hogarth,JA Campbell, AL Garside) pp. 178–180. (CSIRO Division of TropicalCrops and Pastures: Brisbane)
Thompson JP (1992) Soil biotic and biochemical factors in a long-termtillage and stubble management experiment on a vertisol. 2. Nitrogendeficiency with zero tillage and stubble retention. Soil and TillageResearch 22, 339–361. doi: 10.1016/0167-1987(92)90048-G
Thorburn PJ, Probert ME, Robertson FA (2001) Modelling decomposition ofsugar cane surface residues with APSIM-Residue. Field Crops Research70, 223–232. doi: 10.1016/S0378-4290(01)00141-1
Vallis I, Catchpoole VR, Hughes RM, Myers RJK, Ridge DR, Weier KL(1996a) Recovery in plants and soils of 15N applied as subsurface bandsof urea to sugarcane. Australian Journal of Agricultural Research 47,355–370. doi: 10.1071/AR9960355
Vallis I, Parton WJ, Keating BA, Wood AW (1996b) Simulation of theeffects of trash and N fertilizer management on soil organic matterlevels and yields of sugarcane. Soil and Tillage Research 38, 115–132.doi: 10.1016/0167-1987(96)01014-8
Vance ED, Brookes PC, Jenkinson DS (1987) An extraction method formeasuring soil microbial biomass C. Soil Biology and Biochemistry 19,703–707. doi: 10.1016/0038-0717(87)90052-6
Voroney RP, Paul EA, Anderson DW (1989) Decomposition of wheat strawand stabilization of microbial products. Canadian Journal of Soil Science69, 63–77.
Wood AW (1991) Management of crop residues following green harvestingof sugarcane in north Queensland. Soil and Tillage Research 20, 69–85.doi: 10.1016/0167-1987(91)90126-I
Weier KL, Rolston DE, Thorburn PJ (1998) The potential for N losses viadenitrification beneath a green cane trash blanket. Proceedings of theAustralian Society of Sugar Cane Technologists 20, 169–175.
Zibilske LM (1994) Carbon mineralisation. In ‘Methods of soil analysis.Part 2, Microbiological and biochemical properties’. (Eds RW Weaver,S Angle, P Bottomley, D Bezdicek, S Smith, A Tabatabai, A Wollum)pp. 835–863. (Soil Science Society of America Inc.: Madison, WI)
Manuscript received 3 July 2006, accepted 11 December 2006
http://www.publish.csiro.au/journals/ajsr