management of bureaucrats and public service delivery ...uctpimr/research/css.pdf · management of...
TRANSCRIPT
Management of Bureaucrats and Public Service Delivery:
Evidence from the Nigerian Civil Service¤
Imran Rasul Daniel Roggery
June 2015
Abstract
We study how the management practices bureaucrats operate under relate to the quan-
tity and quality of public services delivered. We do so exploiting data from the Nigerian
Civil Service. For 4700 public sector projects, we have hand-coded independent engineering
assessments of project completion rates and delivered quality. We supplement this with a
survey eliciting management practices for bureaucrats in the 63 civil service organizations
responsible for these projects, building on Bloom and Van Reenen [2007]. Management
practices matter: a one standard deviation increase in bureaucrat’s autonomy signi…cantly
increases project completion rates by 18%; a one standard deviation increase in practices re-
lated to incentives/monitoring of bureaucrats signi…cantly lowers project completion rates by
14%. We show the negative impacts of incentive provision/monitoring arise because bureau-
crats multi-task and incentives are poorly targeted, and because these management practices
capture elements of subjective performance evaluation that leave scope for dysfunctional re-
sponses from bureaucrats. To support a causal interpretation of our …ndings, we document
the determinants of management practices and examine channels through which organiza-
tions might endogenously adjust management practices. Our results provide novel insights
into how changes in how bureaucrats are managed can have potentially large impacts on
public service delivery in a developing country context. JEL Classi…cation: J33, J38, O20.
¤We gratefully acknowledge …nancial support from the Federal Government of Nigeria; the International GrowthCentre [RA-2009-11-018], the Economic and Social Research Council [ES/G017352/1], the Institute for FiscalStudies, and the Royal Economic Society. We thank the Presidency and the O¢ce of the Head of the CivilService of Nigeria for their support. We are grateful to the many government o¢cials who have assisted us duringthis project but are too numerous to name individually, Daron Acemoglu, Nava Ashraf, Orazio Attanasio, OrianaBandiera, Marianne Bertrand, Tim Besley, Nick Bloom, Richard Blundell, Tom Crossley, Jishnu Das, Esther Du‡o,Christian Dustmann, Ben Faber, Andrew Foster, Lucie Gadenne, Luis Garicano, Robert Gibbons, Rachel Gri¢th,Stephen Hansen, Larry Katz, Henrik Kleven, Guy Laroque, Ed Lazear, Willy McCourt, Magne Mogstad, PaulNiehaus, Jonathan Phillips, Andrea Prat, Carol Propper, Juan Pablo Rud, Ra¤aella Sadun, John Van Reenen,Marcos Vera-Hernandez, Martin Williams and numerous seminar participants. All errors remain our own.
yRasul: UCL and IFS [[email protected]]; Rogger: World Bank Research Department [ [email protected]].
1
1 Introduction
We study the correlates of e¤ective public service delivery in a developing country context: Nigeria.
To do so, we combine novel data sources linking the outputs of government bureaucracies with
our own survey data eliciting a range of management practices that bureaucrats are subject to.
The e¤ective functioning of the government bureaucracy matters: it is an important determi-
nant of poverty, inequality, and economic growth as stressed by the emergent literature on state
capacity [Acemoglu 2005, Besley and Persson 2010]. E¤ective public service delivery also matters
from a microeconomic perspective: program evaluations of small-scale interventions often assume
successful interventions can be e¤ectively scaled-up by government.
However, despite the importance of government e¤ectiveness for citizen welfare, economic
analyses of incentives in the public sector have largely focused on the selection and motivation
of politicians [Besley 2004, Gagliarducci and Nannicini 2013, Martinez-Bravo 2014], or on the
response to incentives of frontline sta¤ such as teachers and health workers [Muralidharan and
Sundararaman 2011, Du‡o et al. 2012, Ashraf et al. 2014]. In both rich and poor country
contexts, there is little evidence linking the managerial practices the vital middle-tier of bureaucrats
operate under, to public service delivery. Similarly, the public administration literature is almost
devoid of concrete evidence linking practices in civil service organizations to public goods outcomes
[Gold…nch et al. 2012]. It is this knowledge gap that we start to …ll.
Banerjee et al. [2007] emphasize two constraints restricting research on public service delivery
in developing countries: (i) the process of project implementation is rarely quanti…able; (ii) public
good quality is di¢cult to measure. We make progress on both fronts, exploiting a unique period
of history in the Nigerian civil service, during which the activities of public bureaucracies were
subject to detailed and independent scrutiny. During this period, quantitative information was
collected to measure the actual implementation success and quality of public sector projects in
various social sectors. The scrutineers were independent teams of engineers and members of civil
society. We have hand coded this information to obtain assessments of completion rates for over
4700 public sector projects that began in 2006/7. The aggregate budget for these projects is
US$800 million or 8% of all social spending in Nigeria during our study period.
To measure the management practices that bureaucrats operate under, we follow the method-
ological approach of Bloom and Van Reenen [2007, 2010]. We adapt their management surveys
to the Nigerian public sector setting, taking account of insights from the public administration
literature [Rose-Ackerman 1986, Wilson 1989]. We collected data on management practices for 63
organizations of the Federal Civil Service in Nigeria, including central ministries and regional de-
velopment authorities. For each organization we measure management practices related to: (i) the
autonomy provided to bureaucrats; (ii) the provision of incentives and monitoring of bureaucrats.
The autonomy index captures the extent to which: (i) bureaucrats input into policy formulation
and implementation processes; (ii) the ‡exibility with bureaucrats can be reorganized to respond to
2
best practice and project peculiarities. There are long-standing views in the public administration
literature on the importance of autonomy. As Rose-Ackerman [1986] describes, at one extreme lies
the view that public agencies ought to delegate as much decision making to bureaucrats as possible,
relying on their professionalism and resolve to deliver public services [Simon 1983]. At the other
extreme lies the Weberian view that, because the objectives of bureaucracies and society diverge,
only an entirely rules-based system of public administration, that leaves little to the individual
judgement of bureaucrats, can ensure consistent and acceptable levels of public service.
The incentives/monitoring based management index captures the extent to which an organi-
zation collects indicators of project performance, how these indicators are reviewed, and whether
bureaucrats are rewarded for achievements re‡ected in these indicators. Incentive theory stresses
the positive impacts performance incentives and monitoring have on organizational performance.
However, a priori the impacts of such incentives in public sector settings is uncertain because: (i)
bureaucrats might need to exert multiple e¤ort types, not all of which are measurable; (ii) the
process by which inputs are converted to outputs is uncertain; (iii) there can be competing views
on the right way to implement bureaucratic outputs; (iv) bureaucratic objectives are not clear cut;
(v) performance incentives might crowd out the intrinsic motivation of those self-selected into the
public sector [Perry and Wise 1990, Benabou and Tirole 2006, Francois and Vlassopoulos 2008].1
We probe these issues by exploiting a third data source: a survey we …elded to a representative
sample of 4100 civil servants, corresponding to 13% of the total workforce of the 63 organizations
we study. This asked bureaucrats about their tenure, employment history, intrinsic motivation,
and perceptions of organizational corruption. We use this to shed light on how the impacts of
management practice vary with bureaucrat characteristics.
Our empirical research design exploits the fact that multiple organizations conduct similar
project activities. For example, small-scale dams are constructed by the federal ministries of
water, agriculture, and environment. We therefore assess how the delivery of the same project type
varies depending on the management practices in place for bureaucrats in the speci…c organization
responsible, holding constant project characteristics, such as their technical complexity and scale,
as well as the characteristics of organizations and bureaucrats. We use this empirical framework
to present three …ndings relating civil service management practices and public service delivery.
First, management practices for bureaucrats matter. Despite the measures of management
practice related to autonomy and incentives/monitoring being positively correlated, they have op-
posing correlations with public services delivered: a one standard deviation increase in autonomy
1Evidence is lacking on whether incentives positively impact bureaucrat behaviors [Perry et al. 2009, Hasnain etal. 2012]. Muralidharan [2012] discusses why performance pay might be suboptimal in the public sector. Positiveimpacts of performance pay for front-line teachers have been documented using RCTs in developing countries byGlewwe et al. [2010], Muralidharan and Sundararaman [2011], and Du‡o et al. [2012], although Fryer [2013] …ndszero/negative impacts in the US. In health, a nascent literature documents positive impacts of performance pay onfrontline workers in developing countries [Miller and Babiarz 2013]. In line with our …ndings, Ashraf et al. [2014]document how non-monetary incentives elicit more e¤ort than monetary incentives for such tasks.
3
for bureaucrats corresponds to signi…cantly higher project completion rates of 18%, and a one stan-
dard deviation increase in practices related to incentives/monitoring corresponds to signi…cantly
lower project completion rates of 14%. We …nd management practices correlate to quality-adjusted
project completion rates in similar ways. The backdrop to these …ndings in Nigeria, where 38%
of public projects are never started, implying these magnitudes are also of economic signi…cance.
Our …ndings on autonomy for bureaucrats provide support to the notion that public agencies
ought to delegate some decision making to bureaucrats, relying on their professionalism to deliver
public services. The evidence is less supportive of the notion that when bureaucrats have more
agency, they are more likely to pursue their own objectives or engage in corrupt activities, resulting
in fewer public services being delivered. As discussed throughout, this is especially insightful in
a context such as Nigeria, where corruption (at all tiers of government bureaucracy) is typically
considered a major impediment to economic development.
Obviously, we are careful to describe our …ndings as partial correlations throughout. However,
to support a causal interpretation, we document the determinants of management practices and
examine channels through which organizations might endogenously adjust management practices.
We …nd that the practices in place are largely driven by the education levels of the most senior
bureaucrats. Reassuringly, we …nd little evidence of direct feedback e¤ects of project completion
rates on management practices, and nor do we …nd evidence of organizations endogenously adjust-
ing management practices: (i) when it is easiest for them to do so because the portfolio of projects
they are tasked to implement are more similar; (ii) when a greater share of the organization’s
budget is devoted to the successful implementation of the kinds of projects we study.
The robust negative correlation documented between project completion rates and manage-
ment practices related to the provision of incentives and monitoring of bureaucrats, is also sur-
prising and counter to a large body of evidence from private sector settings. We investigate
three underlying mechanisms for this: that bureaucrats operate in a multi-tasking environment
[Holmstrom and Milgrom 1991], that the incentives/monitoring management practices pick up
subjective performance evaluation (SPE) [Milgrom 1988, Milgrom and Roberts 1988], and that in-
centives/monitoring crowd out bureaucrats’ intrinsic motivations [Perry and Wise 1990, Benabou
and Tirole 2006, Francois and Vlassopoulos 2008]. We investigate all three channels by exam-
ining how the impacts of incentive/monitoring related management practices vary with project,
organizational and bureaucrat characteristics.
We document the negative correlation between these practices and project completion rates
is even more negative for: (i) more complex projects; (ii) project types that are of greater am-
biguity/uncertainty in design. Moreover, we …nd the negative impacts of performance-incentive
practices are ameliorated in organizations with better IT facilities, that might re‡ect a greater
ability to measure/target incentives towards more productive e¤orts. These …ndings are in line
with bureaucrats having to exert multiple e¤ort types, and incentives/monitoring practices being
mis-targeted [Kelman 1990]. We also …nd the negative correlation between incentives/monitoring
4
practices and project completion rates is more negative in organizations sta¤ed by less experienced
bureaucrats, that might re‡ect civil servants learning how to engage in in‡uence activities when
subject to SPE. Finally, on the interplay between incentive/monitoring management practices
and bureaucrat motivations, we …nd the negative impact of incentives/monitoring is o¤set by the
share of intrinsically motivated bureaucrats in the organization. Hence, if anything, this suggests
crowding-in of bureaucrat e¤ort in the presence of practices related to incentives/monitoring.
While the recent economics literature has emphasized the role of intrinsic motivation, a long-
standing literature in public administration emphasizes that civil servants pursue their self-interest
[Tullock 1965, Wilson 1989]. Our earlier …nding, that granting bureaucrats more autonomy is pos-
itively correlated to higher project completion rates, already runs somewhat counter to this view.
However, our …nal set of results probe this notion further by exploring how the impacts of manage-
ment practices are mediated through perceptions of corruption among civil service organizations.
Clearly, in the Nigerian context, the issue of corruption cannot be ignored, and it permeates
throughout our analysis. We …nd a large negative levels impact on completion rates of corruption,
but the impacts of management practices related to either autonomy or incentives/monitoring do
not vary with perceptions of corruption. This suggests corruption is prevalent, but there are few
bureaucrats on the margin of being prevented from behaving corruptly because of incremental
changes in management practice (at least for the scale of public projects we consider).
The core contribution of our analysis is to supply novel evidence on how management prac-
tices for bureaucrats in civil service organizations correlate to public service delivery. We provide
among the …rst pieces of empirical analysis of the functioning of this vital middle-tier of the
bureaucracy, that has wide-reaching implications for research from both a macro and micro per-
spective. We extend the frontier of research on bureaucracies by overcoming data constraints that
have limited earlier work, including on the measurement of the quantity and quality of public
services provided, and extending techniques to measure management practices into the realm of
bureaucracies. Our results point to new directions for theoretical research to better understand
the contracting environment in public bureaucracies [Dixit 2002], as well as highlighting areas
in which better measurement of inputs and outputs of public sector organizations can aid our
understanding of public service delivery and state capabilities in the developing world.
The paper is organized as follows. Section 2 overviews relevant aspects of the Nigerian civil
service. Section 3 details our data sources and empirical method. Section 4 presents our results
linking public service delivery and management practices for bureaucrats. Section 5 concludes
by discussing optimal management practices, presenting evidence on management practices and
bureaucrats’ time use, and links our …ndings to the literature on improving public services. The
Appendix presents further data description, robustness checks and discusses econometric concerns.
5

2 Institutional Background
Nigeria is Africa’s most populous country, home to 160 million or 20% of the population of sub-
Saharan Africa. Like other developing countries, government expenditures represent a signi…cant
fraction of GDP (26%), it has generally weak institutions holding government to account, and
corrupt practices in public sector organizations are commonplace. The British colonial government
fashioned its Nigerian administration after the British Parliamentary Civil Service System, and
this is what passed to an independent Nigeria in 1960. Despite moving to a Presidential system,
Nigeria’s civil service structure still largely replicates its British colonial origins.2
2.1 Civil Service Organizations
The Nigerian civil service is organized into federal, state, and local government tiers. Our analysis
relates exclusively to the federal civil service.3 Table A1 lists the 63 federal civil service organiza-
tions we study. These include ministries of health, education, environment, and water resources,
and organizations that have regional bases (such as federal polytechnics, federal medical centres,
development authorities etc.). Table A1 highlights how these organizations vary in budget, sta¢ng
and decentralization. Federal ministries have the largest budgets and most sta¤ as expected, with
regional organizations being deconcentrated from central government.4
Each civil service organization is tasked to provide various types of project. These include con-
struction projects (boreholes, buildings, roads and canals), as well as non-construction projects
(procurement, training, and advocacy). For any given project type, multiple organizations are ob-
served being tasked to implement similar projects. For example, small-scale dams are constructed
by the federal ministries of water, agriculture, and environment, and by all of the river basin de-
velopment authorities. We therefore assess how the delivery of the same project type is partially
correlated to the management practices for bureaucrats in the organization responsible, holding
constant other project, bureaucrat and organizational characteristics.
Underlying our analysis is the notion that civil service organizations place some weight on
raising project completion rates: this is likely to be the case because, on average, 79% of the
capital expenditure of organizations is related to the kinds of projects we study, and completion
of these capital projects is often explicitly stated as part of organizations’ core mission.
2The 1999 Constitution has similarities with the US Constitution: legislation is enacted by a bicameral NationalAssembly composed of the Senate and House of Representatives. Although the introduction of a Presidential systemof government in 1979 saw initial reforms to the civil service, later decrees reversed some of these changes.
3The Civil Service is governed by a set of Public Service Rules and Financial Regulations, ad hoc CircularInstructions, decrees circulated across government, and Gazette Notices (decrees published in the Government’sgazette). These outline the laws regulating the business of government, and cover service appointments, exits,discipline, salaries, and other major aspects of o¢cial assignments.
4Budget …gures are 2006-10 averages. Sta¤ numbers are from 2010. Deconcentrated organizations have boardsof governors that decide policy/operations, and have a separate budget line to central ministries. Concentratedorganizations have a direct line of responsibility to the President and National Assembly.
6
2.2 The Assignment of Civil Servants and Projects to Organizations
The Head of the Civil Service of the Federation organizes the postings and conditions of Nigeria’s
federal civil servants. Our representative survey of 4100 individual civil servants con…rms this: 88%
of bureaucrats report having no in‡uence over their initial posting, and 60% report their current
posting being ‘at random’. Once posted, civil servants enjoy job security. Our survey reveals mean
tenure at the current organization to be 13 years, rising to 16 years for senior managers (those
above grade level 12). Movements across organizations are rare: 67% of bureaucrats report never
having moved organization. This lack of mobility in the labor market for bureaucrats slows down
the rate at which best practices for management spread through the civil service, and dampens
incentives for organizations to tailor management practices to attract certain types of bureaucrat.
Projects are assigned to organizations centrally by the National Assembly, that enacts a budget
law specifying the projects to be implemented each …scal year. The projects we study were all
established in law by Budget Appropriation Bills in 2006 or 2007. This legal document de…nes
the responsibilities of civil service organizations in terms of projects to be delivered.5
In the Appendix we present more detailed evidence on the factors determining the assignment
of bureaucrats and projects to organizations, and document how both assignment processes are
largely uncorrelated to the management practices in place in organizations.
3 Data and Empirical Method
3.1 Project Completion, Quality and Complexity
The Nigerian Government began a program of sweeping reforms in the major organs of government
in 2003 [Nkonjo-Iweala and Osafo-Kwaako 2007]. As a result, it received cancellation of US$18
billion of external debt from the Paris Club. At the federal level, the annual savings from debt
interest were channeled into the social sectors we study. The Presidency saw this as an opportunity
to track the e¤ectiveness of government expenditures, and so in 2006 and 2007 the Nigerian
Government undertook the Overview of Public Expenditure in NEEDS, known as the ‘OPEN
initiative’, in which it traced, by project, the use and impact of 10% of all federal Government
social sector expenditures approved in 2006 and 2007. The projects selected to be part of the OPEN
initiative were to be representative of existing social sector expenditures, but also informative for
5The passage of these bills is as follows. Having received inputs from the executive branch of government, adraft Appropriation Bill is presented to the National Assembly. The draft bill is then split into sectors and sent tosectoral committees of the House and Senate. These committees hold hearings with relevant parties to scrutinizeproposals, de…ne project budgets and assign projects to organizations. These committees are sta¤ed by politicianswith quali…cations/experience in the relevant sector. These committees then recommend a budget for the sectorto an Appropriation Committee which merges the recommendations into a single budget. This uni…ed budget isthen voted on by both houses to form the Budget Appropriation Bill.
7
those projects most needing to be scaled-up nationwide.6
Under the OPEN initiative, expert teams visited public projects to record the extent to which
they had been implemented as planned in the Federal Budget. The Presidency contracted na-
tional and regional teams to undertake the monitoring process outside of the institutions of the
civil service. Hence projects were not evaluated by potentially biased civil servants, but rather by
teams of independent engineers and civil society. To further ensure the accuracy of monitoring
reports, the Presidency put in place a system of checks and balances. First, a centralized team
of technocrats monitored the evaluation teams, and providing them with training and opportu-
nities for standardization of their methods. Second, evaluators were asked to provide material,
photographic, or video evidence to support their reports. Third, the national teams and Presi-
dency performed random checks on evaluated sites. Evaluations of the OPEN process indicate it
successfully achieved its aims [Eboh 2010, Dijkstra et al. 2011].7
We consider projects traced under the OPEN initiative that were approved in the 2006/7
federal budgets [Federal Government of Nigeria 2008, 2009]. Monitoring teams visited project
sites 18 months after the project was centrally approved. All the projects we study have 12 month
completion schedules, so that even accounting for any delay in the disbursement of funds, it is
feasible for these projects to be completed by the time of the monitoring survey. We hand coded
the material from all projects recorded in OPEN initiative reports from the federal civil service
organizations listed in Table A1.8 Taken together, the coverage of projects in our sample traces
8% of all Federal Government social sector expenditures in 2006/7 budget years, corresponding to
4721 projects from 63 organizations, with an aggregate budget of around US$800 million.
The OPEN evaluation teams coded: (i) whether the project had started; (ii) its stage of
completion; (iii) the quality of inputs and work. Our main outcome variable is a continuous zero
to one measure of project completion rates, available for all 4721 projects. A completion rate of
zero does not imply the organization never even attempted to work on the project. Rather, the
6Table A2 shows the distribution of expenditures in the Nigeria federal budget across the social sectors as awhole (Column 1), for all projects in the OPEN initiative (Column 2) and in our sample of OPEN projects (Column3). This is done for all social sectors with the exception of the Works Sector (that covers trunk roads and constitutes5% of total social sector expenditure in the federal budget), because the OPEN data we use does not cover thatsector. The share of OPEN projects by sector matches closely the distribution of expenditures as a whole. AChi-squared test of equality of shares across sectors does not reject the null. Evidence from process overviews ofthe OPEN initiative, including qualitative evidence from local communities on their perception of projects, suggeststhe projects included in the OPEN initiative were thought to be welfare improving [OPEN report for North EastNigeria 2006, the Civil Society Organizations Monitoring and Evaluation Report 2007].
7Prior to the OPEN initiative, the government had its own monitoring and evaluation systems in place (basedon unannounced visits) but these were largely perceived to be ine¤ective. When OPEN was introduced, OPENprojects were processed through the same standard government channels as non-OPEN projects, and so overall,there was no ex ante reason to believe it would be much more e¤ective than the previous monitoring regime. Thishelps ameliorate concerns that our results pick up a Hawthorne e¤ect in response to the OPEN initiative.
8In the water and power sectors, we cover all the relevant federal organizations. In the health sector, we cover28% of health organizations, with the excluded a subset of the medical service providers such as a number of FederalMedical Centres. Similarly, in education we cover 14% of education organizations, excluding a range of institutionsof learning such as some Federal Colleges of Education.
8
project might have been prepared, with responsibility for implementation having been delegated
to a department and bureaucrats within the organization. At that point however, progress on
the project halted, with funds either being returned due to lack of use, or being lost. We cannot
distinguish whether this lack of implementation re‡ects active or passive waste [Bandiera et al.
2009]. A completion rate of one implies the project matched its full technical speci…cation.
To maximize coverage on project quality, we utilize the most aggregate formulation of quality
reporting. A project was either of insu¢cient quality, satisfactory, or commended for an ‘above
average or high’ quality level: 2206 projects have both quality and completion rates recorded.
Table 1 provides descriptive evidence by project type. Boreholes are the most common, covering
29% of OPEN projects. Most project types are implemented by a range of organizations. There
are, for example, 18 civil service organizations constructing boreholes (Column 2). Hence we study
the impact of management practices for bureaucrats, that vary across civil service organizations,
on project implementation, conditional on project-type …xed e¤ects. Column 3 highlights the
scale of projects: most constitute the ‘nuts-and-bolts’ of rural infrastructure development. The
median budget for dams is US$18 000, the median budget for a building is US$120 000. It is
because projects are relatively small-scale that partly explains why multiple organizations are
observed being tasked to implement similar project types. Columns 4 to 7 show completion
rates by project type, emphasizing variation in completion rates across and within project types.
Aggregating across all project types, 38% of projects are never started. Although this might
emphasize the role that corruption or passive waste plays, it is not a complete explanation for
bureaucrat behavior: 31% of projects are fully completed, and conditional on being started, the
average project completion rate is 75. Column 8 shows, across project types, the majority of
projects are ranked to be of satisfactory quality.
Table 2 presents descriptive evidence on the public service delivery of the ten civil service
organizations that implement the most projects in our sample. This again emphasizes that most
organizations are engaged in providing multiple project types. We observe huge variation across
these large organizations in the percentage of projects that are never started (11% to 95%), and
that are fully completed (3% to 89%). The …nal column shows the percentage of projects rated to
be of satisfactory quality: here we observe far greater variation across civil service organizations
(25% to 100%) than we previously documented in Table 1 across project types.
These statistics suggest there might be important factors at the organization level that drive
this variation in the quantity and quality of public service delivery. Our focus is on one such
factor: the management practices civil service bureaucrats operate under.
When relating project outcomes to management practices for bureaucrats, it is important to
condition on project complexity [Prendergast 2002]. To measure this we collaborated with a pair
of Nigerian engineers familiar with the OPEN initiative and a group of international scholars with
research interests in project complexity. The complexity indicators were based on the technical
speci…cations of each project, and constructed following engineering best practice that emphasizes
9
multiple dimensions of complexity [Remington and Pollack 2007]. The Appendix: (i) details the
construction of these indices, and presents descriptive statistics for them (Table A3); (ii) describes
checks in place, using multiple engineers, to underpin the validity of our complexity measures.9
These complexity indicators re‡ect the number of inputs and methods needed for the project,
the ease with which the relevant labor and capital inputs can be obtained, ambiguities in design
and project implementation, and the overall di¢culty in managing the project. Our empirical
speci…cation then holds constant the complexity of the project along these dimensions, including
issues related to organizations needing to sub-contract project implementation to a private sector
…rm, for example. This allows us to focus in on the correlation between managerial practices for
bureaucrats and project completion rates, all else equal.10
3.2 Measuring Management Practices
There has been a revival of interest in studying management practices in the private sector [Ich-
niowski et al. 1997, Black and Lynch 2001, Bloom and Van Reenen 2007, 2010; Bloom et al. 2012a,
2013]. We follow Bloom and Van Reenen’s (henceforth BVR) approach to measuring management
practices, but adapt their survey tool to the Nigerian public sector setting by taking into account
long-standing views on the importance of autonomy in public administration [Simon 1983, Rose-
Ackerman 1986, Wilson 1989] and insights from the ‘new performance management’ and ‘good
governance agenda’ perspectives [Francois and Vlassopoulos 2008, Gold…nch et al. 2012].
We worked closely with members of the OPEN o¢ce in the Presidency and the O¢ce of the
Head of the Civil Service of the Federation to develop our management survey. A number of
pilots using semi-structured interviews like those in BVR were held to outline key similarities
and deviations from the BVR methodology. The management survey enumerators were trained
together for a number of weeks including practice interview sessions before undertaking the …rst
few interviews together. Information on management practices was then elicited from senior
management sta¤ in the key departments of each organization, but not the chief executive o¢cer.
While each manager …lled in their own questionnaire, the enumerator looked for a consensus and
recorded that in her own questionnaire. This is the information we use to construct management
practice indices for each organization.11
9Prendergast [2002] also implies that autonomy and incentives are both positively correlated to task uncer-tainty/complexity. We …nd: (i) CS-autonomy is positively correlated to project complexity (averaged across allprojects in the organization), with correlation coe¢cient 05; (ii) however, CS-incentives/monitoring is negativelycorrelated with project complexity. in In an extension to the baseline model, Prendergast [2002] discusses howincentive provision and uncertainly/complexity can be negatively correlated in equilibrium if multi-tasking con-cerns are greater in more uncertain environments. This prediction matches well with the evidence we provide later,highlighting incentives/monitoring practices have a more negative impact on more complex and atypical projects.
10Our civil servant survey also helps to shed some light on the relationship between bureaucratic organizationsand such third party contractors/suppliers/consultants. For example, only 6% of civil servants agreed with thestatement that, the most successful contractors “are aligned with the government in some way”; only 13% of civilservants reported having been o¤ered a ‘small present’, ‘money’, or an ‘expensive present’ by such contractors.
11Conducting face-to-face group interviews was judged to lead to more accurate answers than using telephone
10
From September to November 2010, our survey team held interviews at the organizations
listed in Table A1. Following BVR, interviews were ‘double blind’ in that: (i) managers were
not told in advance they were being scored or shown a score grid; (ii) enumerators were given no
information on the performance of the organization. The BVR evaluation tool elicits management
practices through a semi-structured interview covering four topics: operations, targets, incentives
and monitoring. We apply the BVR approach in the context of public bureaucracies, extending the
series of practices elicited to cover those more relevant for managing bureaucrats. As a result, our
management survey covers nine topics: roles, ‡exibility, incentives, monitoring, culture, targeting,
facilities, skills and sta¢ng. We then replicate the BVR method eliciting information on each
of these broad topic areas from our civil service organizations, although we do so using a more
limited set of underlying questions related to each topic, and some of our questions permit only
yes/no replies, while others are based on a full scoring grid. Table A4 details the questions that
come under each topic area.12
The questions on ‘roles’ assess the extent to which bureaucrats input into policy formula-
tion/implementation processes. The ‘‡exibility’ questions measure whether a bureaucratic agency
is able to re-organize its bureaucrats and adapt tasks to respond to best practice and project
peculiarities. We combine answers to the roles and ‡exibility questions to construct an index of
management practices capturing bureaucrats’ ‘autonomy’ (CS-autonomy). This allows us to study
a key dimension of management that the public administration literature has long emphasized.
The questions on ‘incentives’ are designed to capture more familiar notions for economists of
incentive provision for bureaucrats, both positively in terms of whether rewards are given for some
dimensions of service, and negatively in terms of punishments for poor service; the questions on
‘monitoring’ capture practices related to the collection and use of performance indicators. We
combine the answers to both topics to construct an index capturing the ‘incentives/monitoring’
management practices bureaucrats operate under (CS-incentives/monitoring).
The remaining topics cover the following practices: the ‘facilities’ questions relate to how well-
functioning the organization is, for example, by collecting information on the availability of elec-
tricity and internet facilities to bureaucrats; the ‘skills’ questions relate to the human capital
surveys. Given the interview format, individual manager responses on management practices are available, but wecannot link individual managers to speci…c projects and so do not utilize that information (each project is deliveredby teams of bureaucrats across sub-departments): rather we use the consensus measure recorded by the enumerator.Managers were told their individual responses would remain con…dential. We …nd no relationship between recordedpractices and the number of managers present at interview.
12Hence there are two important deviations from how we elicit management practices from BVR. First, we tailoredthe precise wording of some questions to better …t our context. Second, we did not use the same universe of questionsfrom BVR. In most cases this was because we could not identify an analogous concept in the public sector that wasrelevant or not covered by other questions. For example, the majority of questions on lean manufacturing in BVR(e.g. ‘What kinds of lean (modern) manufacturing processes have you introduced?’) were not utilized. However,those on improving manufacturing processes (‘How do you go about improving the manufacturing process itself?’)were rede…ned to relate to procedures in response to new needs or challenges (‘Does your organization make e¤ortsto rede…ne its standard procedures in response to the speci…c needs and peculiarities of a community?’).
11
of bureaucrats, especially their IT competencies, and the trainings o¤ered to them; the ‘sta¢ng’
questions focus sta¤ recruitment and workload spreads; the ‘targeting’ questions relate to the exis-
tence and clarity of targets, and …nally, the questions related to ‘culture’ elicit information on how
colleagues are collectively treated and interact with others outside of the workplace. We combine
answers on all these topics to construct an ‘other’ management practices index (CS-other).
We clearly recognize there is no de…nitive way to solicit management practices along these
various dimensions, nor a de…nitive way to collate them into more aggregate indices. Our ap-
proach is primarily designed to re‡ect two broad areas of management practice emphasized in the
public administration and economics literatures as being …rst order determinants of bureaucrats’
behavior: autonomy and incentives/monitoring. The Appendix details our …ndings if we consider
alternative indices including: (i) a fully disaggregated speci…cation showing the separate impact
of all nine dimensions of management practice; (ii) an aggregate measure of management prac-
tice that collates all nine categories into a single index; (iii) alternative groupings of individual
practices into autonomy and incentive/monitoring measures.13
The responses to each practice in Table A4 are converted into normalized z-scores (so are
continuous variables with mean zero and variance one by construction), where in all cases, variables
are increasing in the commonly understood notion of ‘better management’. For the CS-autonomy
index, we assume greater autonomy corresponds to better management practices (our empirical
analysis then assesses whether this is positively or negatively correlated to project completion
rates), and similarly for the CS-incentives/monitoring measure. For our core analysis, we aggregate
z-scores into the CS- measures by taking unweighted means of the underlying z-scores. In the
Appendix, we show the robustness of our results to other weighting schemes.
We …nd the CS-autonomy and CS-incentives/monitoring management scores to be positively
correlated (correlation coe¢cient 24), in line with the frameworks set out in Prendergast [2002]
and Acemoglu et al. [2007]: that suggest in more uncertain environments it is optimal to grant
agents more autonomy, that in turn, generates greater output-based incentive pay. Hence in the
cross section of federal organizations, the provision of autonomy and performance incentives appear
to be complements. However, these correlations are not so high to prevent precise estimation of
the separate relationship of each measure to public service delivery.14
The gap between the collection of the OPEN data set in 2006/7 and the management survey in
2010 raises the question whether practices changed signi…cantly in between data collection periods.
For example, those organizations found to have low completion rates might have instigated reforms
13We have also used principle components analysis to assess the importance of individual practices through factoranalysis. For the matrix of all nine sub-indices, we …nd the …rst factor explains 28% of the variation.
14Such substitution could exist if bureaucrats have strong career concerns, and so performance incentives arenot required once autonomy is provided. Alternatively, if bureaucrats are intrinsically motivated they might needonly to be provided autonomy, and indeed, the provision of explicit incentives might crowd out their intrinsicmotivation. The marginal impacts of these two measures can also be separately identi…ed from the CS-other index:the CS-autonomy (CS-incentives/monitoring) index has a correlation of 17 (43) with the CS-other measure.
12
to improve management practices for bureaucrats. However, there is little evidence from other
sources of any major civil service reforms being implemented over this period, or of signi…cant
changes in the political organization of federal agencies [Alabi and Fashagba 2010, Ogundiya 2011].
In addition, we …nd little evidence of a spike in turnover of bureaucrats around 2007, coinciding
with the Presidential election: 80% of bureaucrats employed in 2010 were at the same organization
in 2007 (with retention rates around the election being higher among senior managers).
3.3 Origins of Management Practices
To understand how management practices come to be, we held structured interviews at four
organizations in Table A1. These revealed three common themes: (i) the Public Service Rules of
the Nigerian civil service provide guidelines on how bureaucrats should be incentivized, and these
are common to all federal organizations; (ii) the history of senior management sta¤ that have
worked in an organization brings their own innovations to bear; (iii) the role of external events
such as demands of trade unions. Taken together, these interviews consistently emphasized the
slow evolution of management practices, and did not suggest practices were tailored to necessarily
maximize public service delivery.15
More formally, we simultaneously estimate the correlates of each dimension of management
practice using a SUR model, at the organizational level. We control for: (i) characteristics of
senior bureaucrats, such as their years of schooling and tenure in the organization; (ii) the same
characteristics for other bureaucrats; (iii) organization characteristics, such as its average project
completion rate, whether it is a decentralized body, the average budget and complexity of projects
assigned to it. Table 3 presents the results where three points are of note, that each bolster the
interpretation of our main results as causal.
First, the provision of autonomy to bureaucrats is correlated to the education level of senior
management, in line with the feedback we received during the structured interviews. The provision
of incentives/monitoring is correlated with the education level of other bureaucrats. Second,
average project completion rates do not predict management practices in place. This helps rule
out concerns over reverse causation between project completion rates and management practices.
Third, project characteristics, such as the average complexity of projects the organization is tasked
to implement (or the standard deviation in project complexity), have no signi…cant impact on
either management practice. This addresses the concern that projects are selectively assigned to
organizations on the basis of their management practices.
15Management practices in all organizations take the Public Service Rules as their foundation. These guidelinesfor the distribution of authority, how bureaucrats should be disciplined etc. In each structured interview, they weresaid to be central to determining management practice. However, we were repeatedly told a secondary in‡uenceon practices was the history of senior management at the organization. O¢cials are promoted into managementpositions based primarily on tenure. Views on management practices are typically aggregated by committee, withthe chief executive marshalling the direction of reform. This leads to a relatively slow changing managementenvironment. Finally, external events, such as the demands of trade unions, were said to have a third-tier in‡uence.
13
3.4 Empirical Method
Our baseline empirical speci…cation has as its unit of observation project of type in organization
. Project types are listed in Table 1, and organizations are listed in Table A1. We estimate the
following OLS speci…cation, where is the project completion rate, and management practices
are measured using the CS-autonomy, CS-incentives/monitoring and CS-other indices,
= 1-+2-+3-+1+2++
(1)
is a vector of project characteristics including project complexity, log project budget and
whether the project is a rehabilitation or not. is a vector of organizational controls such as
the log number of sta¤, log total organization budget, log capital budget, and the proportions of
o¢cials with a college and postgraduate degree. Following BVR, within we also condition
on ‘noise’ controls related to the management surveys.16
As many organizations implement project type , we control for project type …xed e¤ects in
(1). Our parameters of interest are 1 and 2: as each CS- measure is a standardized z-score, these
coe¢cients measure the e¤ect size of a one standard deviation change in management practices
along the respective margins of autonomy and incentives/monitoring. We cluster standard errors
by project type-organization, and the Appendix demonstrates the robustness of our results to
allowing standard errors to be clustered by organization and correcting p-values for potential
biases due to a small number of clusters [Cameron et al. 2008] (Table A5). Our working sample
is based on 4721 projects from 63 organizations on which we have data on management practices
and project, organization and bureaucrat characteristics.17
We are implicitly assuming that, within project type and controlling for project and organiza-
tional characteristics, the underlying production function is the same across projects. Speci…cation
(1) then corresponds to a reduced form representation of an underlying production function in
which management practices convert the raw total of available bureaucratic labor into e¤ective
labor inputs in the completion of public projects. Along similar lines but in the context of pro…t
maximizing …rms, Bloom et al. [2014] formally develop and test the notion that management can
be thought of as a form of technology, thus explaining between …rm variation in productivity.
The coe¢cients of interest (b1 b2) should be interpreted as partial correlations between man-
agement practices and project outcomes. However, we later address head on the concern that man-
16These include interviewer dummies, the seniority, gender, and tenure of the managers who responded, the dayof the week and time of day of the interview, whether the interview was conducted during Ramadan, the interviewduration, and an indicator of the reliability of the information as subjectively coded by the interviewer.
17Regressing project completion rates on organizational …xed e¤ects yields an adjusted-R2 of 32, suggesting thatorganizational characteristics such as management practices can plausibly play an important role in determiningsuch outcomes. Regressing project completion rates on all project characteristics (including project …xed e¤ects, butnot our CS-measures or organization …xed e¤ects), the adjusted-R2 is 11. Additionally controlling for organization…xed e¤ects, the adjusted-R2 rises to 34. These last two results suggest that conditional on project characteristics,it remains true that some organization level characteristics are important determinants of project completion rates.
14
agement practices are endogenously determined by bureaucrat characteristics or project outcomes,
by investigating whether organizations appear to be tailoring their practices in order to maximize
project completion rates. In the Appendix we discuss further econometric concerns including:
(i) projects being non-randomly assigned to organizations based on their management practices;
(ii) unobserved bureaucrat or organizational characteristics that are correlated to management
practices and also drive project completion rates. The conclusion discusses further methodological
challenges for future research on the determinants of the bureaucratic e¤ectiveness.
4 Core Results
4.1 Project Completion Rates
Table 4 presents our main results on how management practices correlate with project completion
rates. Column 1 only controls for the three CS- measures. We …nd that the practice of giving
greater autonomy to bureaucrats is correlated to signi…cantly higher completion rates (b1 0).
The use of performance incentives/monitoring for bureaucrats however signi…cantly reduces project
completion rates (b2 0). Columns 2 to 4 sequentially condition on noise controls and organiza-
tional characteristics, project characteristics, and project type …xed e¤ects. Throughout, we …nd
both management practices have highly signi…cant impacts on project completion rates.
Our preferred speci…cation is in Column 4 with project type …xed e¤ects, . This shows a one
standard deviation increase in CS-autonomy corresponds to signi…cantly higher project completion
rates of 18%. A one standard deviation increase in CS-incentives/monitoring corresponds to
signi…cantly lower project completion rates of 14%. In all speci…cations, better management
practices on the CS-other dimension are positively correlated with project completion rates; in
Column 4 the estimated coe¢cient is indeed signi…cant at conventional levels, although the e¤ect
size is signi…cantly smaller than for the two dimensions of management practice.
Columns 5 and 6 consider alternative outcome measures. Column 5 focuses attention on how
management practices correlate to the extensive margin of projects being started (as Table 1
showed, 38% of projects have a zero completion rate). Hence the outcome considered is a dummy
equal to one if the project completion rate is strictly positive, and zero otherwise. We see that
each dimension of management practice has qualitatively similar impacts on whether projects are
started or not, as on the total project completion rate focused on in Columns 1-4. In Column 6
we address the concern that projects may be almost completed but to a low quality. We therefore
construct a ‘quality-adjusted’ completion rate where the proportion completed is multiplied by a
binary quality indicator. Where quality is unsatisfactory, whatever the level of completion, this
variable is set to zero. As described in Section 3, information on project quality is only available
for around half the projects for which we have project completion data, originating in 51 civil
service organizations. Column 6 then shows the relationship between management practices and
15
quality-adjusted project completion rates. We …nd the CS- measures to quantitatively impact
quality-adjusted project completion rates in a similar way to project completion rates: higher
levels of CS-autonomy are associated with signi…cantly higher quality projects, and higher levels
of CS-incentive/monitoring are associated with signi…cantly lower quality projects.
4.2 Endogenous Management Practices
The central empirical concern with these baseline results relates to endogenous management prac-
tices. If for example some organization completes projects because they employ more dedicated
civil servants, they might then endogenously choose to give those bureaucrats more autonomy,
and be less reliant on the use of incentives/monitoring. On the other hand, in those organizations
sta¤ed by less reliable bureaucrats, the organization might choose to monitor and incentivize them
along some margins, and allocate them less autonomy. This is the econometric concern that most
plausibly generates the pattern of positive and negative partial correlations in our core results.
We use two strategies to address this concern.
Our …rst approach identi…es organizations that have the greatest incentives to …ne tune their
management practices to maximize project completion rates. Such organizations are those in which
the completion of projects is relatively more important in their set of overall activities, as proxied
by the share of the organization’s total budget assigned to capital expenditures (such as those
on OPEN-style projects). We then estimate a speci…cation analogous to (1) and additionally
interact each CS- measure with this measure of ‘project importance’ (de…ned in terms of its
deviation from mean), also conditioning on the organization’s log total budget. If management
practices are endogenously determined through this channel, their impacts should be attenuated
for organizations in which it is more important to …ne tune practices to maximize completion
rates. The result in Column 1 of Table 5 shows no evidence of such heterogenous impacts.
Our second approach identi…es those organizations that have the most similar portfolio of
projects to implement, as measured by project ambiguity. Such organizations might have the
greatest ability to set their management practices optimally. To implement this test, for each
organization we …rst need to construct the variance in project ambiguity over all its assigned
projects. We measure the design ambiguity of a given project using subcomponents of the com-
plexity indicator described in Table A3. We construct a z-score based on the design uncertainty,
implementation uncertainty, design ambiguity and implementation ambiguity components of the
project complexity metric, and then denote the ambiguity of project by . We then construct
the standard deviation of project ambiguity of projects assigned to organization , (), and
then interact this with each management practice measure to estimate whether the impacts of
the CS- measures of interest are attenuated among those organizations that have the more similar
projects in terms of their design ambiguity. The result in Column 2 of Table 5 shows there to
be no evidence of such heterogenous impacts. Indeed, the key interaction terms have precisely
16

estimated zero point estimates.
Taken together with the evidence in Table 3 on the origins of management practices, we view
this lack of evidence of organizations manipulating their practices to raise completion rates, as
underpinning a causal interpretation to our …ndings.
4.3 Robustness Checks
The Appendix presents a series of robustness checks to examine the stability of our core …nding
to alternative samples, variable de…nitions and econometric methods.
We …rst addresses the concern that the underlying production function for project completion
di¤ers across project types. To do so we restrict attention solely to borehole projects (that are
the modal project type), and Appendix Table A6 then replicates the sequence of speci…cations in
Table 4. This shows that when only borehole projects are considered, the coe¢cients of interest
(b1 b2) remain the same sign and signi…cance as in our main speci…cations presented in Table 4.
We next document the robustness of our baseline result along eight further margins (as shown
in Tables A7 and Figure A1): (i) de…ning threshold completion rates that deem the project usable
and seeing how management practices relate to reaching these thresholds; (ii) restricting the
sample to the largest/smallest organizations; (iii) removing organizations at the tails of the CS-
measures; (iv) considering the impacts of managerial practices on construction/non-construction
projects separately; (v) considering the impacts of managerial practices on projects implemented
by centralized/decentralized organizations separately; (vi) controlling for characteristics of the
state in which the project are located, and exploring how the results vary depending on whether
projects are located in the North or South of the country that de…nes the principal cultural divide
in Nigeria; (vii) alternative constructions of the CS- indices (rather than the equal weighting
procedure); (viii) using a fractional regression model.
Given the fact that methodologically, there is no de…nitive way to group individual practices
into management indices related to autonomy and incentives/monitoring, in Appendix Table A8 we
consider the robustness of our results to alternative groupings of practice into these two dimensions.
We consider changes to both CS- indices, as well as considering an alternative breakdown of the
CS-incentives/monitoring index, grouping practices that match more closely to input- or output-
based incentive measures. Taken together, the results show that small changes to the construction
of management practice indices we focus on, does not change the substantive conclusions reached
earlier from Table 4. In Appendix Table A9 we further examine the impacts of all nine dimensions
of management practice on project completion rates.
In Appendix Tables A10 to A12 we discuss other econometric concerns and assess their potential
severity. These concerns focus on: (i) projects being non-randomly assigned to organizations based
on their management practices; (ii) unobserved organizational or bureaucrat characteristics that
are correlated to management practices and also drive project completion rates.
17
4.4 Exploring the Negative Impact of Incentives/Monitoring
Our core results from Table 4 con…rm that the two dimensions of management practice em-
phasized by the public administration and economics literatures, namely autonomy and incen-
tives/monitoring, do indeed correlate to the quantity and quality of public services delivered. The
positive correlation of CS-autonomy with project completion rates supports the notion that public
agencies ought to delegate some decision making to bureaucrats, relying on their professionalism
and resolve to deliver public services. The evidence is less supportive of the notion that when
bureaucrats have more agency, they are more likely to pursue their own, potentially corrupt,
objectives that diverge from societal interests.
The robust negative correlation between project completion rates and management practices
related to the provision of incentives and monitoring of bureaucrats, is far more surprising and
counter to a large body of evidence from private sector settings. As described in the introduction,
the evidence on the impacts of performance-related incentives in public sector settings is mixed
(often focusing on the impacts of speci…c compensation schemes to frontline workers).18 Ours is
among the …rst evidence to suggest the possibility that such management practices have negative
impacts on the vital tier of civil service bureaucrats. Given the novelty and importance of this
…nding, we now investigate the result in more detail.
The detrimental impacts of such practices for bureaucrats might operate through at least three
mechanisms. First, bureaucrats might operate in a multi-tasking environment, exerting some
types of e¤ort that can be labelled as ‘processing’, that do not lead to project completion rates,
and also exerting more productive types of e¤ort that raise completion rates. Our management
practice measure might then capture an incentive system that places excessive regulatory burden
or ‘red tape’ on bureaucrats that has long been argued to lead bureaucrats to mis-allocate e¤ort
towards processing activities [Kelman 1990]. Alternatively, our management practices related to
incentives/monitoring might pick up subjective performance evaluation (SPE). While SPE has the
bene…t of being based on a more rounded set of assessments, such subjective assessments also
give rise to other biases and dysfunctional responses, especially the desire of agents to engage in
in‡uencing activities to curry favor with supervisors [Milgrom 1988, Milgrom and Roberts 1988].
If so, the increased use of such mis-targeted incentives and key performance indicators can also
lead to bureaucrats reallocating e¤ort towards non-productive tasks, reducing project completion
rates. Finally, performance incentives might crowd out the intrinsic motivation of bureaucrats
[Perry and Wise 1990, Benabou and Tirole 2006, Francois and Vlassopoulos 2008].19
18In health, two recent Cochrane reviews have come to di¤erent conclusions on the e¢cacy of pay for performance[Flodgren et al. 2011, Scott et al. 2011]. Perry et al. [2009] review 57 studies on pay for performance in the publicsector and conclude ‘pay-for-performance continues to be adopted but persistently fails to deliver’. Hasnain etal. [2012] review over 60 public sector studies, and …nd the vast majority are for tasks where outputs are moreeasily measurable such as teachers, health workers, and revenue inspectors. They argue there is simply insu¢cientevidence of the impact of incentives on bureaucrats.
19Baker [2002] develops a multi-tasking model to characterize how distortion and risk a¤ect the value and use
18
4.4.1 Multi-tasking and Incentive Design
We use three strategies to investigate this channel. We …rst check whether the partial correlation
of incentives/monitoring practices with project completion rates varies with the complexity of
projects, assuming: (i) more complex projects require more varied e¤ort types to be exerted; (ii)
incentives are harder to design for such projects, all else equal. Column 1 in Table 6 interacts
the CS-incentives/monitoring measure with the continuous measure of project complexity. For
expositional ease, this interaction term is de…ned in terms of its deviation from mean, so the
coe¢cients on CS-autonomy and CS-incentives/monitoring are interpreted as the marginal e¤ect
of these practices, evaluated at the mean of project complexity. We see the negative impacts of
CS-incentives/monitoring practices for bureaucrats are exacerbated in more complex projects, in
line with a multi-tasking interpretation.
Our second approach to understanding whether incentive/monitoring schemes might be poorly
designed in this setting uses the intuition that if the negative impacts of incentives/monitoring
re‡ects the inability of organizations to correctly target such incentives to the relevant types of
bureaucrat e¤ort, this problem might be ameliorated in organizations with better IT facilities,
who presumably have better capability to objectively measure e¤ort types [Bloom et al. 2012b].
To explore this we interact our CS-incentives measure with the CS-facilities dimension of man-
agement practice: as Table A4 shows, this relates to the availability of computing facilities at the
organization. In this speci…cation we rede…ne CS-other to exclude the CS-facilities component.
The result in Column 2 of Table 6 indeed shows the impacts of CS-incentives to be signi…cantly less
negative in organizations with better IT facilities. Moreover, there is no signi…cant levels impact
of CS-facilities: the provision/accessibility of IT facilities for bureaucrats only seem to matter in
combination with management practices related to incentives/monitoring.
A third approach to examine the role multi-tasking might play exploits information on the
inherent riskiness/ambiguity of projects as embodied in their technical speci…cations. Incen-
tives/monitoring practices might be harder to tailor for more ambiguously designed projects,
all else equal. To explore this, we consider projects of di¤erent types to be of systematically
di¤erent design ambiguity, and proceed in two steps. First, we measure this design ambiguity
using subcomponents of the complexity indicator described in Table A4. We construct a z-score
based on the design uncertainty, implementation uncertainty, design ambiguity and implementa-
tion ambiguity components of the project complexity metric. Denote the average ambiguity of
projects of type by . We then estimate a speci…cation analogous to (1) for a given project type
(excluding project type …xed e¤ects). In our sample, there are su¢cient numbers of projects
implemented across di¤erent organizations to estimate this for …ve project types: boreholes, build-
ings, dams, procurement and training. For each project type we then obtain an estimate of
of performance measures. The model highlights how in public bureaucracies, that cannot use stock incentives andhave nebulous objective functions, leading to a fundamental di¢culty in de…ning ‘good’ performance measures.Hence the potential for dysfunctional responses when high powered incentives are utilized in such settings.
19
the partial correlation between CS-incentives and project completion rates, b2, conditional on
CS-autonomy. Figure 1 plots the …ve (b2 ) pairs, as well as a cubic best …t.
The evidence suggests the deleterious impact of incentives/monitoring practices on project
completion rates is worse for projects with greater inherent design ambiguity.20 Projects with the
greatest design ambiguities might be those for which incentives/monitoring schemes are hardest
to tailor, and so illicit the most dysfunctional responses from bureaucrats. The heterogenous
impacts documented across project types in Figure 1 also provides an explanation of why there
are such mixed empirical …ndings in the literature on the impact of incentive provision in public
sector settings: di¤erent studies might have considered projects/tasks of di¤ering complexity and
design ambiguity. Finally, we note the average ambiguity of project types correlates with the
proportions of those projects that have completion rates of zero: this suggests bureaucrats might
simply shy away from implementing the most ambiguously designed projects to begin with.
4.4.2 SPE and Intrinsic Motivation
To shed light on the plausibility of these channels driving the e¤ects of incentives/monitoring
practices, we consider how these practices interplay with bureaucrat characteristics, as measured
through the survey we administered to a representative sample of o¢cials at each organization.
As described in Section 2, Nigerian bureaucrats enjoy long tenure. On the one hand, longer
serving bureaucrats might learn how best to respond to incentives by exploiting other ‡exibilities.
On the other hand, if bureaucrats are subject to SPE they might learn how best to engage in
in‡uence activities. To check for this, Column 3 in Table 6 controls for an interaction between
the average tenure of bureaucrats in the organization (in deviation from mean) with the CS-
incentives/monitoring measure, as well as the direct impact of tenure. We …nd the negative
impacts of incentives/monitoring are even worse in organizations sta¤ed by more experienced
bureaucrats, consistent with bureaucrats learning how to engage in in‡uence activities. We also
note there is no direct levels e¤ect of average tenure on project completion rates, so that it is
not the case that bureaucrats naturally reduce e¤ort over time as they become embedded within
long-standing norms of poor standards in civil service organizations. Rather, there appears to be a
speci…c interplay between bureaucrat tenure and incentives/monitoring practices for bureaucrats.
A burgeoning literature suggests those attracted to public service might be relatively more in-
trinsically motivated than those working in the private sector. Performance incentives might then
be detrimental if they crowd out such intrinsic motivation. To measure civil servant’s intrinsic mo-
tivation, we asked bureaucrats which factor that had most in‡uenced them to originally enter the
civil service from the following options: ‘I was interested in the type of work’, ‘income prospects’,
‘the prestige associated with such a job’, ‘the stable career path that a job in the service a¤ords’,
20Given the CS-performance and CS-autonomy are positively correlated and have opposite signed impacts onproject completion rates, this negative relationship between risk/uncertainty and incentives would be attenuatedif we do not control for CS-autonomy when estimating b2 [Prendergast 2002].
20
‘the chance to serve Nigeria’, ‘it was the only employment I could get’, ‘educational opportuni-
ties’, ‘other’. We de…ne those that answered, ‘the chance to serve Nigeria’ as being intrinsically
motivated. Roughly a third of o¢cials state that they entered the civil service to serve Nigeria.
For each organization, we then construct the fraction of intrinsically motivated bureaucrats.21
Column 4 shows how the impact of CS-incentives/monitoring varies by the intrinsic motivation
of bureaucrats. The previously documented negative impact of such practices is signi…cantly o¤set
when a greater share of bureaucrats are themselves intrinsically motivated. This runs counter
to the notion that incentive provision crowds out e¤orts of intrinsically motivated individuals: if
anything, as in Ashraf et al. [2014], our evidence suggests incentives/monitoring crowd-in the e¤ort
of intrinsically motivated bureaucrats. If our CS-incentives/monitoring measure captures SPE
being in place for bureaucrats, the result further highlights that intrinsically motivated bureaucrats
exert more productive e¤orts in organizations where such SPE are utilized to a greater extent,
rather than engaging in in‡uence activities, say.22
4.4.3 Corruption
While the recent economics literature has emphasized the importance of the intrinsic motivation
of bureaucrats, a long-standing literature in public administration emphasizes that civil servants
might pursue their own self-interest [Wilson 1989]. This more negative view of bureaucrats spurs
our …nal set of results, that explore how the impacts of incentives/monitoring are mediated through
perceptions of corruption among civil service organizations. Corruption in public bureaucracies
is a …rst order issue in Nigeria, and in many countries at similar stages of development (although
the fact that 31% of projects are completed fully also suggests corruption is not all pervasive).
To elicit information on perceptions of corruption, we began by discussing vignettes with
bureaucrats, then made those scenarios closer to the bureaucrat’s actual situation, and …nally
asked individuals about their own observations and experiences of corruption. We asked on what
proportion of recent projects the o¢cial had worked on, did they observe ‘others breaking service
21In the public administration literature, public service motivation is usually measured using the scale developedin Perry [1996], based on statements related to politics, public service and pro-social activities. This is the approachalso followed in Dal Bo et al. [2013]. Alternative approaches employed in the economics literature include: (i)dictator games to examine how many resources an individual transfers to a pro-social task [Ashraf et al. 2014];(ii) charitable contributions [Buurman et al. 2012]. In our civil servant survey, ‘the chance to serve Nigeria’ wasthe modal answer given. The other two most frequent reasons were ‘I was interested in the type of work’ and ‘thestable career path that a job in the service a¤ords’, that were each given by around 20% of individuals
22We have explored whether there are within-sample values of the interactions at which the marginal impact ofCS-performance is positive. Generally, this is not the case: even for the least complex projects or the most ITadvanced organizations the marginal impact of management practices related to incentives/monitoring is negative.For completeness we have also explored the heterogeneous impacts of management practices related to autonomy.We place less attention on these …ndings because theory o¤ers less guidance for such an analysis. In general, theimpact of management practices related to autonomy are homogeneous. They do not signi…cantly vary with projectcomplexity, non-modal project types, or bureaucratic tenure We do …nd the positive impacts of autonomy to besigni…cantly higher when a greater proportion of bureaucrats report being intrinsically motivated. We leave forfuture research the exploration of such heterogeneous impacts.
21

rules for their own bene…t’. On average, o¢cials stated that on 38% of projects such observations
of corrupt practice had been made, that, by chance, coincides with the proportion of projects with
a zero completion rate. We aggregate this to the organization level to construct the proportion of
projects bureaucrats report having observed corrupt practices on.23
Column 5 shows how the impacts of both dimensions of management practice vary by percep-
tions of corruption among bureaucrats. To begin with we note the robust negative levels impacts
of our corruption measure on project completion rates. This a¢rms the measure captures some
element of civil servant behavior that is deleterious for public service delivery. However, we see
that the marginal impacts of granting bureaucrats autonomy does not vary with the prevalence of
corrupt behaviors, and similarly, the negative marginal impact of incentives/monitoring also does
not signi…cantly vary with perceptions of corruption among bureaucrats. In short, the evidence
suggests that corruption has a direct and quantitatively large negative impact on project comple-
tion rates, but there are few bureaucrats on the margin of being prevented from behaving corruptly
because of incremental changes in management practice. Of course, this …nding is speci…c to this
context and is true for the types of relatively small-scale rural infrastructure projects we consider
(whose average budget is below $100 000). The interplay between corruption and management
practices for bureaucrats on larger budget projects remains open to study for future research.
5 Discussion
We provide among the …rst evidence on whether the management of bureaucrats matters for public
service delivery. We thus lay down a bedrock of evidence that starts to …ll an important knowledge
gap, linking the management practices the vital middle-tier of civil service bureaucrats are sub-
ject to, and public service delivery. We do so in the context of an important developing country,
Nigeria, and at a time when a large number of developing countries are engaged in reforming pub-
lic bureaucracies along the lines of the ‘good governance’ agenda of the World Bank and United
Nations [Gold…nch et al. 2012, Hasnain et al. 2012]. Our results con…rm that two dimensions of
management practice emphasized by the public administration and economics literatures: auton-
omy and incentives/monitoring, correlate to the quantity and quality of public services delivered.
Our …ndings provide support to the notion that public agencies might delegate some decision mak-
ing to bureaucrats [Simon 1983], at least for the types of small-scale rural infrastructure project we
mostly consider. We also provide evidence consistent with two interpretations of why management
practices related to incentives/monitoring have detrimental impacts in this setting: bureaucrats
operate in a multi-tasking environment, and these management practices pick up elements of sub-
23We also asked whether o¢cials had themselves been put under pressure to: (i) change the project location;(ii) change project speci…cations; (iii) help select particular contractors/suppliers/consultants; (iv) divert some ofthe funds. Aggregating responses into an organizational average, o¢cials stated that they had experienced suchpressures on 19% of projects. We prefer to use the measure related to observed corrupt practices over this measurebecause o¢cials are obviously cautious when potentially incriminating themselves.
22
jective performance evaluation, that lead to other dysfunctional responses among bureaucrats. As
such, our results sound a word of caution to the good governance agenda: the simple import of
incentive/monitoring practices from the private sector might back…re in bureaucratic settings.
An obvious next step is for researchers to implement …eld experiments that manipulate practices
along both dimensions. While there is a rich body of literature in economics examining the design
of incentives and use of monitoring technologies to build on, there remains much scope for thinking
through precisely how autonomy/decision rights within organizations can be reallocated. A wider
challenge for future experiments aiming to exogenously vary the autonomy of bureaucrats is that
if individuals have a lure for authority [Fehr et al. 2013], then the reallocation of power such
changes to autonomy necessarily imply, will naturally lead to some constituencies of bureaucrats
having incentives to internally block or undermine such changes in management practice, as found
in Banerjee et al. [2014].
We conclude by discussing three issues: (i) optimal management practices in bureaucracies;
(ii) methodological issues surrounding measuring management practices in bureaucracies; (iii) the
interplay between management practices and other mechanisms to improve public service delivery.
5.1 Optimal Management Practices
Our results naturally beg the question of why civil service organizations are not optimizing over
management practices to begin with. In our context, a fundamental source of this ine¢ciency
arises from organizations being tasked to implement many di¤erent types of project (Table 2).
As Figure 1 highlights, project types have very di¤erent characteristics and so it is unlikely that
there exists a unique set of optimal management practices any organization could have in place.
This lack of task specialization within civil service organizations is an underlying reason why
management practices still matter on the margin.24
As discussed by BVR for private sector …rms, suboptimal management practices might also
persist in equilibrium because: (i) there exist large …xed costs of adopting better practices; (ii)
best management practices might be heterogeneous across organizations. While little can be
said on the …rst point using the available data without making strong assumptions, the second
point is addressed by our results on the heterogeneous impacts of management practices. Those
results imply the optimal incentives/monitoring practices in place should re‡ect the complexity
and ambiguity of projects in an organization’s portfolio, the use of IT facilities, as well as the
tenure and intrinsic motivation of its bureaucrats. However, these issues were not at the fore
during the semi-structured interviews we conducted at organizations to understand what drives
24In line with this, we …nd evidence that the detrimental impacts of incentives/monitoring management practicesare even more negative for non-modal project types assigned to organizations (the magnitude of the impact beingaround 40% of that on modal project-types). This suggests management practices related to performance are bettertailored to the modal project type each organization is engaged in. Similarly, we also …nd that in organizationswith a wider portfolio of project types, the negative impact of incentives/monitoring is exacerbated. This againsuggests incentives are harder to design in such organizations.
23
management practices in reality. These all highlighted how practices evolve slowly over time as
a function of ground rules laid out in the Public Service Rules of the Nigerian civil service, the
history of senior management sta¤, and trade union demands. As further discussed in BVR,
ine¢cient management practices might also persist for dynamic reasons: learning and adjustment
costs might cause best practice to di¤use over time. This is in line with the evidence discussed
throughout on the frictions in the labor market for bureaucrats, limiting their mobility across
organizations. Finally, a particularly acute concern is that a lack of competitive pressure enables
poorly managed public sector organizations to survive. This might especially be true in developing
country contexts where mechanisms are rarely in place to allow citizens to choose across alternative
public providers of a given good or service, an issue we return to below.25
An alternative explanation why bureaucracies do not appear to optimize management practices
is based on a Weberian view: organizations do optimize management practices according to their
true objective; our evidence merely suggests this objective is weakly aligned with maximizing
project completion rates.26 To investigate this, we use data from our civil servant survey to check
whether management practices correlate to the frequency with which bureaucrats report engaging
with politicians and community groups. More precisely, we asked bureaucrats the proportion of
projects they engaged with politicians from the National Assembly, with politicians from the State
Parliament, with chairmen of local government, and with community/religious groups. With the
unit of observation being each bureaucrat’s report, we estimate whether this correlates with the
CS- measures, conditional on bureaucrat and organization characteristics, and bureaucratic-grade
…xed e¤ects. We run each speci…cation separately for manager and non-manager bureaucrats
(managers are those at or above grade 12).
Table 7 presents the results, showing that: (i) management practices related to autonomy have
weak impacts on bureaucratic engagements with politicians/other groups; (ii) management prac-
tices related to incentives/monitoring lead to signi…cantly more engagement with national and
state politicians, local government chairman, and community/religious groups; (iii) this second
e¤ect exists only for su¢ciently high bureaucratic grades (managers). The results might indicate
incentives/monitoring practices skew senior bureaucrat’s e¤ort away from activities that lead to
project completion towards engagement with politicians, in line with the earlier interpretation of
incentives being poorly tailored in this setting. Alternatively, if engagement with politicians en-
ables project completion rates to rise, all else equal, the results would imply incentives/monitoring
practices are well designed in this context after all. However, the fact that providing bureaucrats
25In the private sector, Bloom et al. [2012a] provide evidence that product market competition drives innovationstowards more better management practices. Bloom et al. [2014] …nd evidence that hospitals that face competitionfor patients from rival hospitals do indeed adopt better management practices.
26To further assess the degree of alignment in organizational objectives with project completion rates, we regressedthe log of project budgets on each of the 16 subcomponents of the project complexity indicator, as shown in TableA3. The residuals from this regression, that might capture the rents to be gained from the project if it is completed,are found to be weakly positively correlated with actual project completion rates, with a correlation of 13.
24
more autonomy does not lead them to engage more with politicians leans towards the …rst inter-
pretation. Collecting more detailed time use data for bureaucrats remains an important avenue
for future research.27
5.2 Methodological Issues
We add to a nascent literature utilizing the BVR approach to measure management practices
outside of the private sector.28 We fully recognize the scope for future work to investigate the
precise dimensions of management practice most relevant in bureaucracies, and design questions
that can best help to build indices of these measures. Perhaps part of the issues will become more
settled as further work is conducted to understand whether management is best thought of as a
technology and input into the production process [Bloom et al. 2014] so that some practices can
be thought of as inherently good or bad, or whether it is a form of organizational design where
di¤erences in practices are styles optimized by each organization [Gibbons and Roberts 2013].
Moreover, future work on the study of bureaucracies needs to integrate in an analysis of political
factors – such as measuring the ‘political will’ to complete speci…c projects, identifying informal
incentives politicians provide bureaucrats (say through patronage), and better understanding the
con‡ict politicians face in providing bureaucrats autonomy versus their desire to retain political
control of public service delivery. All such factors likely interplay with the management practices
bureaucrats operate under. Rogger [2014] takes a …rst step in this direction, using the OPEN data
to investigate the extent to which political interference in the bureaucracy explains the productivity
of bureaucratic organizations. He …nds that while political interference is certainly an important
feature of the Nigerian civil service, it is unrelated to management practices: rather it is driven by
the political competition politicians face.
5.3 Other Mechanisms To Improve Public Sector Delivery
Our analysis …ts within a broader literature examining ways to improve public service delivery in
developing countries. This highlights mechanisms that can interplay with management practices
for bureaucrats within organizations. The …rst mechanism relates to the selection of bureaucrats
into the civil service. Our …ndings highlight there can be an interplay between the intrinsic moti-
vation of bureaucrats and how they respond to management practices. On turnover, bureaucratic
tenure is important both because longer serving bureaucrats shape the management practices in
place, but they might also react di¤erently to any given set of incentives, as highlighted in Table
27Bureaucrats report engaging with national politicians on 12% of projects. The corresponding …gures for theother groups are 7% for state politicians, 13% for local government chairmen and 24% with community groups.
28For example, Bloom et al. [2014] study management practices in UK hospitals. In education, MCormack et al.[2013] have measured management practices in nearly 250 departments from 112 UK universities, and Di Libertoet al. [2013] measure management practices in schools in six industrialized countries (they extend BVR to alsocover practices related to leadership).
25
6. A recent contribution in this direction is Dal Bo et al. [2013] who present evidence from Mexico
and exploit experimental variation in salaries to identify their impact on the selection of public
sector o¢cials. They …nd higher wages attracted more able workers, and there are no adverse
selection impacts in terms of intrinsic motivation. This evidence complements our …ndings on the
impact of management practices once bureaucrats are hired.
The second mechanism is the role of grass roots monitoring of public service providers, the e¤ect
of which likely also interplays with management practices in place [Olken 2007]. Along similar
lines, Besley and Burgess [2002] and Ferraz and Finan [2008] have documented the signi…cant role
that top-down media scrutiny can play for public service provision.
The contours of a rich future agenda for understanding public service delivery (in rich and
poor countries) are thus beginning to emerge, linking management practices for bureaucrats, se-
lection/retention policies for bureaucrats, and mechanisms/incentives for the public and politicians
to hold public sector organizations accountable. Our contribution is to open the black box of the
economic forces driving the behavior of the vital middle-tier of civil service bureaucrats (as distinct
from politicians and frontline workers that the literature has previously studied). We hope our
analysis spurs methodological advancements in how to measure management practices in bureau-
cracies, and encourages researchers to design interventions where such practices are experimentally
manipulated, as well as other features of bureaucrats’ work environment.
A Appendix
A.1 Measuring Project Complexity
Data on the complexity of government projects is not directly part of the OPEN data set. We thus
worked with a pair of Nigerian engineers familiar with the OPEN projects and a number of inter-
national researchers working on technical complexity to de…ne a relevant set of indicators based
on the technical documents for each OPEN project. We followed the perspectives on complexity
suggested by Remington and Pollack [2007], by asking the engineer-assessors to individually assess
projects along the following …ve topics, each with their own set of indicators.
Structural complexity stems from the scale of di¤erent interconnected tasks and activities. The
indicators associated with this topic capture structural aspects such as project size and the number
of inputs required for production. They also capture issues in raw material and labour supply, and
the ease with which any necessary specialized skills and equipment can be sourced. Temporally
complex projects are those whose production involves uncertainties. Hence there are indicators
for uncertainties in design and implementation. Technically complex projects are those whose
production have ambiguous risks, namely their uncertainties are not well understood. Hence some
indicators capture ambiguities in design and implementation. Directional complexity refers to the
potential for preferences over the project to diverge. The engineer assessors are thus asked to
26
rate the managerial complexities of the project. Finally, there is a subjective assessment as to
the overall complexity of the project. This allows any unassessed aspects of complexity to be
measured and provides a comprehensive picture of project complexity.
Two quali…ed and independent Nigerian engineers were then contracted to assess each project
in the OPEN data set along these margins. The process of aggregation between engineers used in
this project aimed to build a consensus. The …rst engineer coded indicators for the entire data set.
The codings of the …rst engineer were then provided to the second engineer who then constructed
his own codings with reference to the codings of the …rst. The aim was to anchor the coding of
the second engineer in that of the …rst but give him freedom to disagree where he felt the coding
was incorrect. We decided this approach balanced consensus and subjectivity.
The two engineers were provided with project details and documents and asked to code a value
for each indicator. The documents only contained information available before implementation
such that there was no bias from the coding being done after the projects were implemented.
Table A3 provides descriptive statistics for all 16 indicators from which the complexity index
is constructed, as well as how each is correlated with the other indicators. Aggregate complexity
is a subjective assessment of the overall complexity of the projects by the two engineers, that
includes ‘all factors that might in‡uence the di¢culty of implementing the project, not only those
assessed [by the other indicators]’. We asked the engineers to take the distribution of complexity
in the OPEN data set as a whole, with the least complex project in the data having an aggregate
complexity of zero and the most complex project having an aggregate complexity of 100, and place
each project within this distribution.
We undertook a number of measures to check the complexity of the OPEN indicators coded by
the engineers. First, we inserted 200 randomly chosen repeated projects into the data set provided
to the engineers. Since the project characteristics of the original and repeat projects are identical,
we would expect that the codings of the two sets of projects would be similar. Reassuringly, we
…nd that in general the original and duplicate projects are coded in similar ways. We compare the
di¤erences between these two sets by looking at group and paired means, and distributional tests
for each variable. The di¤erences are only statistically signi…cant at conventional levels in a few
cases, and the magnitude of the di¤erences are relatively small. For example, the only variable
that is statistically signi…cantly di¤erent below the 10% level in the mean-comparison t-test relates
to raw material storage. Here, despite a standard deviation of 2 in the originals, the di¤erence is
07 between the originals and the duplicates. Second, we looked at the similarity of the codings
of the two engineers. We …nd that the second engineer’s codings are not dramatically di¤erent
from the …rst engineer’s e¤orts. Whilst there are a small number of di¤erences, they are relatively
small and rarely signi…cant, indicating that the re-coding left the overall picture relatively stable.
Finally, over a year after he had completed the prompted codings, we asked the second engineer
to re-code a sub-sample of projects from scratch, this time without prompting. The di¤erences
between these independent codings and the consensus data we rely on are again relatively minor.
27
It seems that once he had become accustomed to the broad parameters of the coding framework,
the second engineer’s coding was not dissimilar to the consensus generated by the two engineers
working one after the other.
We therefore have evidence of similar projects within the data set being coded in a similar way,
of the two engineers coding in similar ways both when prompted and unprompted, and when there
were deviations, of the deviations not being particularly quantitatively large. Taken together these
checks reassure us that the complexity measures pick up meaningful variation across projects.
A.2 Standard Errors
Our baseline speci…cation assumes the disturbance term is clustered by project type-organization.
Table A5 shows the robustness of our results to alternative assumptions on the error structure.
The table is structured to cover the same speci…cations as in Columns 1 to 4 of Table 4, but where
we now report standard errors based on alternative assumptions: (i) robust standard errors; (ii)
errors clustered by project-type and organization as in Table 4; (iii) standard errors clustered by
organization. One concern with such clustered standard errors is that they may be downwards
biased when the number of clusters is small (and in our speci…cation the number of clusters
corresponds to 63) [Cameron et al. 2008]. They propose various asymptotic re…nements using
bootstrap techniques, …nding the wild cluster bootstrap-t technique performs particularly well
in Monte Carlo simulations. We have implemented this method on our baseline speci…cations
and show in brackets in Columns 1 to 4 the resulting p-values. This correction does not alter
the signi…cance of any of the coe¢cients from our preferred speci…cation with project type …xed
e¤ects shown in Column 4 of Table A5.
A.3 Robustness Checks
We conduct a wide range of robustness checks on our core result on project completion rates. To
begin with we note that the results in Table 4 used our continuous measure of project completion
rates (from zero to one) as the dependent variable. However, an alternative approach is to de…ne
a threshold of completion that would deem the project usable. To do so we consider all potential
thresholds from 1% to 100% in increments of 1% and then estimate a speci…cation analogous to
(1) where is de…ned as a dummy variable equal to one if the project completion rate is above
the given threshold %, and zero otherwise. For any given threshold the coe¢cients of interest
are denoted 1 and 2. Figure A1 then plots each pair of (b1,b2) estimates, for each threshold
and their associated 95% con…dence interval.
Two points are of note. First, at the extreme left of the …gure where we consider a 1%
threshold, we are essentially using a linear probability model to assess the relationship between
management practices in civil service organizations and whether projects are started in some way.
28
This essentially replicates the extensive margin speci…cation shown in Column 5 of Table 4. Here
we …nd marginal impacts of each type of management practice to be qualitatively similar to those
documented earlier for the average completion rate, although the point estimate on CS-autonomy
seems to be lower than the baseline speci…cation.29 Second, we cannot reject the null that the sign
and signi…cance of the coe¢cients are the same for every threshold of project completion. Taken
together, the results imply that managerial incentives along both margins have similar impacts
on the extensive margin of public service delivery (namely whether projects are started at all)
and the total e¤ect margin of project completion (namely a weighted average of the project being
started, and the extent to which projects are completed conditional on being started).
The checks detailed in Table A7 all verify the robustness of our main …nding to alterative
samples of organizations and projects: Column 1 excludes those projects implemented by the
largest organization in terms of total expenditures. Column 2 excludes projects implemented by
the largest organization in terms of number of projects. Columns 3 and 4 remove the 10 smallest
organizations by expenditures and number of projects respectively. Columns 5 and 6 exclude
organizations at the top and bottom of the CS-autonomy and CS-incentives management scales
respectively. In each cut of the data, the core results remain stable, so that our …ndings do not
appear to be drive by outlier or speci…c organizations.
The third series of robustness checks in all probe the core results in alternative subsamples
of data (with the caveat that such splits of the data inevitably lead to less precise estimates).
Columns 7 and 8 in Table A7 break down the project types listed in Table 1 into two groups:
those related to construction projects (borehole, building, electri…cation, dam, road and canal)
and those related to non-construction projects. We …nd that for construction projects, the results
closely replicate the baseline …ndings. Indeed, for construction projects as a whole the point
estimates on each management practice index is slightly larger in absolute value than the baseline
result in Column 4 of Table 4. For non-construction projects, the results show that CS- autonomy
continues to have a positive and signi…cant impact on project completion rates; CS-incentives has a
negative correlation with project completion rates that is signi…cant at the 10% level. As suggested
by Figure 1, this might be because non-construction projects such as training and procurement,
are inherently less ambiguous in design.
The next split considered in Columns 9 and 10 is between centralized and decentralized civil
service organizations, where centralized agencies correspond to government ministries. We see the
impacts of CS-autonomy to be similar in both, although the CS-index index only has negative
impacts in the centralized agencies. This latter result is worth exploring in future work.
The next robustness check addresses the concern that di¤erent management practices might be
29There is not continuous mass in project completion rates over the [0,1] interval: hence we do not expect themarginal impact of the each management practice to be sensitive to marginal changes in threshold where thereis little mass in project completion rates. This explains why the marginal impacts shown in Figure A1 jump at asmall number of points.
29
spread across the country in a way that is correlated with characteristics of the organization’s local
geographies. Indeed, it is well understood that the characteristics of local populations interplay
with them being able to solve collective action problems, and thus are an important driver of public
goods provision [Banerjee et al. 2007]. To address this issue, Column 11 additionally controls for
a wide variety of state-level controls for each project and …nds almost no change in the coe¢cients
of interest. In short, local area characteristics do not seem to be driving our results.30 Columns
12 and 13 split the sample into projects that are located in the Northern and Southern regions
of Nigeria respectively, that characterizes the …rst order cultural divide in Nigeria, and provides a
relatively even split in the number of projects. We …nd the impacts of both management practices
to remain signi…cant in both regions. This suggests that cultural di¤erences across regions do not
much interact with responses to these management practices.
The …nal two robustness checks relate to methodological issues. First, we consider alternative
constructions of the CS- management practice indices. As described in Section 3.3, following
BVR, we aggregated responses to individual questions to construct our indices of management
practices giving equal weight to all questions. A natural alternative is to cluster the variables
into the various management topics described in Table A4 and weight each topic (rather than
each variable) equally. We re-construct our CS-autonomy and CS-incentives measures along these
lines and re-estimate our preferred speci…cation (1). The result, in Column 14 of Table A7 is
qualitatively in line with our baseline results, although the absolute magnitude of each measure of
public sector management is larger : a one standard deviation increase in CS-autonomy corresponds
to a signi…cantly higher project completion rate of 23%, and a one standard deviation increase in
CS-incentives corresponds to a signi…cantly lower project completion rate of 14%.
The analysis has so far estimated (1) using OLS. The …nal robustness check estimates this
speci…cation using a fractional regression model that accounts for the dependent variable being
a continuous variable between zero and one. To do so, we utilize Papke and Wooldridge’s [1996]
fractional logit model in which the conditional expectation function is modelled as a logistic
function that can take all values in the unit interval. The interpretation of the marginal e¤ects
are the same as in the binary logit model and evaluated at sample averages, the partial e¤ects are
approximately comparable to the coe¢cients from a linear regression. The result in Column 15 of
Table A7 shows our core …ndings to be robust to this alternative estimation model.
A.4 Alternative Groupings of Management Practice
We clearly recognize there is no de…nitive way to collate management practices into aggregate
indices of autonomy and incentives/monitoring. Table A8 explores alternative ways to construct
both indices. On the autonomy measure, to re‡ect that the capabilities of bureaucrats are crucial
30We construct these state controls using aggregated data provided by the National Bureau of Statistics. Thesample drops slightly in this speci…cation because the state in which the project is located (or should have beenlocated for those projects that are never started) is missing for around 450 projects.
30
to how much autonomy they have, we aggregate a new autonomy measure from the subcomponents
shown in Table A4 related to “roles” and “skills”. The result, in Column 2 of Table A8, shows
this measure of autonomy to have a positive and signi…cant e¤ect on project completion rates,
although the point estimate is smaller than our preferred measure. We next consider an alternative
incentives/monitoring measure that also encompasses the use of “targets” in the organization: this
new measure re‡ects the creation of goals for the organization that o¢cials are required to move
towards. Column 3 of Table A8 shows this measure of incentives/monitoring to have negative and
signi…cant e¤ects on project completion rates. An alternative way to group the practices related
to incentive provision is if they relate to output based incentives, input based incentives or a
combination of both (as shown in Table A4). The result in Column 4 of Table A8, shows each
aspect of incentives to have negative and signi…cant e¤ects on project completion rates.
A.5 Decomposing Management Practices
We elicited management practices along nine dimensions in each organization: roles, ‡exibility,
incentives, monitoring, culture, targeting, facilities, skills and sta¢ng. We now estimate a speci-
…cation analogous to (1) but where we condition on the nine separate dimensions of management
practice. This disaggregated speci…cation serves two purposes: (i) by breaking up the CS-other
measure into its components, it helps assess if there are other aspects of management practice that
the CS-autonomy and CS-incentives measures might be picking up; (ii) it underpins the validity
of the three-way classi…cation of management practices in our baseline speci…cation.
Table A9 …rst estimates the impact of each dimension separately. The roles and ‡exibility
subcomponents that formed our CS-autonomy measure are individually positive and signi…cantly
di¤erent from zero (Columns 1 and 2). Columns 3 and 4 show that each subcomponent that
formed the CS-incentives index is negatively and signi…cantly related to project completion rates.
Columns 5 to 9 then split the remaining management practices that were previously within the
CS-other measure. Most of these have no signi…cant impact on project completion rates.
In Column 10 we simultaneously control for all nine CS- components, and …nd: (i) both roles
and ‡exibility components remain positive and individually signi…cantly correlated to project
completion rates; (ii) the incentives component is negative but not signi…cantly di¤erent from zero
(the point estimate hardly changes from Column 3 but the standard error almost doubles), while
the monitoring component remains negative and signi…cantly correlated with project completion
rates; (iii) four out of …ve of the other dimensions of management practice remain insigni…cant.
The fact that di¤erent elements of management practice have positive, zero, or negative im-
pacts on project completion rates helps allay the concern that the CS- measures used in our core
results simply pick up some unobserved element of management practice. If organizations that
employed the most resourceful and skilled bureaucrats were also those best able to provide auton-
omy to their bureaucrats and adapt to new scenarios, then we would be concerned that the partial
31
correlation between CS-autonomy and project completion rates was being partly confounded by
such other factors. That other dimensions of management practice related to culture or sta¢ng
are uncorrelated with project completion rates, suggests this is not the case.
In Column 11 we aggregate all nine indices into a single management index, as considered by
BVR for manufacturing …rms. In our setting such aggregation leads to the wrong conclusions
being drawn: we …nd no signi…cant relationship between the aggregate CS-management measure
and project completion rates. The reason is clear: the underlying components of the aggregate
index do not all have the same signed impacts on project completion rates. Hence management
of bureaucrats does matter, but di¤erent dimensions of management practice have very di¤erent
impacts on outcomes in this public sector setting.
B Econometric Concerns
Absent exogenous variation in management practices, we have interpreted our …ndings as partial
correlations between the CS- measures and public service delivery. To assess the extent to which
these …ndings can map to a causal interpretation of the impacts of the CS- measures, we provide
evidence on the likely severity of two econometric concerns: (i) projects being non-randomly
assigned to organizations based on their management practices; (ii) unobservables correlated to
management practices and also drive project completion rates.
B.1 Project Assignment
The …rst class of concerns relate to the assignment of projects to organizations on the basis
of management practices. For example, if better managed organizations are more likely to be
assigned harder-to-implement projects, this creates a spurious negative correlation between our
CS- measures and project completion rates. This suggests (b1, b2) are both biased in the same
direction, and hence a more complicated explanation is required to imply that b1 is both upwards
biased and b2 is downwards biased. We investigate the potential non-random assignment of
projects in two ways.
We …rst use a conditional logit model to directly estimate the likelihood of project being
assigned to organization conditional on the management practices for bureaucrats in place in
the organization, and other project and organizational characteristics exploited in our analysis.
To do so we …rst reshape our data as follows: for each project we created a binary variable with 63
values corresponding to our 63 organizations. The variable, denoted, takes the value one for the
organization at which that project is actually assigned, and zero otherwise. Thus, the data-set is
at the project-organization pair level (), with a total of 4721£63 = 297 423 project-organization
paired observations. To each observation, we attach the relevant organization-level characteristics
used in our analysis (that were denoted in (1)), such as our management indices, capital
32
controls and organizational averages of bureaucrat characteristics. We then also consider whether
speci…c project-organization interactions, denoted , correlate with the assignment of projects
to organizations. We estimate a conditional logit speci…cation for Prob( = 1), based on both
sets of characteristics;
[ = 1] =exp(0 + 0)
X
exp(0 + 0)
(2)
Note that in this modelling framework project characteristics play no role as these do not vary
within a given project over the organizations it could potentially have been assigned to.
We run three sets of speci…cations. The …rst takes the perspective that each project could have
been assigned to any of our 63 organizations. The second takes the perspective that projects can
only be implemented by organizations of the same sector. Thus, health projects could only be
implemented by health sector organizations for example. When we impose this restriction on the
permissible project-organization pairs, we lose 847 projects as there is only one organization of that
sector in our data, and there are 44 429 potential within sector project-organization pairs. The
third speci…cation further imposes the assumption that projects can only potentially be assigned
to organizations in the same sector that are observed being tasked to implement a project of the
same complexity. This further reduces the sample to 33 480 feasible project-organization pairs.
In all speci…cations we cluster standard errors by organization as there are likely to be unobserved
characteristics of organizations that determine project assignments.
Table A10 presents the results. Column 1 utilizes the entire set of project-organization com-
binations and uses only our management scores in the regression. Unconditional on other orga-
nization characteristics, neither management practice related to autonomy or performance-based
incentives signi…cantly predicts the assignment of projects to organizations. When we restrict the
sample so that each project can only feasibly be assigned to organizations in the same sector,
Column 2 shows the coe¢cient on CS-autonomy to become signi…cant at the 10% level, but this
result is not robust. In Column 3 where we restrict the feasible pairs also using information on
the complexity of projects, we …nd the probability of projects being assigned to organizations do
not signi…cantly correlate with the management practices in place in the organization.
Column 4 extends the speci…cation to include all the organizational controls utilized in our
baseline speci…cation (capital, general and noise), as well as the full set of organizational controls
that we use elsewhere in the paper. The coe¢cients on the management practices remain insignif-
icantly di¤erent from zero at the usual levels. Moreover, we …nd no evidence that any of these
other organizational characteristics predict the assignment of a given project to that particular
organization rather than other organizations it could feasibly have been assigned to.
In Column 5 we additionally control for a series of interactions between project characteristics
(scale, complexity) and organizational characteristics (total sta¤, total budget). Some of these
project-organization interactions do predict the assignment of projects. As is intuitive, we …nd
33
that the interactions between the number of sta¤ at an organization and the project budget,
and the organization’s total budget and the project complexity, both are positive and signi…cant
predictors of project assignment. Over and above these interactions, we continue to …nd no impact
of management practices on project assignment even once we allow for speci…c matched pairs to
be assigned in this way.
Overall, these results suggest our results are not re‡ecting the non-random selection of projects
to organizations based on their management practices. While there is no doubt some complex
bargaining process between Parliament, civil service organizations and other stakeholders that de-
termined the assignment of projects to locations and organizations, on the margin, this assignment
is uncorrelated with the management practices in place in implementing organizations.
Our second approach conducts further analysis at the organization level, estimating the fol-
lowing speci…cation,
= 1- + 2- + 3- + + (3)
where observations are for the 63 organizations listed in Table A1, are measures related to
the set of projects assigned to organization by Parliament, the CS- measures are as previously
described, and includes the same organization level controls and noise controls as previously
described. Robust standard errors are reported. The results are presented in Table A11 and
show that: (i) b1and b2 are both positive, so that organizations that provide more autonomy
and performance incentives to bureaucrats are assigned more projects, but neither correlation is
signi…cantly di¤erent from zero (Column 1); (ii) the unique number of project types assigned to
an organization is also not signi…cantly related to the management practices in place (Column 2).
Taken together, these results suggest that whatever the bargaining game between stakeholders in
the Parliamentary procedure that assigns projects to organizations, there is not much to suggest
it is based on management practices in those organizations.
B.2 Unobservables
The second class of concern is that our measures of management practice are correlated to un-
observed factors in , and these unobservables directly determine project completion rates thus
biasing our coe¢cients of interest. Unobserved factors might relate to features of organizations or
bureaucrats.
B.2.1 Organization Features
Table A11 addresses this concern by using speci…cation (1) to check whether management prac-
tices correlate to other organizational outcomes beyond project completion rates. In Column
3 we construct the average complexity of projects assigned to organization as our dependent
34
variable, and then regress this against our measures of management practice and other organiza-
tional characteristics. Neither CS- measure is signi…cantly correlated to the average complexity
of projects the organization is tasked to implement. Hence it is not the case that organizations
with better practices related to autonomy are assigned easier projects, and those with more incen-
tives/monitoring are assigned harder to implement projects. In Column 4 we use the log of the
organization’s aggregate budget as our dependent variable: again we …nd no correlation between
the management practices in place and the organization’s resources. Hence it is not the case that
organizations that have better practices also command larger budgets overall, that might otherwise
have indicated it was easier for the organization to complete their assigned projects.
B.2.2 Bureaucrat Characteristics
If bureaucrats sort into organizations based on management practices, then the impacts of such
practices are confounded by any direct relation between bureaucrat characteristics and project
delivery. In Section 2 we highlighted there are frictions in the labor market for bureaucrats that
limit the scope for individuals to freely join or move across organizations, and hence this also limits
the ability of organizations to use management practices to attract certain types of bureaucrat.
Table A12 presents additional characteristics of bureaucrats elicited in our civil servant survey to
shed light on this issue, aggregating each response to an organizational average. Column 1 shows
the mean and standard deviation of the bureaucrat characteristic for the average organization.
Columns 2 and 3 show regression coe¢cients (b1b2) from a speci…cation analogous to (3), where
the dependent variable is the organizational average for the bureaucrat characteristic and we
condition on the organizational characteristics in . Robust standard errors are in parentheses.
The …rst batch of characteristics investigate the speci…c social connections bureaucrats have
with senior sta¤ in the organization to which they are appointed: almost no bureaucrats report
knowing their direct boss, or other managers, prior to their appointment. The lack of variation in
this response precludes it being regressed against the CS- practices. Where there is more variation
is in terms of the number of close colleagues that were known to the individual prior to their
assignment: on average, bureaucrats report knowing 440 other colleagues. However, we …nd this
degree of linkage across bureaucrats, when averaged to the organization level, to be uncorrelated
with the management practices in place related to autonomy and performance incentives. Our
next question elicits information on personal connections among bureaucrats by asking individuals
whether they were the …rst family member to join the civil service: 48% of bureaucrats in the
average organization report being the …rst in their family. We …nd no correlation between this
measure of bureaucrat networks and the management practices in place.
We next consider additional bureaucrat characteristics that might be indicative of the ‘relia-
bility’ of bureaucrats, and examine whether such measures correlate to the management practices
in place. Throughout, we split bureaucrat characteristics into those of senior and low-tier bu-
35
reaucrats, as these di¤erent tiers might di¤erentially impact the management practices in place.
As shown in the lower half of Table A12, we …nd no signi…cant correlation between management
practices related to autonomy or performance incentives and the average tenure of bureaucrats,
the proportions of them that report being intrinsically motivated, or that report observing corrupt
practices on projects (for both senior and lower-tier bureaucrat characteristics).31
A second approach to measuring bureaucrat ‘reliability’ is based on responses to vignettes on
scenarios bureaucrats face. One vignette relates to the following situation: an o¢cial in an organi-
zation like theirs is told by her manager to take funds from a certi…ed project and give them to a
contractor/supplier for projects that the government has yet to complete due process on, against
public service rules. The contractor then does not do the work he was paid for. We asked bureau-
crats whether they agreed/disagreed with various statements related to the vignette: whether the
bureaucrat acted correctly, whether the bureaucrat’s manager acted correctly, whether bureau-
crats should sometimes go against rules and so forth. We …nd little evidence of any signi…cant
relationship between the proportion of bureaucrats that agree with each such statement and the
management practices in place in the organization. If such vignettes are informative of bureaucrat
‘types’, this evidence suggests that typically harder to observe measures of bureaucrat reliability
are not much correlated with management practices in place.32
References
[1] acemoglu.d (2005) “Politics and Economics in Weak and Strong States”, Journal of Mon-
etary Economics 52: 1199-226.
[2] acemoglu.d, p.aghion, c.lelarge and f.zilibotti (2007) “Technology, Information and
the Decentralization of the Firm”, Quarterly Journal of Economics 122: 1759-99.
[3] aghion.p and j.tirole (1997) “Real and Formal Authority in Organizations,” Journal of
Political Economy 105: 1-29.
31These results suggest that it is not the case that organizations limit the provision of performance-based in-centives to attract intrinsically motivated workers [Delfgaauw and Dur 2010], or that the matching of intrinsicallymotivated workers to public sector organizations limits the need to use performance-based incentives [Besley andGhatak 2005]. Both …ndings are partly driven by the rigidities in the assignment of bureaucrats to organizations.
32Enumerators stressed there were no right answers, and vignettes were phrased in reference to a bureaucratin the third person (Ngozi). O¢cials were asked whether they agreed or disagreed with the following statements:(i) ‘Ngozi should have refused to divert the funds and paid the contractors/suppliers/consultant for the certi…edproject’ (76% agreed); (ii) ‘The contractors/suppliers/consultant should not have accepted the funds given thatDue Process had not been followed’ (68%); (iii) ‘The boss was wrong to direct Ngozi to share the funds of a projectwith others’ (81%); (iv) ‘Sometimes it is right to go against strict rules, as Ngozi did, so to make things fairer ormore e¢cient’ (28%); (v) ‘Bureaucrats should be given more space to interpret what the best action to take in agiven situation is’ (59%). We check whether there is a signi…cant correlation between the proportion of bureaucratsthat agree with each statement and the management practices in place: nine out of ten correlations are insigni…cant.
36
[4] alabi.m.o.a and j.y.fashagba (2010) “The Legislature and Anti-corruption Crusade un-
der the Fourth Republic of Nigeria: Constitutional Imperatives and Practical Realities,”
International Journal of Politics and Good Governance 1.
[5] ashraf.n, o.bandiera and k.jack (2014) “No Margin, No Mission? A Field Experiment
on Incentives for Pro-social Tasks,” Journal of Public Economics 120: 1-17.
[6] baker.g.p (2002) “Distortion and Risk in Optimal Incentive Contracts,” Journal of Human
Resources 37: 728-51.
[7] bandiera.o, a.prat and t.valletti (2009) “Active and Passive Waste in Government
Spending: Evidence from a Policy Experiment,” American Economic Review 99: 1278-308.
[8] banerjee.a, r.chattopadhyay, e.duflo, d.keniston and n.singh (2014) Improving
Police Performance in Rajasthan, India: Experimental Evidence on Incentives, Managerial
Autonomy and Training, mimeo, MIT.
[9] banerjee.a, l.iyer and r.somanathan (2007) “Public Action for Public Goods,” in
Handbook of Development Economics Vol. 4, T.P.Schultz and J.Strauss (eds.), Elsevier.
[10] benabou.r and j.tirole (2006) “Intrinsic and Extrinsic Motivation,” Review of Economic
Studies 70: 489-520.
[11] besley.t (2004) “Paying Politicians: Theory and Evidence,” Journal of the European Eco-
nomic Association 2: 193-215.
[12] besley.t and r.burgess (2002) “The Political Economy of Government Responsiveness:
Theory and Evidence from India,” Quarterly Journal of Economics 117: 1415-52.
[13] besley.t and m.ghatak (2005) “Competition and Incentives with Motivated Agents,”
American Economic Review 95: 616-36.
[14] besley.t and t.persson (2010) “State Capacity, Con‡ict and Development,” Econometrica
78: 1-34.
[15] black.s and l.lynch (2001) “How to Compete: The Impact of Workplace Practices and
Information Technology on Productivity,” Review of Economics and Statistics 88: 434-45.
[16] bloom.n and j.van reenen (2007) “Measuring and Explaining Management Practices
Across Firms and Countries,” Quarterly Journal of Economics 122: 1351-1408.
[17] bloom.n and j.van reenen (2010) “New Approaches to Surveying Organizations,” Amer-
ican Economic Review 100: 105-9.
37
[18] bloom.n, r.sadun and j.van reenen (2012a) “The Organization of Firms Across Coun-
tries,” Quarterly Journal of Economics 127: 1663-1705.
[19] bloom.n, r.sadun and j.van reenen (2012b) “Americans do I.T. Better: US Multina-
tionals and the Productivity Miracle,” American Economic Review 102: 167-201.
[20] bloom.n, r.sadun and j.van reenen (2014) Management as a Technology, mimeo, LSE.
[21] bloom.n, b.eifert, a.mahajan, d.mckenzie and j.roberts (2013) “Does Management
Matter: Evidence from India,” Quarterly Journal of Economics 128: 1-51.
[22] bloom.n, c.propper, s.seiler and j.van reenen (2014) The Impact of Competition on
Management Practices in Public Hospitals, forthcoming, Review of Economic Studies.
[23] buurman.m, j.delfgaauw, r.dur and s.van den bossche (2012) “Public Sector Em-
ployees: Risk Averse and Altruistic?,” Journal of Economic Behavior and Organization 83:
279-91.
[24] cameron.c, j.gelbach and d.miller (2008) “Bootstrap-Based Improvements for Infer-
ence with Clustered Errors”, Review of Economics and Statistics 90: 414-27.
[25] dal bo.e, f.finan and m.rossi (2013) “Strengthening State Capabilities: The Role of
Financial Incentives in the Call to Public Service,” Quarterly Journal of Economics 128:
1169-218.
[26] delfgaauw.j and r.dur (2010) “Managerial Talent, Motivation, and Self-Selection into
Public Management,” Journal of Public Economics 94: 654-60.
[27] di liberto.a, f.schivardi and g.sulis (2013) Managerial Practices and Students’ Perfor-
mance, mimeo, LUISS.
[28] dijkstra.g, b.akanji, c.hiddink, s.sangarabalan and f.de mevius (2011) Mutual
Interests - Mutual Bene…ts: Evaluation of the 2005 Debt Relief Agreement Between the Paris
Club and Nigeria, Ministry of Foreign A¤airs of the Kingdom of the Netherlands.
[29] dixit.a (2002) “Incentives and Organizations in the Public Sector: An Interpretive Review,”
Journal of Human Resources 37: 696-727.
[30] duflo.e, r.hanna and s.p.ryan (2012) “Incentives Work: Getting Teachers to Come to
School,” American Economic Review 102: 1241-78.
[31] eboh.e (2010) MDGs-based Planning in Africa: Lesson, Experiences and Challenges: A Case
Study of Nigeria, Addis Ababa: United Nations Economic Commission for Africa.
38
[32] federal government of nigeria (2007) The Story of OPEN.
[33] federal government of nigeria (2008) Monitoring and Evaluation Report of the DRG-
Funded MDG Projects and Programmes in Nigeria 2006.
[34] federal government of nigeria (2009) Monitoring and Evaluation Report of the DRG-
Funded MDG Projects and Programmes in Nigeria 2007.
[35] fehr.e, h.herz and t.wilkening (2013) “The Lure of Authority: Motivation and Incentive
E¤ects of Power,” American Economic Review 103: 1325-59.
[36] ferraz.c and f.finan (2008) “Exposing Corrupt Politicians: The E¤ects of Brazil’s Publicly
Released Audits on Electoral Outcomes,” Quarterly Journal of Economics 123: 703-45.
[37] flodgren.g, m.p.eccles, s.shepperd, a.scott, e.parmelli and f.r.beyer (2011) “An
Overview of Reviews Evaluating the E¤ectiveness of Financial Incentives in Changing Health-
care Professional Behaviours and Patient Outcomes,” Cochrane Database of Systematic Re-
views Issue 7, Art. No.: CD009255.
[38] francois.p and m.vlassopoulos (2008) “Pro-social Motivation and the Delivery of Social
Services,” CESifo Economic Studies 54: 1-33.
[39] fryer.r.g (2013) “Teacher Incentives and Student Achievement from New York Public
Schools,” Journal of Labor Economics 31: 373-407.
[40] gagliarducci.s and t.nannicini (2013) “Do Better Paid Politicians Perform Better? Dis-
entangling Incentives from Selection,” Journal of the European Economic Association 11:
369-98.
[41] gibbons.r and j.roberts (2013) The Handbook of Organizational Economics, Princeton:
Princeton University Press.
[42] glewwe.p, n.ilias and m.kremer (2010) “Teacher Incentives,” American Economic Jour-
nal: Applied Economics 2: 205-27.
[43] goldfinch.s, k.derouen and p.pospieszna (2012) “Flying Blind? Evidence for Good
Governance Public Management Reform Agendas, Implementation and Outcomes in Low
Income Countries,” Public Administration and Development 33: 50-61.
[44] hasnain.z, n.manning and j.h.pierskalla (2012) Performance-related Pay in the Public
Sector, World Bank Policy Research Working Paper 6043.
39
[45] holmstrom.b and p.milgrom (1991) “Multitask Principal-Agent Analyses: Incentive Con-
tracts, Asset Ownership, and Job Design”, Journal of Law, Economics and Organization 7:
24-52.
[46] ichniowski.c, k.shaw and g.prennushi (1993) “E¤ects of Human Resource Management
Practices,” American Economic Review 87: 291-313.
[47] kelman.s (1990) Procurement and Public Management: The Fear of Discretion and the
Quality of Public Performance, Washington DC: American Enterprise Initiative.
[48] martinez-bravo.m (2014) “The Role of Local O¢cials in New Democracies: Evidence from
Indonesia”, American Economic Review 104: 1244-87.
[49] mccormack.j, s.smith and c.propper (2013) Herding Cats? Management and University
Performance, CMPO Working Paper 13/308.
[50] milgrom.p.r (1988) “Employment Contracts, In‡uence Activities, and E¢cient Organiza-
tion Design”, Journal of Political Economy 96: 42–60.
[51] milgrom.p.r and j.roberts (1988) “An Economic Approach to In‡uence in Organiza-
tions”, American Journal of Sociology 94: S154-79.
[52] miller.g and k.s.babiarz (2013) Pay-For-Performance Incentives in Low- and Middle-
Income Country Health Programs, NBER WP 18932.
[53] muralidharan.k and v.sundararaman (2011) “Teacher Performance Pay: Experimental
Evidence from India,” Journal of Political Economy 119: 39-77.
[54] muralidharan.k (2012) Long-Term E¤ects of Teacher Performance Pay: Experimental
Evidence from India, mimeo UCSD.
[55] nkonjo-iweala.n and p.osafo-kwaako (2007) Nigeria’s Economic Reforms: Progress
and Challenges, Brookings Institute Global Working Papers Washington: Brookings Institute.
[56] olken.b (2007) “Monitoring Corruption: Evidence from a Field Experiment in Indonesia,”
Journal of Political Economy 115: 200-49.
[57] ogundiya.i.s (2011) “Anti-corruption Reforms in Nigeria: Challenges and Failures,” in
I.S.Ogundiya, S.Ilufoye, A.Olanrewaju Olutayo and J.Amzat (eds.) Assessment Of Demo-
cratic Trends In Nigeria, Delhi: Gyan Publishing House.
[58] papke.l.e and j.m.wooldridge (1996) “Econometric Methods for Fractional Response
Variables with an Application to 401(k) Plan Participation Rates,” Journal of Applied Econo-
metrics 11: 619-32.
40
[59] perry.j.l and l.r.wise (1990) “The Motivational Basis of Public Service,” Public Admin-
istration Review 50: 367-73.
[60] perry.j.l (1996) “Measuring Public Service Motivation: An Assessment of Construct Relia-
bility and Validity,” Journal of Public Administration Research and Theory 6: 5-22.
[61] perry.j.l, t.a.engers and s.y.jun (2009) “Back to the Future? Performance-related Pay,
Empirical Research, and the Perils of Persistence,” Public Administration Review 69: 39-51.
[62] prendergast.c (2002) “The Tenuous Trade-O¤ between Risk and Incentives”, Journal of
Political Economy 110: 1071-102.
[63] remington.k and j.pollack (2007) Tools for Complex Projects, Aldershot: Gower.
[64] rogger.d (2014) The Causes and Consequences of Political Interference in Bureaucratic
Implementation: Evidence from Nigeria, mimeo, UCL.
[65] rose-ackerman.s (1986) “Reforming Public Bureaucracy Through Economic Incentives?,”
Journal of Law, Economics and Organization 2: 131-61.
[66] scott.a, p.sivey, d.ait ouakrim, l.willenberg, l.naccarella, j.furler and
d.young (2011) “The E¤ect of Financial Incentives on the Quality of Health Care Provided
by Primary Care Physicians,” Cochrane Database of Systematic Reviews Issue 9. Art.No.:
CD008451.
[67] simon.w (1983) “Legality, Bureaucracy, and Class in the Welfare System,” Yale Law Journal
92: 1198-269.
[68] tullock.g (1965) The Politics of Bureaucracy, Washington: Public A¤airs Press.
[69] wilson.j (1989) Bureaucracy: What Government Agencies Do and Why They Do It, New
York: Basic Books.
41
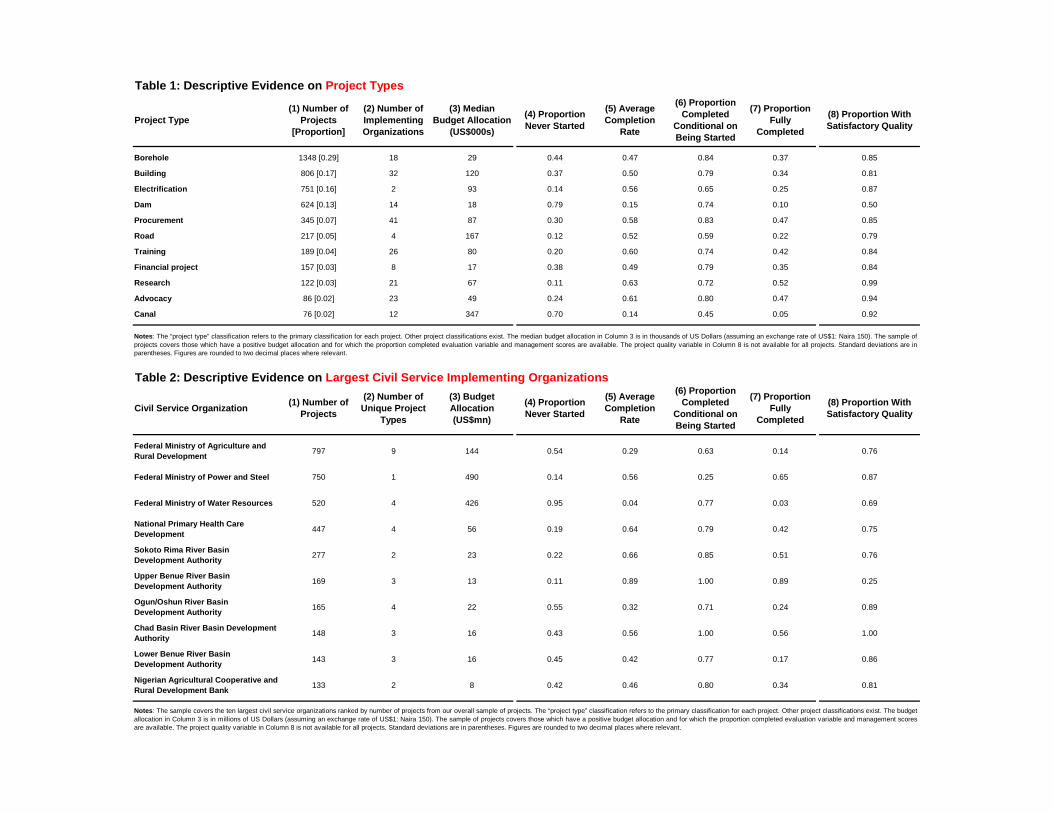
Table 1: Descriptive Evidence on Project Types
Project Type
(1) Number of
Projects
[Proportion]
(2) Number of
Implementing
Organizations
(3) Median
Budget Allocation
(US$000s)
(4) Proportion
Never Started
(5) Average
Completion
Rate
(6) Proportion
Completed
Conditional on
Being Started
(7) Proportion
Fully
Completed
(8) Proportion With
Satisfactory Quality
Borehole 1348 [0.29] 18 29 0.44 0.47 0.84 0.37 0.85
Building 806 [0.17] 32 120 0.37 0.50 0.79 0.34 0.81
Electrification 751 [0.16] 2 93 0.14 0.56 0.65 0.25 0.87
Dam 624 [0.13] 14 18 0.79 0.15 0.74 0.10 0.50
Procurement 345 [0.07] 41 87 0.30 0.58 0.83 0.47 0.85
Road 217 [0.05] 4 167 0.12 0.52 0.59 0.22 0.79
Training 189 [0.04] 26 80 0.20 0.60 0.74 0.42 0.84
Financial project 157 [0.03] 8 17 0.38 0.49 0.79 0.35 0.84
Research 122 [0.03] 21 67 0.11 0.63 0.72 0.52 0.99
Advocacy 86 [0.02] 23 49 0.24 0.61 0.80 0.47 0.94
Canal 76 [0.02] 12 347 0.70 0.14 0.45 0.05 0.92
Table 2: Descriptive Evidence on Largest Civil Service Implementing Organizations
Civil Service Organization(1) Number of
Projects
(2) Number of
Unique Project
Types
(3) Budget
Allocation
(US$mn)
(4) Proportion
Never Started
(5) Average
Completion
Rate
(6) Proportion
Completed
Conditional on
Being Started
(7) Proportion
Fully
Completed
(8) Proportion With
Satisfactory Quality
Federal Ministry of Agriculture and
Rural Development797 9 144 0.54 0.29 0.63 0.14 0.76
Federal Ministry of Power and Steel 750 1 490 0.14 0.56 0.25 0.65 0.87
Federal Ministry of Water Resources 520 4 426 0.95 0.04 0.77 0.03 0.69
National Primary Health Care
Development447 4 56 0.19 0.64 0.79 0.42 0.75
Sokoto Rima River Basin
Development Authority277 2 23 0.22 0.66 0.85 0.51 0.76
Upper Benue River Basin
Development Authority169 3 13 0.11 0.89 1.00 0.89 0.25
Ogun/Oshun River Basin
Development Authority165 4 22 0.55 0.32 0.71 0.24 0.89
Chad Basin River Basin Development
Authority148 3 16 0.43 0.56 1.00 0.56 1.00
Lower Benue River Basin
Development Authority143 3 16 0.45 0.42 0.77 0.17 0.86
Nigerian Agricultural Cooperative and
Rural Development Bank133 2 8 0.42 0.46 0.80 0.34 0.81
Notes: The “project type” classification refers to the primary classification for each project. Other project classifications exist. The median budget allocation in Column 3 is in thousands of US Dollars (assuming an exchange rate of US$1: Naira 150). The sample of
projects covers those which have a positive budget allocation and for which the proportion completed evaluation variable and management scores are available. The project quality variable in Column 8 is not available for all projects. Standard deviations are inparentheses. Figures are rounded to two decimal places where relevant.
Notes: The sample covers the ten largest civil service organizations ranked by number of projects from our overall sample of projects. The “project type” classification refers to the primary classification for each project. Other project classifications exist. The budget
allocation in Column 3 is in millions of US Dollars (assuming an exchange rate of US$1: Naira 150). The sample of projects covers those which have a positive budget allocation and for which the proportion completed evaluation variable and management scoresare available. The project quality variable in Column 8 is not available for all projects. Standard deviations are in parentheses. Figures are rounded to two decimal places where relevant.
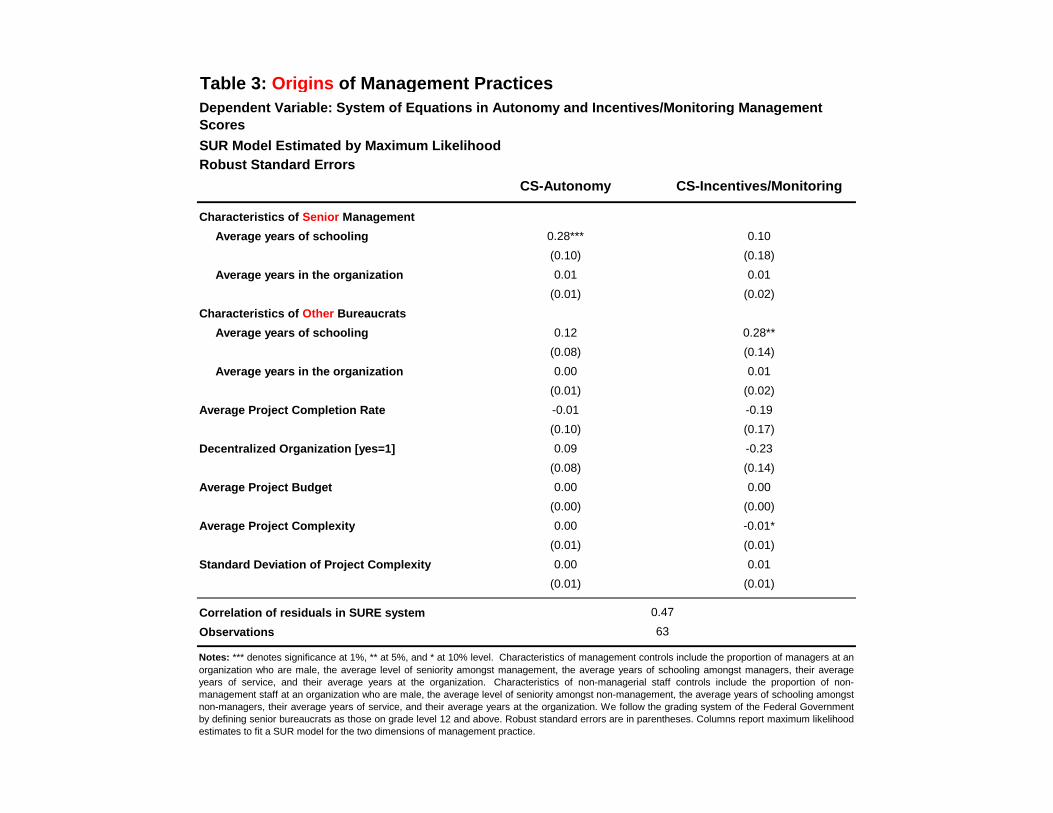
SUR Model Estimated by Maximum Likelihood
Robust Standard Errors
CS-Autonomy CS-Incentives/Monitoring
Characteristics of Senior Management
Average years of schooling 0.28*** 0.10
(0.10) (0.18)
Average years in the organization 0.01 0.01
(0.01) (0.02)
Characteristics of Other Bureaucrats
Average years of schooling 0.12 0.28**
(0.08) (0.14)
Average years in the organization 0.00 0.01
(0.01) (0.02)
Average Project Completion Rate -0.01 -0.19
(0.10) (0.17)
Decentralized Organization [yes=1] 0.09 -0.23
(0.08) (0.14)
Average Project Budget 0.00 0.00
(0.00) (0.00)
Average Project Complexity 0.00 -0.01*
(0.01) (0.01)
Standard Deviation of Project Complexity 0.00 0.01
(0.01) (0.01)
Correlation of residuals in SURE system
Observations
Table 3: Origins of Management Practices
Notes: *** denotes significance at 1%, ** at 5%, and * at 10% level. Characteristics of management controls include the proportion of managers at an
organization who are male, the average level of seniority amongst management, the average years of schooling amongst managers, their averageyears of service, and their average years at the organization. Characteristics of non-managerial staff controls include the proportion of non-management staff at an organization who are male, the average level of seniority amongst non-management, the average years of schooling amongstnon-managers, their average years of service, and their average years at the organization. We follow the grading system of the Federal Governmentby defining senior bureaucrats as those on grade level 12 and above. Robust standard errors are in parentheses. Columns report maximum likelihoodestimates to fit a SUR model for the two dimensions of management practice.
0.47
63
Dependent Variable: System of Equations in Autonomy and Incentives/Monitoring Management
Scores
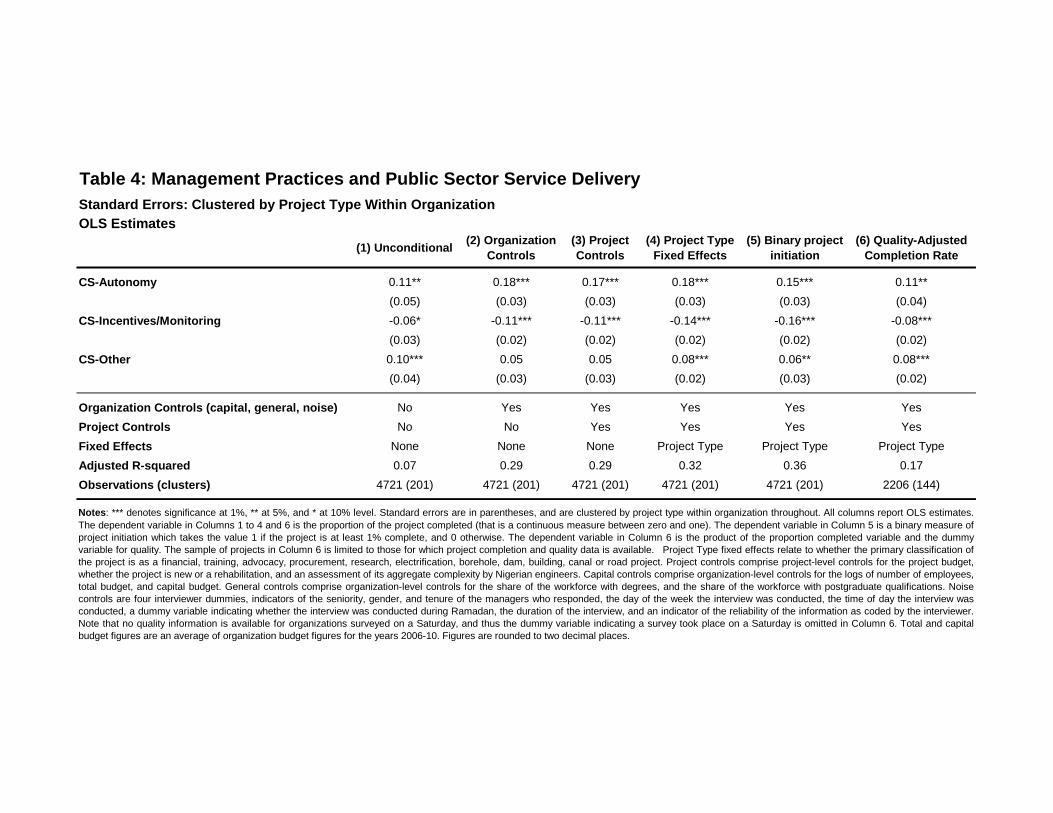
Table 4: Management Practices and Public Sector Service Delivery
Standard Errors: Clustered by Project Type Within Organization
OLS Estimates
(1) Unconditional(2) Organization
Controls
(3) Project
Controls
(4) Project Type
Fixed Effects
(5) Binary project
initiation
(6) Quality-Adjusted
Completion Rate
CS-Autonomy 0.11** 0.18*** 0.17*** 0.18*** 0.15*** 0.11**
(0.05) (0.03) (0.03) (0.03) (0.03) (0.04)
CS-Incentives/Monitoring -0.06* -0.11*** -0.11*** -0.14*** -0.16*** -0.08***
(0.03) (0.02) (0.02) (0.02) (0.02) (0.02)
CS-Other 0.10*** 0.05 0.05 0.08*** 0.06** 0.08***
(0.04) (0.03) (0.03) (0.02) (0.03) (0.02)
Organization Controls (capital, general, noise) No Yes Yes Yes Yes Yes
Project Controls No No Yes Yes Yes Yes
Fixed Effects None None None Project Type Project Type Project Type
Adjusted R-squared 0.07 0.29 0.29 0.32 0.36 0.17
Observations (clusters) 4721 (201) 4721 (201) 4721 (201) 4721 (201) 4721 (201) 2206 (144)
Notes: *** denotes significance at 1%, ** at 5%, and * at 10% level. Standard errors are in parentheses, and are clustered by project type within organization throughout. All columns report OLS estimates.
The dependent variable in Columns 1 to 4 and 6 is the proportion of the project completed (that is a continuous measure between zero and one). The dependent variable in Column 5 is a binary measure ofproject initiation which takes the value 1 if the project is at least 1% complete, and 0 otherwise. The dependent variable in Column 6 is the product of the proportion completed variable and the dummyvariable for quality. The sample of projects in Column 6 is limited to those for which project completion and quality data is available. Project Type fixed effects relate to whether the primary classification ofthe project is as a financial, training, advocacy, procurement, research, electrification, borehole, dam, building, canal or road project. Project controls comprise project-level controls for the project budget,whether the project is new or a rehabilitation, and an assessment of its aggregate complexity by Nigerian engineers. Capital controls comprise organization-level controls for the logs of number of employees,total budget, and capital budget. General controls comprise organization-level controls for the share of the workforce with degrees, and the share of the workforce with postgraduate qualifications. Noisecontrols are four interviewer dummies, indicators of the seniority, gender, and tenure of the managers who responded, the day of the week the interview was conducted, the time of day the interview wasconducted, a dummy variable indicating whether the interview was conducted during Ramadan, the duration of the interview, and an indicator of the reliability of the information as coded by the interviewer.Note that no quality information is available for organizations surveyed on a Saturday, and thus the dummy variable indicating a survey took place on a Saturday is omitted in Column 6. Total and capitalbudget figures are an average of organization budget figures for the years 2006-10. Figures are rounded to two decimal places.
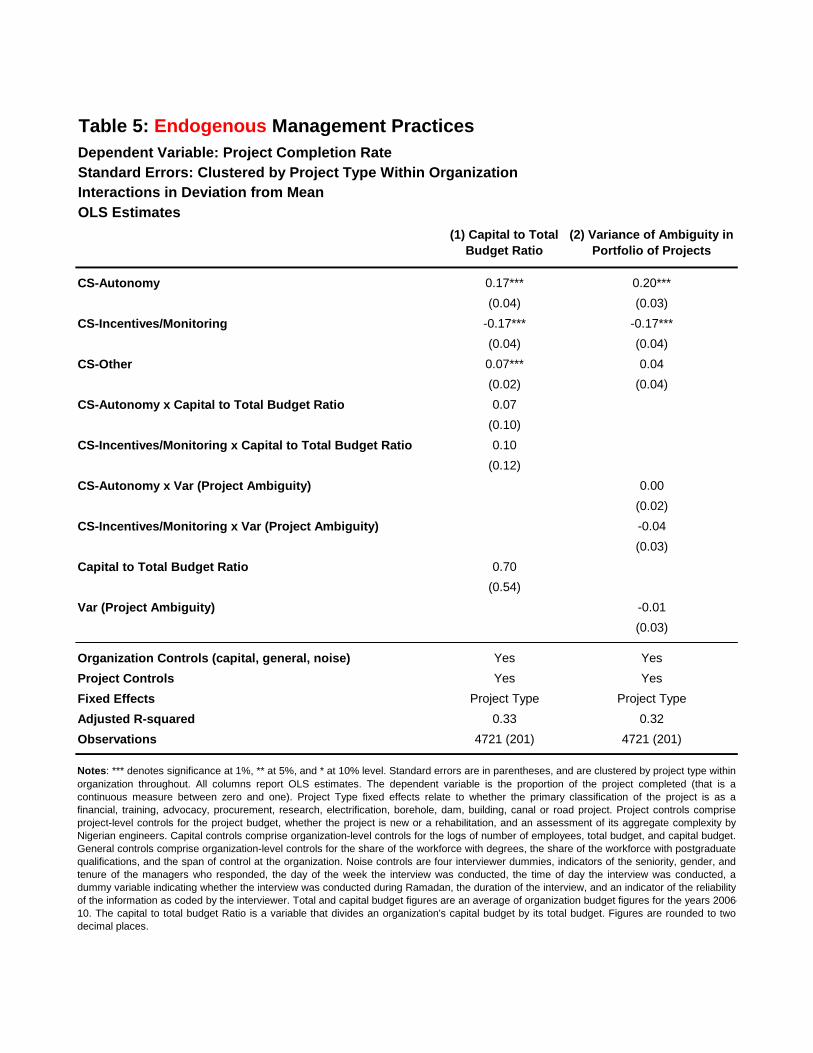
Dependent Variable: Project Completion Rate
Standard Errors: Clustered by Project Type Within Organization
Interactions in Deviation from Mean
OLS Estimates
(1) Capital to Total
Budget Ratio
(2) Variance of Ambiguity in
Portfolio of Projects
CS-Autonomy 0.17*** 0.20***
(0.04) (0.03)
CS-Incentives/Monitoring -0.17*** -0.17***
(0.04) (0.04)
CS-Other 0.07*** 0.04
(0.02) (0.04)
CS-Autonomy x Capital to Total Budget Ratio 0.07
(0.10)
CS-Incentives/Monitoring x Capital to Total Budget Ratio 0.10
(0.12)
CS-Autonomy x Var (Project Ambiguity) 0.00
(0.02)
CS-Incentives/Monitoring x Var (Project Ambiguity) -0.04
(0.03)
Capital to Total Budget Ratio 0.70
(0.54)
Var (Project Ambiguity) -0.01
(0.03)
Organization Controls (capital, general, noise) Yes Yes
Project Controls Yes Yes
Fixed Effects Project Type Project Type
Adjusted R-squared 0.33 0.32
Observations 4721 (201) 4721 (201)
Table 5: Endogenous Management Practices
Notes: *** denotes significance at 1%, ** at 5%, and * at 10% level. Standard errors are in parentheses, and are clustered by project type within
organization throughout. All columns report OLS estimates. The dependent variable is the proportion of the project completed (that is acontinuous measure between zero and one). Project Type fixed effects relate to whether the primary classification of the project is as afinancial, training, advocacy, procurement, research, electrification, borehole, dam, building, canal or road project. Project controls compriseproject-level controls for the project budget, whether the project is new or a rehabilitation, and an assessment of its aggregate complexity byNigerian engineers. Capital controls comprise organization-level controls for the logs of number of employees, total budget, and capital budget.General controls comprise organization-level controls for the share of the workforce with degrees, the share of the workforce with postgraduatequalifications, and the span of control at the organization. Noise controls are four interviewer dummies, indicators of the seniority, gender, andtenure of the managers who responded, the day of the week the interview was conducted, the time of day the interview was conducted, adummy variable indicating whether the interview was conducted during Ramadan, the duration of the interview, and an indicator of the reliabilityof the information as coded by the interviewer. Total and capital budget figures are an average of organization budget figures for the years 2006-10. The capital to total budget Ratio is a variable that divides an organization's capital budget by its total budget. Figures are rounded to twodecimal places.
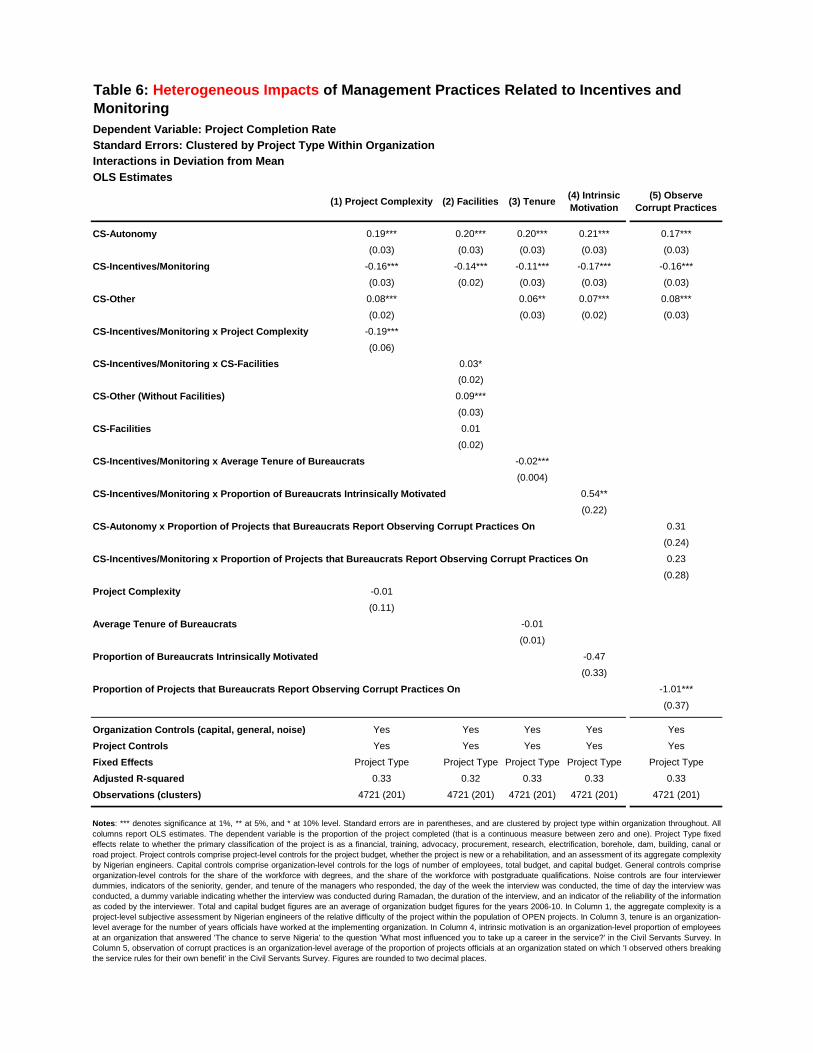
Dependent Variable: Project Completion Rate
Standard Errors: Clustered by Project Type Within Organization
Interactions in Deviation from Mean
OLS Estimates
(1) Project Complexity (2) Facilities (3) Tenure(4) Intrinsic
Motivation
(5) Observe
Corrupt Practices
CS-Autonomy 0.19*** 0.20*** 0.20*** 0.21*** 0.17***
(0.03) (0.03) (0.03) (0.03) (0.03)
CS-Incentives/Monitoring -0.16*** -0.14*** -0.11*** -0.17*** -0.16***
(0.03) (0.02) (0.03) (0.03) (0.03)
CS-Other 0.08*** 0.06** 0.07*** 0.08***
(0.02) (0.03) (0.02) (0.03)
CS-Incentives/Monitoring x Project Complexity -0.19***
(0.06)
CS-Incentives/Monitoring x CS-Facilities 0.03*
(0.02)
CS-Other (Without Facilities) 0.09***
(0.03)
CS-Facilities 0.01
(0.02)
CS-Incentives/Monitoring x Average Tenure of Bureaucrats -0.02***
(0.004)
CS-Incentives/Monitoring x Proportion of Bureaucrats Intrinsically Motivated 0.54**
(0.22)
CS-Autonomy x Proportion of Projects that Bureaucrats Report Observing Corrupt Practices On 0.31
(0.24)
CS-Incentives/Monitoring x Proportion of Projects that Bureaucrats Report Observing Corrupt Practices On 0.23
(0.28)
Project Complexity -0.01
(0.11)
Average Tenure of Bureaucrats -0.01
(0.01)
Proportion of Bureaucrats Intrinsically Motivated -0.47
(0.33)
Proportion of Projects that Bureaucrats Report Observing Corrupt Practices On -1.01***
(0.37)
Organization Controls (capital, general, noise) Yes Yes Yes Yes Yes
Project Controls Yes Yes Yes Yes Yes
Fixed Effects Project Type Project Type Project Type Project Type Project Type
Adjusted R-squared 0.33 0.32 0.33 0.33 0.33
Observations (clusters) 4721 (201) 4721 (201) 4721 (201) 4721 (201) 4721 (201)
Notes: *** denotes significance at 1%, ** at 5%, and * at 10% level. Standard errors are in parentheses, and are clustered by project type within organization throughout. All
columns report OLS estimates. The dependent variable is the proportion of the project completed (that is a continuous measure between zero and one). Project Type fixed
effects relate to whether the primary classification of the project is as a financial, training, advocacy, procurement, research, electrification, borehole, dam, building, canal or
road project. Project controls comprise project-level controls for the project budget, whether the project is new or a rehabilitation, and an assessment of its aggregate complexity
by Nigerian engineers. Capital controls comprise organization-level controls for the logs of number of employees, total budget, and capital budget. General controls comprise
organization-level controls for the share of the workforce with degrees, and the share of the workforce with postgraduate qualifications. Noise controls are four interviewer
dummies, indicators of the seniority, gender, and tenure of the managers who responded, the day of the week the interview was conducted, the time of day the interview was
conducted, a dummy variable indicating whether the interview was conducted during Ramadan, the duration of the interview, and an indicator of the reliability of the information
as coded by the interviewer. Total and capital budget figures are an average of organization budget figures for the years 2006-10. In Column 1, the aggregate complexity is a
project-level subjective assessment by Nigerian engineers of the relative difficulty of the project within the population of OPEN projects. In Column 3, tenure is an organization-
level average for the number of years officials have worked at the implementing organization. In Column 4, intrinsic motivation is an organization-level proportion of employees
at an organization that answered 'The chance to serve Nigeria' to the question 'What most influenced you to take up a career in the service?' in the Civil Servants Survey. In
Column 5, observation of corrupt practices is an organization-level average of the proportion of projects officials at an organization stated on which 'I observed others breaking
the service rules for their own benefit' in the Civil Servants Survey. Figures are rounded to two decimal places.
Table 6: Heterogeneous Impacts of Management Practices Related to Incentives and
Monitoring
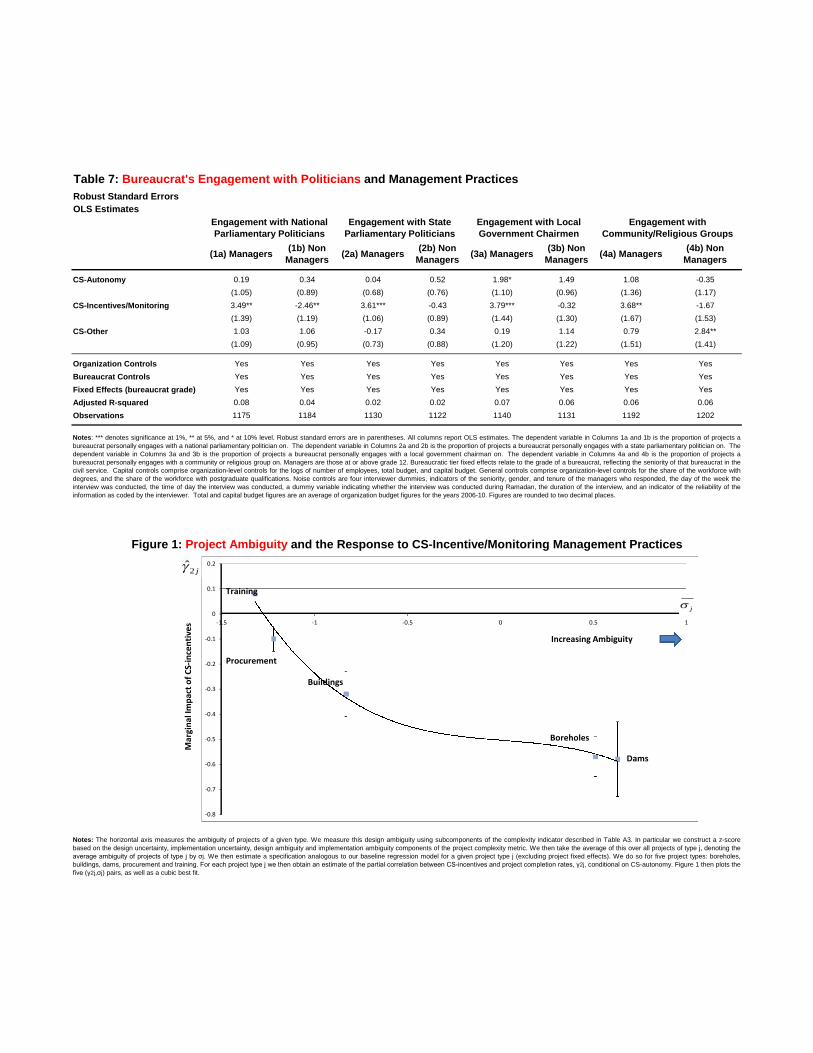
Table 7: Bureaucrat's Engagement with Politicians and Management Practices
Robust Standard Errors
OLS Estimates
(1a) Managers(1b) Non
Managers(2a) Managers
(2b) NonManagers
(3a) Managers(3b) Non
Managers(4a) Managers
(4b) NonManagers
CS-Autonomy 0.19 0.34 0.04 0.52 1.98* 1.49 1.08 -0.35
(1.05) (0.89) (0.68) (0.76) (1.10) (0.96) (1.36) (1.17)
CS-Incentives/Monitoring 3.49** -2.46** 3.61*** -0.43 3.79*** -0.32 3.68** -1.67
(1.39) (1.19) (1.06) (0.89) (1.44) (1.30) (1.67) (1.53)
CS-Other 1.03 1.06 -0.17 0.34 0.19 1.14 0.79 2.84**
(1.09) (0.95) (0.73) (0.88) (1.20) (1.22) (1.51) (1.41)
Organization Controls Yes Yes Yes Yes Yes Yes Yes Yes
Bureaucrat Controls Yes Yes Yes Yes Yes Yes Yes Yes
Fixed Effects (bureaucrat grade) Yes Yes Yes Yes Yes Yes Yes Yes
Adjusted R-squared 0.08 0.04 0.02 0.02 0.07 0.06 0.06 0.06
Observations 1175 1184 1130 1122 1140 1131 1192 1202
Figure 1: Project Ambiguity and the Response to CS-Incentive/Monitoring Management Practices
Notes: The horizontal axis measures the ambiguity of projects of a given type. We measure this design ambiguity using subcomponents of the complexity indicator described in Table A3. In particular we construct a z-score
based on the design uncertainty, implementation uncertainty, design ambiguity and implementation ambiguity components of the project complexity metric. We then take the average of this over all projects of type j, denoting theaverage ambiguity of projects of type j by σj. We then estimate a specification analogous to our baseline regression model for a given project type j (excluding project fixed effects). We do so for five project types: boreholes,buildings, dams, procurement and training. For each project type j we then obtain an estimate of the partial correlation between CS-incentives and project completion rates, γ2j, conditional on CS-autonomy. Figure 1 then plots thefive (γ2j,σj) pairs, as well as a cubic best fit.
Engagement with NationalParliamentary Politicians
Engagement with StateParliamentary Politicians
Engagement with LocalGovernment Chairmen
Engagement withCommunity/Religious Groups
Notes: *** denotes significance at 1%, ** at 5%, and * at 10% level. Robust standard errors are in parentheses. All columns report OLS estimates. The dependent variable in Columns 1a and 1b is the proportion of projects a
bureaucrat personally engages with a national parliamentary politician on. The dependent variable in Columns 2a and 2b is the proportion of projects a bureaucrat personally engages with a state parliamentary politician on. Thedependent variable in Columns 3a and 3b is the proportion of projects a bureaucrat personally engages with a local government chairman on. The dependent variable in Columns 4a and 4b is the proportion of projects abureaucrat personally engages with a community or religious group on. Managers are those at or above grade 12. Bureaucratic tier fixed effects relate to the grade of a bureaucrat, reflecting the seniority of that bureaucrat in thecivil service. Capital controls comprise organization-level controls for the logs of number of employees, total budget, and capital budget. General controls comprise organization-level controls for the share of the workforce withdegrees, and the share of the workforce with postgraduate qualifications. Noise controls are four interviewer dummies, indicators of the seniority, gender, and tenure of the managers who responded, the day of the week theinterview was conducted, the time of day the interview was conducted, a dummy variable indicating whether the interview was conducted during Ramadan, the duration of the interview, and an indicator of the reliability of theinformation as coded by the interviewer. Total and capital budget figures are an average of organization budget figures for the years 2006-10. Figures are rounded to two decimal places.
-0.8
-0.7
-0.6
-0.5
-0.4
-0.3
-0.2
-0.1
0
0.1
0.2
-1.5 -1 -0.5 0 0.5 1
Boreholes
Buildings
Dams
Procurement
Training
Increasing Ambiguity
Mar
gin
alIm
pac
to
fC
S-in
cen
tive
s
j
j2̂
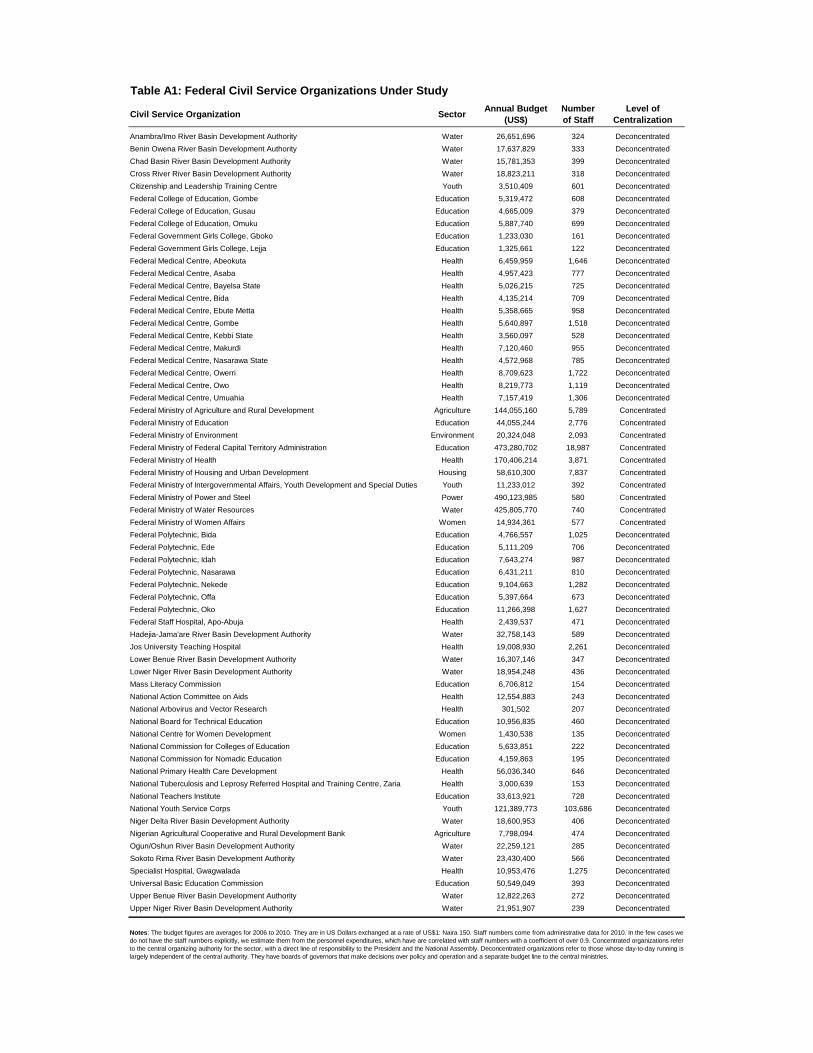
Table A1: Federal Civil Service Organizations Under Study
Civil Service Organization SectorAnnual Budget
(US$)
Number
of Staff
Level of
Centralization
Anambra/Imo River Basin Development Authority Water 26,651,696 324 Deconcentrated
Benin Owena River Basin Development Authority Water 17,637,829 333 Deconcentrated
Chad Basin River Basin Development Authority Water 15,781,353 399 Deconcentrated
Cross River River Basin Development Authority Water 18,823,211 318 Deconcentrated
Citizenship and Leadership Training Centre Youth 3,510,409 601 Deconcentrated
Federal College of Education, Gombe Education 5,319,472 608 Deconcentrated
Federal College of Education, Gusau Education 4,665,009 379 Deconcentrated
Federal College of Education, Omuku Education 5,887,740 699 Deconcentrated
Federal Government Girls College, Gboko Education 1,233,030 161 Deconcentrated
Federal Government Girls College, Lejja Education 1,325,661 122 Deconcentrated
Federal Medical Centre, Abeokuta Health 6,459,959 1,646 Deconcentrated
Federal Medical Centre, Asaba Health 4,957,423 777 Deconcentrated
Federal Medical Centre, Bayelsa State Health 5,026,215 725 Deconcentrated
Federal Medical Centre, Bida Health 4,135,214 709 Deconcentrated
Federal Medical Centre, Ebute Metta Health 5,358,665 958 Deconcentrated
Federal Medical Centre, Gombe Health 5,640,897 1,518 Deconcentrated
Federal Medical Centre, Kebbi State Health 3,560,097 528 Deconcentrated
Federal Medical Centre, Makurdi Health 7,120,460 955 Deconcentrated
Federal Medical Centre, Nasarawa State Health 4,572,968 785 Deconcentrated
Federal Medical Centre, Owerri Health 8,709,623 1,722 Deconcentrated
Federal Medical Centre, Owo Health 8,219,773 1,119 Deconcentrated
Federal Medical Centre, Umuahia Health 7,157,419 1,306 Deconcentrated
Federal Ministry of Agriculture and Rural Development Agriculture 144,055,160 5,789 Concentrated
Federal Ministry of Education Education 44,055,244 2,776 Concentrated
Federal Ministry of Environment Environment 20,324,048 2,093 Concentrated
Federal Ministry of Federal Capital Territory Administration Education 473,280,702 18,987 Concentrated
Federal Ministry of Health Health 170,406,214 3,871 Concentrated
Federal Ministry of Housing and Urban Development Housing 58,610,300 7,837 Concentrated
Federal Ministry of Intergovernmental Affairs, Youth Development and Special Duties Youth 11,233,012 392 Concentrated
Federal Ministry of Power and Steel Power 490,123,985 580 Concentrated
Federal Ministry of Water Resources Water 425,805,770 740 Concentrated
Federal Ministry of Women Affairs Women 14,934,361 577 Concentrated
Federal Polytechnic, Bida Education 4,766,557 1,025 Deconcentrated
Federal Polytechnic, Ede Education 5,111,209 706 Deconcentrated
Federal Polytechnic, Idah Education 7,643,274 987 Deconcentrated
Federal Polytechnic, Nasarawa Education 6,431,211 810 Deconcentrated
Federal Polytechnic, Nekede Education 9,104,663 1,282 Deconcentrated
Federal Polytechnic, Offa Education 5,397,664 673 Deconcentrated
Federal Polytechnic, Oko Education 11,266,398 1,627 Deconcentrated
Federal Staff Hospital, Apo-Abuja Health 2,439,537 471 Deconcentrated
Hadejia-Jama'are River Basin Development Authority Water 32,758,143 589 Deconcentrated
Jos University Teaching Hospital Health 19,008,930 2,261 Deconcentrated
Lower Benue River Basin Development Authority Water 16,307,146 347 Deconcentrated
Lower Niger River Basin Development Authority Water 18,954,248 436 Deconcentrated
Mass Literacy Commission Education 6,706,812 154 Deconcentrated
National Action Committee on Aids Health 12,554,883 243 Deconcentrated
National Arbovirus and Vector Research Health 301,502 207 Deconcentrated
National Board for Technical Education Education 10,956,835 460 Deconcentrated
National Centre for Women Development Women 1,430,538 135 Deconcentrated
National Commission for Colleges of Education Education 5,633,851 222 Deconcentrated
National Commission for Nomadic Education Education 4,159,863 195 Deconcentrated
National Primary Health Care Development Health 56,036,340 646 Deconcentrated
National Tuberculosis and Leprosy Referred Hospital and Training Centre, Zaria Health 3,000,639 153 Deconcentrated
National Teachers Institute Education 33,613,921 728 Deconcentrated
National Youth Service Corps Youth 121,389,773 103,686 Deconcentrated
Niger Delta River Basin Development Authority Water 18,600,953 406 Deconcentrated
Nigerian Agricultural Cooperative and Rural Development Bank Agriculture 7,798,094 474 Deconcentrated
Ogun/Oshun River Basin Development Authority Water 22,259,121 285 Deconcentrated
Sokoto Rima River Basin Development Authority Water 23,430,400 566 Deconcentrated
Specialist Hospital, Gwagwalada Health 10,953,476 1,275 Deconcentrated
Universal Basic Education Commission Education 50,549,049 393 Deconcentrated
Upper Benue River Basin Development Authority Water 12,822,263 272 Deconcentrated
Upper Niger River Basin Development Authority Water 21,951,907 239 Deconcentrated
Notes: The budget figures are averages for 2006 to 2010. They are in US Dollars exchanged at a rate of US$1: Naira 150. Staff numbers come from administrative data for 2010. In the few cases wedo not have the staff numbers explicitly, we estimate them from the personnel expenditures, which have are correlated with staff numbers with a coefficient of over 0.9. Concentrated organizations referto the central organizing authority for the sector, with a direct line of responsibility to the President and the National Assembly. Deconcentrated organizations refer to those whose day-to-day running islargely independent of the central authority. They have boards of governors that make decisions over policy and operation and a separate budget line to the central ministries.
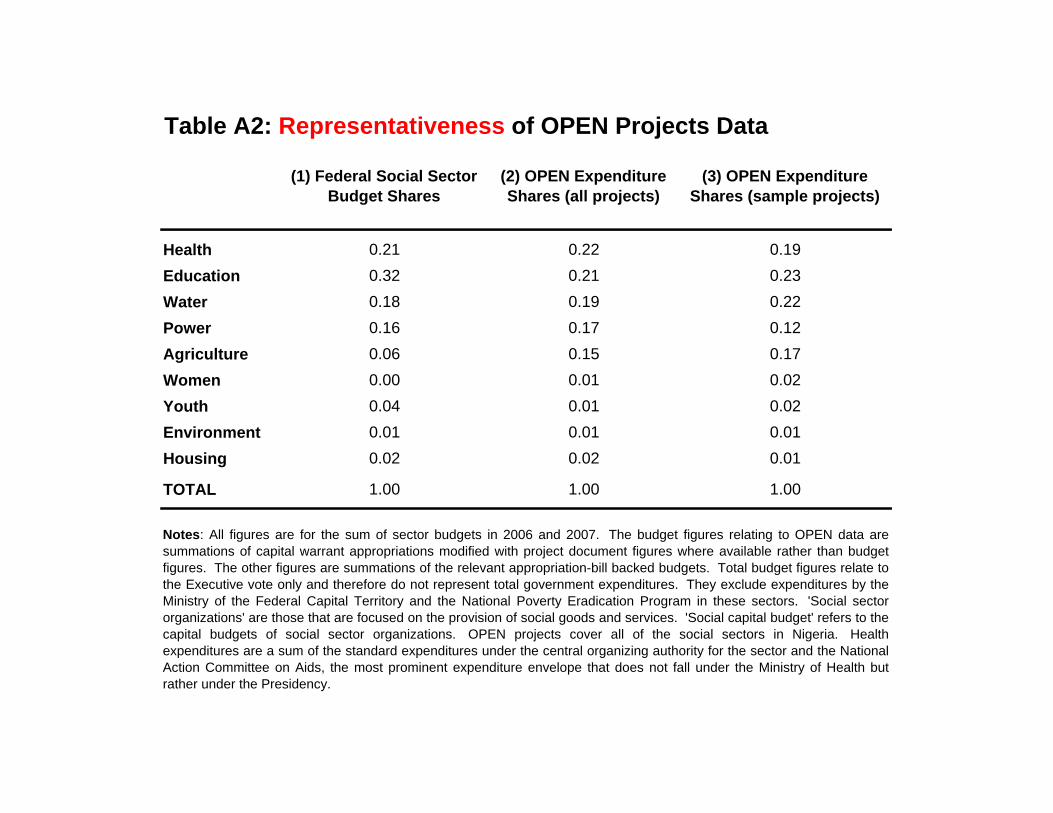
Table A2: Representativeness of OPEN Projects Data
(1) Federal Social Sector
Budget Shares
(2) OPEN Expenditure
Shares (all projects)
(3) OPEN Expenditure
Shares (sample projects)
Health 0.21 0.22 0.19
Education 0.32 0.21 0.23
Water 0.18 0.19 0.22
Power 0.16 0.17 0.12
Agriculture 0.06 0.15 0.17
Women 0.00 0.01 0.02
Youth 0.04 0.01 0.02
Environment 0.01 0.01 0.01
Housing 0.02 0.02 0.01
TOTAL 1.00 1.00 1.00
Notes: All figures are for the sum of sector budgets in 2006 and 2007. The budget figures relating to OPEN data aresummations of capital warrant appropriations modified with project document figures where available rather than budgetfigures. The other figures are summations of the relevant appropriation-bill backed budgets. Total budget figures relate tothe Executive vote only and therefore do not represent total government expenditures. They exclude expenditures by theMinistry of the Federal Capital Territory and the National Poverty Eradication Program in these sectors. 'Social sectororganizations' are those that are focused on the provision of social goods and services. 'Social capital budget' refers to thecapital budgets of social sector organizations. OPEN projects cover all of the social sectors in Nigeria. Healthexpenditures are a sum of the standard expenditures under the central organizing authority for the sector and the NationalAction Committee on Aids, the most prominent expenditure envelope that does not fall under the Ministry of Health butrather under the Presidency.
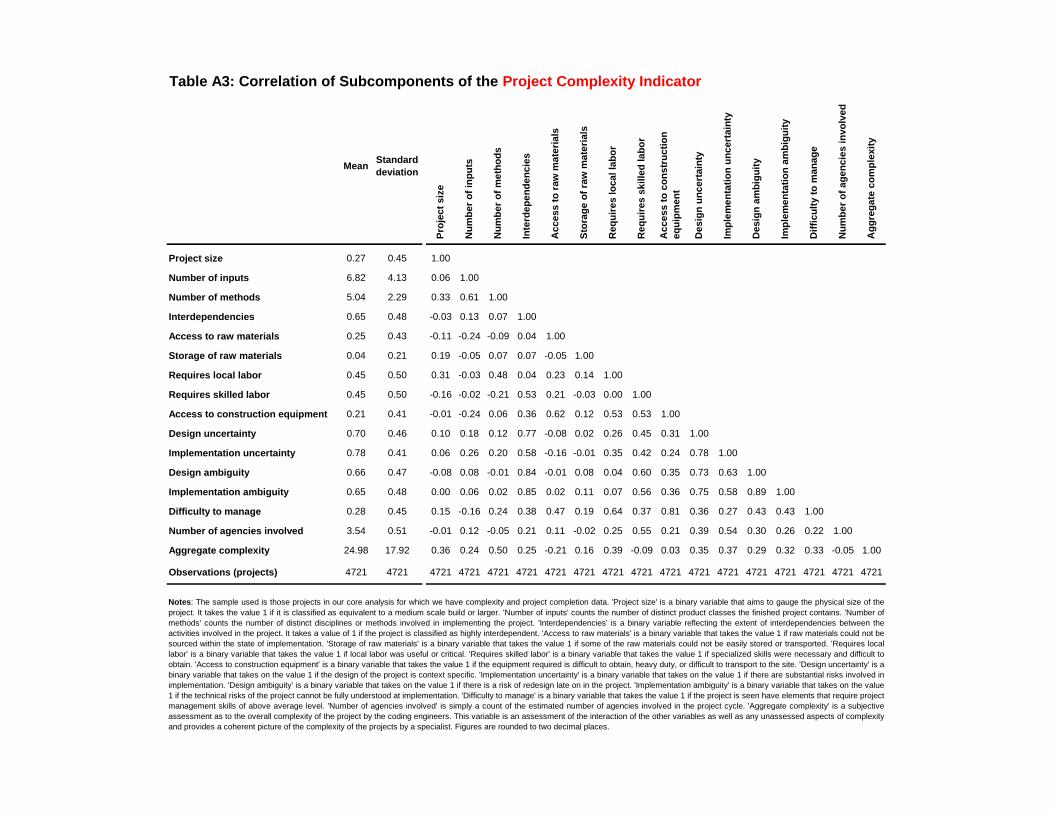
Table A3: Correlation of Subcomponents of the Project Complexity Indicator
MeanStandard
deviation
Pro
jec
ts
ize
Nu
mb
er
of
inp
uts
Nu
mb
er
of
me
tho
ds
Inte
rde
pe
nd
en
cie
s
Ac
ce
ss
tora
wm
ate
ria
ls
Sto
rag
eo
fra
wm
ate
ria
ls
Re
qu
ire
slo
ca
lla
bo
r
Re
qu
ire
ss
kil
led
lab
or
Ac
ce
ss
toc
on
str
uc
tio
n
eq
uip
me
nt
De
sig
nu
nc
ert
ain
ty
Imp
lem
en
tati
on
un
ce
rta
inty
De
sig
na
mb
igu
ity
Imp
lem
en
tati
on
am
big
uit
y
Dif
fic
ult
yto
ma
na
ge
Nu
mb
er
of
ag
en
cie
sin
vo
lve
d
Ag
gre
ga
tec
om
ple
xit
y
Project size 0.27 0.45 1.00
Number of inputs 6.82 4.13 0.06 1.00
Number of methods 5.04 2.29 0.33 0.61 1.00
Interdependencies 0.65 0.48 -0.03 0.13 0.07 1.00
Access to raw materials 0.25 0.43 -0.11 -0.24 -0.09 0.04 1.00
Storage of raw materials 0.04 0.21 0.19 -0.05 0.07 0.07 -0.05 1.00
Requires local labor 0.45 0.50 0.31 -0.03 0.48 0.04 0.23 0.14 1.00
Requires skilled labor 0.45 0.50 -0.16 -0.02 -0.21 0.53 0.21 -0.03 0.00 1.00
Access to construction equipment 0.21 0.41 -0.01 -0.24 0.06 0.36 0.62 0.12 0.53 0.53 1.00
Design uncertainty 0.70 0.46 0.10 0.18 0.12 0.77 -0.08 0.02 0.26 0.45 0.31 1.00
Implementation uncertainty 0.78 0.41 0.06 0.26 0.20 0.58 -0.16 -0.01 0.35 0.42 0.24 0.78 1.00
Design ambiguity 0.66 0.47 -0.08 0.08 -0.01 0.84 -0.01 0.08 0.04 0.60 0.35 0.73 0.63 1.00
Implementation ambiguity 0.65 0.48 0.00 0.06 0.02 0.85 0.02 0.11 0.07 0.56 0.36 0.75 0.58 0.89 1.00
Difficulty to manage 0.28 0.45 0.15 -0.16 0.24 0.38 0.47 0.19 0.64 0.37 0.81 0.36 0.27 0.43 0.43 1.00
Number of agencies involved 3.54 0.51 -0.01 0.12 -0.05 0.21 0.11 -0.02 0.25 0.55 0.21 0.39 0.54 0.30 0.26 0.22 1.00
Aggregate complexity 24.98 17.92 0.36 0.24 0.50 0.25 -0.21 0.16 0.39 -0.09 0.03 0.35 0.37 0.29 0.32 0.33 -0.05 1.00
Observations (projects) 4721 4721 4721 4721 4721 4721 4721 4721 4721 4721 4721 4721 4721 4721 4721 4721 4721 4721
Notes: The sample used is those projects in our core analysis for which we have complexity and project completion data. 'Project size' is a binary variable that aims to gauge the physical size of the
project. It takes the value 1 if it is classified as equivalent to a medium scale build or larger. 'Number of inputs' counts the number of distinct product classes the finished project contains. 'Number of
methods' counts the number of distinct disciplines or methods involved in implementing the project. 'Interdependencies' is a binary variable reflecting the extent of interdependencies between the
activities involved in the project. It takes a value of 1 if the project is classified as highly interdependent. 'Access to raw materials' is a binary variable that takes the value 1 if raw materials could not be
sourced within the state of implementation. 'Storage of raw materials' is a binary variable that takes the value 1 if some of the raw materials could not be easily stored or transported. 'Requires local
labor' is a binary variable that takes the value 1 if local labor was useful or critical. 'Requires skilled labor' is a binary variable that takes the value 1 if specialized skills were necessary and difficult to
obtain. 'Access to construction equipment' is a binary variable that takes the value 1 if the equipment required is difficult to obtain, heavy duty, or difficult to transport to the site. 'Design uncertainty' is a
binary variable that takes on the value 1 if the design of the project is context specific. 'Implementation uncertainty' is a binary variable that takes on the value 1 if there are substantial risks involved in
implementation. 'Design ambiguity' is a binary variable that takes on the value 1 if there is a risk of redesign late on in the project. 'Implementation ambiguity' is a binary variable that takes on the value
1 if the technical risks of the project cannot be fully understood at implementation. 'Difficulty to manage' is a binary variable that takes the value 1 if the project is seen have elements that require project
management skills of above average level. 'Number of agencies involved' is simply a count of the estimated number of agencies involved in the project cycle. 'Aggregate complexity' is a subjective
assessment as to the overall complexity of the project by the coding engineers. This variable is an assessment of the interaction of the other variables as well as any unassessed aspects of complexity
and provides a coherent picture of the complexity of the projects by a specialist. Figures are rounded to two decimal places.
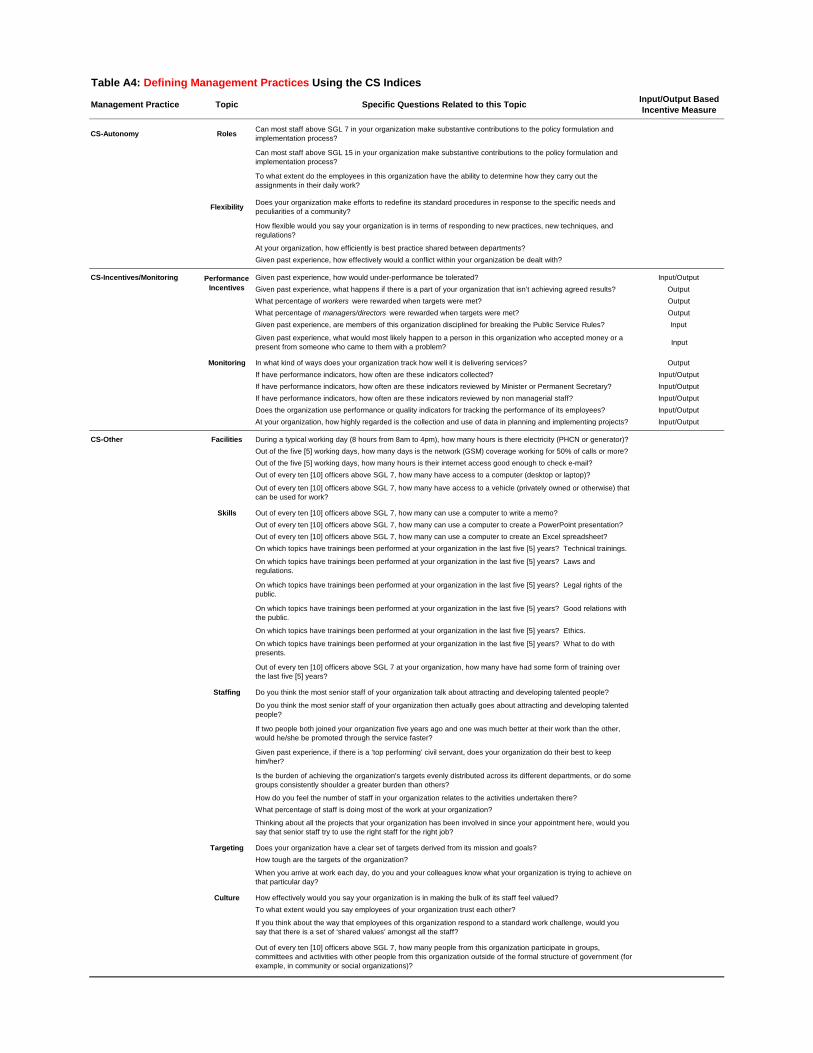
Table A4: Defining Management Practices Using the CS Indices
Management Practice Topic Specific Questions Related to this TopicInput/Output Based
Incentive Measure
CS-Autonomy RolesCan most staff above SGL 7 in your organization make substantive contributions to the policy formulation andimplementation process?
Can most staff above SGL 15 in your organization make substantive contributions to the policy formulation andimplementation process?
To what extent do the employees in this organization have the ability to determine how they carry out theassignments in their daily work?
FlexibilityDoes your organization make efforts to redefine its standard procedures in response to the specific needs andpeculiarities of a community?
How flexible would you say your organization is in terms of responding to new practices, new techniques, andregulations?
At your organization, how efficiently is best practice shared between departments?
Given past experience, how effectively would a conflict within your organization be dealt with?
CS-Incentives/Monitoring Given past experience, how would under-performance be tolerated? Input/Output
Given past experience, what happens if there is a part of your organization that isn’t achieving agreed results? Output
What percentage of workers were rewarded when targets were met? Output
What percentage of managers/directors were rewarded when targets were met? Output
Given past experience, are members of this organization disciplined for breaking the Public Service Rules? Input
Given past experience, what would most likely happen to a person in this organization who accepted money or apresent from someone who came to them with a problem?
Input
Monitoring In what kind of ways does your organization track how well it is delivering services? Output
If have performance indicators, how often are these indicators collected? Input/Output
If have performance indicators, how often are these indicators reviewed by Minister or Permanent Secretary? Input/Output
If have performance indicators, how often are these indicators reviewed by non managerial staff? Input/Output
Does the organization use performance or quality indicators for tracking the performance of its employees? Input/Output
At your organization, how highly regarded is the collection and use of data in planning and implementing projects? Input/Output
CS-Other Facilities During a typical working day (8 hours from 8am to 4pm), how many hours is there electricity (PHCN or generator)?
Out of the five [5] working days, how many days is the network (GSM) coverage working for 50% of calls or more?
Out of the five [5] working days, how many hours is their internet access good enough to check e-mail?
Out of every ten [10] officers above SGL 7, how many have access to a computer (desktop or laptop)?
Out of every ten [10] officers above SGL 7, how many have access to a vehicle (privately owned or otherwise) thatcan be used for work?
Skills Out of every ten [10] officers above SGL 7, how many can use a computer to write a memo?
Out of every ten [10] officers above SGL 7, how many can use a computer to create a PowerPoint presentation?
Out of every ten [10] officers above SGL 7, how many can use a computer to create an Excel spreadsheet?
On which topics have trainings been performed at your organization in the last five [5] years? Technical trainings.
On which topics have trainings been performed at your organization in the last five [5] years? Laws andregulations.
On which topics have trainings been performed at your organization in the last five [5] years? Legal rights of thepublic.
On which topics have trainings been performed at your organization in the last five [5] years? Good relations withthe public.
On which topics have trainings been performed at your organization in the last five [5] years? Ethics.
On which topics have trainings been performed at your organization in the last five [5] years? What to do withpresents.
Out of every ten [10] officers above SGL 7 at your organization, how many have had some form of training overthe last five [5] years?
Staffing Do you think the most senior staff of your organization talk about attracting and developing talented people?
Do you think the most senior staff of your organization then actually goes about attracting and developing talentedpeople?
If two people both joined your organization five years ago and one was much better at their work than the other,would he/she be promoted through the service faster?
Given past experience, if there is a ‘top performing’ civil servant, does your organization do their best to keephim/her?
Is the burden of achieving the organization's targets evenly distributed across its different departments, or do somegroups consistently shoulder a greater burden than others?
How do you feel the number of staff in your organization relates to the activities undertaken there?
What percentage of staff is doing most of the work at your organization?
Thinking about all the projects that your organization has been involved in since your appointment here, would yousay that senior staff try to use the right staff for the right job?
Targeting Does your organization have a clear set of targets derived from its mission and goals?
How tough are the targets of the organization?
When you arrive at work each day, do you and your colleagues know what your organization is trying to achieve onthat particular day?
Culture How effectively would you say your organization is in making the bulk of its staff feel valued?
To what extent would you say employees of your organization trust each other?
If you think about the way that employees of this organization respond to a standard work challenge, would yousay that there is a set of ‘shared values’ amongst all the staff?
Out of every ten [10] officers above SGL 7, how many people from this organization participate in groups,committees and activities with other people from this organization outside of the formal structure of government (forexample, in community or social organizations)?
Performance
Incentives
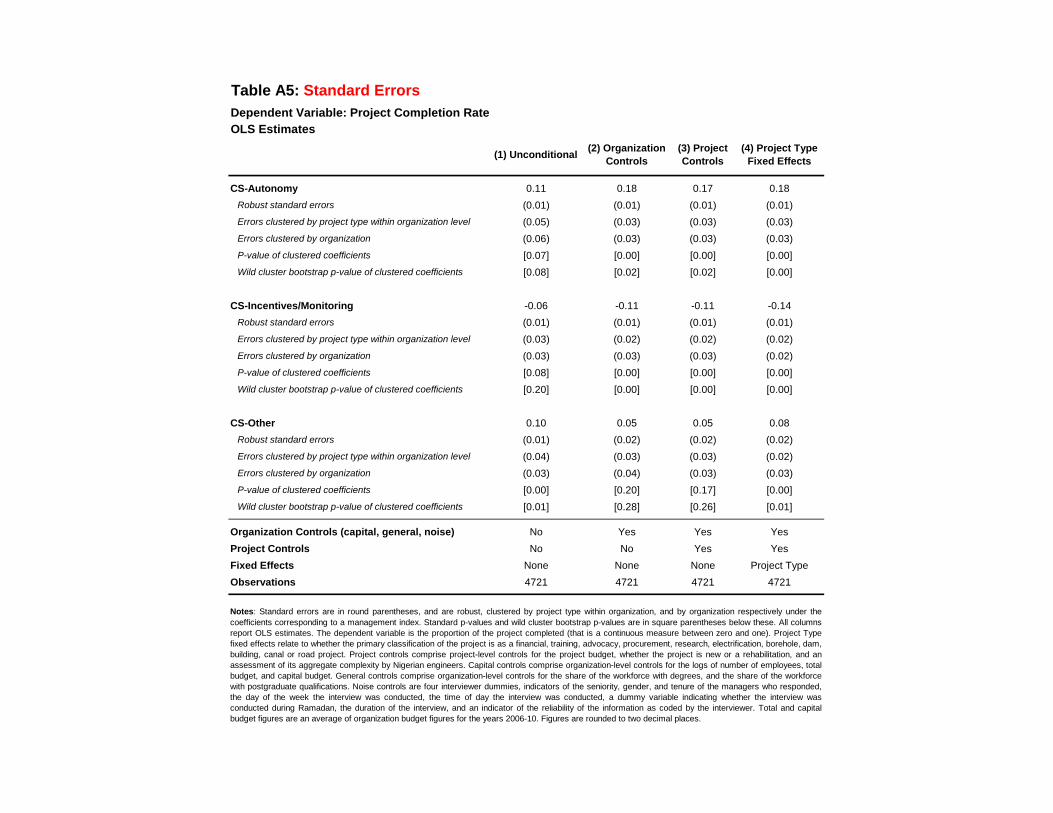
Table A5: Standard Errors
Dependent Variable: Project Completion Rate
OLS Estimates
(1) Unconditional(2) Organization
Controls
(3) Project
Controls
(4) Project Type
Fixed Effects
CS-Autonomy 0.11 0.18 0.17 0.18
Robust standard errors (0.01) (0.01) (0.01) (0.01)
Errors clustered by project type within organization level (0.05) (0.03) (0.03) (0.03)
Errors clustered by organization (0.06) (0.03) (0.03) (0.03)
P-value of clustered coefficients [0.07] [0.00] [0.00] [0.00]
Wild cluster bootstrap p-value of clustered coefficients [0.08] [0.02] [0.02] [0.00]
CS-Incentives/Monitoring -0.06 -0.11 -0.11 -0.14
Robust standard errors (0.01) (0.01) (0.01) (0.01)
Errors clustered by project type within organization level (0.03) (0.02) (0.02) (0.02)
Errors clustered by organization (0.03) (0.03) (0.03) (0.02)
P-value of clustered coefficients [0.08] [0.00] [0.00] [0.00]
Wild cluster bootstrap p-value of clustered coefficients [0.20] [0.00] [0.00] [0.00]
CS-Other 0.10 0.05 0.05 0.08
Robust standard errors (0.01) (0.02) (0.02) (0.02)
Errors clustered by project type within organization level (0.04) (0.03) (0.03) (0.02)
Errors clustered by organization (0.03) (0.04) (0.03) (0.03)
P-value of clustered coefficients [0.00] [0.20] [0.17] [0.00]
Wild cluster bootstrap p-value of clustered coefficients [0.01] [0.28] [0.26] [0.01]
Organization Controls (capital, general, noise) No Yes Yes Yes
Project Controls No No Yes Yes
Fixed Effects None None None Project Type
Observations 4721 4721 4721 4721
Notes: Standard errors are in round parentheses, and are robust, clustered by project type within organization, and by organization respectively under the
coefficients corresponding to a management index. Standard p-values and wild cluster bootstrap p-values are in square parentheses below these. All columns
report OLS estimates. The dependent variable is the proportion of the project completed (that is a continuous measure between zero and one). Project Type
fixed effects relate to whether the primary classification of the project is as a financial, training, advocacy, procurement, research, electrification, borehole, dam,
building, canal or road project. Project controls comprise project-level controls for the project budget, whether the project is new or a rehabilitation, and an
assessment of its aggregate complexity by Nigerian engineers. Capital controls comprise organization-level controls for the logs of number of employees, total
budget, and capital budget. General controls comprise organization-level controls for the share of the workforce with degrees, and the share of the workforce
with postgraduate qualifications. Noise controls are four interviewer dummies, indicators of the seniority, gender, and tenure of the managers who responded,
the day of the week the interview was conducted, the time of day the interview was conducted, a dummy variable indicating whether the interview was
conducted during Ramadan, the duration of the interview, and an indicator of the reliability of the information as coded by the interviewer. Total and capital
budget figures are an average of organization budget figures for the years 2006-10. Figures are rounded to two decimal places.
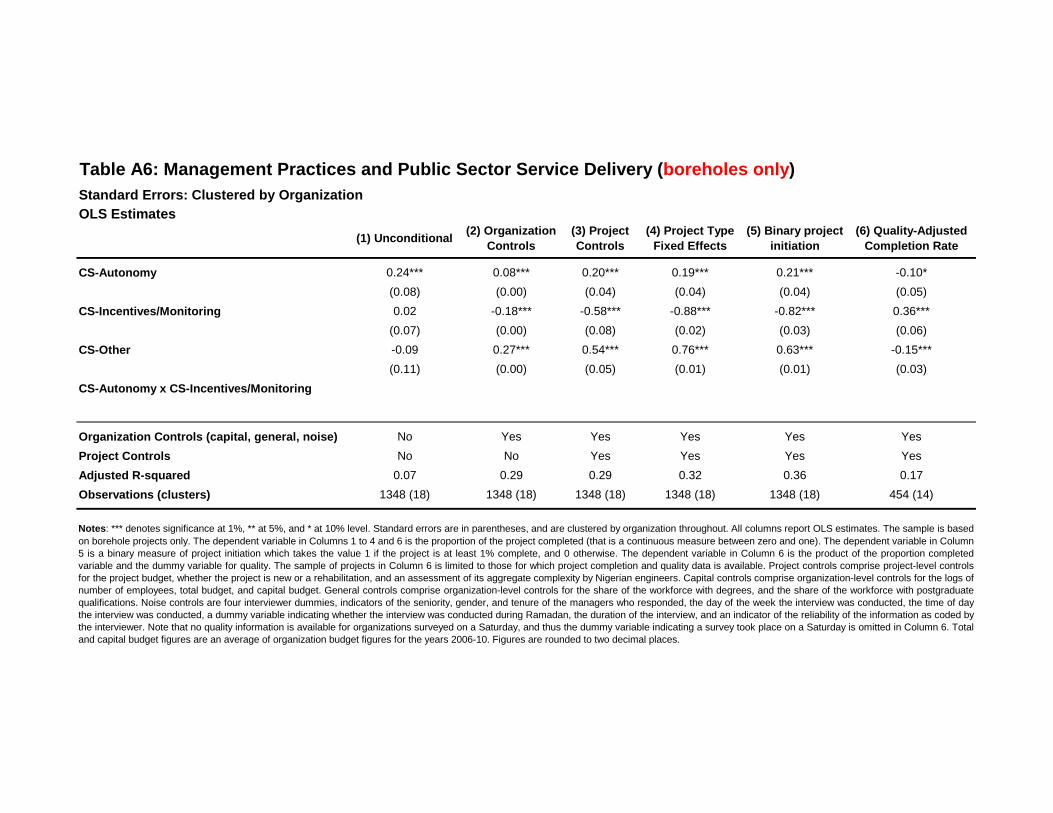
Table A6: Management Practices and Public Sector Service Delivery (boreholes only)
Standard Errors: Clustered by Organization
OLS Estimates
(1) Unconditional(2) Organization
Controls
(3) Project
Controls
(4) Project Type
Fixed Effects
(5) Binary project
initiation
(6) Quality-Adjusted
Completion Rate
CS-Autonomy 0.24*** 0.08*** 0.20*** 0.19*** 0.21*** -0.10*
(0.08) (0.00) (0.04) (0.04) (0.04) (0.05)
CS-Incentives/Monitoring 0.02 -0.18*** -0.58*** -0.88*** -0.82*** 0.36***
(0.07) (0.00) (0.08) (0.02) (0.03) (0.06)
CS-Other -0.09 0.27*** 0.54*** 0.76*** 0.63*** -0.15***
(0.11) (0.00) (0.05) (0.01) (0.01) (0.03)
CS-Autonomy x CS-Incentives/Monitoring
Organization Controls (capital, general, noise) No Yes Yes Yes Yes Yes
Project Controls No No Yes Yes Yes Yes
Adjusted R-squared 0.07 0.29 0.29 0.32 0.36 0.17
Observations (clusters) 1348 (18) 1348 (18) 1348 (18) 1348 (18) 1348 (18) 454 (14)
Notes: *** denotes significance at 1%, ** at 5%, and * at 10% level. Standard errors are in parentheses, and are clustered by organization throughout. All columns report OLS estimates. The sample is based
on borehole projects only. The dependent variable in Columns 1 to 4 and 6 is the proportion of the project completed (that is a continuous measure between zero and one). The dependent variable in Column5 is a binary measure of project initiation which takes the value 1 if the project is at least 1% complete, and 0 otherwise. The dependent variable in Column 6 is the product of the proportion completedvariable and the dummy variable for quality. The sample of projects in Column 6 is limited to those for which project completion and quality data is available. Project controls comprise project-level controlsfor the project budget, whether the project is new or a rehabilitation, and an assessment of its aggregate complexity by Nigerian engineers. Capital controls comprise organization-level controls for the logs ofnumber of employees, total budget, and capital budget. General controls comprise organization-level controls for the share of the workforce with degrees, and the share of the workforce with postgraduatequalifications. Noise controls are four interviewer dummies, indicators of the seniority, gender, and tenure of the managers who responded, the day of the week the interview was conducted, the time of daythe interview was conducted, a dummy variable indicating whether the interview was conducted during Ramadan, the duration of the interview, and an indicator of the reliability of the information as coded bythe interviewer. Note that no quality information is available for organizations surveyed on a Saturday, and thus the dummy variable indicating a survey took place on a Saturday is omitted in Column 6. Totaland capital budget figures are an average of organization budget figures for the years 2006-10. Figures are rounded to two decimal places.
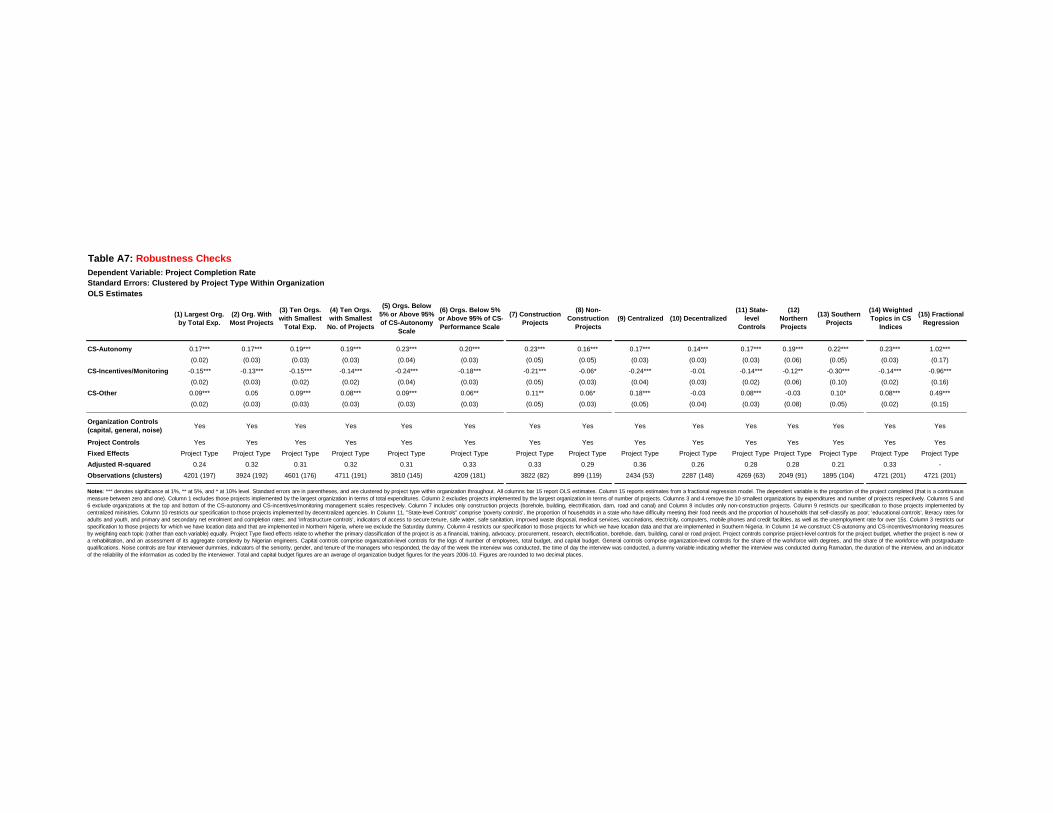
Table A7: Robustness Checks
Dependent Variable: Project Completion Rate
Standard Errors: Clustered by Project Type Within Organization
OLS Estimates
(1) Largest Org.
by Total Exp.
(2) Org. With
Most Projects
(3) Ten Orgs.
with Smallest
Total Exp.
(4) Ten Orgs.
with Smallest
No. of Projects
(5) Orgs. Below
5% or Above 95%
of CS-Autonomy
Scale
(6) Orgs. Below 5%
or Above 95% of CS-
Performance Scale
(7) Construction
Projects
(8) Non-
Construction
Projects
(9) Centralized (10) Decentralized
(11) State-
level
Controls
(12)
Northern
Projects
(13) Southern
Projects
(14) Weighted
Topics in CS
Indices
(15) Fractional
Regression
CS-Autonomy 0.17*** 0.17*** 0.19*** 0.19*** 0.23*** 0.20*** 0.23*** 0.16*** 0.17*** 0.14*** 0.17*** 0.19*** 0.22*** 0.23*** 1.02***
(0.02) (0.03) (0.03) (0.03) (0.04) (0.03) (0.05) (0.05) (0.03) (0.03) (0.03) (0.06) (0.05) (0.03) (0.17)
CS-Incentives/Monitoring -0.15*** -0.13*** -0.15*** -0.14*** -0.24*** -0.18*** -0.21*** -0.06* -0.24*** -0.01 -0.14*** -0.12** -0.30*** -0.14*** -0.96***
(0.02) (0.03) (0.02) (0.02) (0.04) (0.03) (0.05) (0.03) (0.04) (0.03) (0.02) (0.06) (0.10) (0.02) (0.16)
CS-Other 0.09*** 0.05 0.09*** 0.08*** 0.09*** 0.06** 0.11** 0.06* 0.18*** -0.03 0.08*** -0.03 0.10* 0.08*** 0.49***
(0.02) (0.03) (0.03) (0.03) (0.03) (0.03) (0.05) (0.03) (0.05) (0.04) (0.03) (0.08) (0.05) (0.02) (0.15)
Organization Controls
(capital, general, noise)Yes Yes Yes Yes Yes Yes Yes Yes Yes Yes Yes Yes Yes Yes Yes
Project Controls Yes Yes Yes Yes Yes Yes Yes Yes Yes Yes Yes Yes Yes Yes Yes
Fixed Effects Project Type Project Type Project Type Project Type Project Type Project Type Project Type Project Type Project Type Project Type Project Type Project Type Project Type Project Type Project Type
Adjusted R-squared 0.24 0.32 0.31 0.32 0.31 0.33 0.33 0.29 0.36 0.26 0.28 0.28 0.21 0.33 -
Observations (clusters) 4201 (197) 3924 (192) 4601 (176) 4711 (191) 3810 (145) 4209 (181) 3822 (82) 899 (119) 2434 (53) 2287 (148) 4269 (63) 2049 (91) 1895 (104) 4721 (201) 4721 (201)
Notes: *** denotes significance at 1%, ** at 5%, and * at 10% level. Standard errors are in parentheses, and are clustered by project type within organization throughout. All columns bar 15 report OLS estimates. Column 15 reports estimates from a fractional regression model. The dependent variable is the proportion of the project completed (that is a continuous
measure between zero and one). Column 1 excludes those projects implemented by the largest organization in terms of total expenditures. Column 2 excludes projects implemented by the largest organization in terms of number of projects. Columns 3 and 4 remove the 10 smallest organizations by expenditures and number of projects respectively. Columns 5 and
6 exclude organizations at the top and bottom of the CS-autonomy and CS-incentives/monitoring management scales respectively. Column 7 includes only construction projects (borehole, building, electrification, dam, road and canal) and Column 8 includes only non-construction projects. Column 9 restricts our specification to those projects implemented by
centralized ministries. Column 10 restricts our specification to those projects implemented by decentralized agencies. In Column 11, "State-level Controls" comprise 'poverty controls', the proportion of households in a state who have difficulty meeting their food needs and the proportion of households that self-classify as poor; 'educational controls', literacy rates for
adults and youth, and primary and secondary net enrolment and completion rates; and 'infrastructure controls', indicators of access to secure tenure, safe water, safe sanitation, improved waste disposal, medical services, vaccinations, electricity, computers, mobile phones and credit facilities, as well as the unemployment rate for over 15s. Column 3 restricts our
specification to those projects for which we have location data and that are implemented in Northern Nigeria, where we exclude the Saturday dummy. Column 4 restricts our specification to those projects for which we have location data and that are implemented in Southern Nigeria. In Column 14 we construct CS-autonomy and CS-incentives/monitoring measures
by weighting each topic (rather than each variable) equally. Project Type fixed effects relate to whether the primary classification of the project is as a financial, training, advocacy, procurement, research, electrification, borehole, dam, building, canal or road project. Project controls comprise project-level controls for the project budget, whether the project is new or
a rehabilitation, and an assessment of its aggregate complexity by Nigerian engineers. Capital controls comprise organization-level controls for the logs of number of employees, total budget, and capital budget. General controls comprise organization-level controls for the share of the workforce with degrees, and the share of the workforce with postgraduate
qualifications. Noise controls are four interviewer dummies, indicators of the seniority, gender, and tenure of the managers who responded, the day of the week the interview was conducted, the time of day the interview was conducted, a dummy variable indicating whether the interview was conducted during Ramadan, the duration of the interview, and an indicator
of the reliability of the information as coded by the interviewer. Total and capital budget figures are an average of organization budget figures for the years 2006-10. Figures are rounded to two decimal places.
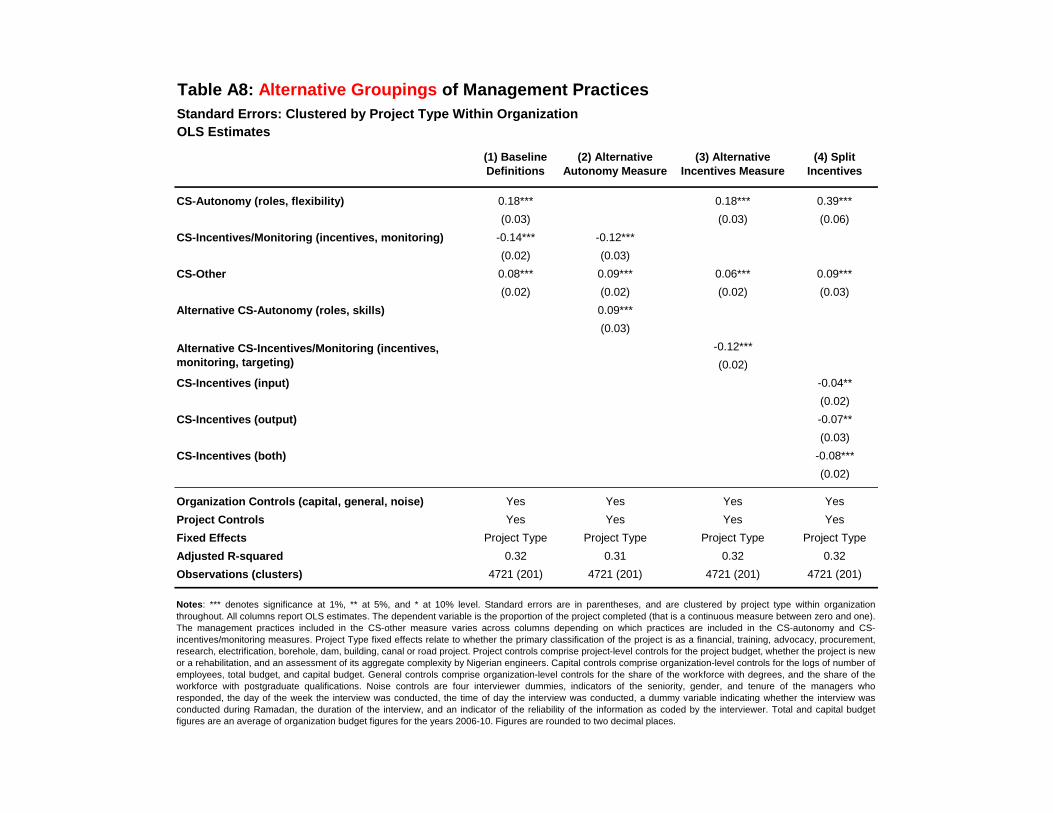
Table A8: Alternative Groupings of Management Practices
Standard Errors: Clustered by Project Type Within Organization
OLS Estimates
(1) BaselineDefinitions
(2) AlternativeAutonomy Measure
(3) AlternativeIncentives Measure
(4) SplitIncentives
CS-Autonomy (roles, flexibility) 0.18*** 0.18*** 0.39***
(0.03) (0.03) (0.06)
CS-Incentives/Monitoring (incentives, monitoring) -0.14*** -0.12***
(0.02) (0.03)
CS-Other 0.08*** 0.09*** 0.06*** 0.09***
(0.02) (0.02) (0.02) (0.03)
Alternative CS-Autonomy (roles, skills) 0.09***
(0.03)
-0.12***
(0.02)
CS-Incentives (input) -0.04**
(0.02)
CS-Incentives (output) -0.07**
(0.03)
CS-Incentives (both) -0.08***
(0.02)
Organization Controls (capital, general, noise) Yes Yes Yes Yes
Project Controls Yes Yes Yes Yes
Fixed Effects Project Type Project Type Project Type Project Type
Adjusted R-squared 0.32 0.31 0.32 0.32
Observations (clusters) 4721 (201) 4721 (201) 4721 (201) 4721 (201)
Alternative CS-Incentives/Monitoring (incentives,monitoring, targeting)
Notes: *** denotes significance at 1%, ** at 5%, and * at 10% level. Standard errors are in parentheses, and are clustered by project type within organization
throughout. All columns report OLS estimates. The dependent variable is the proportion of the project completed (that is a continuous measure between zero and one).The management practices included in the CS-other measure varies across columns depending on which practices are included in the CS-autonomy and CS-incentives/monitoring measures. Project Type fixed effects relate to whether the primary classification of the project is as a financial, training, advocacy, procurement,research, electrification, borehole, dam, building, canal or road project. Project controls comprise project-level controls for the project budget, whether the project is newor a rehabilitation, and an assessment of its aggregate complexity by Nigerian engineers. Capital controls comprise organization-level controls for the logs of number ofemployees, total budget, and capital budget. General controls comprise organization-level controls for the share of the workforce with degrees, and the share of theworkforce with postgraduate qualifications. Noise controls are four interviewer dummies, indicators of the seniority, gender, and tenure of the managers whoresponded, the day of the week the interview was conducted, the time of day the interview was conducted, a dummy variable indicating whether the interview wasconducted during Ramadan, the duration of the interview, and an indicator of the reliability of the information as coded by the interviewer. Total and capital budgetfigures are an average of organization budget figures for the years 2006-10. Figures are rounded to two decimal places.
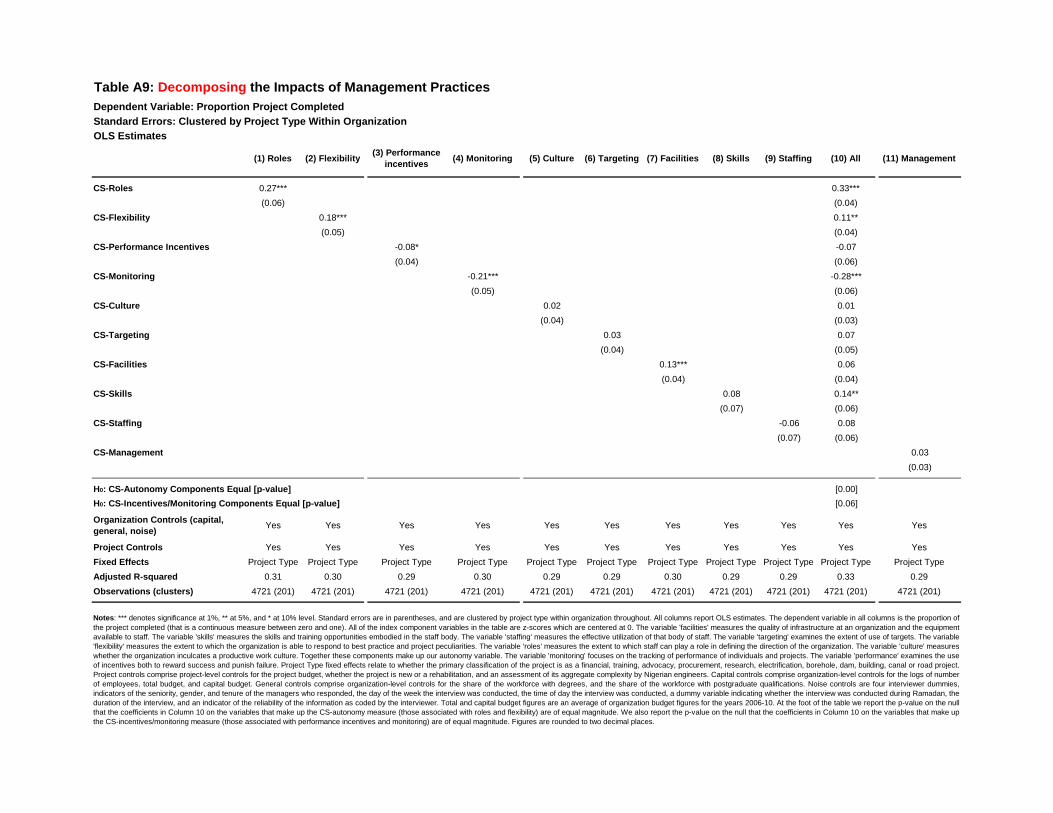
Table A9: Decomposing the Impacts of Management Practices
Dependent Variable: Proportion Project Completed
Standard Errors: Clustered by Project Type Within Organization
OLS Estimates
(1) Roles (2) Flexibility(3) Performance
incentives(4) Monitoring (5) Culture (6) Targeting (7) Facilities (8) Skills (9) Staffing (10) All (11) Management
CS-Roles 0.27*** 0.33***
(0.06) (0.04)
CS-Flexibility 0.18*** 0.11**
(0.05) (0.04)
CS-Performance Incentives -0.08* -0.07
(0.04) (0.06)
CS-Monitoring -0.21*** -0.28***
(0.05) (0.06)
CS-Culture 0.02 0.01
(0.04) (0.03)
CS-Targeting 0.03 0.07
(0.04) (0.05)
CS-Facilities 0.13*** 0.06
(0.04) (0.04)
CS-Skills 0.08 0.14**
(0.07) (0.06)
CS-Staffing -0.06 0.08
(0.07) (0.06)
CS-Management 0.03
(0.03)
H0: CS-Autonomy Components Equal [p-value] [0.00]
H0: CS-Incentives/Monitoring Components Equal [p-value] [0.06]
Organization Controls (capital,
general, noise)Yes Yes Yes Yes Yes Yes Yes Yes Yes Yes Yes
Project Controls Yes Yes Yes Yes Yes Yes Yes Yes Yes Yes Yes
Fixed Effects Project Type Project Type Project Type Project Type Project Type Project Type Project Type Project Type Project Type Project Type Project Type
Adjusted R-squared 0.31 0.30 0.29 0.30 0.29 0.29 0.30 0.29 0.29 0.33 0.29
Observations (clusters) 4721 (201) 4721 (201) 4721 (201) 4721 (201) 4721 (201) 4721 (201) 4721 (201) 4721 (201) 4721 (201) 4721 (201) 4721 (201)
Notes: *** denotes significance at 1%, ** at 5%, and * at 10% level. Standard errors are in parentheses, and are clustered by project type within organization throughout. All columns report OLS estimates. The dependent variable in all columns is the proportion of
the project completed (that is a continuous measure between zero and one). All of the index component variables in the table are z-scores which are centered at 0. The variable 'facilities' measures the quality of infrastructure at an organization and the equipment
available to staff. The variable 'skills' measures the skills and training opportunities embodied in the staff body. The variable 'staffing' measures the effective utilization of that body of staff. The variable 'targeting' examines the extent of use of targets. The variable
'flexibility' measures the extent to which the organization is able to respond to best practice and project peculiarities. The variable 'roles' measures the extent to which staff can play a role in defining the direction of the organization. The variable 'culture' measures
whether the organization inculcates a productive work culture. Together these components make up our autonomy variable. The variable 'monitoring' focuses on the tracking of performance of individuals and projects. The variable 'performance' examines the use
of incentives both to reward success and punish failure. Project Type fixed effects relate to whether the primary classification of the project is as a financial, training, advocacy, procurement, research, electrification, borehole, dam, building, canal or road project.
Project controls comprise project-level controls for the project budget, whether the project is new or a rehabilitation, and an assessment of its aggregate complexity by Nigerian engineers. Capital controls comprise organization-level controls for the logs of number
of employees, total budget, and capital budget. General controls comprise organization-level controls for the share of the workforce with degrees, and the share of the workforce with postgraduate qualifications. Noise controls are four interviewer dummies,
indicators of the seniority, gender, and tenure of the managers who responded, the day of the week the interview was conducted, the time of day the interview was conducted, a dummy variable indicating whether the interview was conducted during Ramadan, the
duration of the interview, and an indicator of the reliability of the information as coded by the interviewer. Total and capital budget figures are an average of organization budget figures for the years 2006-10. At the foot of the table we report the p-value on the null
that the coefficients in Column 10 on the variables that make up the CS-autonomy measure (those associated with roles and flexibility) are of equal magnitude. We also report the p-value on the null that the coefficients in Column 10 on the variables that make up
the CS-incentives/monitoring measure (those associated with performance incentives and monitoring) are of equal magnitude. Figures are rounded to two decimal places.
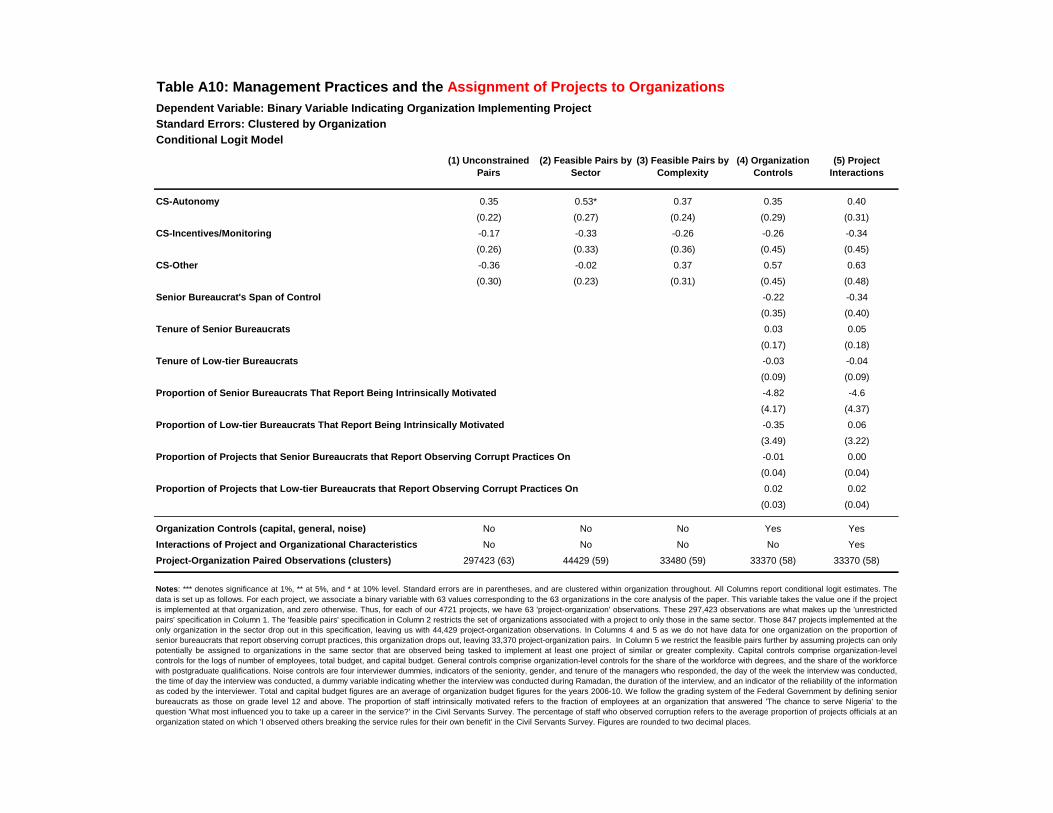
Table A10: Management Practices and the Assignment of Projects to Organizations
Dependent Variable: Binary Variable Indicating Organization Implementing Project
Standard Errors: Clustered by Organization
Conditional Logit Model
(1) Unconstrained
Pairs
(2) Feasible Pairs by
Sector
(3) Feasible Pairs by
Complexity
(4) Organization
Controls
(5) Project
Interactions
CS-Autonomy 0.35 0.53* 0.37 0.35 0.40
(0.22) (0.27) (0.24) (0.29) (0.31)
CS-Incentives/Monitoring -0.17 -0.33 -0.26 -0.26 -0.34
(0.26) (0.33) (0.36) (0.45) (0.45)
CS-Other -0.36 -0.02 0.37 0.57 0.63
(0.30) (0.23) (0.31) (0.45) (0.48)
Senior Bureaucrat's Span of Control -0.22 -0.34
(0.35) (0.40)
Tenure of Senior Bureaucrats 0.03 0.05
(0.17) (0.18)
Tenure of Low-tier Bureaucrats -0.03 -0.04
(0.09) (0.09)
Proportion of Senior Bureaucrats That Report Being Intrinsically Motivated -4.82 -4.6
(4.17) (4.37)
Proportion of Low-tier Bureaucrats That Report Being Intrinsically Motivated -0.35 0.06
(3.49) (3.22)
Proportion of Projects that Senior Bureaucrats that Report Observing Corrupt Practices On -0.01 0.00
(0.04) (0.04)
Proportion of Projects that Low-tier Bureaucrats that Report Observing Corrupt Practices On 0.02 0.02
(0.03) (0.04)
Organization Controls (capital, general, noise) No No No Yes Yes
Interactions of Project and Organizational Characteristics No No No No Yes
Project-Organization Paired Observations (clusters) 297423 (63) 44429 (59) 33480 (59) 33370 (58) 33370 (58)
Notes: *** denotes significance at 1%, ** at 5%, and * at 10% level. Standard errors are in parentheses, and are clustered within organization throughout. All Columns report conditional logit estimates. The
data is set up as follows. For each project, we associate a binary variable with 63 values corresponding to the 63 organizations in the core analysis of the paper. This variable takes the value one if the project
is implemented at that organization, and zero otherwise. Thus, for each of our 4721 projects, we have 63 'project-organization' observations. These 297,423 observations are what makes up the 'unrestricted
pairs' specification in Column 1. The 'feasible pairs' specification in Column 2 restricts the set of organizations associated with a project to only those in the same sector. Those 847 projects implemented at the
only organization in the sector drop out in this specification, leaving us with 44,429 project-organization observations. In Columns 4 and 5 as we do not have data for one organization on the proportion of
senior bureaucrats that report observing corrupt practices, this organization drops out, leaving 33,370 project-organization pairs. In Column 5 we restrict the feasible pairs further by assuming projects can only
potentially be assigned to organizations in the same sector that are observed being tasked to implement at least one project of similar or greater complexity. Capital controls comprise organization-level
controls for the logs of number of employees, total budget, and capital budget. General controls comprise organization-level controls for the share of the workforce with degrees, and the share of the workforce
with postgraduate qualifications. Noise controls are four interviewer dummies, indicators of the seniority, gender, and tenure of the managers who responded, the day of the week the interview was conducted,
the time of day the interview was conducted, a dummy variable indicating whether the interview was conducted during Ramadan, the duration of the interview, and an indicator of the reliability of the information
as coded by the interviewer. Total and capital budget figures are an average of organization budget figures for the years 2006-10. We follow the grading system of the Federal Government by defining senior
bureaucrats as those on grade level 12 and above. The proportion of staff intrinsically motivated refers to the fraction of employees at an organization that answered 'The chance to serve Nigeria' to the
question 'What most influenced you to take up a career in the service?' in the Civil Servants Survey. The percentage of staff who observed corruption refers to the average proportion of projects officials at an
organization stated on which 'I observed others breaking the service rules for their own benefit' in the Civil Servants Survey. Figures are rounded to two decimal places.
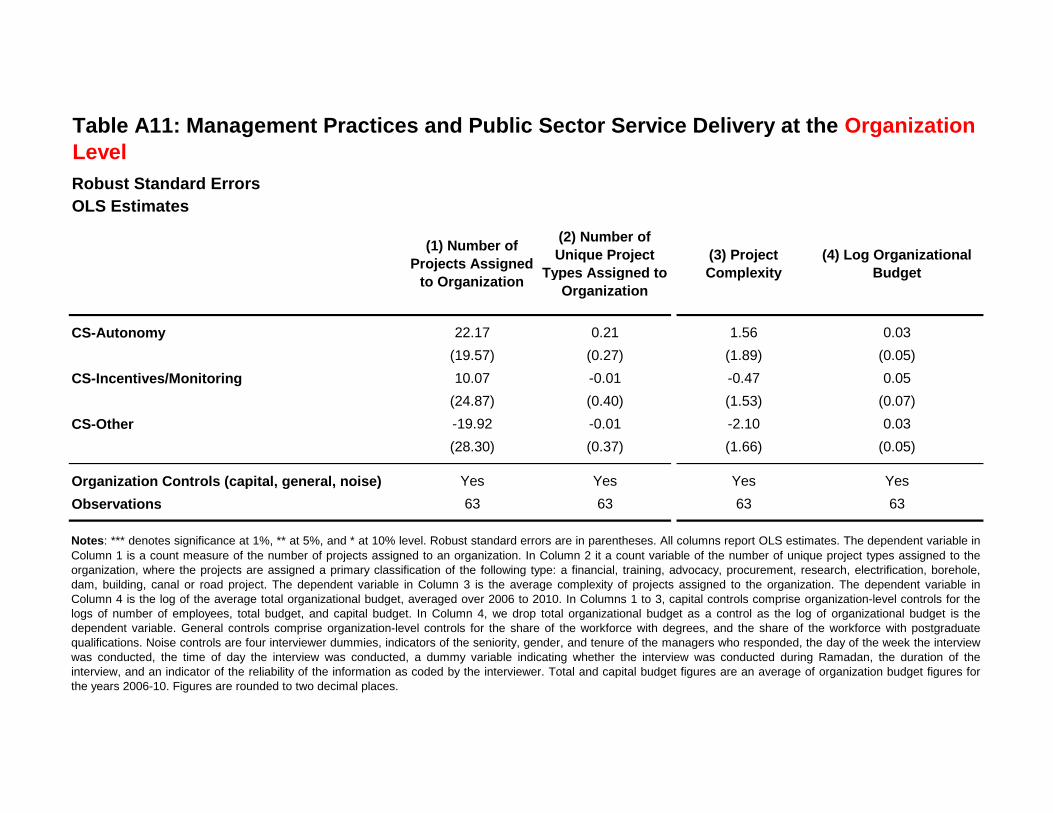
Robust Standard Errors
OLS Estimates
(1) Number of
Projects Assigned
to Organization
(2) Number of
Unique Project
Types Assigned to
Organization
(3) Project
Complexity
(4) Log Organizational
Budget
CS-Autonomy 22.17 0.21 1.56 0.03
(19.57) (0.27) (1.89) (0.05)
CS-Incentives/Monitoring 10.07 -0.01 -0.47 0.05
(24.87) (0.40) (1.53) (0.07)
CS-Other -19.92 -0.01 -2.10 0.03
(28.30) (0.37) (1.66) (0.05)
Organization Controls (capital, general, noise) Yes Yes Yes Yes
Observations 63 63 63 63
Table A11: Management Practices and Public Sector Service Delivery at the OrganizationLevel
Notes: *** denotes significance at 1%, ** at 5%, and * at 10% level. Robust standard errors are in parentheses. All columns report OLS estimates. The dependent variable in
Column 1 is a count measure of the number of projects assigned to an organization. In Column 2 it a count variable of the number of unique project types assigned to theorganization, where the projects are assigned a primary classification of the following type: a financial, training, advocacy, procurement, research, electrification, borehole,dam, building, canal or road project. The dependent variable in Column 3 is the average complexity of projects assigned to the organization. The dependent variable inColumn 4 is the log of the average total organizational budget, averaged over 2006 to 2010. In Columns 1 to 3, capital controls comprise organization-level controls for thelogs of number of employees, total budget, and capital budget. In Column 4, we drop total organizational budget as a control as the log of organizational budget is thedependent variable. General controls comprise organization-level controls for the share of the workforce with degrees, and the share of the workforce with postgraduatequalifications. Noise controls are four interviewer dummies, indicators of the seniority, gender, and tenure of the managers who responded, the day of the week the interviewwas conducted, the time of day the interview was conducted, a dummy variable indicating whether the interview was conducted during Ramadan, the duration of theinterview, and an indicator of the reliability of the information as coded by the interviewer. Total and capital budget figures are an average of organization budget figures forthe years 2006-10. Figures are rounded to two decimal places.
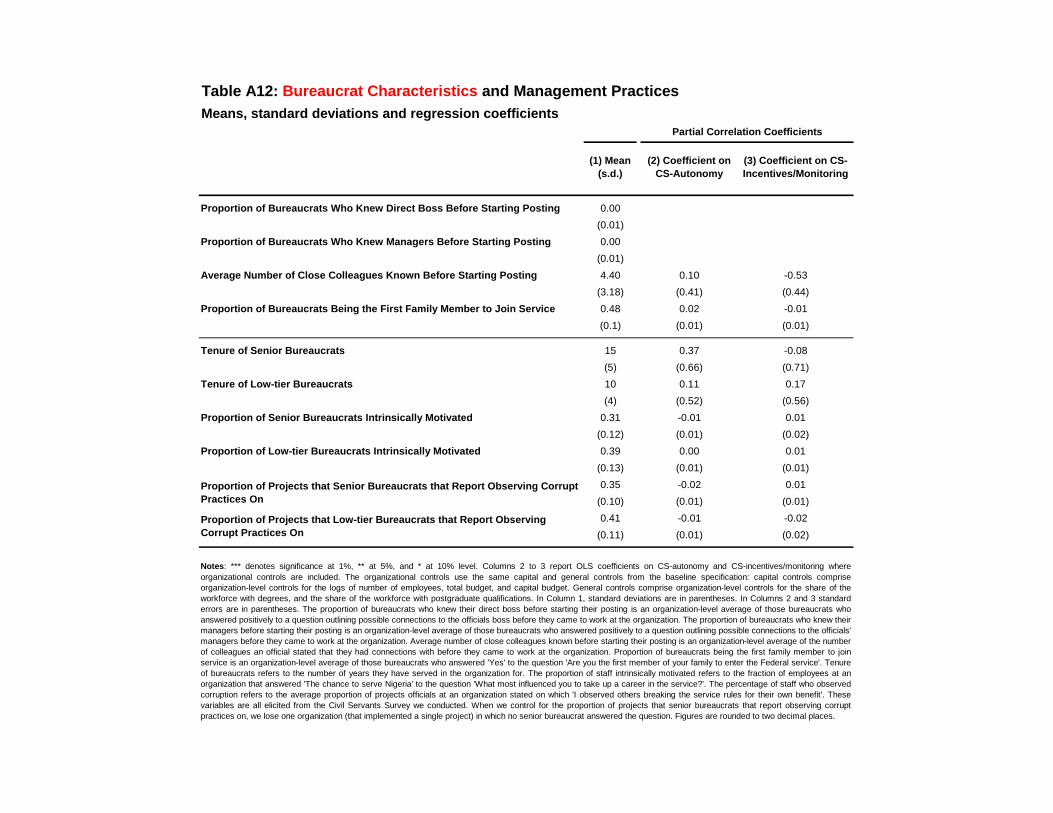
Table A12: Bureaucrat Characteristics and Management Practices
Means, standard deviations and regression coefficients
(1) Mean
(s.d.)
(2) Coefficient on
CS-Autonomy
(3) Coefficient on CS-
Incentives/Monitoring
Proportion of Bureaucrats Who Knew Direct Boss Before Starting Posting 0.00
(0.01)
Proportion of Bureaucrats Who Knew Managers Before Starting Posting 0.00
(0.01)
Average Number of Close Colleagues Known Before Starting Posting 4.40 0.10 -0.53
(3.18) (0.41) (0.44)
Proportion of Bureaucrats Being the First Family Member to Join Service 0.48 0.02 -0.01
(0.1) (0.01) (0.01)
Tenure of Senior Bureaucrats 15 0.37 -0.08
(5) (0.66) (0.71)
Tenure of Low-tier Bureaucrats 10 0.11 0.17
(4) (0.52) (0.56)
Proportion of Senior Bureaucrats Intrinsically Motivated 0.31 -0.01 0.01
(0.12) (0.01) (0.02)
Proportion of Low-tier Bureaucrats Intrinsically Motivated 0.39 0.00 0.01
(0.13) (0.01) (0.01)
0.35 -0.02 0.01
(0.10) (0.01) (0.01)
0.41 -0.01 -0.02
(0.11) (0.01) (0.02)
Partial Correlation Coefficients
Proportion of Projects that Senior Bureaucrats that Report Observing Corrupt
Practices On
Proportion of Projects that Low-tier Bureaucrats that Report Observing
Corrupt Practices On
Notes: *** denotes significance at 1%, ** at 5%, and * at 10% level. Columns 2 to 3 report OLS coefficients on CS-autonomy and CS-incentives/monitoring where
organizational controls are included. The organizational controls use the same capital and general controls from the baseline specification: capital controls comprise
organization-level controls for the logs of number of employees, total budget, and capital budget. General controls comprise organization-level controls for the share of the
workforce with degrees, and the share of the workforce with postgraduate qualifications. In Column 1, standard deviations are in parentheses. In Columns 2 and 3 standard
errors are in parentheses. The proportion of bureaucrats who knew their direct boss before starting their posting is an organization-level average of those bureaucrats who
answered positively to a question outlining possible connections to the officials boss before they came to work at the organization. The proportion of bureaucrats who knew their
managers before starting their posting is an organization-level average of those bureaucrats who answered positively to a question outlining possible connections to the officials'
managers before they came to work at the organization. Average number of close colleagues known before starting their posting is an organization-level average of the number
of colleagues an official stated that they had connections with before they came to work at the organization. Proportion of bureaucrats being the first family member to join
service is an organization-level average of those bureaucrats who answered 'Yes' to the question 'Are you the first member of your family to enter the Federal service'. Tenure
of bureaucrats refers to the number of years they have served in the organization for. The proportion of staff intrinsically motivated refers to the fraction of employees at an
organization that answered 'The chance to serve Nigeria' to the question 'What most influenced you to take up a career in the service?'. The percentage of staff who observed
corruption refers to the average proportion of projects officials at an organization stated on which 'I observed others breaking the service rules for their own benefit'. These
variables are all elicited from the Civil Servants Survey we conducted. When we control for the proportion of projects that senior bureaucrats that report observing corrupt
practices on, we lose one organization (that implemented a single project) in which no senior bureaucrat answered the question. Figures are rounded to two decimal places.
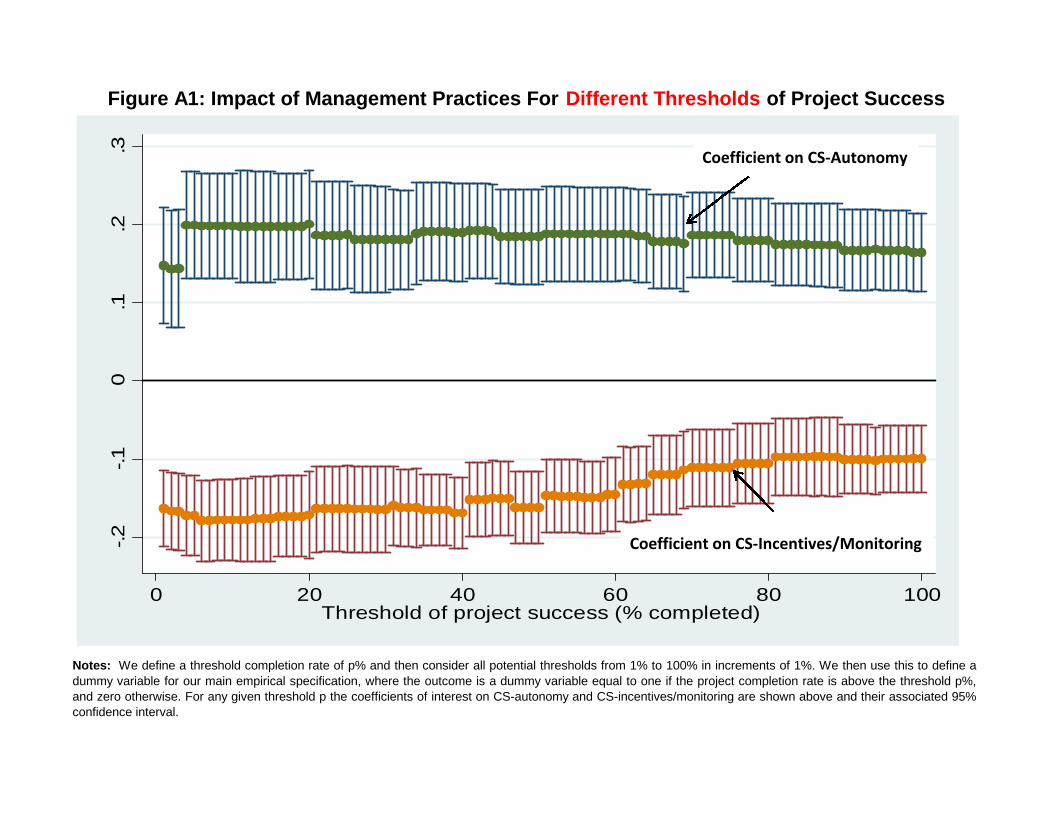
Figure A1: Impact of Management Practices For Different Thresholds of Project Success
Notes: We define a threshold completion rate of p% and then consider all potential thresholds from 1% to 100% in increments of 1%. We then use this to define a
dummy variable for our main empirical specification, where the outcome is a dummy variable equal to one if the project completion rate is above the threshold p%,and zero otherwise. For any given threshold p the coefficients of interest on CS-autonomy and CS-incentives/monitoring are shown above and their associated 95%confidence interval.
-.2
-.1
0.1
.2.3
0 20 40 60 80 100Threshold of project success (% completed)
Coefficient on CS-Autonomy
Coefficient on CS-Incentives/Monitoring