management of aortic stenosis - chu- · pdf filemanagement of aortic stenosis ... prior cva 58...
TRANSCRIPT
Management of Aortic Stenosis
Update of TAVI results by the femoral approach
Victor Legrand
CHU Sart-Tilman
Liège (B)

Currently two devices are commercialised:
Edwards SAPIEN CoreValve ReValving
23 & 26mm 26 & 29mm
retro- & antegrade retrograde (femoral or subclavian)
•Each approach has
its advantages.
•No direct
comparative studies
for the two
approaches.
Description of outcomes according to
transfemoral (TF)( ES or CV) or
transapical (TA) (ES) approach.

TAVI offers an option to treathigh-risk patients
Study Design Patients Log. Euroscore
REVIVE/REVIVAL TF 161 31%
REVIVAL II TA 40 35%
TRAVERSE TA 169 27%
PARTNER EU TF 61 26%
PARTNER EU TA 69 34%
SOURCE registry TF 463 26%
SOURCE registry TA 575 29%
France registry TF 95 26%
France registry TA 71 27%
Corevalve registry TF 2426 22%
France registry TF 66 25%
Belgian registry TF 141 25%

4
2005 2009
Comprehensive Training Has Resulted in Improved TF THV Clinical Outcomes

34 Centres Initially
Participating in Commercial
Launch
1123 patients
Included:
32 centres
1038 patients
The SOURCE Registry has
100% procedure data
98% 1 year data
All consecutively enrolled
Excluded:
2 Centres / 85 patients• Unable to obtain Ethic Cte approval
• Unable to secure administrative support
• One missing patient due to admin. error
5
S-E SOURCE Registry Cohort I
Nov 07 to Dec 08
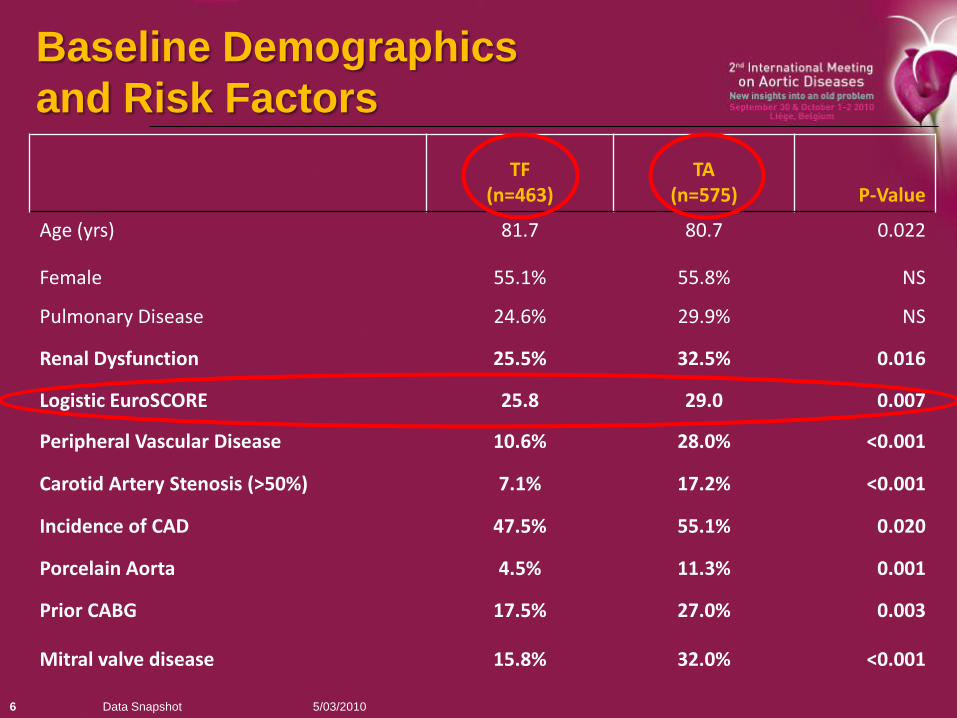
TF(n=463)
TA (n=575) P-Value
Age (yrs) 81.7 80.7 0.022
Female 55.1% 55.8% NS
Pulmonary Disease 24.6% 29.9% NS
Renal Dysfunction 25.5% 32.5% 0.016
Logistic EuroSCORE 25.8 29.0 0.007
Peripheral Vascular Disease 10.6% 28.0% <0.001
Carotid Artery Stenosis (>50%) 7.1% 17.2% <0.001
Incidence of CAD 47.5% 55.1% 0.020
Porcelain Aorta 4.5% 11.3% 0.001
Prior CABG 17.5% 27.0% 0.003
Mitral valve disease 15.8% 32.0% <0.001
5/03/2010Data Snapshot6
Baseline Demographics
and Risk Factors

TF (n=463) TA (n=575) Total (n=1038)
Death 6.3% 10.8% 8.8%
Stroke 2.6% 2.4% 2.5%
Renal Failure Requiring Dialysis
1.3% 7.0% 4.4%
Permanent Pacemaker
6.0% 7.7% 6.9%
5/03/10Data Snapshot7
Major Complications (≤ 30 Days)

Edwards Pooled Monitored & SOURCE: Freedom from Stroke Curve (1 Yr)
8

SOURCE: COHORT 11 Year Survival (All Approaches)
9
30 Day Survival:
TA 89.2%
TF 93.7%
ALL 91.2%

10
Early Vascular Access Complications
Relationship to 1 Year Mortality (NB 22/24F Device)
Approach
% Survival in Pts who did
not have vascular access
complications
% Survival in Pts who did
have vascular access
complications
P-Value
TF 83.9% 72.2% 0.0121
TA 73.2% 47.4% 0.0188

11
Causes of Death30 Days to 1 Year
ALL
ALL
179
Cardiac
45 (25.1%)
Heart Failure
28 (62.2%)
Myocardial Infarction
6 (13.3%)
Endocarditis
3 (6.7%)
Other*
8 (17.8%)
Non Cardiac
88 (49.2%)
Pulmonary***
21 (23.9%)
Renal Failure
11 (12.5%)
Cancer
10 (11.4%)
Stroke
9 (10.2%)
Gastrointestinal
5 (5.6%)
Other**
32 (36.4%)
Unknown
46 (25.7%)
Sudden Death
18 (39.1%)
Unknown
18 (39.1%)
Other
10 (21.7%)
Other * = Arrhythmia, cardiac arrest
Other** = Sepsis, vascular access related, major
bleeding, infection, suicide, and multiple organ failure
Pulmonary***= Respiratory Failure, Pulmonary
Embolism and Pneumonia
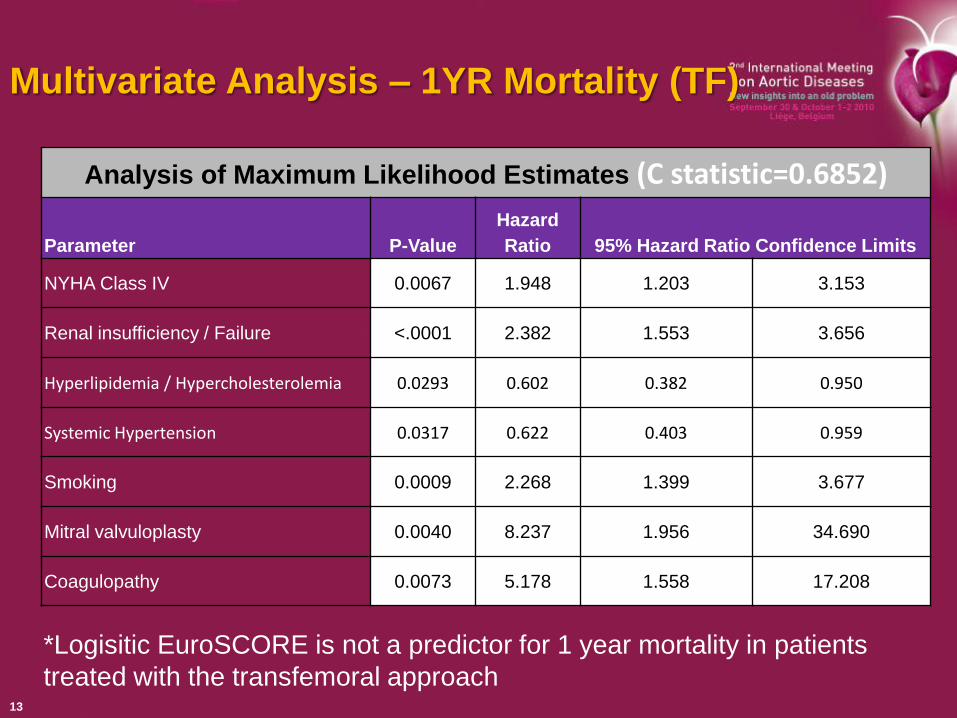
Multivariate Analysis – 1YR Mortality (TF)
13
*Logisitic EuroSCORE is not a predictor for 1 year mortality in patients
treated with the transfemoral approach
Analysis of Maximum Likelihood Estimates (C statistic=0.6852)
Parameter P-Value
Hazard
Ratio 95% Hazard Ratio Confidence Limits
NYHA Class IV 0.0067 1.948 1.203 3.153
Renal insufficiency / Failure <.0001 2.382 1.553 3.656
Hyperlipidemia / Hypercholesterolemia 0.0293 0.602 0.382 0.950
Systemic Hypertension 0.0317 0.622 0.403 0.959
Smoking 0.0009 2.268 1.399 3.677
Mitral valvuloplasty 0.0040 8.237 1.956 34.690
Coagulopathy 0.0073 5.178 1.558 17.208
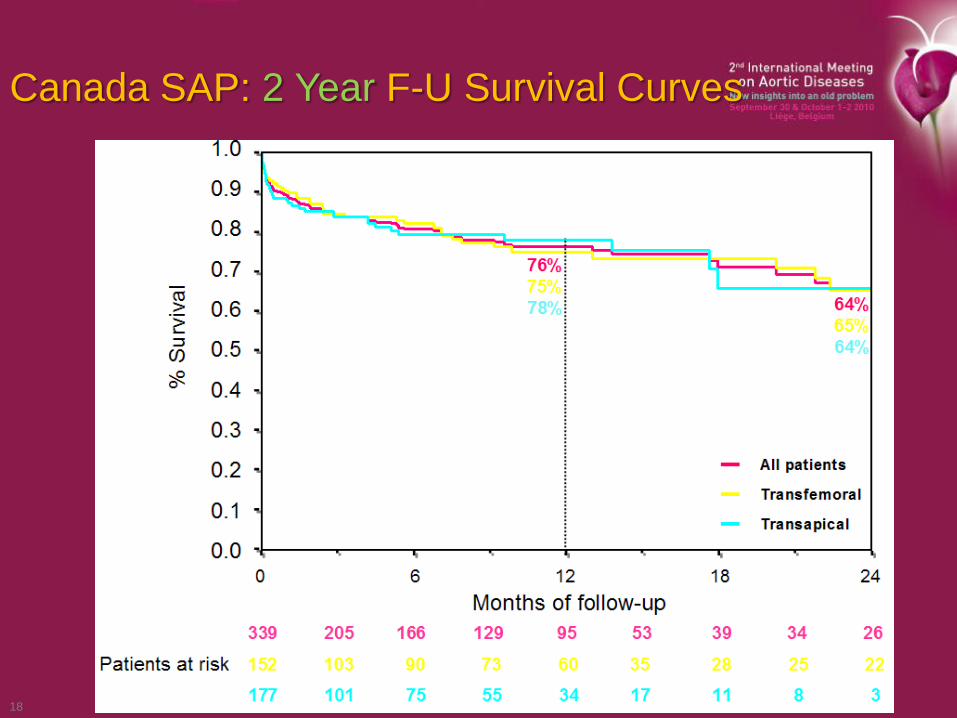
Canada SAP: 2 Year F-U Survival Curves
18
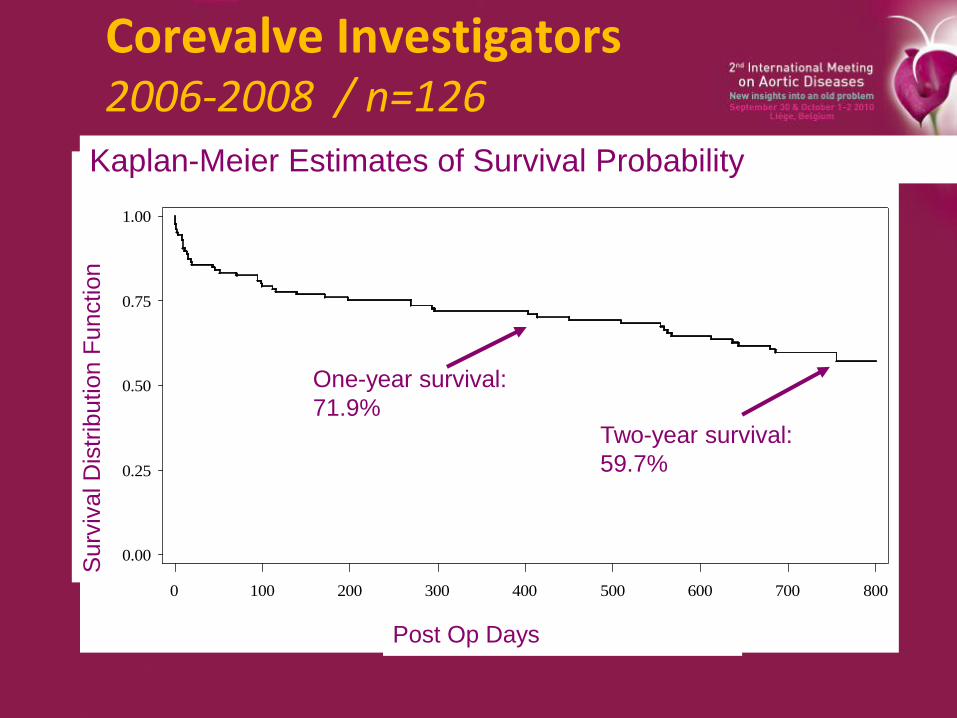
Corevalve Investigators 2006-2008 / n=126
Medtronic CoreValve System
Kaplan-Meier Estimates of Survival Probability
Surv
ival
Dis
trib
uti
on F
unct
ion
0.00
0.25
0.50
0.75
1.00
Post_op_Days
0 100 200 300 400 500 600 700 800
One-year survival:
71.9%Two-year survival:
59.7%
Post Op Days
Surv
ival D
istr
ibution F
unction
Kaplan-Meier Estimates of Survival Probability

P>0.2
Overall survival
85.1±1.3
At risk 590 407
Italian Corevalve TAVI Registry
2007-2009
Overall survival

Baseline clinical characteristicsN=772
Age (years) 82±6 (IQR 79-86)Female 432 (56.0%)Log EUROSCORE (%) 22.9±13.5 (IQR 13-29)NYHA class III-IV 545 (70.6%)Hypertension 591 (76.6%)Diabetes 212 (27.5%)PAD 160 (20.7%)CAD 372 (48.2%)Prior MI 160 (20.7%)Prior PCI 225 (29.1%)Prior CABG 117 (15.2%)Prior Aortic Bioprosthesis 14 (1.8%)Prior CVA 58 (7.5%)
Italian CorevalveTAVI Registry
2007-2009

Implantation Success with Corevalve

1 Year Survival with Corevalve
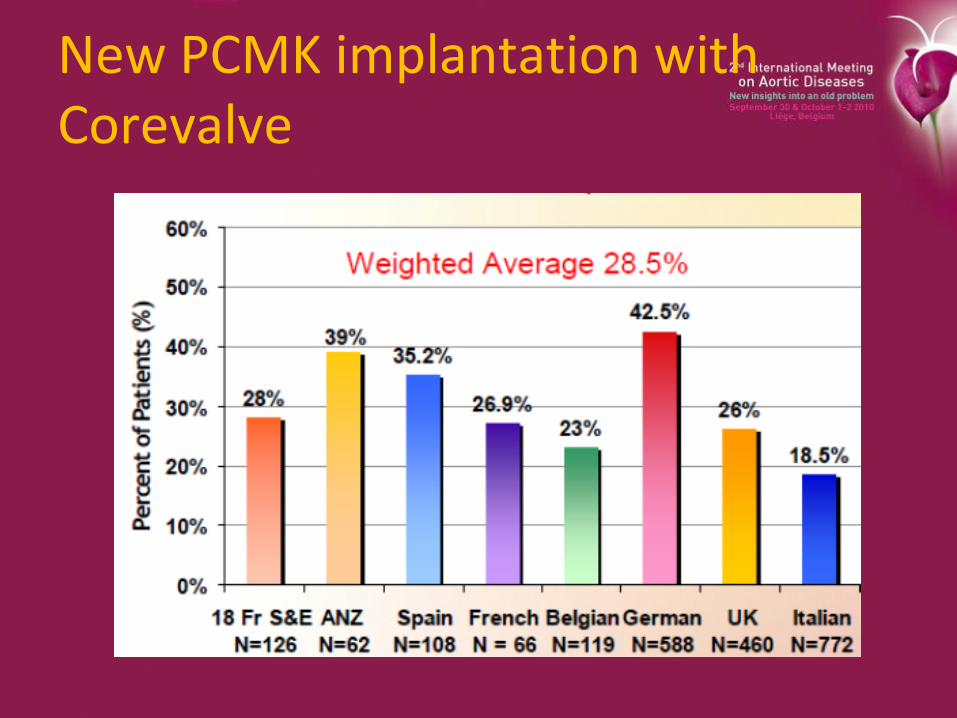
New PCMK implantation with Corevalve
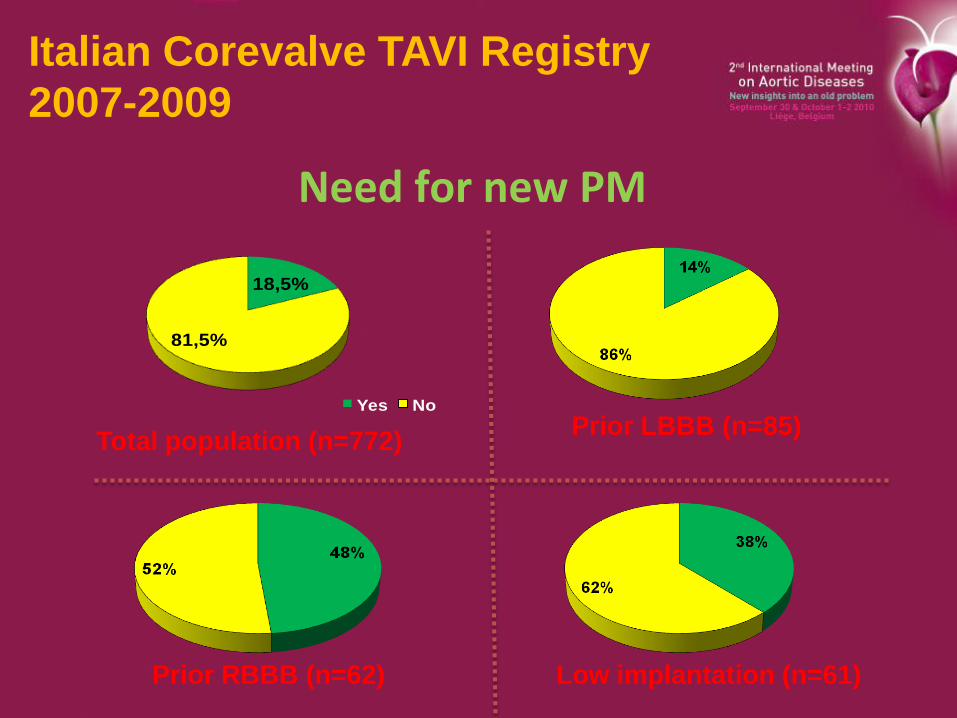
18,5%
81,5%
Yes No
Total population (n=772)Prior LBBB (n=85)
Prior RBBB (n=62) Low implantation (n=61)
Need for new PM
Italian Corevalve TAVI Registry
2007-2009

Additional information
• TAVI demonstrates excellent hemodynamic performance:
mean gradient: 50mmHg(pre) to <10 mmHg (post)
• Aortic Regurgitation: >/= 2+ in 15 to 45% after implant, down to 10 to 25% at 1yr
• Stroke rate are similar to high-risk surgical AoVR cohorts (1.7 to 4.5%)
• TAVI improves patient quality of life: >80% improved at least 1NYHA Class after TAVI

Summary
• TAVI is entering more and more in routine practice for patients with several co-morbidities wich make surgery challenging or at increased operative risk.
• The initial success rate has gradually improved up to 95%.
• The 30 day survival with the TF approach is of 90-95% ( 85 -90% for TA).
• One year mortality ranged from 20 to 30% and is driven largely by not cardiac causes.
• Results achieved by ES and CV retrograde systems are similar, except the higher need for PCMK implantation with the CV approach.

The Belgian TAVI Registrypatient characteristics

The Belgian TAVI Registryprocedural success
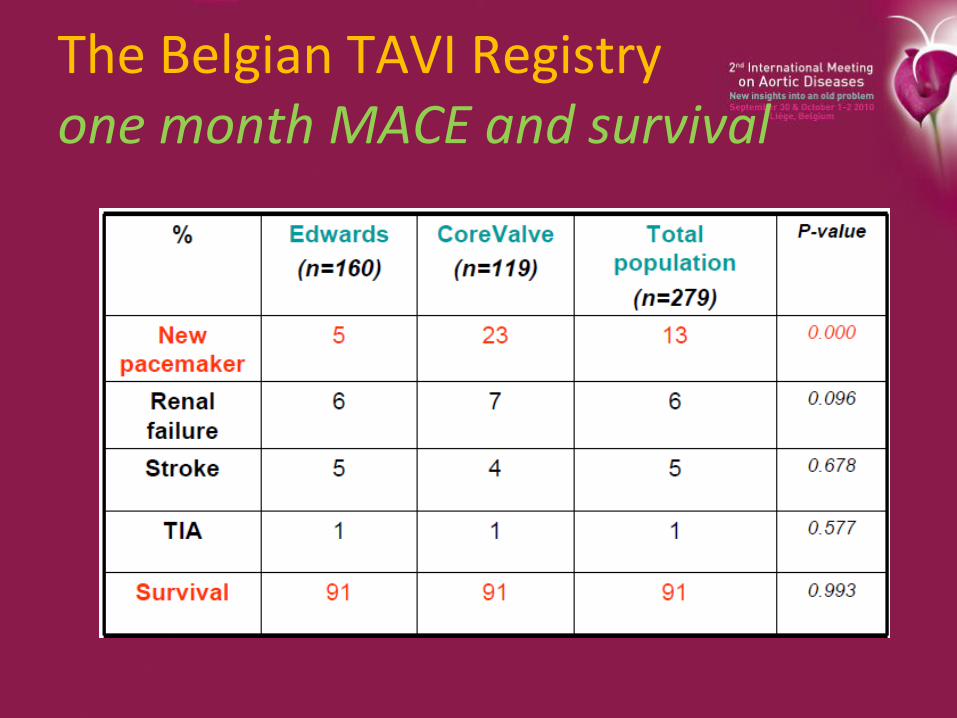
The Belgian TAVI Registryone month MACE and survival
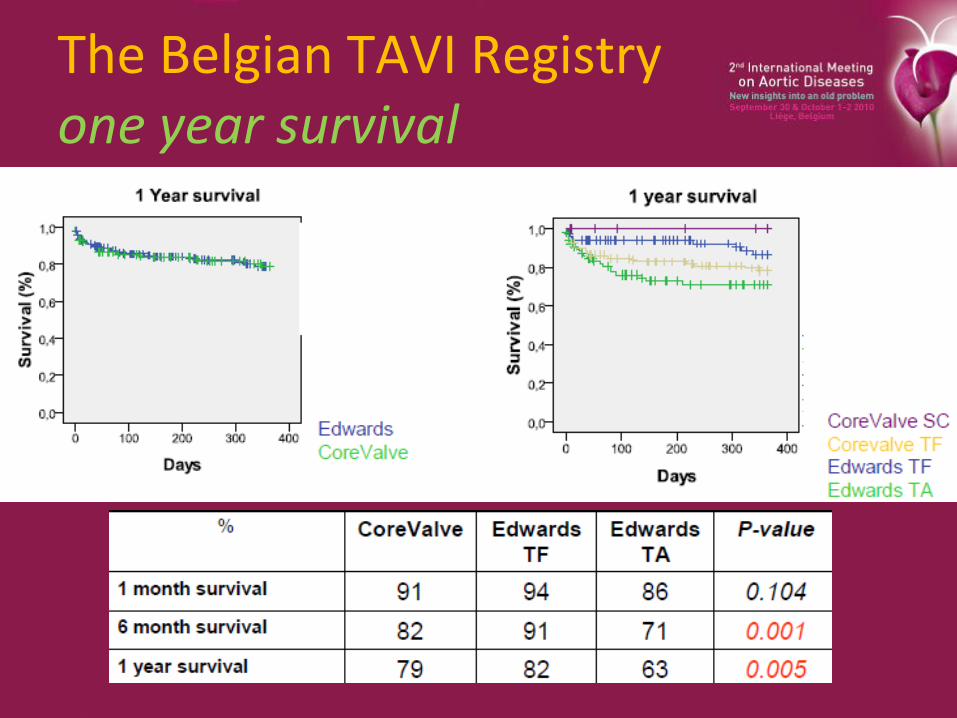
The Belgian TAVI Registryone year survival
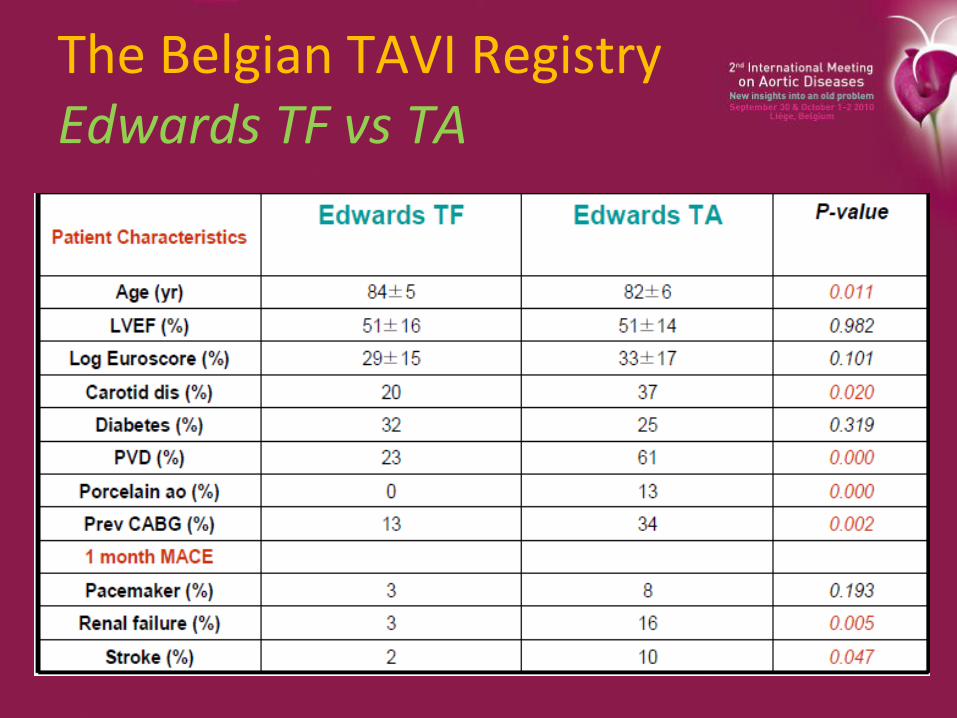
The Belgian TAVI RegistryEdwards TF vs TA

The Belgian TAVI Registrycauses of death
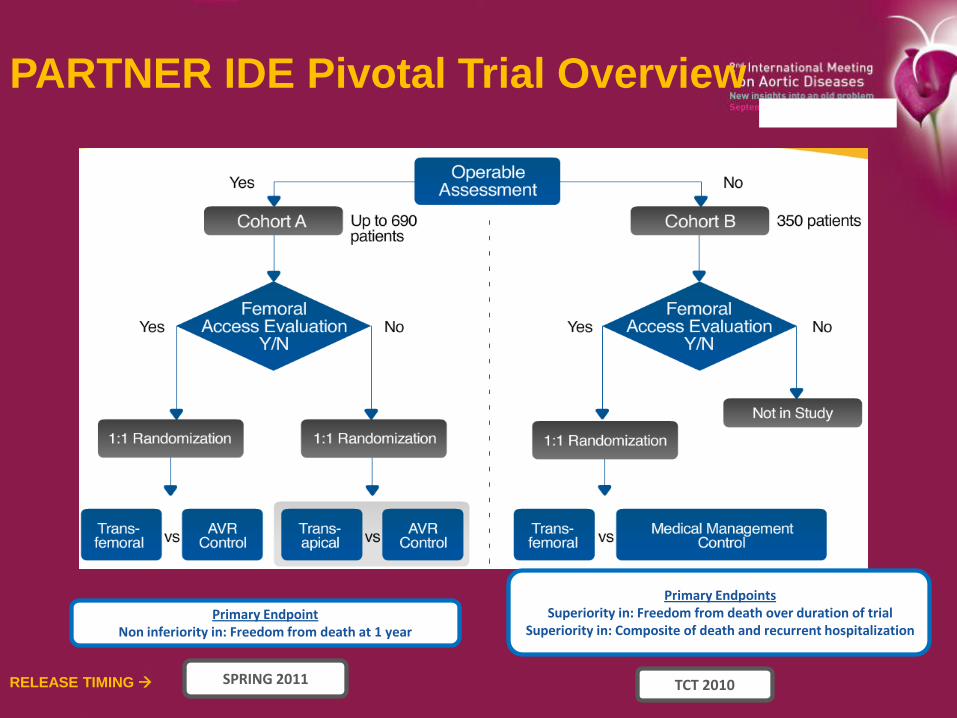
Primary EndpointNon inferiority in: Freedom from death at 1 year
Primary Endpoints Superiority in: Freedom from death over duration of trial
Superiority in: Composite of death and recurrent hospitalization
PARTNER IDE Pivotal Trial Overview
SPRING 2011 TCT 2010RELEASE TIMING

PARTNER cohort BAll Cause Mortality
Numbers at Risk
TAVI 179 138 122 67 26
Standard Rx 179 121 83 41 12
Standard Rx
TAVI
All-
cause
mort
alit
y(%
)
Months
∆ at 1 yr = 20.0%
NNT = 5.0 pts
50.7%
30.7%

Conclusions - 1
In patients with severe AS and symptoms,
who are not suitable candidates for surgery…
• Standard therapy (including BAV in 83.8% of pts) did
not alter the dismal natural history of AS;
all-cause and cardiovascular mortality at 1 year was
50.7% and 44.6% respectively
• Transfemoral balloon-expandable TAVI, despite
limited operator experience and an early version of
the system, was associated with acceptable 30-day
survival (5% after randomization in the intention-to-
treat population)

Conclusions - 2
• TAVI was superior to standard therapy, markedly
reducing the rate of…
all-cause mortality by 46%, P < 0.0001,
NNT = 5.0 pts
cardiovascular mortality by 61%, P < 0.0001,
NNT = 4.1 pts
all-cause mortality and repeat hospitalization
hierarchical (FS method), P < 0.0001
non-hierarchical (KM analysis) by 54%,
P < 0.0001, NNT = 3.4 pts