management of acute cardiogenic pulmonary oedema · g.a. richards mbbch phd fcp(sa) frcp fccp...
TRANSCRIPT
G.A. Richards
MBBCh PhD FCP(SA) FRCP FCCP
Director Critical Care CMJAH
Management of Acute
Cardiogenic Pulmonary
Oedema

Causes of LV Failure
Hypertension
Ischaemia
Muscle (CMO, drugs, toxins, infiltrative,
nutritional, endocrine, HIV, peripartum)
Valvular
Congenital

Prognosis
50% are dead at 4 yrs
40% of those admitted with HF are dead or
readmitted within 4 years
European Journal of Heart Failure (2008), 933–989

Dickstein ESC Guidelines: Eur J Heart Failure 2008

Diastolic HF: HFPEF
Symptoms ± signs of HF & preserved LVEF
(40–50%) (no consensus on cut-off for
“preserved EF”)
Clinical diagnosis alone inadequate, esp in
♀, elderly, obese
HFPEF is present in 50%
Prognosis similar to systolic HF Remes Eur Heart J 1991
Wheeldon Q J Med 1993
Owan N Engl J Med 2006
Diagnosis of HFPEF
Requires 3 conditions
Signs and/or symptoms of chronic HF
Normal or mildly abnormal LV systolic function
Diastolic dysfunction (abnormal relaxation or
diastolic stiffness)

Diagnosis of Heart Failure
Dickstein ESC Guidelines: Eur J Heart Failure 2008
Therapeutic Modalities:
Oxygen
Non-invasive ventilation
Loop diuretics
Vasodilators
Inotropic agents
Cardiac glycosides
Morphine
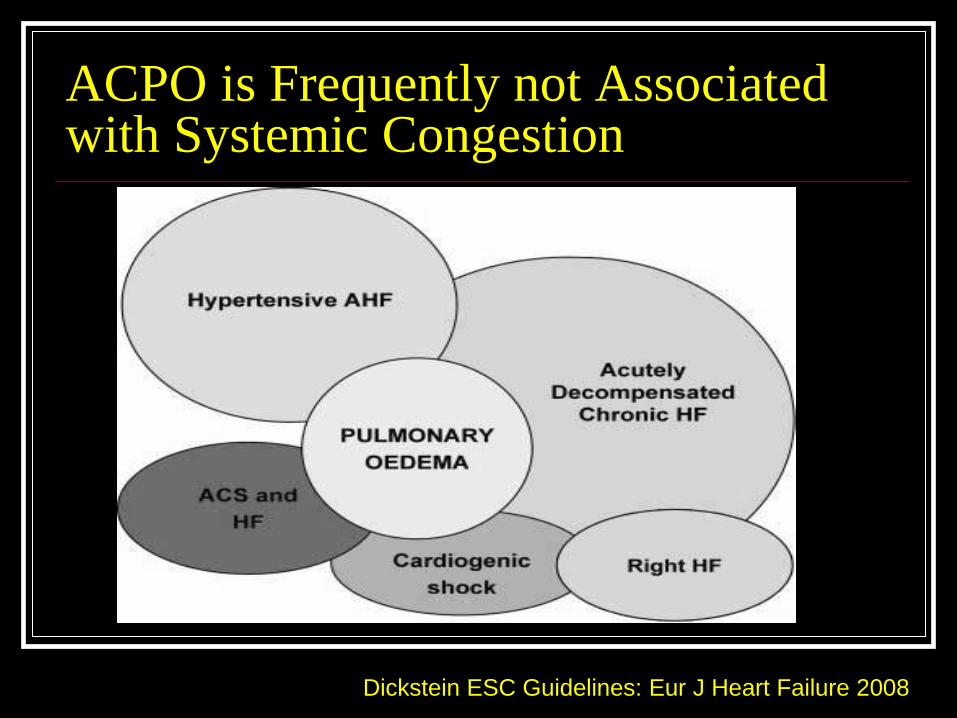
ACPO is Frequently not Associated with Systemic Congestion
Dickstein ESC Guidelines: Eur J Heart Failure 2008

Worsening/decompensated CHF
Peripheral oedema/congestion:
Systemic congestion with low BP
Often both RV and LV dysfunction so LA
pressure not increased
Poor prognosis
Pulmonary congestion less common
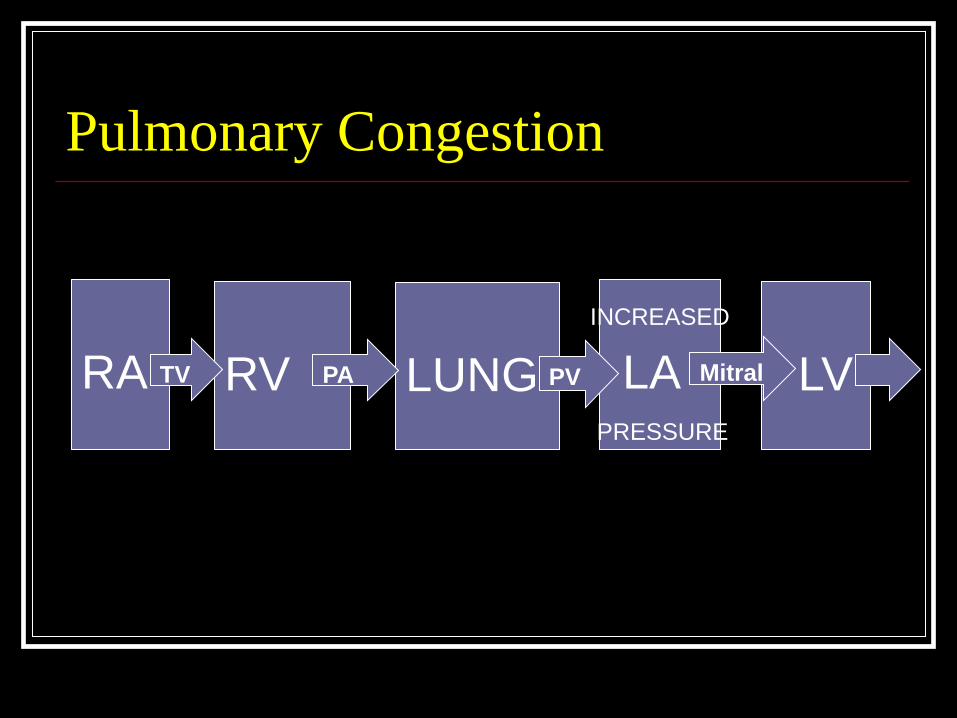
Pulmonary Congestion
LUNG
LA
RV
RA
LV TV PA PV Mitral
INCREASED
PRESSURE
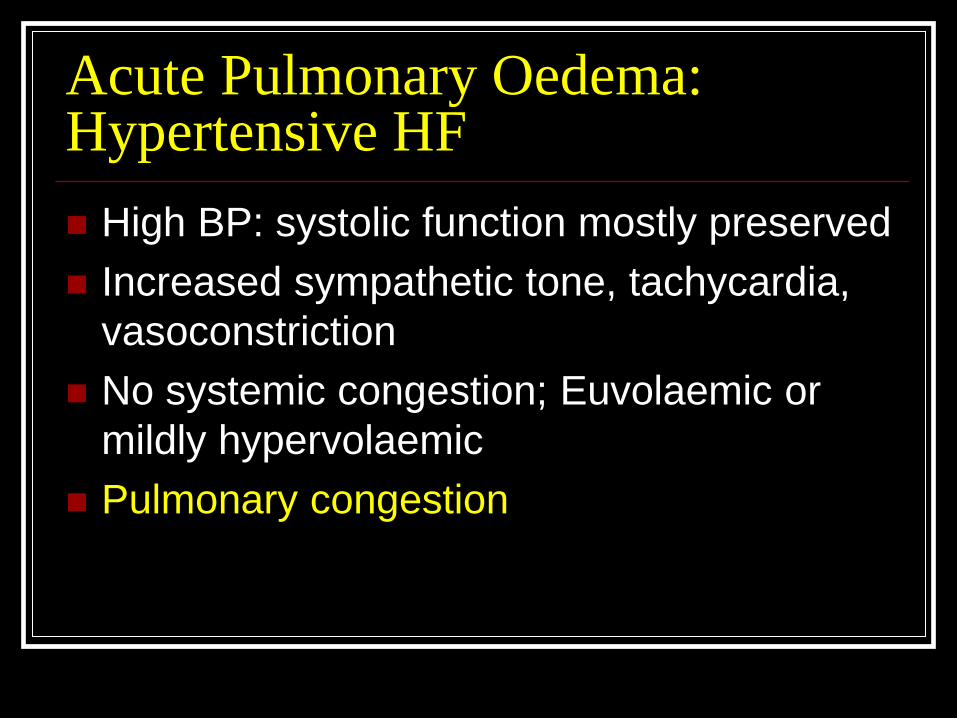
Acute Pulmonary Oedema: Hypertensive HF
High BP: systolic function mostly preserved
Increased sympathetic tone, tachycardia,
vasoconstriction
No systemic congestion; Euvolaemic or
mildly hypervolaemic
Pulmonary congestion

Isolated right HF:
Low output syndrome
Increased JVP± hepatomegaly
Low LV filling pressures
No pulmonary congestion
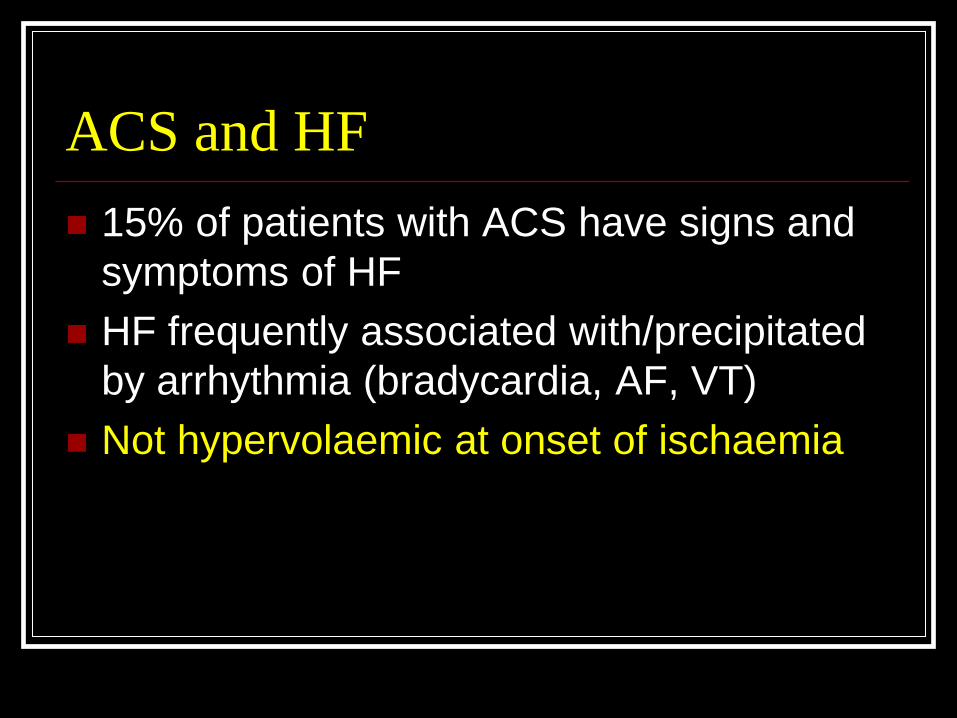
ACS and HF
15% of patients with ACS have signs and
symptoms of HF
HF frequently associated with/precipitated
by arrhythmia (bradycardia, AF, VT)
Not hypervolaemic at onset of ischaemia
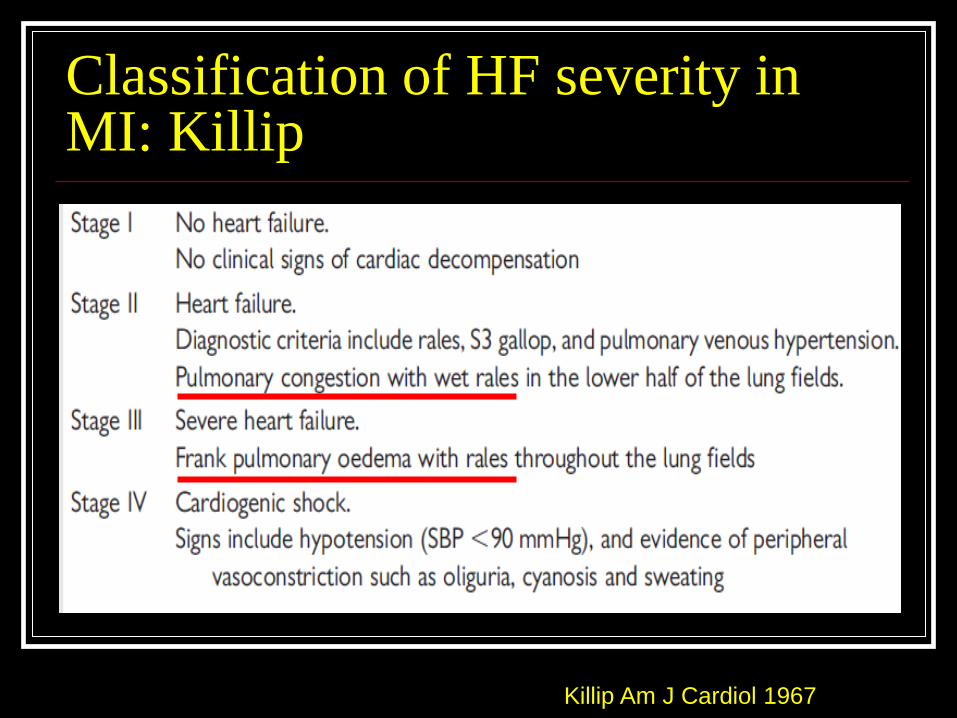
Classification of HF severity in MI: Killip
Killip Am J Cardiol 1967

Classification of HF severity in MI: Forrester
Forrester Am J Cardiol 1977

Tako-tsubo
“Stress-induced CMO”, “broken heart” or
“transient LV apical ballooning syndrome”
0.7–2.5% patients with apparent ACS
Preceding hypertension in 43-76%
Primarily older ♀ (90%), acute emotional/
physiologic stress; also younger patients
and ♂, not always with stressful events
Pilgrim Int J Cardiol 2008
Sharkey J Am Coll Cardiol 2010

Tako-tsubo: Diagnostic Criteria
Transient hypo-, akinesis in LV mid segments
± apical involvement in >1 vessel distribution
Absence of OCAD or plaque rupture on angio
New ECG abnormalities/ modest Tn elevation
Absence of myocarditis or phaeo
Prasad Am Heart J 2008

Tako-tsubo: Mechanisms
Myocardial stunning: ? due to catecholamine
or ischaemia-mediated multivessel,
epicardial or microvascular spasm, aborted
MI, or focal myocarditis
Why selective apical LV dysfunction is
unknown; possibly increased responsiveness
of apical myocardium to SNS stimulation
Tako-tsubo
Symptoms: ACS or ACPO
Minimal ST elevation in precordial leads
Small Tn elevation (peak < 24h), low for
the extensive wall motion abnormalities:
Ramaraj Exp Clin Cardiol 2009
Sharkey Am J Cardiol 2008

Tako-tsubo: Systole: No contraction in apical region and apical ballooning
Zeb Postgrad Med J 2011

ACPO: Diuretics
ACPO without pre-existent systemic
congestion generally causes intravascular
volume depletion
Diuretics may cause further dehydration
and exacerbate renal failure

ACPO: Conditions where diuretics may not be valuable
Hypertensive heart failure
Acute ischaemia/MI
HFPEF
Tako Tsubo
HOCM
Negaitive pressure pulmonary oedema

Therapy: Oxygen
Recommended as early as possible to
achieve saturation ≥ 95% (less in COPD)

NIV: Haemodynamic Response
RV preload reduced by IPPV
RV afterload determined by effect on PVR
Alveolar vessels: degree of alveolar
overdistension
Extra alveolar interstitial vessels:
atelectasis or recruitment Magder: ICM 1998
Pinsky: JAP 1984; Crit Care Clin 1990
Marini: ARRD 1987

LV preload
Influenced by
RV preload
RV afterload
Ventricular interdependence
Determined by:
Ventricular work: SVR and BP
Cavity size Tension ∞ radius (Laplace)
Transmural pressure (tension)
IPPV reduces: cavity size and
transmural tension
LV Afterload

HR
Preload
Muscle
shortening
Stroke
volume
SVR
C.O.
BP
Contractility
Afterload
Cavity size
Hemodynamics
ITP
±

TT
TT =
ITP
Transmural tension = 60-20 = 40
LV Afterload: Transmural Tension
IPPV increases ITP reducing transmural tension
TT
Mean Arterial Pressure 60
Mean Airway Pressure +20
Transmural tension = 60 +20=80
Afterload: Negative Pressure Pulmonary Oedema
Markedly negative swings in ITP from
spontaneous ventilation increases
afterload and may precipitate ACPO
particularly with LV dysfunction
This can also occur in well compensated
patients. Young fit males
Stalcup: NEJM 1977
Sofer: Chest 1984
Beach: CCM 1973
Therapy: NIV with PEEP
Consider as early as possible with ACPO
Improves clinical parameters and LV
function by reducing LV afterload
3 meta-analyses showed reduced intubation
and short-term mortality
Masip Heart Fail Rev 2007 &JAMA 2005
Peter Lancet 2006
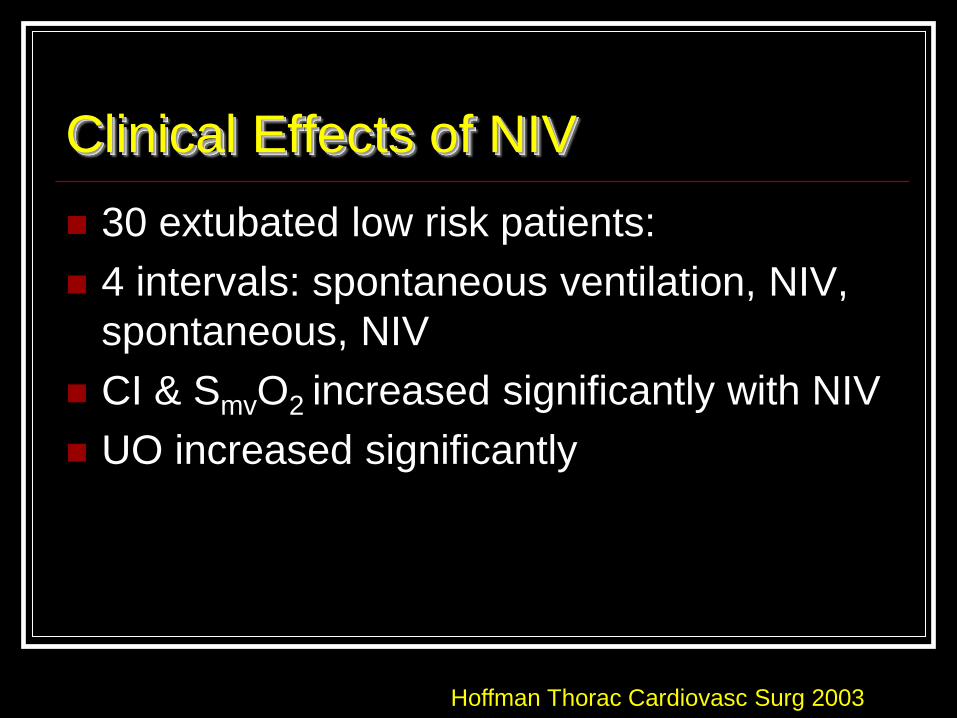
Clinical Effects of NIV
30 extubated low risk patients:
4 intervals: spontaneous ventilation, NIV,
spontaneous, NIV
CI & SmvO2 increased significantly with NIV
UO increased significantly
Hoffman Thorac Cardiovasc Surg 2003

5 trials: significant improvement in gas
exchange and intubation rates Rasanen Am J Cardiol 1985
Lin J Formosan Med Assoc 1991
Bersten NEJM 1991
Lin Chest 1995
L’Her ICM 2004
The latter demonstrated a reduction in
mortality with CPAP
CPAP vs. Conventional therapy

CPAP vs. BiPAP
80 patients conventional therapy; CPAP 11cm H2O vs BiPAP 17/11
CPAP/BiPAP significantly improved dyspnoea, vital signs, P/F ratios
Study stopped due to significant intubation difference 42 vs 7% CPAP & BiPAP
15day mortality higher with O2 alone p< .05
Mortality hospital discharge not different
Park CCM 2004

CPAP: Practicalities
5– 7.5cmH2O titrated to 10cmH2O
FiO2 >0.4
Contraindications
Poor cooperation
Immediate need for intubation
Caution with ++ secretions

Measure Fluid Status: SVV
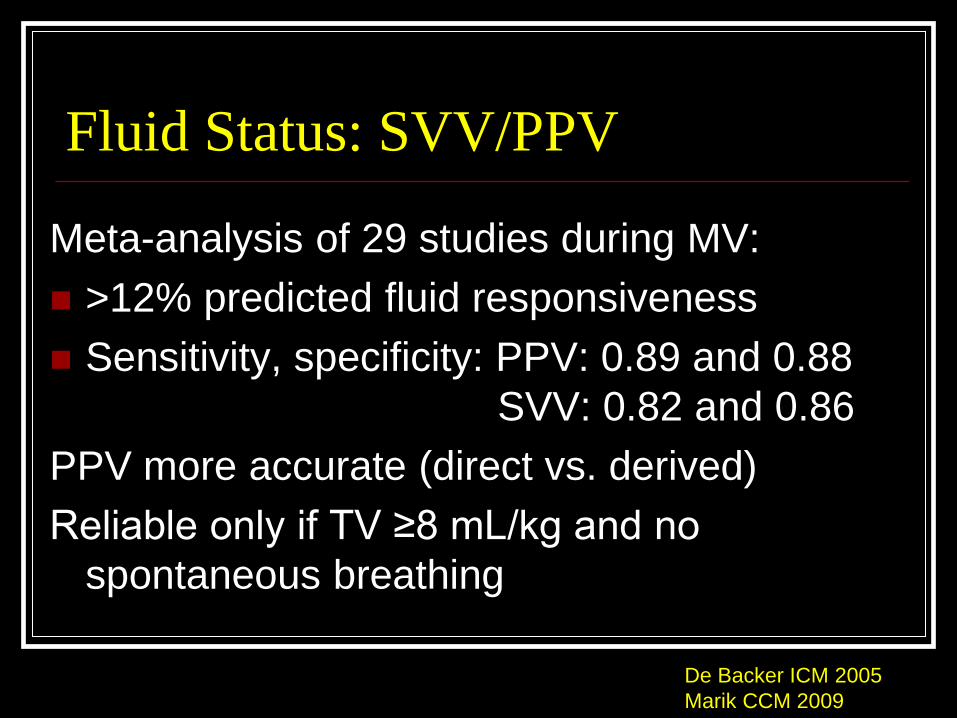
Meta-analysis of 29 studies during MV:
>12% predicted fluid responsiveness
Sensitivity, specificity: PPV: 0.89 and 0.88
SVV: 0.82 and 0.86
PPV more accurate (direct vs. derived)
Reliable only if TV ≥8 mL/kg and no
spontaneous breathing
Fluid Status: SVV/PPV
De Backer ICM 2005
Marik CCM 2009

Thermodilution Technique
Cold bolus
injection
Measurement
of thermodilution

Thermodilution Decay Curve
MTt: : Mean transit time
DSt: : Downslope time
ITTV = CO * MTt
PTV = CO * DSt
Belda FJ 26th ISICEM Brussels 2006

CO x MTt
= Vd of cold indicator
=IT Thermal Volume
CO x DSt
= Cold indicator mixing chamber
P Thermal Volume
CO x (MTt- DSt)
=GEDV
ITBV (PBV)= 1,25 x GEDV
EVLW = ITTV- ITBV
Michard Crit Care Med 2007
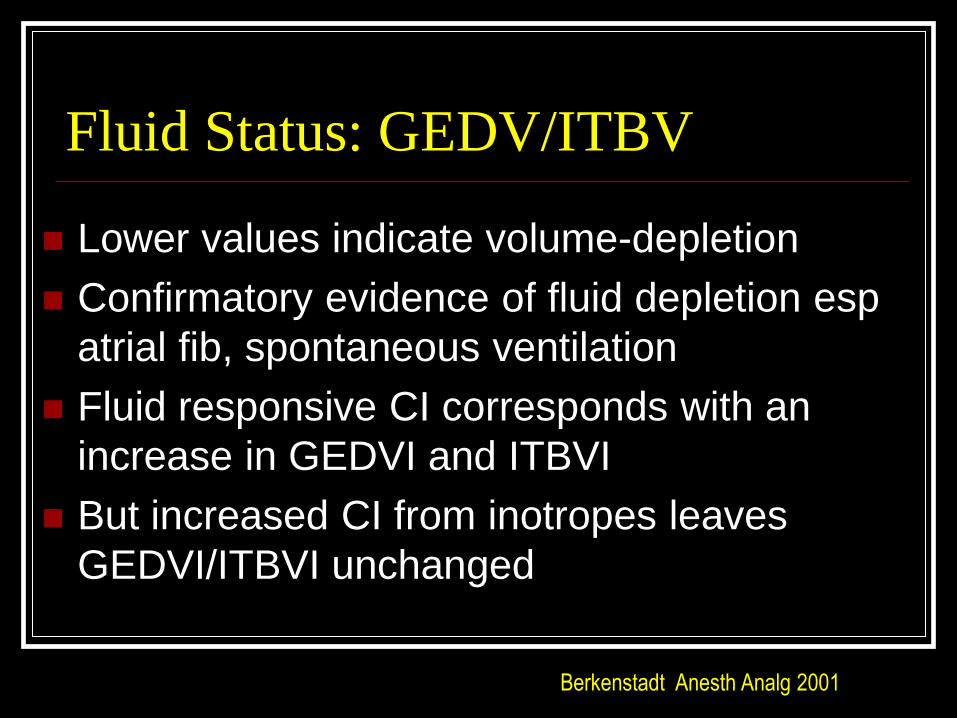
Fluid Status: GEDV/ITBV
Lower values indicate volume-depletion
Confirmatory evidence of fluid depletion esp
atrial fib, spontaneous ventilation
Fluid responsive CI corresponds with an
increase in GEDVI and ITBVI
But increased CI from inotropes leaves
GEDVI/ITBVI unchanged
Berkenstadt Anesth Analg 2001
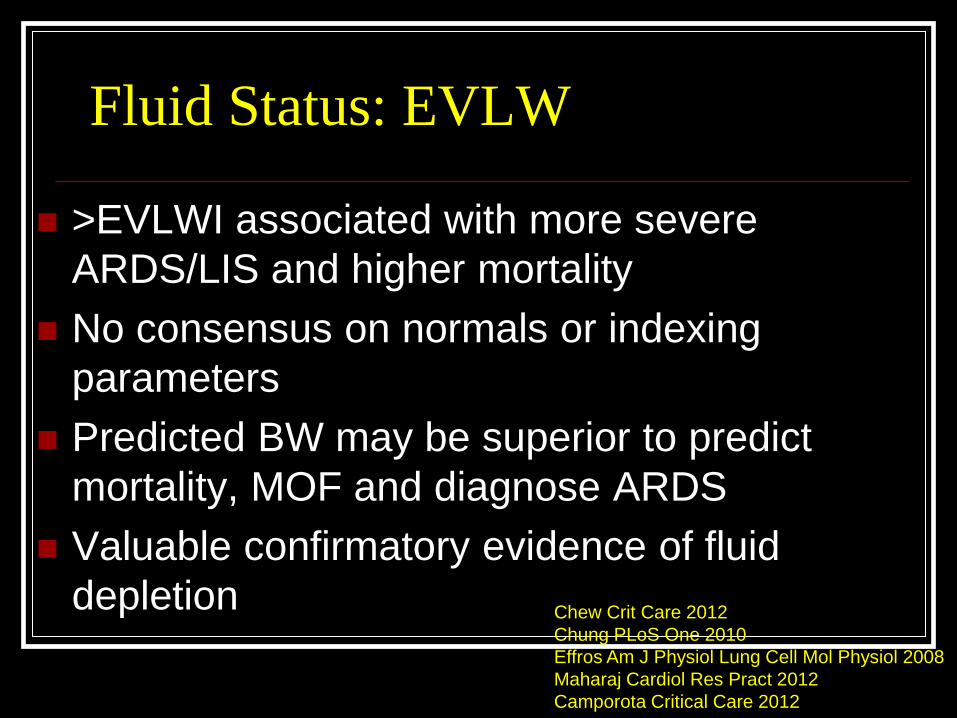
Fluid Status: EVLW
>EVLWI associated with more severe
ARDS/LIS and higher mortality
No consensus on normals or indexing
parameters
Predicted BW may be superior to predict
mortality, MOF and diagnose ARDS
Valuable confirmatory evidence of fluid
depletion Chew Crit Care 2012
Chung PLoS One 2010
Effros Am J Physiol Lung Cell Mol Physiol 2008
Maharaj Cardiol Res Pract 2012
Camporota Critical Care 2012

“Normal Values”
CI 3.0 – 5.0 l/min/m2
GEDVI 680 – 800 ml/m2
ITBI(PBV) 850- 1000ml/m2
SVV 10 %
ELWI 3.0 – 7.0ml/kg (Oedema: >10mL/kg)

Interface
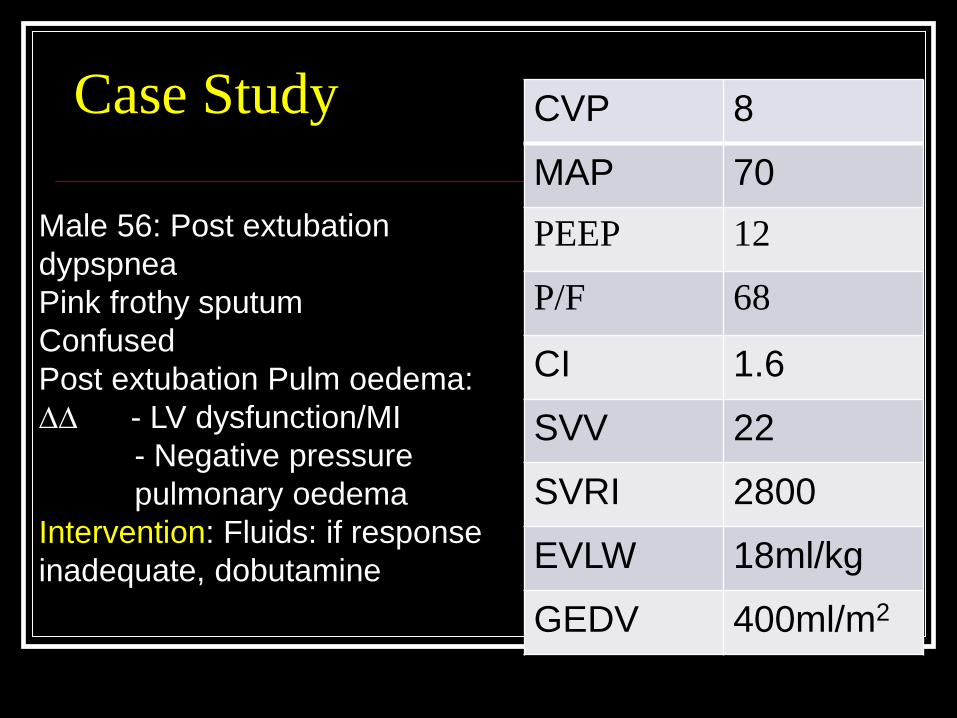
Case Study CVP 8
MAP 70
PEEP 12
P/F 68
CI 1.6
SVV 22
SVRI 2800
EVLW 18ml/kg
GEDV 400ml/m2
Male 56: Post extubation
dypspnea
Pink frothy sputum
Confused
Post extubation Pulm oedema:
∆∆ - LV dysfunction/MI
- Negative pressure
pulmonary oedema
Intervention: Fluids: if response
inadequate, dobutamine