management intensity effects on ... - vtechworks.lib.vt.edu (operational vs intensive), and planting...
TRANSCRIPT

Management Intensity Effects on Growth and Physiological Responses of Loblolly Pine
Varieties and Families Growing in the Virginia Piedmont and North Carolina Coastal Plain of
the United States
Marco Aliro Yáñez Arce
Dissertation submitted to the faculty of the Virginia Polytechnic Institute and State University in
partial fulfillment of the requirements for the degree of
Doctor of Philosophy
In
Forestry
Thomas R. Fox, Co-Chair
John R. Seiler, Co-Chair
Brian D. Strahm
Valerie A. Thomas
Christopher A. Maier
June 8, 2014
Blacksburg, VA
Keywords: Pinus taeda, ideotype, intensive silviculture, genetic by environment interaction,
varietal forestry, photosynthesis, carbon isotope discrimination.
Copyright 2014, Marco Aliro Yáñez Arce

Management Intensity Effects on Growth and Physiological Responses of Loblolly Pine
Varieties and Families Growing in the Virginia Piedmont and North Carolina Coastal Plain of
the United States
Marco Aliro Yáñez Arce
ABSTRACT
Varietal forestry may increase the productivity of loblolly pine (Pinus taeda L.) in the
Southern United Sates. However, the effects of these genetic x environment interactions are still
poorly understood. In this study we examined the responses in growth, stand uniformity and leaf
level physiology of loblolly pine clonal varieties and families to silvicultural intensity and site
effects. We also looked for patterns in observed traits that were consistent between crown
ideotypes. Two varieties of each crown ideotype (narrow vs broad crowns) and two families
(controlled mass pollinated (CMP) and open pollinated (OP) family) were tested on the Virginia
Piedmont (VA) and the North Carolina Coastal Plain (NC) under different silvicultural
intensities (operational vs intensive), and planting density (617, 1235 and 1852 trees per hectare).
Data were collected during the first four growing season after establishment. At NC, intensive
silviculture increased crown-width, height and dbh by 33%, 14%, and 23%, respectively. At
VA, intensive silviculture increased crown-width, height and dbh by 41%, 10%, and 23%,
respectively. Intensive silviculture also increased slightly but significantly the stand uniformity
of stem growth. However, the differences in productivity between silvicultural treatments were
not explained by differences in leaf-level physiology. Across all treatments and sites the
varieties generally grew faster than the OP family, but the differences were higher at VA.
Varieties did not differ in stem growth, but the broadest crown variety had greater stand
uniformity, photosynthetic rate (Asat), carbon isotope discrimination (∆13
) and lower fascicle size
than the OP family. None of the traits assessed in this study was consistent within the ideotypes.
Varieties classified in the same crown-ideotypes may respond differently to the environmental
effects of site and silviculture, which reinforces the need of matching varietal forestry with
precision silviculture to achieve gains in productivity.

iii
ACKNOWLEDGEMENTS
I thank my advisors Tom Fox and John Seiler for their invaluable support in whatever it
was needed. I will be permanently grateful for their guidance through the duration of my
program.
I also thank the members of my dissertation committee Brian Strahm, Chris Maier and
Valerie Thomas, who gently accepted to participate in this process. I would also thank many
people who helped me in the field, laboratory work, logistic and comments about my
dissertations John Peterson, Sam Frye, Sue Snow, Kathie Hollandworth, David Mitchen, Eric
Carbaug, Harold Burkhart, Ralph Amateis, Jose Stape, Clayton Alvarez and members of the
Laboratory for Interdisciplinary Statistical Analysis at VT (LISA).
I also thank to the NSF Center for Advanced Forestry Systems (CAFS) and the Forest
Productivity Cooperative (FPC) for providing the funding for my dissertation, and to the Conicyt
Program “Becas-Chile” for providing the funding to pursue this dream.
My living experience at Virginia Tech was extraordinary and unforgettable. This would
not have been possible without my wife Silvia. This is one of our most important
accomplishments, and I thank her constant love and patience in the process. I dedicate this
achievement to my daughter Sofia, son Agustin, and parents (Angelica and Aliro).
Need to be included

iv
ATTRIBUTION
This dissertation was organized under the manuscript format. Chapter 1, 2 and 3
correspond to the different manuscripts. These manuscripts will be submitted for publication.
Possible journals are Forest Ecology and Management (Chapter 1), Forest Science (Chapter 2)
and Tree Physiology (Chapter 3). These manuscripts will be revised before submission. The co-
authors for these publications will be Thomas R. Fox and John R. Seiler.
Thomas Fox and John Seiler are currently professors in the Department of Forestry at
Virginia Tech, co-chairs for this dissertation. Thomas Fox is co-principal investigator for one of
the grants supporting the research (CAFS project 80.01/FPC RW 20). Tom and John helped
with the strategies of sampling, analysis, writing, and editing of each of the chapters.
v
TABLE OF CONTENTS
ACKNOWLEDGEMENTS ......................................................................................................................... iii
ATTRIBUTION ........................................................................................................................................... iv
LIST OF TABLES ...................................................................................................................................... vii
LIST OF FIGURES ...................................................................................................................................... x
GENERAL INTRODUCTION ..................................................................................................................... 1
REFERENCES ......................................................................................................................................... 9
CHAPTER 1. EARLY GROWTH RESPONSES OF LOBLOLLY PINE VARIETIES AND FAMILIES
TO SILVICULTURAL INTENSITY IN THE VIRGINIA PIEDMONT AND NORTH CAROLINA
COASTAL PLAIN IN THE SOURTHERN USA...................................................................................... 14
ABSTRACT ............................................................................................................................................ 14
INTRODUCTION .................................................................................................................................. 15
METHODS ............................................................................................................................................. 18
RESULTS ............................................................................................................................................... 24
DISCUSSION ......................................................................................................................................... 28
TABLES AND FIGURES ...................................................................................................................... 37
REFERENCES ....................................................................................................................................... 50
CHAPTER 2. STAND UNIFORMITY OF LOBLOLLY PINE VARIETIES AND FAMILIES IN THE
VIRGINIA PIEDMONT AND NORTH CAROLINA COASTAL PLAIN ............................................... 56
ABSTRACT ............................................................................................................................................ 56
INTRODUCTION .................................................................................................................................. 57
METHODS ............................................................................................................................................. 60
RESULTS ............................................................................................................................................... 66
DISCUSSION ......................................................................................................................................... 69
TABLES AND FIGURES ...................................................................................................................... 78
REFERENCES ....................................................................................................................................... 90
CHAPTER 3. CHANGES IN LOBLOLLY PINE NEEDLE PHYSIOLOGY AND MORPHOLOGY:
RESPONSE OF VARIETIES AND FAMILIES TO SILVICULTURE AND SITE. ................................ 95
ABSTRACT ............................................................................................................................................ 95
INTRODUCTION .................................................................................................................................. 96
METHODS ........................................................................................................................................... 100
RESULTS ............................................................................................................................................. 105
DISCUSSION ....................................................................................................................................... 108

vi
TABLES AND FIGURES .................................................................................................................... 118
REFERENCES ..................................................................................................................................... 133
SUMMARY AND FINAL REMARKS ................................................................................................... 140
vii
LIST OF TABLES
CHAPTER 1
Table 1. Parents of the six genotypes assessed. Genotypes C1, C2, C3, and C4 correspond to the
varieties; OP; open pollinated family; CMP; control mass pollinated family. A, B, C, D and E
are arbitrary codes representing the pedigree of the parents. ........................................................ 37
Table 2. P-values from the analysis of variance for loblolly pine diameter at breast height (dbh),
height, crown width, and height to base of the live crown (HTLC). To meet the assumptions of
the analysis of variance, the variables height, dbh and HTLC were transformed using a natural
logarithm. ...................................................................................................................................... 38
Table 3. Loblolly pine crown width and height to the base of live crown (HTLC) at age 4 as
influenced by genotypes, site (NC=North Carolina Coastal Plain, VA=Virginia Piedmont) and
silvicultural intensity. Same letters in the columns indicates no significant difference (P-
value<0.05) among the genotypes according to the Tukey’s means comparison method.
Genotypes C1, C2, C3, and C4 correspond to the varieties; OP; open pollinated family; CMP;
control mass pollinated family. ..................................................................................................... 39
CHAPTER 2
Table 1. Parents of the six genotypes assessed. Genotypes C1, C2, C3, and C4 correspond to the
varieties; OP; open pollinated family; CMP; control mass pollinated family. A, B, C, D and E
are arbitrary codes representing the pedigree of the parents. ........................................................ 78
Table 2. Least-squares means values for loblolly pine DBH, height (HT) and stem volume (Vol)
by site (NC=North Carolina Coastal Plain, VA=Virginia Piedmont) and genotype (varieties C1,
C2, C3 and C4; CMP family, OP family) for the full and reduced data sets. The differences in
the parameters between datasets are expressed in percentage relative to the full dataset. ........... 79
viii
Table 3. Mean values for loblolly pine stand uniformity parameters and stand volume in North
Carolina (NC) and Virginia (VA) site for the full and reduced data sets. The differences in the
parameters between datasets are expressed in percentage relative to the full dataset. ................. 80
Table 4. Coefficients of correlations between loblolly pine stand uniformity parameters at the
North Carolina (NC) and Virginia (VA) site for the full dataset. ................................................. 81
Table 5. Coefficients of correlations between loblolly pine stand uniformity parameters at the
North Carolina (NC) and Virginia (VA) site for the reduced dataset. .......................................... 82
Table 6. P-values from the multivariate analysis of variance for the uniformity parameters on
loblolly pine diameter atbreast-height (DBH), total height (HT), and tree volume (Vol). ........... 83
Table 7. Least-squares means for stand uniformity parameters at the North Carolina (NC) and
Virginia (VA) site as influenced by genotype for the reduced data sets. For a given parameter,
and within each site, same letters indicates no significant difference (P<0.05) among the
genotypes according to the Tukey’s means comparison method. ................................................. 84
Table 8. P-values from the univariate analysis of variance on stand volume for the full and
reduced data set. ............................................................................................................................ 85
Table 9. Coefficients of correlations between loblolly pine stand volume (volume/ha) and the
stand uniformity parameters at the North Carolina (NC) and Virginia (VA) site. ....................... 85
CHAPTER 3
Table 1. Parents of the six genotypes assessed. Genotypes C1, C2, C3, and C4 correspond to the
varieties; OP; open pollinated family; CMP; control mass pollinated family. A, B, C, D and E
are arbitrary codes representing the pedigree of the parents. ...................................................... 118
Table 2. P-values from the analysis of variance for light-saturated photosynthetic rate (Asat),
intrinsic water use efficiency (iWUE), carbon isotope discrimination (∆��), fascicle diameter
and number of needles per fascicle. ............................................................................................ 119

ix
Table 3. Pearson coefficient of correlation for saturated photosynthetic rate (Asat), intrinsic water
use efficiency (iWUE) and carbon isotope discrimination and the diameter to the base (D), tree
height (HT) and stem volume (Vol) per site (NC= North Carolina Coastal Plain, VA= Virginia
Piedmont). ................................................................................................................................... 120
x
LIST OF FIGURES
CHAPTER 1
Figure 1. Plot layout indicating the silvicultural treatment (whole plot), genotypes (split-plot)
and planting density (split-split plot) were randomized hierarchically within each block. The site
at North Carolina (NC) and Virginia (VA) had 3 and 4 blocks, respectively. Genotypes C1, C2,
C3, and C4 correspond to the varieties; OP; open pollinated family; CMP; control mass
pollinated family. The whole plot size was 99 by 146 m at VA and 78 by 146 m at NC. .......... 40
Figure 2. Sampled and theoretical semivariogram calculated for loblolly pine at age 4 for the
two sites (NC=North Carolina Coastal Plain, VA=Virginia Piedmont) with the raw data of height
(A) and the residual from the mixed model (B). The selected theoretical semivariogram
corresponds to the Gaussian model............................................................................................... 41
Figure 3. Least-squares means for height through time at each site (NC=North Carolina Coastal
Plain, VA=Virginia Piedmont) as affected by silvicultural treatment (operational and intensive)
and genotype (varieties C1, C2, C3 and C4; CMP family, OP family). * : significant differences
at the 0.05 level, ** : significant differences at the 0.01 level. Same letters in the bars of the inset
graph indicates no significant difference (P-value<0.05) among the genotypes according to the
Tukey’s means comparison method. The inset graph shows the differences in height among
genotypes at age 4. ........................................................................................................................ 42
Figure 4. Least-squares means for loblolly pine dbh through time by genotype (varieties C1, C2,
C3 and C4; CMP family, OP family), panel (a), and silvicultural treatment (operational and
intensive; panel (b). * : significant differences at the 0.05 level, ** : significant differences at the
0.01 level. Same letters in the bars of the inset graph indicates no significant difference (P-
value<0.05) among the genotypes according to the Tukey’s means comparison method. The
inset graph shows the differences in dbh among genotypes at age 4. ........................................... 43
Figure 5. Least-squares means for loblolly pine dbh by site (NC=North Carolina Coastal Plain,
VA=Virginia Piedmont) and genotype (varieties C1, C2, C3 and C4; CMP family, OP family). *
: significant differences at the 0.05 level, ** : significant differences at the 0.01 level. Same
lowercase and uppercase letters indicates no significant difference (P-value<0.05) among the
genotypes (according to the Tukey’s means comparison method) at the NC and VA site,
respectively. .................................................................................................................................. 44

xi
Figure 6. Least-squares means for loblolly pine crown width (panels a and b) and height to base
of live crown (HTLC, panels c and d) ) through time by genotype (varieties C1, C2, C3 and C4;
CMP family, OP family) and site (NC=North Carolina Coastal Plain, VA=Virginia
Piedmont)and silviculturral treatment (operational and intensive). * : significant differences at
the 0.05 level, ** : significant differences at the 0.01 level. ......................................................... 45
Figure 7. Least-squares means for loblolly pine crown width (panel a) and height to base of live
crown (HTLC, panel b)by site (NC=North Carolina Coastal Plain, VA=Virginia Piedmont),
genotype (varieties C1, C2, C3 and C4; CMP family, OP family) and silvicultural treatment
(operational and intensive) * : significant differences at the 0.05 level, ** : significant
differences at the 0.01 level. ......................................................................................................... 46
Figure 8. Least-squares means for loblolly pine crown width (panel a) and height to base of live
crown (HTLC); (panel b) through time by site (NC=North Carolina Coastal Plain, VA=Virginia
Piedmont) and silvicultural treatment (operational and intensive) * : significant differences at
the 0.05 level, ** : significant differences at the 0.01 level. ......................................................... 47
Figure 9. Least-squares means for loblolly pine crown width (panel a) height to base of live
crown (HTLC, panel b) over time by planting density (617, 1235, and 1852 trees/ha). * :
significant differences at the 0.05 level, ** : significant differences at the 0.01 level. ................ 48
Figure 10. Least-squares means for loblolly pine crown width by site (NC=North Carolina
Coastal Plain, VA=Virginia Piedmont), genotype (varieties C1, C2, C3 and C4; CMP family, OP
family) and planting density (617, 1235, and 1852 trees/ha). * : significant differences at the
0.05 level, ** : significant differences at the 0.01 level. .............................................................. 49
CHAPTER 2
Figure 1. Plot layout indicating the silvicultural treatment (whole plot), genotypes (split-plot)
and planting density (split-split plot) were randomized hierarchically within each block. The site
at North Carolina (NC) and Virginia (VA) had 3 and 4 blocks, respectively. Genotypes C1, C2,
C3, and C4 correspond to the varieties; OP; open pollinated family; CMP; control mass
pollinated family. The whole plot was 99 by 146 m at VA and 78 by 146 m at NC................... 86

xii
Figure 2. Example of the representation of the Gini-index and P50 calculations. The x-axis
represents the cumulative proportion of trees within the plot sorted by tree height, and the y-axis
represents the cumulative tree height at a given cumulative number of trees. In a perfect uniform
stand the Lorenz curve equals the 45° line, and deviates as the uniformity decreases. The Gini-
index is calculated as the difference between the area under the 45° line and the area under the
Lorenz curve. In the example, the Lorenz curve for one block-plot of variety C1, under planting
density of 1235 TPA at Bladen Lakes, in intensive and operational silviculture treatment is
depicted. PHT50 correspond to the cumulative tree height of the 50% of the trees. ................... 87
Figure 3. Graphical illustration of the hypothesized relationship between the uniformity
parameters (Gini=Gini index, CV=coefficient of variation, STD=standard deviation and PT50)
and stand productivity. .................................................................................................................. 88
Figure 4. Least-squares means of loblolly pine stand volume as influenced by the genotypes
across the two sites. Genotypes with the same letter indicates significant differences (P<0.05)
among the genotypes (Varieties C1, C2, C3, C4, Control mass pollinated family (CMP), and
Open pollinated family (OP) according to the Tukey’s means comparison method. ................... 89
CHAPTER 3
Figure 1. Plot layout indicating the silvicultural treatment (whole plot), genotypes (split-plot)
and planting density (split-split plot) were randomized hierarchically within each block. The site
at North Carolina (NC) and Virginia (VA) had 3 and 4 blocks, respectively. Genotypes C1, C2,
C3, and C4 correspond to the varieties; OP; open pollinated family; CMP; control mass
pollinated family. The whole plot size was 99 by 146 m at VA and 78 by 146 m at NC. ........ 121
Figure 2. Mean loblolly pine tree volume (±standard error) for each site as influenced by
silvicultural treatment (upper panel), and genotype (lower panel).(NC= North Carolina Coastal
Plain, VA= Virginia Piedmont; C1, C2, C3, C4 = clonal varieties, CMP =controlled mass
pollinated, OP= open pollinated). ............................................................................................... 122

xiii
Figure 3. Least-squares means (±standard error) for loblolly pine saturated photosynthetic rate
(Asat) as influenced by site and date (site by date interaction). * denotes significant differences at
an alpha level of 0.05, ** denotes significant differences at al alpha level of 0.01. NC= North
Carolina Coastal Plain, VA= Virginia Piedmont. ....................................................................... 123
Figure 4. Least-squares means (±standard error) for the saturated photosynthetic rate (Asat) as
influenced by genotype. Means with the same letter are not significant different at an alpha level
of 0.05. C1, C2, C3, C4 = clonal varieties, CMP =controlled mass pollinated, OP= open
pollinated). .................................................................................................................................. 124
Figure 5. Least-squares means (±standard error) for the intrinsic water use efficiency (iWUE) as
influenced by site, silvicultural treatment and date (site by silviculture by date interaction). *: it
denotes significant differences at al alpha level of 0.05, **: it denotes significant differences at al
alpha level of 0.01. NC= North Carolina Coastal Plain, VA= Virginia Piedmont. ................... 125
Figure 6. Least-squares means (±standard error) for the intrinsic water use efficiency (iWUE) as
influenced by genotype and date (genotype by date interaction). *: it denotes significant
differences at al alpha level of 0.05, **: it denotes significant differences at al alpha level of
0.01. C1, C2, C3, C4 = clonal varieties, CMP =controlled mass pollinated, OP= open pollinated.
..................................................................................................................................................... 126
Figure 7. Least-squares means (±standard error) for carbon isotope discrimination (∆��) as
influenced by genotype. Means with the same letter are not significant different at an alpha level
of 0.1. C1, C2, C3, C4 = clonal varieties, CMP =controlled mass pollinated, OP= open
pollinated. NC= North Carolina Coastal Plain, VA= Virginia Piedmont. ................................. 127
Figure 8. Relationship between intrinsic water use efficiency (iWUE) and carbon isotope
discrimination ∆13
by site and silvicultural intensity. *: it denotes significant differences at al
alpha level of 0.05, **: it denotes significant differences at al alpha level of 0.01. NC= North
Carolina Coastal Plain, VA= Virginia Piedmont. ....................................................................... 128
Figure 9. Relationship between intrinsic water use efficiency (iWUE) and carbon isotope
discrimination ∆13
for each genotype. *: it denotes significant differences at al alpha level of
0.05, **: it denotes significant differences at al alpha level of 0.01. C1, C2, C3, C4 = clonal
varieties, CMP =controlled mass pollinated, OP= open pollinated. ........................................... 129

xiv
Figure 10. Least-squares means (±standard error) for the fascicle diameter as influenced by
silvicultural treatment and genotype (silvicultute by genotype interaction). Means with the same
letter are not significant different at an alpha level of 0.05. C1, C2, C3, C4 = clonal varieties,
CMP =controlled mass pollinated, OP= open pollinated. .......................................................... 130
Figure 11. Least-squares means (±standard error) for the number of needles per fascicles as
influenced by genotype. Means with the same letter are not significant different at an alpha level
of 0.05. C1, C2, C3, C4 = clonal varieties, CMP =controlled mass pollinated, OP= open
pollinated). .................................................................................................................................. 131
Figure 12. Carbon isotope discrimination (∆��), light-saturated photosynthetic rate (Asat),
stomatal conductance (gs) and intrinsic water use efficiency (iWUE) as influenced by genotype,
fascicle diameter and number of needles per fascicle at the Virginia Piedmont (VA) site. C1, C2,
C3, C4 = clonal varieties, CMP =controlled mass pollinated, OP= open pollinated). ............... 132

1
GENERAL INTRODUCTION
Forests provide many economic and social benefits to society and have a major role in
the natural cycles of water, carbon and nutrients. The demand for forest products such as wood
and fiber, furniture, veneer, and engineered materials is increasing as the world’s population
increases. The demand for wood for bioenergy purposes is also expected to increase. Land use
patterns and policies are also changing with an increased public interest regarding sustainable
management of forests. In addition, there are increasing restrictions on the use of native forest
and fragile areas. Therefore, it is imperative to enhance forest productivity and increase yield
and quality of wood products in a sustainable manner. In many parts of the world, forest
industry relies on fast growing plantations to supply raw materials. These plantations increase
economic returns because they grow considerably faster than natural stands (Cossalter and Pye-
Smith, 2003).
There are approximately 13 million hectares of pine plantation in the southeastern United
States. Loblolly pine (Pinus taeda L.) is the dominant specie and less amount of slash pine
(Pinus ellioti Englems.) are planted (Wear and Greis, 2002). The southeast accounts for more
than 75% of the tree planting in the nation (McKeand et al., 2003). The popularity of loblolly
pine is due mainly to its rapid growth and adaptation to a wide variety of sites. Loblolly pine is
native in the southeastern Unites States, and it is distributed from Texas to Florida (Schultz,
1997). Throughout its range, the productivity of loblolly pine is closely correlated with actual
evapotranspiration that varies from 1050 mm in the south to 813 mm in the north, respectively
(Schultz, 1997). Other factors that influence productivity are temperature, solar radiation,
rainfall, soil fertility, and pathogens (Evans and Turnbull, 2005; Samuelson et al., 2010).

2
Because of its adaptability to different climatic and edaphic conditions, loblolly pine has a large
genetic variation in growth productivity and disease resistance (Wells and Wakeley, 1966).
Advances in both tree improvement and silvicultural management have substantially
improved the productivity in loblolly pine in the southern United States over the last decades
(Fox et al., 2007; Jokela et al., 2010, McKeand et al., 2006). Currently, most commercial
plantations are established with seedlings from half-sib, and full-sib families (McKeand et al.,
2008) and managed using intensive silvicultural practices (Allen et al., 2005). Varietal forestry
may further increase the productivity of the loblolly pine plantations (Wright and Dougherty,
2006). Varietal forestry has been applied successfully in species such as sugi (Cryptomeria
japonica D. Don), radiata pine (Pinus radiata D. Don), Eucalyptus grandis hybrids, Norway
spruce (Picea abies [L.] Karst), and Sitka spruce (P. sitchensis [Bong.] Carr) (Ahuja and Libby,
1993; Ritchie, 1992). In loblolly pine, the deployment of varieties might increase forest
productivity by 60-70% (Whetten and Kellison, 2010). These higher gains in productivity are
also linked with a greater stand phenotypic uniformity because varieties capture the whole
genetic variance (additive and non-additive genetic variance) (Zobel and Talbert, 1984).
However, the high cost of varietal seedlings has limited its adoption (Bettinger et al., 2009;
Wright and Dougherty, 2007). There are others social, political, and environmental concerns
affecting the adoption of varietal forestry (Bettinger et al., 2009). The successful implementation
of varietal forestry depends on suitable strategies of tree breeding, clonal testing, operational
propagation and clonal deployment (Evans and Turnbull, 2004). The production of varieties
through vegetative propagation technologies such as somatic embryogenesis currently relies on
well tested genotypes (Sorensson, 2006), which are developed by traditional breeding from
controlled crosses (Bettinger et al., 2009; White et al., 2007).

3
Silvicultural practices have evolved over the last 50 years and modern intensive
silviculture can significantly increase plantation productivity (Fox et al., 2007). Currently, the
deployment of improved seedlings combined with intensive management techniques such as site
preparation, fertilization, weed control, and density management are common practices in the
south (Fox et al., 2007; Jokela and Martin, 2000; Allen et al., 1990). The potential productivity
of loblolly pine in its native range frequently is limited by nutrient availability (Allen et al.,
1990; Fox et al., 2007; Samuelson et al., 2010). Because nutrient deficiencies, especially N and
P, are widespread in the south, fertilization is a common silvicultural practice (Albaugh et al.,
2007). Moreover, when fertilization is combined with weed control, additional increases in
productivity are possible (Jokela and Martin, 2000). The principal mechanism driving the
greater productivity is an increase in the leaf area, and consequently the light interception and
carbon capture (Albaugh at al., 1998; Campoe et al., 2013).
In loblolly pine an increase in leaf area index (LAI) of 1 unit can increase stand volume
growth in 7 m3/ha/year (Fox et al., 2007). Changes in nutrient availability can change the above-
and below grown carbon partitioning in loblolly pine. Carbon allocation above ground often
increases at the expense of the below ground carbon, particularly in the production of fine roots,
which decreases the root to shoot ratio (Albaugh et al., 1998; King et al., 1999; Litton et al.,
2007). Differences in C allocation among loblolly pine clones in response to management has
been reported by Aspinwall et al. (2011a), Stovall et al. (2012), and Tyree et al. 2009), which
highlights some of the complex interactions arising from the deployment of varieties. However,
other studies have shown that intensive management increased both above and below ground
carbon allocation (Retzlaff et al., 2001; Samuelson et al., 2004), suggesting that this ratio
remains constant under different management regimes (Adegbidi et al., 2002; Ledig et al., 1970).

4
Tree improvement and intensive silviculture may also increase stand uniformity.
Increased uniformity may contribute to higher productivity in varietal stands because more
uniform stands may increase resource use efficiency and the whole stand productivity (Stape et
al., 2010). Phenotypic uniformity may be a trait intrinsic to varietal plantations because they
capture the whole genetic variance (Zobel and Talbert, 1984), but there is some evidence
demonstrating the opposite (Aspinwall et al., 2011a). Aspinwall et al. (2011a, 2011b) analyzed
the growth and physiological responses of loblolly pine genotypes, including half-sib, full-sib
families and varieties. In general, they did not find increased uniformity in growth and
physiology related to the level of genetic uniformity. Silvicultural practices such as site
preparation, fertilization and weed control may also improve stand uniformity (Purvis, 2006).
The higher availability of soil resources decreases competition among neighboring trees and thus
increases uniformity in the stand (Boyden et al., 2008). Nilsson et al. (2002) showed some
evidence of the increase in stand uniformity due to fertilization plus irrigation in loblolly pine.
At the stand level, the establishment of mono-clonal blocks may increase the intra-specific
competition for water and nutrients among trees which might result in stands as heterogeneous as
those established with open-pollinated seedlings. This may be particularly true in heterogeneous
sites. The quality and uniformity of varietal seedlings produced through somatic embryogenesis
or rooted cuttings may be less than conventional seedlings, which may also contribute to
increased variability in clonal stands despite their genetic uniformity.
The concept of crown ideotype was developed to recognize consistent patterns observed
in tree crowns and their influence on intra-tree competition in forest stands. Ideotype is an
idealized biological model for the phenotype of a plant that is adapted to specific environmental
conditions (Dickmann, 1985). An ideotype can specify any phenotypic, biochemical or

5
physiological characteristics that are suited to management objectives (Martin et al., 2001).
Ideotypes may be defined for instance by crown architecture and wood characteristics related to
production goals, by root characteristics for phytoremediation purposes, and even aesthetic
characteristics. As a rule, easily measurable traits that are heritable and related with tree
productivity are preferred. Because crown size and leaf area are correlated with stem growth,
crown dimensions have been used to classify ideotypes of trees. Cannell (1982) described ‘crop’
and ‘isolation or competition’ ideotypes as phenotypes that are weak and strong competitors with
their neighbors, respectively. Narrow crown phenotypes correspond to crop ideotypes and broad
crown phenotypes are equivalent to competition ideotypes.
Any phenotypic trait of an individual is determined by its genetic potential (G) and the
environment (E) in which it grows (Zobel and Talbert, 1984). In a mathematical sense both
effects are non-additive, meaning that the difference in performance among genotypes may vary
depending on the environmental conditions. This results in a genotype by environmental
interaction (GxE) (Truberg and Huhn, 2000). When the GxE component is insignificant, specific
genotypes can safely be deployed over a broad range of environmental conditions. A significant
GxE could lead to shifts in the ranking of growth responses among genotypes depending on their
environment (Roth et al., 2007). In loblolly pine families, GxE interactions are small (McKeand
et al., 2006). However, there is an increasing probability of GxE interactions as genetic
uniformity increases from OP to CMP families to clones (McKeand et al., 2006). In loblolly
pine clones, genotype by site interactions (Baltunis et al., 2008, Isik et al., 2003) and genotype by
silviculture interactions (Aspinwall et al., 2011a, Stovall et al., 2011, Sabatia and Burkhart, 2012,
Tyree et al. 2009) have been observed. It may be possible to exploit these interactions to

6
maximize the forest productivity by deploying clones to specific sites and more precise
silvicultural regimes.
There is a still a poor understanding about how differences in physiological processes
such as photosynthesis, respiration, carbon partitioning, leaf area deployment, and phenology
due to genotypes and silvicultural practices ultimately impact tree growth. For instance,
differences in leaf-level physiology and carbon allocation among loblolly pine clones due to
fertilization have been reported (King et al., 2008; Tyree et al., 2009; Stovall et al., 2011; Stovall
et al., 2013). Similarly, clonal differences have been found in leaf-level physiology and canopy
processes (Emhart et al., 2007; Baltunis et al., 2008). However differences in physiological
processes have seldom been correlated with tree growth. One explanation of this poor
correlation is that productivity is measured at the level of individuals or stands, which takes
months and years, whereas physiological traits are measured on individual leaves at scales of
seconds and hours (Martin et al., 2005). A typical example is the poor correlation between
photosynthetic rate and dry matter accumulation (Cannell and Last, 1976). Nevertheless, the
study of physiological traits could help understand the growth potential of specific genotypes and
their interaction with the environment (Callister et al., 2007).
Photosynthesis is the major physiological process in plants (Lambers et al., 2008). Net
carbon gain in a tree is a function of photosynthesis and respiration (Teskey et al., 1987).
Photosynthesis increases asymptotically with intercepted photosynthetically active radiation
(Lambers et al., 2008). However, there is a considerable spatial-and temporal variation in the
light conditions within a crown (Percy, 1990). Light intensity also varies diurnally and
seasonally through the crown. This dynamic environment affects photosynthetic rates and net
carbon gain on the canopy (Pallardy, 2005). Loblolly pine varieties may differ in their ability to

7
capture light within the canopy (Emhart et al., 2007). Varieties having different crown-ideotypes
may differ not only in the amount of foliage in the crown but also the arrangement of foliage
within the crown changing light use efficiency.
The main focus of this research was to assess the interactions among site, silviculture and
genotypes on growth, stand uniformity and leaf-level physiology of loblolly pine varieties. This
dissertation is structured in three chapters:
Chapter 1. Early growth responses of loblolly pine varieties and families to silvicultural
intensity in the Virginia Piedmont and North Carolina Coastal Plain in the southern USA
Hypotheses
1) Varieties differ in their growth response to silvicultural intensity and planting density,
2) The magnitude of the growth response is associated with the size and plasticity of the crowns,
3) The differences in growth among the varieties and families are greater with more intensive
silviculture,
4) The ranking of varieties and families based on growth is the same at two contrasting sites.
Chapter 2. Stand uniformity of loblolly pine varieties and families in the Virginia Piedmont and
North Carolina Coastal Plain
Hypotheses
1) Alleviating the soil resources limitation through intensive silviculture will increase stand
uniformity, but the magnitude of the response is site-specific,

8
2) The stand uniformity is higher in varietal than non-varietal stands particularly under intensive
silvicultural systems,
3) The increased stand uniformity due to silvicultural intensity will be greater in varieties having
broad-crowns (isolated ideotypes) than narrow-crowns (crop ideotypes), which could be
attributed to a greater demand of soil resources to sustain larger canopies, and
4) Improved stand uniformity will increase stand productivity.
Chapter 3. Responses of leaf physiology and morphology of loblolly pine varieties and families
to the silvicultural intensity in the Virginia Piedmont and North Carolina Coastal Plain
Hypotheses
1) Improving soil resources by intensive silviculture will enhance leaf-gas exchange and fascicle
size of loblolly pine varieties, but the magnitude of the responses will be site-specific,
2) The sensitivity of gas exchange to environmental effects will be greater in varieties having
broad crowns (competition ideotype) than narrow crown (crop ideotype),
3) Water use efficiency measured by ∆13
correlates with leaf intrinsic water use efficiency
(iWUE) and stem growth in loblolly pine varieties and families.
9
REFERENCES
Adegbidi, H.E., Jokela, E.J., Comeford, N.B., Barros, N.F., 2002. Biomass development for
intensively managed loblolly pine plantations growing on spodosols in the southeastern USA.
Forest Ecol. Manag. 167, 91-102.
Ahuja, M.R., and Libby, W.J. 1993. Clonal forestry II. Conservation and application. Springer-
Verlag, Berlin.
Albaugh, T.J., Allen, H.L., Dougherty, P.M., Kress, L.W., King, J.D, 1998. Leaf area and above-
and belowground growth responses of loblolly pine to nutrient and water additions. Forest
Science 44, 317-328.
Albaugh, T.J., Allen, H.L., Fox, T.R., 2007. Historical patterns of forest fertilization in the
southeastern United States from 1969 to 2004. South. J. Appl. For. 31(3), 129-137.
Allen, H.L., Dougherty, P.M., Campbell, R.G., 1990. Manipulation of water and nutrients -
practice and opportunity in southern U.S. pine forests. Forest Ecol. Manag. 30, 437-453.
Allen, H.L., Fox, T.R., Campbell, R. G., 2005. What is ahead for intensive pine plantation
silviculture in the south? South. J. Appl. For. 29, 62-69.
Aspinwall, M.J., King, J.S., McKeand, S.E., Bullock, B.P., 2011a. Genetic effects on stand-level
uniformity and above- and belowground dry mass production in juvenile loblolly pine. Forest
Ecol. Manag. 262, 609-619.
Aspinwall, M.J., King, J.S., McKeand, S.E., Domec, J-C., 2011b. Leaf-level gas-exchange
uniformity and photosynthetic capacity among loblolly pine (Pinus taeda L.) genotypes of
contrasting inherent genetic variation. Tree physiology 31, 78-91.
Baltunis, B.S., Martin, T.A., Huber, D.A., Davis, J.M., 2008. Inheritance of foliar stable carbon
isotope discrimination and third-year height in Pinus taeda clones on contrasting sites in Florida
and Georgia. Tree Genetics & Genomes 4, 797-807.
Bettinger, P., Clutter, M., Siry, J., Kane, M., Pait, J., 2009. Broad implications of southern
United States pine clonal forestry on planning and management of forests. International Forestry
Review 11, 331-345.
Boyden, S., Binkley, D., Stape, J.L., 2008. Competition among eucalyptus trees depends on
genetic variation and resource supply. Ecology 89, 2850-2859.
10
Callister, A.N., Ades, P.K., Arndt, S.K., Adams, M.A., 2007. Clonal variation in shoot
respiration and tree growth of eucalyptus hybrids. Can. J. For. Res. 37, 1404-1413.
Campoe, O.C., Stape, J.L., Albaugh, T.J., Allen, H.L., Fox, T.R., Rubilar, R., Binkley, D., 2013.
Fertilization and irrigation effects on tree level aboveground net primary production, light
interception and light use efficiency in a loblolly pine plantation. Forest Ecol. Manag. 288, 43-
48.
Cannell, M., Last, T., 1976. Tree physiology and yield improvement. Academic Press, London.
Cannell, M., 1982. "Crop" and "isolation" ideotypes: Evidence for progeny differences in
nursery-grown Picea sitchensis. Silvae Genetica 31, 60-66.
Cannell, M. 1989. Physiological basis of wood production: a review. Scand. J. For. Res. 4,
459-490.
Cossalter, C., Pye-Smith, C., 2003. Fast-Wood Forestry Myths and Realities. Center for
International Forestry Research, Jakarta, Indonesia.
Dickmann, D. 1985. The ideotype concept applied to forest trees. P. 89–101 in Attributes of trees
as crop plants. Cannell, M.G.R., and Jackson, J.E. (eds.). Inst. of Terrestrial Ecol., Huntington,
England.
Evans, J., Turnbull, J., 2004. Plantation Forestry in the Tropics. Third ed. Oxford University
Press. New York.
Emhart, V.I., Martin, T.A., White, T.L., Huber, D.A., 2007. Clonal variation in crown structure,
absorbed photosynthetically active radiation and growth of loblolly pine and slash pine. Tree
physiology 27, 421-430.
Fox, T.R., E.J. Jokela, Allen, H. L., 2007. The development of pine plantation silviculture in the
southern United States. Journal of Forestry. 105 (5), 337-347.
Isik, F., Li, B., Frampton, J., 2003. Estimates of additive, dominance and epistatic genetic
variances from a clonally replicated test of loblolly pine. Forest Science 49, 77-88.
Jokela, E.J., Martin, T.A., 2000. Effects of ontogeny and soil nutrient supply on production,
allocation, and leaf area efficiency in loblolly and slash pine stands. Can. J. For. Res. 30, 1511-
1524.
Jokela, E.J., Martin, T.A., Vogel, J.G., 2010. Twenty-five years of intensive forest management
11
with southern pines: Important lessons learned. Journal of Forestry 108, 338-347.
King, J.S., Albaugh, T.J., Allen, H.L., Kress, L.W., 1999. Stand-level allometry in Pinus taeda
as affected by irrigation and fertilization. Tree physiology 19, 769-778.
King, N.T., Seiler, J.R., Fox T.R., Johnsen, K.H., 2008. Post-fertilization physiology and growth
performance of loblolly pine clones. Tree physiology 28, 703-711.
Lambers, H., Chapin III, F.S., Pons, T.L., 2008. Plant physiological ecology. Second ed.
Springer. New York.
Ledig, F.T., Bormann, F.G., Wender, K.F., 1970. The distribution of dry matter growth between
shoot and roots in loblolly pine. Botanical Gazette,131(4), 349-359.
Litton, C.M., Raich, J.W., Ryan, M.G., 2007. Carbon allocation in forest ecosystems. Global
Change Biology 13, 2089-2109.
Martin, T.A., Johnsen, K. H., White, T., L., 2001. Ideotype development in southern pines:
Rationale and strategies for overcoming scale-related obstacles. Forest Science 47:21–28.
Martin, T.A., Dougherty, P.M., Topa, M.A., McKeand, S.E., 2005. Strategies and Case Studies
for Incorporating Ecophysiology into Southern Pine Tree Improvement Programs. South. J.
Appl. For. 29, 70-79.
McKeand S., Mullin T., Byram T., White T. 2003. Deployment of genetically improved
loblolly and slash pines in the south. Journal of Forestry 101:32-37.
McKeand, S.E., Jokela, E.J., Huber, D.A., Byram, T.D., Allen, H.L., Li, B., Mullin, T.J., 2006.
Performance of improved genotypes of loblolly pine across different soils, climates, and
silvicultural inputs. Forest Ecol. Manag. 227, 178-184.
McKeand, S.E., Gerwig, D. M., Cumbie, W. P., Jett. J. B., 2008. Seed orchard management
strategies for deployment of intensively selected loblolly pine families in the southern U.S. P.
177–182 in Seed orchards, Proc. from a conf. at Umeå, Sweden, Sept 26–28, 2007, Lindgren, D.
(ed.). Epsilon Open Archive. Available online at pub-psilon.slu.se/151/01/ZProcFinalFeb08.pdf.
Nilsson, U., Albaugh, T.J., Allen, H.L., 2002. Development of size hierarchies prior to the onset
of density-dependent mortality in irrigated and fertilized loblolly pine stands. Can. J. For. Res,
32, 989-996.

12
Palardy, S., 2005. Physiology of woody plants. Third ed. San Diego, CA.
Pearcy, R.W., 1990. Sunflecks and photosynthesis in plant canopies. Annu. Rev. Plant Physiol.
Plant Mol. Biol. 41, 421-452.
Purvis, S.J., 2009. Impacts of silvicultural practices on within-stand variability of loblolly pine
(Pinus taeda) plantations. Master thesis, University of Georgia, Athens, Georgia, p.
Retzlaff, W.A., Handest, J.A., O’Malley, D.M., McKeand, S.E., Topa, M.A. , 2001. Whole-tree
biomass and carbon allocation of juvenile trees of loblolly pine (Pinus taeda): influence of
genetics and fertilization. Can. J. For. Res. 31, 960-970.
Ritchie, G.A., 1991. The commercial use of conifer rooted cuttings in forestry: a world overview.
New Forests 5, 247-275.
Roth, B.E., Jokela, E.J., Martin, T.A., Huber, D.A., White, T.L., 2007. Genotype×environment
interactions in selected loblolly and slash pine plantations in the Southeastern United States.
Forest Ecol. Manag. 238, 175-188.
Sabatia, C.O., Burkhart, H.E., 2012. Competition among loblolly pine trees: Does genetic
variability of the trees in a stand matter?. Forest Ecol. Manag. 263, 122-130.
Samuelson, L.J., Johnsen, K., Stokes, T., 2004. Production, allocation, and stemwood growth
efficiency of Pinus taeda L. stands in response to 6 years of intensive management. Forest Ecol.
Manag. 192, 59-70.
Samuelson, L.J., Eberhartd, T.L., Butnor, J. R., Stokes, T. A., Johnsen, K. H., 2010. Maximum
growth potential in loblolly pine: results from a 47-year-old spacing study in Hawaii. Can. J.
For. Res. 40, 1914-1929.
Schultz RP. 1997. Loblolly pine: the ecology and culture of loblolly pine (Pinus taeda L.).
Agricultural Handbook 713.USDA Forest Service, Department of Agriculture, Forest Servive.
Washington, D.C.
Sorensson, C., 2006. Varietal pines boom in the US South. New Zealand J. For., 34-40.
Stape, J.L., Binkley, D., Ryan, M.G., Fonseca, S., Loos, R.A., Takahashi, E.N., Silva, C.R.,
Silva, S.R., Hakamada, R.E., Ferreira, J.M.d.A., Lima, A.M.N., Gava, J.L., Leite, F.P., Andrade,
H.B., Alves, J.M., Silva, G.G.C., Azevedo, M.R., 2010. The Brazil eucalyptus potential
productivity project: Influence of water, nutrients and stand uniformity on wood production.
Forest Ecol. Manag. 259, 1684-1694.
13
Stovall, J.P., Carlson, C.A., Seiler, J.R., Fox, T.R., Yanez, M.A., 2011. Growth and stem quality
responses to fertilizer application by 21 loblolly pine clones in the Virginia Piedmont. Forest
Ecol. Manag. 261, 362-372.
Stovall, J.P., Fox, T.R., Seiler, J.R., 2013. Allometry varies among 6-Year-Old Pinus taeda (L.)
clones in the Virginia Piedmont. Forest Science 59, 50-62.
Teskey, R.O., Bongarten, B.C., Cregg, B.M., Dougherty, P.M., Hennessey, T.C., 1987.
Physiology and genetics of tree growth response to moisture and temperature stress: an
examination of the characteristics of loblolly pine (Pinus taeda L.). Tree physiology 3, 41-61.
Truberg, B., Huhn, M., 2000. Contributions to the analysis of genotype x environment
interactions: Comparison of different parametric and non-parametric tests for interactions with
emphasis on crossover interactions. J. Agronomy & Crop Science 185, 267-274.
Tyree, M.C., Seiler, J.R., Maier, C.A., Johnsen, K.H., 2009. Pinus taeda clones and soil nutrient
availability: effects of soil organic matter incorporation and fertilization on biomass partitioning
and leaf physiology. Tree physiology 29, 1117-1131.
Wear, D., and J. Greis. 2002. Southern Forest Resource Assessment. Gen. Tech. Rep. SRS-53.
USDA Forest Service. Asheville, NC.
Wells, O.O., Wakeley, P.C., 1966. Geographical variation in survival, and fusiform-rust
infection of planted loblolly pine. Forest science-Monograph 11. Society of American Foresters.
Whetten, R.W., Kellison, R., 2010. Research gap analysis for application of biotechnology to
sustaining US forests. Journal of Forestry, 193-201.
Wright, J., Dougherty, D. 2006. Varietal forestry. Forest Landonwer. September/October. 3-4.
White, T.L., Adams, W. T., Neale, D.B., 2007. Forest genetics. CABI, Wallingford.
Wright, J. and D. Dougherty. 2007. Silviculture for your varietal loblolly pine plantation. Forest
Landonwer. May/June. 26-29.
Zapata-Valenzuela, J., 2012. Use of analytic factor structure to increase heritability of clonal
progeny tests of Pinus taeda L. Chilean J. Agri. Res. 72, 309-315.
Zobel B., Talbet J., 1984. Applied tree improvements. John Wiley & Sons, New York.

14
CHAPTER 1. EARLY GROWTH RESPONSES OF LOBLOLLY PINE VARIETIES
AND FAMILIES TO SILVICULTURAL INTENSITY IN THE VIRGINIA PIEDMONT
AND NORTH CAROLINA COASTAL PLAIN IN THE SOURTHERN USA
ABSTRACT
Varietal forestry may increase the productivity and quality of loblolly pine stands.
However, little is known about the genotype by environment interaction when varieties are
established under intensive silvicultural systems. In this study we assessed growth of varieties
and families during their first four growing seasons at two separate locations. A block-plot study
with a split-split plot design was established in 2009 on the Virginia Piedmont (VA) and North
Carolina Coastal Plain (NC) of the U.S. The treatments hierarchically arranged were two levels
of silviculture (operational and intensive), six genetic entries (1 open pollinated family ‘OP’, 1
control mass pollinated family ‘CMP’ and 4 clonal varieties) and three different planting
densities (617, 1235 and 1852 trees per hectare). We measured tree height, dbh, crown width
and height to base of live crown (HTLC) annually. Across all treatments and sites the varieties
generally grew faster than the OP family, but the differences were higher at VA (20% and 33%
higher height and dbh, respectively). The CMP family generally performed between the
varieties and the OP family. There were no differences in growth among the varieties.
However, crown characteristics varied among the varieties due to site, silvicultural treatment,
and planting density. Varieties responded differently in crown width and HTLC; however this
was influenced by treatments and site, indicating that the crown development of varieties is
plastic allowing them to optimize light capture as environmental factors change. Despite
changes in crown attributes, there were no differences in stem size among the varieties. At NC,

15
intensive silviculture increased crown-width, height and dbh by 33%, 14%, and 23%,
respectively. At VA, intensive silviculture increased crown-width, height and dbh by 41%, 10%,
and 23%, respectively. Similarly, planting density had a greater effect on crown attributes than
on height and dbh. The highest planting density decreased significantly crown width (11.5%)
and increased HTLC (20%) relative to the lowest planting density. Our results demonstrate the
complex interactions among genetic and environmental effects, which may have a significant
impact on the operational gains foreseen for varietal forestry.
Keywords: loblolly pine, varietal forestry, G x E interactions, crown ideotype
INTRODUCTION
Over the last several decades, tree improvement and silvicultural management have
increased the productivity of loblolly pine (Pinus taeda L.) in the Southern United States (Fox et
al., 2007; McKeand et al., 2003; Roth et al., 2007). Volume gains of 20 to 25% have been
reported for open-pollinated families from second-generation orchards, and further increases
may be possible through the deployment of control-mass pollinated families (35-40%) and clonal
varieties (60-70%) (Whetten and Kellison, 2010). Silvicultural practices such as site preparation,
fertilization, weed control, and planting density have more than doubled the growth in loblolly
pine plantations (Allen et al., 1990; Albaugh et al., 1998; Allen et al., 2005; Amishev and Fox,
2006; Fox et al., 2007; Haywood et al., 1997; Jones et al., 2010; Jokela et al., 2010; Zhao et al.,
2012). Further increases in productivity will likely occur as traditional intensive silvicultural
practices move to precision forestry (Fisher et al., 2005).

16
The use of loblolly pine varieties may be a part of these precision forestry systems.
Planting selected varieties may increase growth and stand uniformity, help to counteract different
abiotic and biotic stresses, and increase the wood quality for specific products (Wright and
Dougherty, 2006). However, to achieve the predicted gains, varietal forestry must be linked with
intensive management systems (Allen et al., 2005; Bettinger at al., 2009). Further, matching
genotypes to specific sites and management regimes will require an understanding of the
genotype by environment (GxE) interactions (Ahuja and Libby, 1993).
The few published studies examining GxE interactions in loblolly pine have shown
inconsistent results. This may be attributed to the number of genotypes and sites tested, age of
evaluation, or whether the evaluation is on single tree plot, row plot or block plot trials. For
example, across a broad range of environmental conditions, McKeand et al. (2006) stated that
GxE interactions are not a major concern for OP and CMP families of loblolly pine. However,
Owino et al. (1977) and Roth et al. (2007) reported a considerable GxE interaction for OP and
CMP families of loblolly pine, respectively. At a stand level there is a greater probability of
GxE interaction when more genetically uniform material is deployed in more intensive
silvicultural systems (McKeand et al., 2006). Zapata (2012) did not find a strong GxE
interaction at age 5 in a large study comprising 453 loblolly pine clones tested in 16 sites in the
southeast U.S.. Likewise, Baltunis et al., (2007) found little GxE interaction of growth traits of
young loblolly pine clonal varieties across multiples sites in Florida and Georgia. However,
some studies using loblolly pine clonal varieties have shown a significant genotype by
silviculture interaction on growth traits when comparing operational versus intensive silvicultural
regimes (Roth et al., 2007; Stovall et al., 2011; Tyree et al., 2009). Aspinwall et al. (2011) and
Sabatia and Burkhart (2012) also reported a GxE interactions due to spacing on height growth.

17
The planting of varieties is usually done in monoclonal stands (Ahuja and Libby, 1993).
Monoclonal stands may be more uniform, which may increase resource use efficiency at a stand
level (Stape et al., 2010), facilitate forest management, and increase the quality and returns of the
final product (Sharma et al., 2008). To counteract some of the risks associated with planting
large monoclonal blocks it has been recommended that mosaics be established with 2 to 25
hectares per genotype (White et al., 2007). However, the null genetic variation in varietal stands
may increase the intraspecific competition among the trees reducing the productivity at a stand
level (Adams and Roberts, 2013).
Tree selection based on tree ideotypes has been suggested as a possible way to increase
screening efficiency for clonal stands (Martin al., 2001). An ideotype is defined as a model plant
phenotype grown for a particular purpose and environmental condition (Dickmann, 1985).
Understanding how ideotypes respond dynamically to silvicultural management may allow
selections and the design of silvicultural prescriptions to be ideotype-based. Crown size has
moderate genetic control (Emhart et al., 2007), and due to its strong relation with stem volume, it
may be one of the best traits for selecting ideotypes (Martin et al., 2001; Nelson and Johnsen,
2008). For example, trees exhibiting broad crowns (commonly referred to as a “competition”
ideotype) are considered more aggressive competitors for resources than narrow crown trees
(commonly referred to as a “crop” ideotype). Both types may interact differently with changing
silvicultural intensity and site conditions. For example, Tyree et al., (2009) found a narrow
crown ideotype of loblolly pine tolerated nutrient limitations better than the one with a broad
crown. Stovall et al., (2011) found that the increase of crown width due to fertilizer varied
greatly among loblolly pine varieties and responses were not associated with crown size. Sabatia
and Burkhart (2012) studied the effect of stand density on growth of two varieties exhibiting a

18
medium and a narrow crown ideotype, respectively. They found that increasing the stand density
had a greater impact on basal area increment in the medium crown ideotype than in the narrow
crown type. They attributed this to the more intensive intraspecific competition and greater
shading of the broader crown varieties.
There are uncertainties about the operational gains of varietal forestry in loblolly pine,
and many questions remain unanswered. For example, how do varieties interact with silvicultural
intensity and planting density? Are varieties with larger crowns more responsive to these
treatments? Are their growth responses consistent at different sites? To address those questions,
we investigated the early responses (first four years) of four clonal varieties, an open pollinated
family (OP) and a control mass pollinated source (CMP) family planted at three stand densities
and managed at two levels of silviculture at two sites, one on the Virginia Piedmont and one on
the North Carolina Coastal Plain. To our knowledge, no other studies have tested simultaneously
the performance of loblolly pine varieties to different silvicultural treatments, planting densities,
and sites in monoclonal plots. Our hypotheses were 1) varieties differ in their growth response
to silvicultural intensity and planting density, 2) the magnitude of the growth response is
associated with the size and plasticity of the crowns, 3) the differences in growth among the
varieties and families are greater with more intensive silviculture, and 4) the ranking of varieties
and families based on growth is the same at two contrasting sites.
METHODS
Study sites
This study was established at two sites in 2009 to assess the interactions among
genotypes (varieties and families), silvicultural intensity, planting density and site. Trials were

19
located in the North Carolina Coastal Plain (NC), at the Bladen Lakes State Forest (34º 49’
49.63’’N, 78º 35’ 18.52’’W), and at the Virginia Piedmont (VA) at the Reynolds Homestead
Forest Resources Research Center (36º 38’ 35.32’’N, 80º 09’ 18.84’’W).
The soil on the VA site was a well-drained Fairview Series (fine, kaolinitic, mesic Typic
Kanhapludults). Previously, the site supported a mixture of loblolly pine, pitch pine (Pinus
rigida L.) x loblolly pine hybrids and eastern white pine (Pinus strobus L.) stands that were
harvested in 2007 and 2008. The soil at the NC site was a poorly drained Rains series (fine-
loamy, siliceous, semiactive, thermic Typic Paleaquults). Previously, the site supported a
loblolly pine stand that was harvested in 2007. The annual average temperature and precipitation
at VA is 13 ºC and 1159.3 mm, respectively. The annual average temperature and precipitation at
NC are 16.9 ºC and 1170.7 mm, respectively (from NOAA online weather data
http://sercc.com/nowdata.html).
Experimental design
The study design is a split split-plot with 4 replications at VA and 3 replications at NC.
Two levels of silviculture (operational and intensive) were the whole plot treatments, six
genotypes (4 clonal varieties, 1 OP family and 1 CMP family) were the split-plot treatments, and
three initial planting densities (617, 1235 and 1852 trees/ha) were the split split-plot treatments
(Figure 1). The total number of plots was 144 at VA (2 silviculture treatments x 6 genotypes x 3
planting spacing x 4 replicates), and 108 at NC (2 silviculture treatments x 6 genotypes x 3
planting spacing x 3 replicates). There are no buffer rows between plots with different spacing
or varieties. The buffer between whole plots with different silvicultural treatment was at least 20
m to avoid cross-over of the fertilization effect in the adjacent whole plots.

20
Prior to planting, site preparation at VA included an aerial application of mixed solution
of Accord XRTII plus (9.3 L/ha), Milestone VM plus (9.3 L/ha), and Chopper (1.46 L/ha). The
site was then burned. Site preparation at NC included a chemical application of Chopper (2.33
L/ha), Krenite (11.6 L/ha), and Garlon (1.53 L/ha), followed by V-blade bedding on 3.66 m
centers using a Savannah bedding plow (Savannah Global Solutions, Savannah, GA).
At the end of the first growing season, seedlings that died were replanted with extra
seedlings from the same genotype that were grown in containers. This was done to maintain the
target stand density, so that the effect of mortality inter-tree competition was minimized. The
location of each tree replanted was recorded and the growth data from the replanted trees was
excluded from the subsequent analysis.
Whole plot treatment: Silvicultural intensity
At both sites, the operational silvicultural treatment was a banded weed control after
planting, with a mix of Arsenal AC (292 ml/ha) and Oust XP (146 ml/ha). At VA, in the third
growing season, a solution of Escort (55 ml/ha) was applied to control blackberry (Rubus spp.).
The intensive silvicultural treatments at both sites consisted of a broadcast weed control with a
mix of Arsenal AC (292 ml/ha), Oust XP (146 ml/ha) and Escort (18 ml/ha) in the first growing
season; Arsenal AC (292 ml/ha) and Oust XP (146 ml/ha) in the second growing season; and
Escort (55 ml/ha) in the third growing season. Tip moth control was applied after planting using
PTM insecticide (BASF Corporation) (1.5 ml/tree) in the intensive treatment. The intensive
treatment was fertilized after planting with 93 g/tree of nitrogen and 10 g/tree of phosphorus in
the form of Arborite coated urea fertilizer, which was spread around the base of each individual
seedling.

21
Split plot treatment: Genotypes
The genetic entries included one open pollinated family (OP), one control-mass-
pollinated family (CMP) and four clonal varieties (C1, C2, C3 and C4) produced through
somatic embryogenesis by Arbogen Company (Summerville, SC). All the genotypes were
Coastal sources of loblolly pine. The parents of several of the genotypes were related (Table 1).
The OP and CMP families were bare-root seedlings and the clonal varieties were containerized
seedlings.
Split-split plot treatment: Planting density
Each genotype was planted in block plots, with 81 trees/plot in a 9 by 9 arrangement at
VA and 63 trees/plot 7 by 9 arrangement at NC, at three densities: 617, 1235 and 1852 trees/ha.
The spacing between rows in all the planting densities was held constant at 3.66 m with distance
between trees within a row varying from 4.42, 2.21 and1.47 m in the low, medium and high
density, respectively.
Growth variables
To avoid any edge effect, measurements were taken in a 5 by 5 tree internal plot. Tree
height was measured each January for the first four growing seasons. Diameter at breast height
(dbh) (measured at 1.37 m from the ground), crown diameter, and height to base of live crown
(HTLC) were measured annually in January starting at the end of the second growing season.
Crown width was measured parallel and perpendicular to the planting row, and the average was
used for analysis. We used digital calipers to measure dbh and a Philadelphia rod to measure
heights, crown width, and HTLC. Tree condition including mechanical damage, insect or
diseases was measure annually. An evaluation of the microsite of each seedling was made in the
22
first growing season to describe bed quality, soil compaction due to skid trails and
microtopography affecting soil drainage.
Statistical analysis
Growth responses were analyzed using analysis of variance. Average responses at both
tree level and stand level were obtained in the 5 by 5 tree interior plot. At VA, trees impacted by
a skid trail from the last harvest were removed from the analysis. At NC we removed trees that
were obviously affected by microsite conditions on the planting spot due to the poor-quality
beds. In total 97.5% of the trees were used for the analysis at both sites. The analyses of
variances were performed using PROC MIXED of SAS version 9.2 (SAS Institute, Cary, North
Carolina, USA). When necessary a logarithmic transformation was used to meet the assumption
of normality and constant variance.
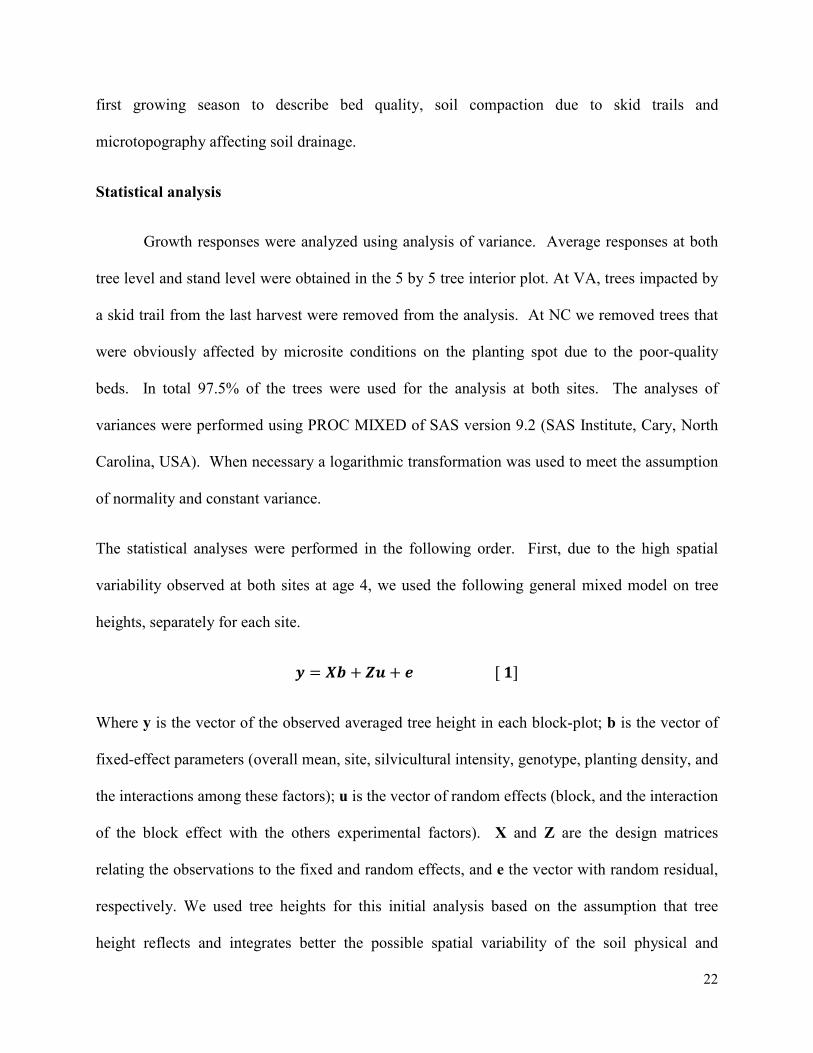
The statistical analyses were performed in the following order. First, due to the high spatial
variability observed at both sites at age 4, we used the following general mixed model on tree
heights, separately for each site.
� = �� + + �[�]
Where y is the vector of the observed averaged tree height in each block-plot; b is the vector of
fixed-effect parameters (overall mean, site, silvicultural intensity, genotype, planting density, and
the interactions among these factors); u is the vector of random effects (block, and the interaction
of the block effect with the others experimental factors). X and Z are the design matrices
relating the observations to the fixed and random effects, and e the vector with random residual,
respectively. We used tree heights for this initial analysis based on the assumption that tree
height reflects and integrates better the possible spatial variability of the soil physical and
23
chemical properties in young trees. Then, we examined the spatial continuity of the raw data and
residuals at both sites as was suggested by Brownie and Gumpertz (1977). To explore the spatial
continuity we calculated the sampling semivariogram on both the raw data of heights and the
residual. We modeled three theoretical semivariogram models (spherical, Gaussian, and
exponential) with the selected model chosen based on the Akaike information criteria (AIC).
The semivariogram calibrations were performed in PROC VARIOGRAM of SAS 9.2. Although
we found a significant spatial continuity in the raw data of tree heights, this was not present in
the residuals (Figure 2). Therefore, we decided there was no need to account for the spatial
variation in further analysis (Gilmour et al., 1997).
Second, because our interest was to explore the stability of the genotypes and silvicultural
treatments among sites as well as the trends in time, the split-split plot design analysis at each
site was expanded to a multi-location analysis with repeated measurements. Using the same
notation presented in equation 1, the general mixed model for growth traits included a vector y
with the observations; b is the vector of fixed-effect parameters (overall mean, site, silvicultural
intensity, genotype, planting density, age, and the interactions among these factors). We
constrained the model to third-order interactions, with the exception of the fourth-order
interaction site x silvicultural intensity x genotype x age. Other high order interactions were
pooled in the error term (Kutner et al. 2005); u is the vector of random effects (block within site,
and the interaction of the block effect with all the others experimental factors). X and Z are the
design matrices relating the observations to the fixed and random effects, and e is vector of
random residual terms, respectively. The assumption of equal variance between the sites in e
was not met for all the traits. Therefore, we allowed heterogeneous variances of the residuals
(R1 and R2) among the sites in the modelling. To account for the temporal correlation due to the
24
repeated measurements on R1 and R2, the modeling of the first-order autoregressive matrix
structure AR(1) was contrasted with the independent and identical distributed error structure
(IDD). The model selection was based on the AIC and Bayesian information criteria (BIC).
Where significant model effects were observed (P-Value<0.05), post-hoc means comparisons
were made on the back-transformation of the least-squares means using Tukeys’s comparison
test.
RESULTS
There was a fourth order interaction (site x silvicultural intensity x genotype x age) for
tree height (Table 2, Figure 3). Differences in tree height among the genotypes were observed at
age 1 and 2 at both sites. Those differences disappeared by age 4 at NC but continued through
age 4 at VA (Figure 3). In VA, at age 4 variety C2 were tallest in the operational treatment (21%
taller than the average of the families), while variety C4 was the tallest in the intensive treatment
(18% taller than the families) (Figure 3). At age 4, and across all the genotypes, the intensive
treatment increased height (relative to the operational treatment) by 14% and 10% at NC and
VA, respectively. Overall, height was 14% higher at VA compared to NC.
For dbh, second-order interactions were found for site x age, silviculture x age, and
genotype x age (Table 2). Differences in dbh between the genotypes were observed early at age
2, and increased through age 4 (genotype x age interaction) (Figure 4a). At age 4, varieties C2
and C4 had greater dbh than the OP and CMP families (p<0.05), while variety C1 and C2 ranked
in the middle (Figure 4a). The intensive treatment significantly increased dbh by 23% compared
to the operational silvicultural treatment at age 4, with increasing differences between the two
treatments through time creating the silviculture x age interaction (Figure 4b). There were no
differences in dbh between the two sites, except at age 3 (dbh was 24% greater at VA than NC,

25
p-value=0.0329) which created the site x time interaction. There was also a significant site x
genotype interaction on dbh (Table 2, Figure 5). All the varieties had a higher dbh at VA (25%
over NC), whereas the OP and CMP families had a similar dbh at both sites. At VA, the mean
dbh of the varieties was 33% greater (p<0.05) than the mean dbh of the families. At NC the
mean dbh of the OP family was significantly lower (p<0.05) than the CMP family and variety C1
and C2.
Crown attributes were more sensitive to the effect of site, genotype, silvicultural
intensity, age and planting density than height or dbh, demonstrating the complex dynamics of
crown growth. There were significant three-way interactions for site x genotype x age and
silviculture x genotype x age on crown width (Table 2, Figure 6a and 6b). Although most of the
genotypes had a higher crown width at VA relative to NC, only variety C4 was significantly
different (Figure 6a). At NC, at age 4, variety C3 had a significantly narrower crown (Table 3,
Figure 6a). At VA, variety C4 had the broadest crown, followed by variety C2, and then the
genotypes with narrower crowns C1, C3 and the CMP family (Table 3). The crown width of the
OP family increased relatively more than did the crown width of the varieties through time,
highlighting the existence of genotype by age interactions (Figure 6a). In contrast the CMP
family retained its relative ranking compared to the OP family and the varieties.
The crown width of all the genotypes increased in the intensive silvicultural treatment
(Figure 6b). In the intensive treatment only variety C4 (broadest crown width) differed
significantly from the other genotypes (16% higher crown width) (Table 3). At age 4, on both
operational and intensive silvicultural treatment genotypes were grouped in two clusters, the
narrower crown genotypes (C1, C3 and CMP) and the broader crown genotypes (C2, C4, and
OP). Although all genotypes increased crown width with intensive silviculture, the significance

26
of the site x silviculture x genotype interaction (p=0.044, Table 2, Figure 7) was mostly due to
the greater response in crown width of the variety C4 to the intensive silviculture at VA.
There was also a significant site x silviculture x age interaction on crown width (Table 2,
Figure 8). Initially, although there were some differences in crown width between the
operational and intensive silvicultural treatments, they were small at both sites. However, at
age 4, the response in crown width to the intensive silviculture treatment was 33% and 41%
greater than the operational silviculture treatment at NC and VA, respectively.
There was significant third-order interaction for site x genotype x age and silviculture x
genotype x age on HTLC (Table 2, Figure 6c and 6d)). At age 2, the genotypes had similar
HTLC at both sites, although variety C1 had greater and the CMP family had smaller HTLC at
NC (Figure 6c). At age 3, all the genotypes had higher HTLC at VA than NC, which persisted
only in a few genotypes (C1, C2, and C3) at age 4. At age 4, variety C2 had 65% and 70%
higher HTLC than the other genotypes at NC and VA, respectively (Table 3, Figure 6c). At both
sites, the OP family had the lowest values for HTLC.
Three main facts explain the the silviculture x genotype x time interaction on HTLC
(Table 2, Figure 6d). First, the families were not significantly influenced by the intensive
silvicultural treatment until age 4, while the varieties responded at age 2. Second, the varieties
had significantly lower HTLC in the operational than the intensive treatment at age 2, which is
reversed at age 3 and 4 (Figure 6d). Third, in both silvicultural treatments, variety C2 had a
greater HTLC relative to the other genotypes at age 4 (Table 3), and additionally it had a greater
response to the silvicultural treatment (HTLC was 40% lower in the intensive silviculture).
There was also a significant site x silviculture x genotype interaction on HTLC (p=0.002, Table
27
2, Figure 7). Variety C4, which had the greater response in crown width to the intensive
treatment, did not show response in HTLC at either of the sites. For the other genotypes, the
effect of silviculture on HTLC was evident mostly at VA, with an increase of HTLC due to the
operational silvicultural treatment. Variety C2 was more sensitive to silvicultural intensity for
this trait. Figure 7b shows the mean HTLC per site, silvicultural treatment. The operational
treatment significantly increased HTLC at age 4 at NC, and since age 3 at VA, which made the
site x silviculture x age interaction significant (p=0.023, Table 2) (Figure 8). At age 4, HTLC
was higher in the operational than in the intensive treatment by 32% and 48% for NC and VA,
respectively.
Effect of planting density on stem size and crown attributes
Crown attributes were more affected by the planting density than stem size, although we
found a significant main effect of planting density for tree height and dbh (Table 2). However,
although these main effects were statistically significant, the differences were actually quite
small. Tree height was significantly higher at the medium density (1235 trees/ha), but this was
only 6 cm taller than the height at the other planting densities. At the highest planting density
(1852 trees/ha) dbh was significantly less relative to the other planting densities, but the
difference was only 3 mm. There was a significant planting density x age interaction for crown
width and HTLC (Table 2, Figure 9). At age 4 years, in both traits there were significant
differences among all planting densities. That did not exist at earlier ages. Increasing the
planting density decreased crown width and increased HTLC (Figure 9a and 9b, respectively),
which tended to decrease the size of the crown. There was a significant site x genotype x
planting density interaction for crown width, but not for HTLC (Table 2) (Figure 10). At VA,
crown width decreased as planting density increase for all the varieties and families, but it was

28
significant only for the variety C2 and C4. At NC, the pattern was not consistent and crown
width in the OP family was greater at the 1235 trees/ha spacing than at either the 617 or 1852
trees/ha spacing (Figure 10). The crown width of variety C1, C2 and the CMP family were
significantly decreased as the planting density increased.
DISCUSSION
Some studies in loblolly pine demonstrate the genetic potential of adopting varietal
forestry as a means to increase forest productivity (Isik et al., 2003; Baltunis et al, 2007; Zapata
2012). However, to our knowledge few studies in loblolly pine have addressed the interaction
between varieties and silvicultural treatments at a stand level. The analytical approach we used
in this block-plot study allowed us to evaluate complex interactions between the treatment
combinations even at this early stage of stand development.
The growth traits measured at VA were similar to what has been reported in a previous
clonal test by Stovall et al. (2011); however, growth at NC was poorer compared to other studies
in the Coastal Plain (Aspinwall et al., 2011; Baltunis et al., 2007; Zhao et al., 2011). Greater
productivity at NC relative to VA was expected because of higher temperatures, lower elevation
and a longer growing season (VanderShaaf and Prisley, 2006). However, this was not the case,
at least through age 4.
We examined our data for the existence of any spatial trend on tree height at age 4
years. We assumed tree height to be an intrinsic integrator of the soil quality as site index does
(Avery and Burkhart, 2002). Overall, the variability and spatial dependence in tree height was
greater at NC than VA (Figure 2). This suggests that the NC site was more heterogeneous than
VA. This may also suggest that tree growth was conditioned to some gradient in the soil

29
properties at larger distances at NC than VA. In both sites it is possible to find a large spatial
variability in the soils properties. In the Piedmont, the topography is irregular and soils are
highly eroded from past agricultural practices, which created variation in the properties of the top
soils (Thomas et al., 1989; Sherwood et al., 2010). In the Coastal Plain, soils are poorly drained,
and small differences in topography may create relatively large variation in the soil water content
(Pritchett and Gooding, 1975). We speculate that the greater spatial variation seen at NC was
due to these differences in microtopography and variability in the soil moisture. This variability
in the soil moisture due to the high water table is typical in the lower Coastal Plain and is the
critical factor affecting productivity (Miwa et al., 2004). Although, bedding was used to correct
the problem of poorly drained soils, variability in the bedding quality may have resulted in a
generally more heterogeneous site at NC. We observed very poor growth of trees planted in
microtopographic depressions where the beds were poorly formed. As the stand develops and
leaf area of the trees increases, ET will increase which will likely lower the water table at NC
(Aust and Blinn, 2004). This could lead to an increase in growth later in the rotation (Kyle et al.,
2005; Wilhite and Jones, 1981).
We did not find significant differences in height or dbh among the varieties. However,
varieties had consistently greater stem growth than the OP family, while the CMP family always
ranked somewhere between varieties and the OP family. This may be attributed to increased
genetic improvement and uniformity (Baltinus et al., 2007; Whetten and Kellison, 2010). The
differences in height and dbh of the varieties versus the families were greater in VA, where
overall growth was better. This suggests that the performance of varieties will be greater on
better sites as has been suggested by McKeand et al. (1997). The performance of the varieties
relative to the OP and CMP family at VA is somewhat surprising since all the genotypes are

30
Coastal sources of loblolly pine, and the site at VA is located in the Piedmont in the Northern
limit of the species distribution. This provides additional evidence that the productivity of these
genotypes at NC was likely decreased by the high water table.
The growth of varieties has not always been found to be superior. For instance, in a 3-
year study testing 10 genotypes of contrasting inherent genetic uniformity, Aspinwall et al
(2011) found that some CMP families were taller than some varieties and dbh was greater in 2
CMP families and 1 OP family relative to some varieties. Similarly, Sabatia and Burkhart
(2012) compared the increment in basal area of two varieties and an OP family, all of them
sharing the same mother, and established at two planting density (680 and 1360 trees per
hectare). Their findings showed that one of the varieties performed similarly as the OP family at
both planting densities; whereas, the other variety had greater basal area increment than the OP
family but only in the lower planting density. Those contrasting results reinforce the need for
further testing and understanding of the GxE interaction before varietal forestry can be used
successfully.
Overall, the intensive silvicultural treatment significantly increased dbh, and to a lesser
extent tree height. This effect was detected as early as age 2. Zhao et al. (2011) also found a
large effect of intensive silviculture on dbh at early age (45% higher dbh over the operational at
age 4), but only a small impact on tree height. They used one OP family in all the installations.
Significant responses of selected genotypes under intensive silviculture has also been reported
for loblolly pine families, but the magnitude of those responses varied by site (Chmura et al.,
2007; Martin and Shiver 2002; Roth et al., 2007; Wagner et al., 2006). This agreed with our
results, which showed a larger response of the genotypes at the VA site than the NC site. The
intensive treatment included repeated weed controls and fertilization. Intensive silviculture

31
increased resource availability (Fox et al., 2007), but the growth response depends on soil
properties and the degree of nutrient deficiencies that exist (Haywood and Burton, 1990). The
excess soil moisture at the poorly drained site in NC likely decreased the response to the weed
control and fertilization. The response to intensive silviculture will likely increase as the leaf
area expands and increases evapotranspiration, which will decrease the water table.
The crown attributes of the varieties were more sensitive to the effects of site,
silvicultural management, and planting density than the stem growth suggesting greater plasticity
in crown shape in the varieties, at least at an early stage. Wide crowns are associated with
horizontal expansion of the branches that determines how fast the trees occupies its individual
growing space; while lower HTLC’s are associated with less branch mortality in the base of the
crown. At age 4, variety C1 and C3 had narrower crowns, and responded similarly in crown
width and HTLC across the treatments (site, silviculture, and planting density). Compared with
the varieties, the OP and CMP family tended to have low to medium-size crowns. Variety C4
developed the largest crowns (broadest crown width and lower HTLC) followed by C2
(intermediate crown width and highest HTLC), both exhibiting larger differences in the response
to site and silvicultural intensity. These results suggest that variety C1 and C3 are closer to the
definition of a crop ideotypes; whereas C4 behaves as a competition ideotype (Cannell, 1982).
The response in crown width and HTLC for the varieties C2 and C4 suggest that these two broad
crown varieties may differ in some physiological processes at crown level. The HTLC in C2 was
much greater than in C4 indicating that greater branch mortality occurred at comparable levels of
shading in C2. This suggests that the two varieties could acclimate to shade differently, affecting
the branch carbohydrate economy and its relation with HTLC (Sprugel, 2002). When the lower
canopy becomes shaded relative to the upper crown, needles acclimate to increase the light
32
interception (Will et al., 2001). This result is a decreasing gradient in foliar N, light-saturated
photosynthetic rates (Asat) and light compensation points from the top to the bottom of the crown
(Lambers et al., 2008, McGarvey et al., 2004). In a separated study (unpublished data) we did
not find differences in the light-saturated photosynthetic rate (Asat) between the two varieties (C2
versus C4) nor between the lower and upper crown (mean Asat of 5.3 µmol/m2/s) during the 4
th
growing season. Average foliar N concentration was higher in the upper crown (1.43%) than the
lower crown (1.2%), with no differences among these varieties. At the moment of the
measurements, the foliage used was fully sun exposed, but taller trees may have experienced
some shading in the lower crown during the day depending of the zenith, which may induce
some changes in leaf morphology and biochemistry, and may help to explain the high branch
mortality of variety C2 compared to variety C4. Based on Asat and the foliar nitrogen, it does not
seem that the current foliage in the lower crown experienced any acclimation. However, sunlit
foliage was chosen so it is possible that foliage farther back on the branch may have acclimated
differently among varieties. Similar results have been found for young pine plantations by
McGarvey et al. (2004). However, there may be differences in the light compensation point, or
differences in the acclimation of the older foliage among the two varieties, as was found by Yang
et al. (2002). Differences in foliage density among the genotypes may also help to explain
differences in the photosynthetic efficiency with the canopy depth, which require further
research.
To our knowledge, there are no published studies comparing crown development in
loblolly pine varieties with different crown ideotypes, although there are some studies with
families. For instance, Adams and Roberts (2013) studied the stand dynamic of loblolly pines
families, exhibiting large and narrow crown ideotypes, in pure (trees of a single family) and in
33
mixed (trees of different families) planting blocks at age 21 years. The families were previously
selected for growth rate and classified into ideotypes based on crown width. Contrary to what
was expected, narrow crown families had higher crown ratios [(total height-HTLC)/total height]
than the broad crown families. Crown ratio in two of the most productive families (one narrow
and one broad crown family) were not altered when planted in either pure or mixed plots,
indicating that they limited the mortality of the lower branches. This result demonstrates the
plasticity of the crown characteristics and the potential genetic differences, even within each of
the crown ideotypes. Possibly, HTLC is a trait expressed differently than crown width, and
might be considered in the definition of crown ideotypes (Adams and Roberts (2013). This is
supported by the moderately low coefficient of correlation between crown width and HTLC
(r=0.49 at Bladen, r=0.33 at VA).
Crown characteristics have moderate genetic control, but they are also very responsive to
the local environmental conditions (Emhart et al., 2007). In our study, the genetic effect is
supported by the consistency of the varieties in the crown attributes. However, the responses to
environmental effects at NC and VA tended to be better exploited by competitor ideotypes or
those with large crowns (Cannell, 1982). These effects have been shown in other studies.
Chmura et al. (2009) studied the crown shape of two loblolly pine families at different sites at
age 5; they found significant differences in the crown shape of a single family on different sites
concluding environmental effects had a greater impact on the crown traits. Similarly, intensive
silviculture significantly increased the size of the crown (increasing crown width and decreasing
HTLC) in all the genotypes, but its effect was greater in the broad crown varieties. This
indicates that fertilization and weed control in the intensive silvicultural treatment increased the
available resources for crown development. The presence of weeds was higher at VA

34
(particularly Rubus spp) than NC. This competition by weeds likely reduced the soil resources in
the operational silvicultural treatment and consequently the crown development as is shown in
figure 8. Moreover, the increasing effect of the silvicultural treatment on the crown attributes
with age suggests that silviculture altered the rate at which these processes occurred. Contrarily,
Tyree et al. (2009) found that the response to fertilization of a narrow crown variety was greater
than the broad crown variety, which was attributed to specific differences among the varieties in
canopy architecture and lower below ground maintenance.
This sensitivity of crown traits to silviculture agrees with previous studies (Albaugh et
al., 2006; Weiskittel et al., 2007). Intensive silviculture increases the branch longevity in our
young stands, which is opposite to the results of Albaugh et al., (2006) in a 13-year-old loblolly
pine experiment. They found fertilization decreased branch longevity by one year on average.
The difference between these studies may be related to the age of the stands. Older stands under
fertilization may have greater crown density (Albaugh et al., 2006), which may increase the
shading in the lower branches and increase lower branch death.
The increased demand for resources in larger crowns may explain the higher
responsiveness of variety C2 and C4 to intensive silviculture relative to the other varieties,
although this high responsiveness was not necessarily expressed in greater allocation to the stem,
as we hypothesized. This also results in lower growth efficiency (stem to crown carbon
allocation ratio) in broad crown varieties. However, these trends may change later in the rotation
after canopy closure. Chmura et al. (2007) found clear differences in crown shape only before
the onset of the canopy closure, such as in our study, but once the intra-competition among
neighboring trees starts those differences disappeared. The combined effect of resource
availability on crown traits was evident by the effect of the planting density at age 4. The greater

35
intraspecific competition in the highest planting density decreased crown width and increased
lower branch mortality (higher HTLC). This effect was significant and consistent for the broader
crown varieties (C2 and C4) at VA, but with different effects among the genotypes at NC.
Possibly effects are different at NC due to the overall reduced growth and results may become
more consistent in the next few years.
Sabatia and Burkhart (2012) found greater intraspecific competition in broad crowns
relative to the narrow crowns. There is likely an adjustment in the crown morphology as a
primary effect of competition for resources, followed by a response in stem growth. In this study
the planting density is already affecting the crown attributes and to a lesser extent the stem
growth. Hence the effect of planting density on stem growth should increase in the future. Other
studies in loblolly pine suggest that the effect of planting density on stem growth may appear at
age 3-5 years (Aspinwall et al., 2011; Carlson et al., 2009; Harms et al., 2000; Zhao et al., 2011).
Overall, the responses of the varieties to silvicultural intensity were similar for stem
growth and different for crown traits. The broad crown varieties C2 and C4 showed greater
plasticity in crown traits and to the environmental effects. The magnitude of the responses in
stem growth was not associated with the size and plasticity of the crowns. Similarly, planting
density had little effect on stem growth, but significantly decreased the size of the canopy. The
effect of planting density on the genotypes was site specific. The greater stem growth of the
varieties relative to the OP and CMP families was more influenced by the site conditions than by
the effect of silvicultural intensity. Varieties differed significantly in stem growth from the
families only at the VA site. The crown traits were more influenced by the silvicultural intensity
than by the effect of the sites. The differential response in crown characteristics in broad crown

36
varieties implies that further genetic differences may be found in crown development, and
genotypes may be affected in crown width or HTLC independently.
This study demonstrates some of the complex interactions among genotypes and the
environment that must be considered in the selection of specific varieties and how they must be
deployed. Results suggest that genetic gains from varieties may differ among sites (genetic by
environment interaction). Finally, our results are limited to a very young phase of the stand
development, so further research in those trials particularly at the onset of canopy closure will
improve our understanding of the stand dynamic and intraspecific competition of the different
ideotypes. In particular, the larger changes found in crown dimensions may lead to greater
changes in stem diameter later in the rotation.

37
TABLES AND FIGURES
Table 1. Parents of the six genotypes assessed. Genotypes C1, C2, C3, and C4 correspond to the
varieties; OP; open pollinated family; CMP; control mass pollinated family. A, B, C, D and E
are arbitrary codes representing the pedigree of the parents.
A B D
A C1
B C4
C C2 CMP
E C3
? OP
Mother
Fat
her

38
Table 2. P-values from the analysis of variance for loblolly pine diameter at breast height (dbh),
height, crown width, and height to base of the live crown (HTLC). To meet the assumptions of
the analysis of variance, the variables height, dbh and HTLC were transformed using a natural
logarithm.
Note: Significant effects (P-value<0.05) are shown in bold type. The effects are SITE, silvicultural intensity
(SILV), genetic entry (GEN), planting density (DEN) and AGE.
Height dbh Crown width HTLC
SITE 0.0001 0.0754 0.1907 0.0293
SILV 0.018 0.0112 0.002 0.0091
SITE x SILV 0.4532 0.9602 0.6971 0.7889
GEN <.0001 <.0001 <.0001 <.0001
SILV x GEN 0.3033 0.4124 0.9344 0.0035
SITE x GEN 0.1678 0.003 0.0008 0.0117
SITE x SILV x GEN 0.124 0.0814 0.0442 0.0025
DEN 0.0422 0.0113 <.0001 0.0001
SITE x DEN 0.1364 0.1823 0.4141 0.364
SILV x DEN 0.1769 0.2638 0.0156 0.7241
GEN x DEN 0.1374 0.2594 0.0259 0.9939
SITE x SILV x DEN 0.1799 0.096 0.1003 0.985
SITE x GEN x DEN 0.1421 0.1242 0.0348 0.8938
SILV x GEN x DEN 0.6319 0.9044 0.5483 0.2133
AGE <.0001 <.0001 <.0001 <.0001
SITE x AGE <.0001 <.0001 0.0004 <.0001
SILV x AGE 0.0039 0.0292 <.0001 <.0001
GEN x AGE <.0001 <.0001 <.0001 <.0001
DEN x AGE 0.5576 0.5673 <.0001 0.0066
SITE x SILV x AGE <.0001 0.8889 <.0001 0.0238
SITE x GEN x AGE <.0001 0.3265 0.0003 0.0003
SITE x DEN x AGE 0.1939 0.9169 0.9854 0.5253
SILV x GEN x AGE 0.0706 0.7673 0.0006 0.0003
SILV x DEN x AGE 0.8278 0.872 0.1788 0.7323
GEN x DEN x AGE 0.4781 0.7392 0.779 0.7177
SITE x SILV x GEN x AGE 0.0165 0.822 0.2265 0.0966
EffectStem growth Crown attributes

39
Table 3. Loblolly pine crown width and height to the base of live crown (HTLC) at age 4 as
influenced by genotypes, site (NC=North Carolina Coastal Plain, VA=Virginia Piedmont) and
silvicultural intensity. Same letters in the columns indicates no significant difference (P-
value<0.05) among the genotypes according to the Tukey’s means comparison method.
Genotypes C1, C2, C3, and C4 correspond to the varieties; OP; open pollinated family; CMP;
control mass pollinated family.
NC VA Operational Intensive NC VA Operational Intensive
C1 1.72 a 1.86 c 1.51 b 2.07 b 0.267 b 0.33 b 0.32 b 0.27 b
C2 1.88 a 2.09 b 1.71 a 2.25 b 0.44 a 0.55 a 0.64 a 0.38 a
C3 1.64 b 1.86 c 1.44 b 2.06 b 0.27 b 0.378 b 0.38 b 0.27 b
C4 1.95 a 2.35 a 1.79 a 2.51 a 0.30 b 0.36 b 0.38 b 0.28 b
CMP 1.82 a 1.74 c 1.45 b 2.11 b 0.27 b 0.29 bc 0.31 b 0.25 b
OP 1.91 a 2.07 bc 1.72 a 2.27 b 0.22 b 0.26 c 0.31 b 0.18 c
GenotypeCrown width (m) HTLC (m)

40
Figure 1. Plot layout indicating the silvicultural treatment (whole plot), genotypes (split-plot)
and planting density (split-split plot) were randomized hierarchically within each block. The site
at North Carolina (NC) and Virginia (VA) had 3 and 4 blocks, respectively. Genotypes C1, C2,
C3, and C4 correspond to the varieties; OP; open pollinated family; CMP; control mass
pollinated family. The whole plot size was 99 by 146 m at VA and 78 by 146 m at NC.
C1
C2
C3
C4
CMP
OP
Operational Intensive
BLOCKGenotype
1235 trees/ha
617 trees/ha
617 trees/ha
1852 trees/ha
617 trees/ha
1235 trees/ha
1852 trees/ha
1235 trees/ha
1235 trees/ha
617 trees/ha
1852 trees/ha
617 trees/ha
617 trees/ha
1852 trees/ha
617 trees/ha
617 trees/ha
1852 trees/ha
1235 trees/ha
1852 trees/ha
1235 trees/ha
1852 trees/ha
1235 trees/ha
617 trees/ha
617 trees/ha
1235 trees/ha
1235 trees/ha
1235 trees/ha1852 trees/ha
1235 trees/ha
1852 trees/ha
1852 trees/ha
1235 trees/ha
617 trees/ha
1852 trees/ha
1852 trees/ha
617 trees/ha
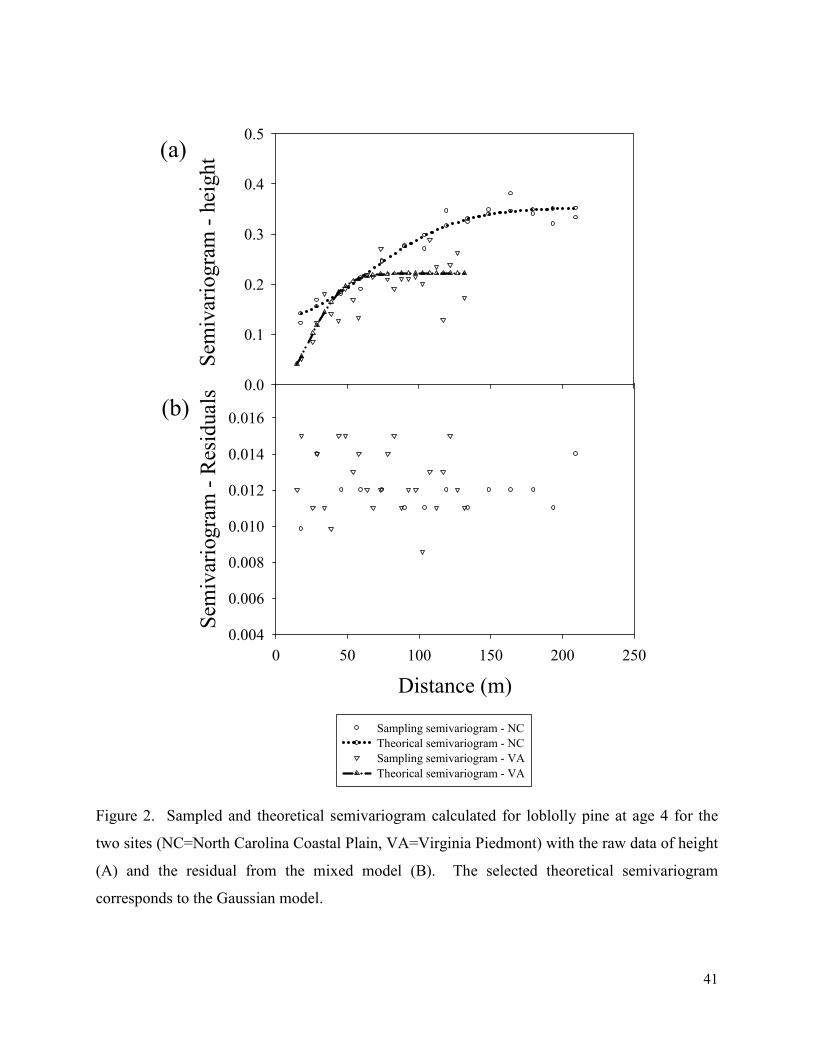
41
Distance (m)
0 50 100 150 200 250
Sem
ivar
iog
ram
- R
esid
ual
s
0.004
0.006
0.008
0.010
0.012
0.014
0.016
Sem
ivar
iog
ram
- h
eigh
t
0.0
0.1
0.2
0.3
0.4
0.5
Sampling semivariogram - NC
Theorical semivariogram - NC
Sampling semivariogram - VA
Theorical semivariogram - VA
(a)
(b)
Figure 2. Sampled and theoretical semivariogram calculated for loblolly pine at age 4 for the
two sites (NC=North Carolina Coastal Plain, VA=Virginia Piedmont) with the raw data of height
(A) and the residual from the mixed model (B). The selected theoretical semivariogram
corresponds to the Gaussian model.

42
Figure 3. Least-squares means for height through time at each site (NC=North Carolina Coastal
Plain, VA=Virginia Piedmont) as affected by silvicultural treatment (operational and intensive)
and genotype (varieties C1, C2, C3 and C4; CMP family, OP family). * : significant differences
at the 0.05 level, ** : significant differences at the 0.01 level. Same letters in the bars of the inset
graph indicates no significant difference (P-value<0.05) among the genotypes according to the
Tukey’s means comparison method. The inset graph shows the differences in height among
genotypes at age 4.
NCH
eigh
t (m
)
0
1
2
3
4
5
6
VA
OP
ER
AT
ION
AL
Age (years)
1 2 3 4
Hei
gh
t (m
)
0
1
2
3
4
5
Age (years)
1 2 3 4
INT
EN
SIV
E
**
**
**
**
**
**
**
**
**
**
**
**
**
C1 C2 C3 C4 CMP OP
YEAR 4
C1 C2 C3 C4 CMP OP
3
4
5
6
YEAR 4
C1 C2 C3 C4 CMP OP
3
4
5
6
YEAR 4
C1 C2 C3 C4 CMP OP
3
4
5
6
YEAR 4
C1 C2 C3 C4 CMP OP
3
4
5
6
ab a ab ab
b b
ab ab ab a
b b

43
Figure 4. Least-squares means for loblolly pine dbh through time by genotype (varieties C1, C2,
C3 and C4; CMP family, OP family), panel (a), and silvicultural treatment (operational and
intensive; panel (b). * : significant differences at the 0.05 level, ** : significant differences at the
0.01 level. Same letters in the bars of the inset graph indicates no significant difference (P-
value<0.05) among the genotypes according to the Tukey’s means comparison method. The
inset graph shows the differences in dbh among genotypes at age 4.
var
db
h (
cm)
0
2
4
6
8
C1
C2
C3
C4
CMP
OP
Age (years)
1 2 3 4
dbh
(cm
)
0
2
4
6
INTENSIVE
OPERATIONAL
**
**
**
**
*
YEAR 4
C1 C2 C3 C4 CMP OP
4
5
6
7
8
**a a
ab ab
b b
(a)
(b)

44
Figure 5. Least-squares means for loblolly pine dbh by site (NC=North Carolina Coastal Plain,
VA=Virginia Piedmont) and genotype (varieties C1, C2, C3 and C4; CMP family, OP family). *
: significant differences at the 0.05 level, ** : significant differences at the 0.01 level. Same
lowercase and uppercase letters indicates no significant difference (P-value<0.05) among the
genotypes (according to the Tukey’s means comparison method) at the NC and VA site,
respectively.
C1 C2 C3 C4 CMP OP
db
h (
cm)
0
1
2
3
4
5
NC
VA
**
**
a aba ab a b
A AA A B B

45
Age 2C
row
n w
idth
(m
)
0.0
0.5
1.0
1.5
2.0
2.5
3.0
Age 3
*
Age 4
NC
VA
Cro
wn w
idth
(m
)
0.0
0.5
1.0
1.5
2.0
2.5
***
**OPERATIONAL
INTENSIVE
**
HT
LC
(m
)
0.0
0.2
0.4
0.6
****
***
NC
VA
*
C1 C2 C3 C4 CMP OP
HT
LC
(m
)
0.0
0.2
0.4
0.6
***
*
C1 C2 C3 C4 CMP OP
** *
C1 C2 C3 C4 CMP OP
OPERATIONAL
INTENSIVE*
**
*
** ****
** **
** **
****
**
*
**
*
**
** **
** **
**** **
*
**
**
(a)
(b)
(c)
(d)
Figure 6. Least-squares means for loblolly pine crown width (panels a and b) and height to base
of live crown (HTLC, panels c and d) ) through time by genotype (varieties C1, C2, C3 and C4;
CMP family, OP family) and site (NC=North Carolina Coastal Plain, VA=Virginia
Piedmont)and silviculturral treatment (operational and intensive). * : significant differences at
the 0.05 level, ** : significant differences at the 0.01 level.

46
NCC
row
n w
idth
(m
)
0.0
0.5
1.0
1.5
2.0
2.5
3.0
VA
OPERATIONAL
INTENSIVE
C1 C2 C3 C4 CMP OP
HT
LC
(m
)
0.0
0.1
0.2
0.3
0.4
C1 C2 C3 C4 CMP OP
OPERATIONAL
INTENSIVE
** ** ** **** ** **
****
**
****
**
*
*
***
**
(a)
(b)
Figure 7. Least-squares means for loblolly pine crown width (panel a) and height to base of live
crown (HTLC, panel b)by site (NC=North Carolina Coastal Plain, VA=Virginia Piedmont),
genotype (varieties C1, C2, C3 and C4; CMP family, OP family) and silvicultural treatment
(operational and intensive) * : significant differences at the 0.05 level, ** : significant
differences at the 0.01 level.
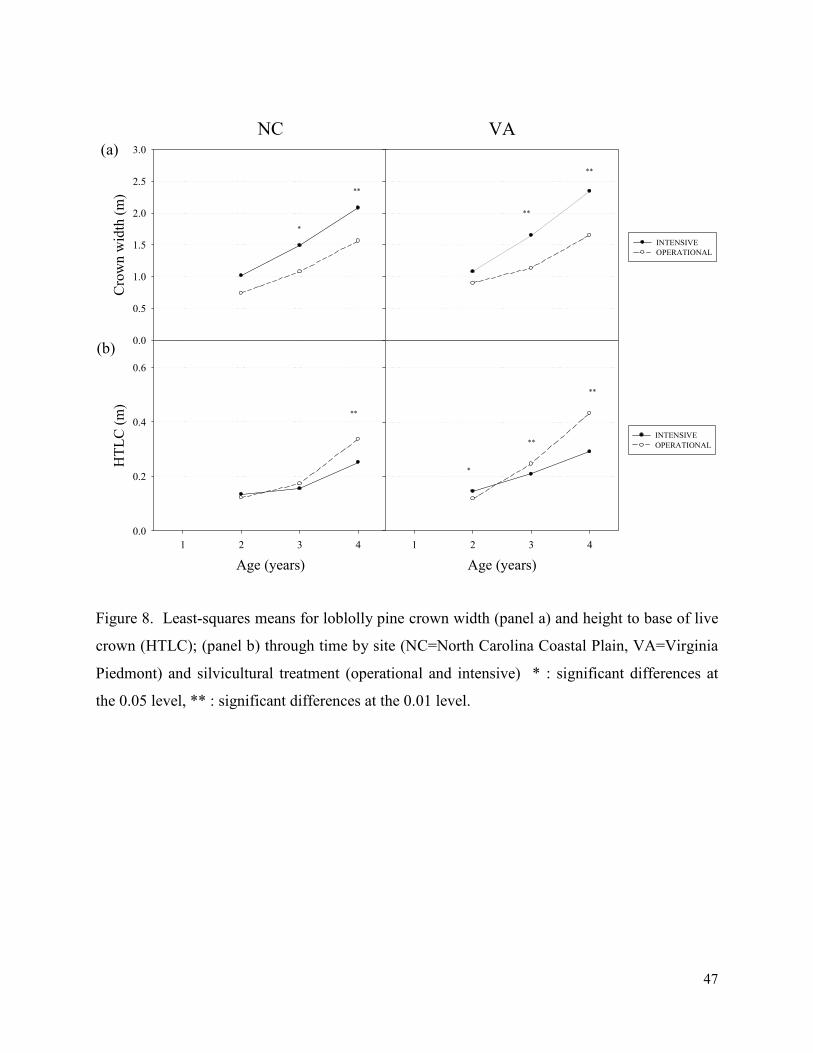
47
NCC
row
n w
idth
(m
)
0.0
0.5
1.0
1.5
2.0
2.5
3.0
INTENSIVE
OPERATIONAL
*
**
Age (years)
1 2 3 4
HT
LC
(m
)
0.0
0.2
0.4
0.6
INTENSIVE
OPERATIONAL
**
VA
**
**
Age (years)
1 2 3 4
*
**
**
(a)
(b)
Figure 8. Least-squares means for loblolly pine crown width (panel a) and height to base of live
crown (HTLC); (panel b) through time by site (NC=North Carolina Coastal Plain, VA=Virginia
Piedmont) and silvicultural treatment (operational and intensive) * : significant differences at
the 0.05 level, ** : significant differences at the 0.01 level.

48
Cro
wn
wid
th (
m)
1.0
1.5
2.0
2.5
617 trees/ha
1235 trees/ha
1852 trees/ha
**
**
Age (years)
1 2 3 4
HT
LC
(m
)
0.0
0.1
0.2
0.3
0.4
0.5
617 trees/ha
1235 trees/ha
1852 trees/ha
**
(a)
(b)
Figure 9. Least-squares means for loblolly pine crown width (panel a) height to base of live
crown (HTLC, panel b) over time by planting density (617, 1235, and 1852 trees/ha). * :
significant differences at the 0.05 level, ** : significant differences at the 0.01 level.
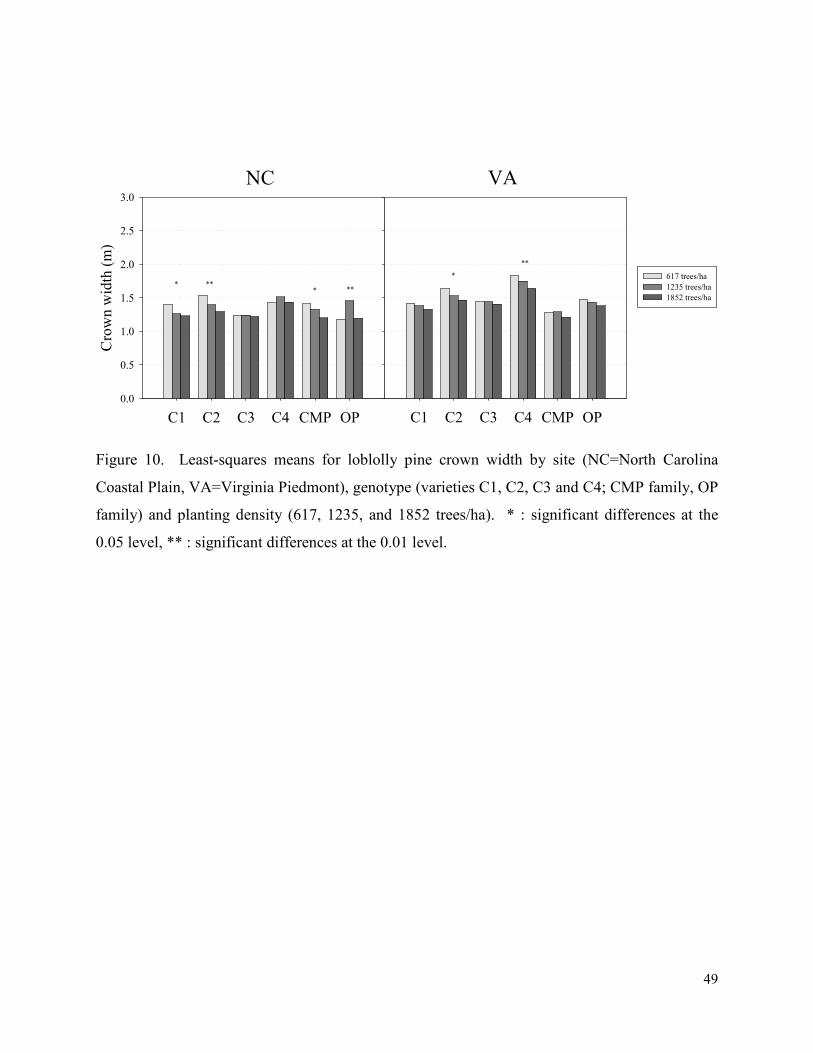
49
NC
C1 C2 C3 C4 CMP OP
Cro
wn
wid
th (
m)
0.0
0.5
1.0
1.5
2.0
2.5
3.0
VA
C1 C2 C3 C4 CMP OP
617 trees/ha
1235 trees/ha
1852 trees/ha
* *** **
*
**
Figure 10. Least-squares means for loblolly pine crown width by site (NC=North Carolina
Coastal Plain, VA=Virginia Piedmont), genotype (varieties C1, C2, C3 and C4; CMP family, OP
family) and planting density (617, 1235, and 1852 trees/ha). * : significant differences at the
0.05 level, ** : significant differences at the 0.01 level.

50
REFERENCES
Adams, J.P., Roberts, S.D., 2013. A comparison of growth and stand structural characteristics in
pure- and mixed-family stands of loblolly pine. Forest Science 59, 188-196.
Ahuja, M.R., and Libby, W.J. 1993. Clonal forestry II. Conservation and application. Springer-
Verlag, Berlin.
Albaugh, T.J., Allen, H.L., Dougherty, P.M., Kress, L.W., King, J.D, 1998. Leaf area and
above- and belowground growth responses of loblolly pine to nutrient and water additions.
Forest Science 44, 317-328.
Albaugh, T.J., Allen, H.L., Fox, T.R., 2006. Individual tree crown and stand development in
Pinus taeda under different fertilization and irrigation regimes. Forest Ecol. Manag. 234, 10-23.
Allen, H.L., Dougherty, P.M., Campbell, R.G., 1990. Manipulation of water and nutrients -
practice and opportunity in southern U.S. pine forests. Forest Ecol. Manag. 30, 437-453.
Allen, H.L., Fox, T.R., Campbell, R. G., 2005. What is ahead for intensive pine plantation
silviculture in the south?. South. J. Appl. For. 29, 62-69.
Amishev, D.Y., Fox, T.R., 2006. The effect of weed control and fertilization on survival and
growth of four pine species in the Virginia Piedmont. Forest Ecol. Manag. 236, 93-101.
Aspinwall, M.J., King, J.S., McKeand, S.E., Bullock, B.P., 2011. Genetic effects on stand-level
uniformity and above- and belowground dry mass production in juvenile loblolly pine. Forest
Ecol. Manag. 262, 609-619.
Aust, W.M., Blinn, C.R., 2004. Forestry best management practices for timber harvesting and
site preparation in the eastern United States: An overview of water quality and productivity
research during the past 20 years (1982–2002). Water Air Soil Pollut. 4(1), 5–36.
Avery, T.E., Burkhart, H.E. , 2002. Forest Measurements, Fifth ed. McGraw. New York.
Baltunis, B.S., Huber, D.A., White, T.L., Goldfarb, B., Stelzer, H.E., 2007. Genetic analysis of
early field growth of loblolly pine clones and seedlings from the same full-sib families. Can. J.
For. Res. 37, 195-205.
Bettinger, P., Clutter, M., Siry, J., Kane, M., Pait, J., 2009. Broad implications of southern
United States pine clonal forestry on planning and management of forests. International Forestry
Review 11, 331-345.

51
Brownie, C., Gumpertz, M.L., 1997. Validity of spatial analyses for large field trials. J. Agri.
Biol. and Env. Stat. 1(2), 1-23.
Cannell, M., 1982. "Crop" and "isolation" ideotypes: Evidence for progeny differences in
nursery-grown Picea sitchensis. Silvae Genetica 31, 60-66.
Carlson, C.A., Fox, T.R., Creighton, J., Dougherty, P.M., Johnson, J.R., 2009. Nine-year growth
responses to planting density manipulation and repeated early fertilization in a loblolly pine
stand in the Virginia Piedmont. South. J. Appl. For. 33, 109-114.
Chmura, D.J., Rahman, M.S., Tjoelker, M.G., 2007. Crown structure and biomass allocation
patterns modulate aboveground productivity in young loblolly pine and slash pine. Forest Ecol.
Manag. 243, 219-230.
Chmura, D.J., Tjoelker, M.G., Martin, T.A., 2009. Environmental and genetic effects on crown
shape in young loblolly pine plantations. Can. J. For. Res. 39, 691-698.
Dickmann, D. 1985. The ideotype concept applied to forest trees. P. 89–101 in Attributes of
trees as crop plants. Cannell, M.G.R., and Jackson, J.E. (eds.). Inst. of Terrestrial Ecol.,
Huntington, England.
Emhart V., M.T., White T., Huber, D., 2007. Clonal variation in crown structure, absorbed
photosynthetically active radiation and growth of loblolly pine and slash pine. Tree physiology
27, 421-430.
Fisher, R.F., Fox, T.R., Harrison, R.B., Terry, T., 2005. Forest soils education and research:
Trends, needs, and wild ideas. Forest Ecol. Manag. 220, 1-16.
Fox, T.R., E.J. Jokela, Allen, H. L., 2007. The development of pine plantation silviculture in the
southern United States. Journal of Forestry. 105 (5), 337-347.
Gilmour, A.R., Cullis, B.R., Vervyla, A., 1997. Accounting for natural and extraneous variation
in the analysis of field experiments. J. Agri. Biol. and Env. Stat. 2(3), 1-34.
Harms, W.R., Whitesell, C.D., DeBell, D.S, 2000. Growth and development of loblolly pine in a
spacing trial planted in Hawaii. Forest Ecol. Manag. 126, 13-24.
Haywood, J.D., Burton, J.D., 1990. Phosphorus fertilizer, soils, and site preparation influence
loblolly pine productivity. New Forests 3, 275-287.

52
Haywood, J.D., Tiarks, A.E., Sword, M.A., 1997. Fertilization, weed control, and pine litter
influence loblolly pine stem productivity and root development. New Forests 14, 233-249.
Isik, F., Li, B., Frampton, J., 2003. Estimates of additive, dominance and epistatic genetic
variances from a clonally replicated test of loblolly pine. Forest Science 49, 77-88.
Jokela, E.J., Martin, Timothy A., Vogel, Jason G. , 2010. Twenty-five years of intensive forest
management with southern pines: Important lessons learned. Journal of Forestry, 338-347.
Jones, P.D., Ezell, A.W., Demarais, S., 2010. Growth response of loblolly pine (Pinus taeda L.)
3–5 years after plantation establishment using different management intensities. J. Sustainable,
For. 29, 486-502.
Kutner, M.H., Nachtsheim, C.J., Neter, J., Li, W., 2005. Applied linear statistical models, Fifth
ed. Chicago.
Kyle, K.K., Andrews, L.J., Fox, T.R., Aust, W.M., Burger, J.A., 2005. Long-term effects of
drainage, bedding, and fertilization on growth of loblolly pine (Pinus taeda L.) in the Coastal
Plain of Virginia. South. J. Appl. For. 29(4), 205-214.
Lambers, H., Chapin III, F.S., Pons, T.L., 2008. Plant physiological ecology. Second ed. New
York.
Martin, T.A., Johnsen, K. H., White, T., L., 2001. Ideotype development in southern pines:
Rationale and strategies for overcoming scale-related obstacles. Forest Science 47:21–28.
Martin, S.W., Shiver, B.D., 2002. Impacts of vegetation control, genetic improvement and their
interaction on loblolly pine growth in the southern united states-age 12 results. South. J. Appl.
For. 26, 37-42.
McGarvey, R.C., Martin, T.A., White, T.L., 2004. Integrating within-crown variation in net
photosynthesis in loblolly pine and slash pine families. Tree physiology 24, 1209-1220.
McKeand, S.E., Crook, R.P., Allen, H.L., 1997. Genotypic stability effects on predicted family
responses to silvicultural treatment in loblolly pine. J. Appl. For., 21(2), 84-89.
McKeand S., Mullin T., Byram T., White T. 2003. Deployment of genetically improved
loblolly and slash pines in the south. Journal of Forestry 101, 32-37.
McKeand, S.E., Jokela, E.J., Huber, D.A., Byram, T.D., Allen, H.L., Li, B., Mullin, T.J., 2006.

53
Performance of improved genotypes of loblolly pine across different soils, climates, and
silvicultural inputs. Forest Ecol. Manag. 227, 178-184.
Miwa, M., Aust, W.M., Burger, J., Patterson, S.C., Carter, E.A., 2004. Wet-weather timber
harvesting and site preparation effects on coastal plain sites: a review. South. J. Appl. For. 28,
137-151.
Nelson, C.D., Johnsen, K.H., 2008. Genomic and physiological approaches to advancing forest
tree improvement. Tree physiology 28, 1135-1143.
Owino, F., Kellison, R.C., Zobel, B.J., 1977. Genotype x environment interaction and genotypic
stability in loblolly pine. Silvae Genetica 26, 131-134.
Pritchett, W.L., Gooding, J.W., 1975. Fertilizer recommendations for pines in the Southeastern
Coastal Plain of the United States. Univ. of Florida, Agri. Exp. Sta. Bull. 774.
Roth, B.E., Jokela, E.J., Martin, T.A., Huber, D.A., White, T.L., 2007. Genotype × environment
interactions in selected loblolly and slash pine plantations in the Southeastern United States.
Forest Ecol. Manag. 238, 175-188.
Sabatia, C.O., Burkhart, H.E., 2012. Competition among loblolly pine trees: Does genetic
variability of the trees in a stand matter?. Forest Ecol. Manag. 263, 122-130.
Sharma, R.K., Mason, E.G., Sorensson, C.T., 2008. Productivity of radiata pine (Pinus radiata D.
Don.) clones in monoclonal and clonal mixture plots at age 12 years. Forest Ecol. Manag. 255,
140-148.
Sherwood, W.C., Hartshorn, T., and Eaton, L.S., 2010, Soils, geomorphology, landscape
evolution, and land use in the Virginia Piedmont and Blue Ridge, in Fleeger, G.M., and
Whitmeyer, S.J., eds., The Mid-Atlantic Shore to the Appalachian Highlands: Field Trip
Guidebook for the 2010 Joint Meeting of the Northeastern and Southeastern GSA Sections:
Geological Society of America Field Guide 16, p. 31–50, doi: 10.1130/2010.0016(02).
Sprugel, D.G., 2002. When branch autonomy fails: Milton’s Law of resource availability and
allocation. Tree physiology 22, 1119-1124.
Stape, J.L., Binkley, D., Ryan, M.G., Fonseca, S., Loos, R.A., Takahashi, E.N., Silva, C.R.,
Silva, S.R., Hakamada, R.E., Ferreira, J.M.d.A., Lima, A.M.N., Gava, J.L., Leite, F.P., Andrade,
H.B., Alves, J.M., Silva, G.G.C., Azevedo, M.R., 2010. The Brazil eucalyptus potential
productivity project: Influence of water, nutrients and stand uniformity on wood production.

54
Forest Ecol. Manag. 259, 1684-1694.
Stovall, J.P., Carlson, C.A., Seiler, J.R., Fox, T.R., Yanez, M.A., 2011. Growth and stem quality
responses to fertilizer application by 21 loblolly pine clones in the Virginia Piedmont. Forest
Ecol. Manag. 261, 362-372.
Thomas, P.J., Simpson, T.W., Baker, J.C, 1989. Erosion effects on productivity of Cecil soils in
the Virginia Piedmont. Soil Sci. Soc. Am. J. 53, 928-933.
Tyree, M.C., Seiler, J.R., Maier, C.A., Johnsen, K.H., 2009. Pinus taeda clones and soil nutrient
availability: effects of soil organic matter incorporation and fertilization on biomass partitioning
and leaf physiology. Tree physiology 29, 1117-1131.
VanderSchaaf, C.L., Prisley, S.P., 2006. Factors affecting site productivity of loblolly pine
plantations across the southeastern united states In: Prisley, S., Bettinger, P., Hung, I-K., Kushla,
J. (Ed.), 5th Southern Forestry and Natural Resources GIS Conference, Asheville, NC.
Wagner, R.G., Robinson, A.P., 2006. Critical period of interspecific competition for four
northern conifers: 10-year growth response and associated vegetation dynamic. Can. J. For.
Res., 36, 2474-2485.
Weiskittel, A.R., Maguire, D.A., Monserud, R.A., 2007. Modeling crown structural responses to
competing vegetation control, thinning, fertilization, and Swiss needle cast in coastal Douglas-fir
of the Pacific Northwest, USA. Forest Ecol. Manag. 245, 96-109.
Whetten, R.W., Kellison, R., 2010. Research gap analysis for application of biotechnology to
sustaining US forests. Journal of Forestry, 193-201.
Wilhite, L.P., Jones, E.P., 1981. Bedding effects in maturing slash pine stands. South. J. Appl.
For. 5(1), 24 –27.
Will, R.E., Barron, G.A., Burkes, E.C., Shiver, B., Teskey, R.O., 2001. Relationship between
intercepted radiation, net photosynthesis, respiration, and rate of stem volume growth of Pinus
taeda and Pinus elliotii stands of different densities. Forest Ecol Manag 154, 155-163.
Wright, J., Dougherty, D. 2006. Varietal forestry. Forest Landonwer. September/October. 3-4.
White, T.L., Adams, W. T., Neale, D.B., 2007. Forest genetics. CABI, Wallingford.
55
Yang, W.Q., Murthy, R., King, P., Topa, M.A., 2002. Diurnal changes in gas exchange and
carbon partitioning in needles of fast- and slow-growing families of loblolly pine (Pinus taeda).
Tree Physiology 22, 489-498.
Zapata-Valenzuela, J., 2012. Use of analytic factor structure to increase heritability of clonal
progeny tests of Pinus taeda L. Chilean J. Agri. Res. 72, 309-315.
Zhao, D., Kane, M., Borders, B.E., 2011. Growth responses to planting density and management
intensity in loblolly pine plantations in the southeastern USA Lower Coastal Plain. Annals of
Forest Science 68, 625-635.
Zhao, D., Kane, M., Borders, B., Subedi, S., Akers, M., 2012. Effects of cultural intensity and
planting density on stand-level aboveground biomass production and allocation for 12-year-old
loblolly pine plantations in the Upper Coastal Plain and Piedmont of the southeastern United
States. Can. J. For. Res. 42, 111-122.

56
CHAPTER 2. STAND UNIFORMITY OF LOBLOLLY PINE VARIETIES AND
FAMILIES IN THE VIRGINIA PIEDMONT AND NORTH CAROLINA COASTAL
PLAIN
ABSTRACT
Stand uniformity is a desired trait affecting stand development and productivity, and is
influenced by genetics, natural heterogeneity of specific sites and management practices. Stand
uniformity is expected to increase if plantation forestry moves to varietal stands and continues to
increase management intensity. In this study, we evaluated the effect of site and silvicultural
intensity on stand uniformity of loblolly pine (Pinus taeda L.) varieties, and contrasted them with
non-varietal genetic sources. We assessed a 4-year-old experiment established at two contrasting
sites, one on the Virginia Piedmont (VA) and one on the North Carolina Coastal Plain (NC). At
each site, two silvicultural treatments (operational and intensive) and 6 genotypes (4 varieties (2
narrow and 2 wide crown ideotypes), 1 CMP and 1 OP family) and 3 planting densities (617,
1235, 1852 trees/ha) were arranged in a split-split plot design. Stand uniformity was evaluated
only in the 1235 trees/ha plots. Stand uniformity was evaluated with the standard deviation
(STD), coefficient of variation (CV), and two parameters derived from the Lorenz curve (Gini
index and P50). These parameters were calculated for diameter at breast height (DBH), tree
height (HT) and tree volume (Vol). The stand productivity ranged from 9.3-44.1 m3/ha at NC
and 13.6-57.0 m3/ha at VA. Overall, there was a moderate relationship between stand
productivity and stand uniformity, and the magnitude of that relationship was similar at both
sites. There was a significant genetic effect on stand uniformity, but varieties were not
necessarily more uniform than the families. We also did not find differences in uniformity

57
among the crown ideotypes. Our results suggest that stand uniformity is not an attribute of all
varietal stands, but may be genotype-dependent with certain varieties more uniform than others.
At this young age, stand uniformity was better explained by microsite heterogeneity, followed by
the genotype effects, and to a lesser extent silvicultural intensity. Our results reinforce the need
of matching varietal forestry with precision silviculture to achieve gains in productivity.
Keywords: loblolly pine, stand uniformity, Gini Index, intensive silviculture, varietal forestry
INTRODUCTION
Currently most of the loblolly pine seedlings planted in the southern United States are
open-pollinated (OP) families (McKeand et al., 2006). However, a larger proportion of stands
are being planted with control-mass pollinated (CMP) families and in the future varietal planting
may increase as well. Varietal stands may be more productive and more uniform than non-
varietal stands, when managed intensively. Stand volume gains might reach 60 to 70% using
varieties (Whetten and Kellison, 2010). Increased silvicultural intensity in recent decades has
also greatly improved loblolly pine productivity (Fox et al., 2007, Jokela et al., 2010). The
response of varieties when deployed under a range of silvicultural practices is uncertain
(McKeand et al., 2006). Some studies suggest that specific varieties may need to be matched
with specific-site management activities to reach their potential productivity (Aspinwall et al.,
2011; Stovall et al., 2011; Tyree et al., 2009). Because of the high cost per seedling, current
guidelines suggest that varieties should be established at lower planting densities, only on better
sites, and with the best silviculture (Bettinger et al., 2009).
58
Varietal plantations are predicted to be more productive and have higher stand uniformity
because they capture the additive and non-additive genetic variance (Baltinus ate al., 2007; Zobel
and Talbert, 1984). Uniformity and growth may also be improved with intensive silvicultural
practices such as site preparation, weed control, and fertilization (Allen et al., 2005; Purvis,
2006). Linking varieties with intensive silvicultural systems might produce a synergic positive
effect on stand uniformity and productivity.
Stand uniformity may increase productivity because of greater resource use efficiency
(Stape et al., 2010). Campoe et al. (2013a) found that loblolly pine under intensive management
that included irrigation plus fertilization increased the absorbed photosynthetically active
radiation (APAR) and light use efficiency (LUE) especially in the dominant trees. This suggests
that the stand uniformity should decrease with time due to higher resource use efficiency by the
larger trees at the expenses of the smaller ones. Similar results were found in Eucaliptus grandis
in Brazil (Campoe et al., 2013b). Both studies were based on seed-origin seedlings. In a clonal
stand of Eucalyptus grandis x urophylla, Luu et al. (2013) stated that in less uniform stands, the
productivity of the larger trees may not compensate for low growth of the suppressed ones,
which could lead to a potential reduction in total stand productivity. Hence, improving the stand
uniformity at a younger age (e.g. through intensive silvicultural management) may have
repercussions on the stand uniformity and productivity later in the rotation.
Reducing the genetic variability within a stand (e.g. using varieties) may lead to greater
intraspecific competition (Adams and Robert, 2013; Boyden et al., 2008). Planting varieties in
mixtures has been proposed as an option for varietal forestry (Tuskan, 1998). Under this
scenario, the plantation with a mixture of varieties mimics a non-varietal stand and trees from
different genotypes compete among themselves. Plantations of varieties in mixtures could

59
reduce the intraspecific competition and decrease environmental stresses (Tuskan, 1998),
maintaining productivity, but at the expense of lower stand uniformity (Sharma et al., 2008).
The few existing studies in varietal loblolly pine reported different effects of increasing the stand
uniformity using more genetically uniform material. For instance, in a block-plot study,
Aspinwall et al., (2011) found no consistent pattern in the uniformity of growth (measured as the
coefficient of variation CV) during the first three years with different levels of genetic uniformity
(OP and CMP families, and varieties); in fact, the varieties were less uniform in tree height than
the families. They also found that higher planting density increased variability. In the same
experiment, Steiger (2013) found that dbh in the third and fourth growing season was more
uniform in the OP and CMP families than in the varieties. In an 8-year old block-plot study,
Sabatia and Burkhart (2013) found no differences in the CV among OP, CMP and varieties for
dbh and height at planting density of 680 trees per hectare (TPH). However, at 1360 TPH the
CPM family had a larger CV for both traits relative to the OP family and varieties. The two
latter sources did not differ significantly.
There are theoretical reasons to believe that planting varieties in intensively managed
stands will produce more uniform stands. However, empirical evidence does not support this
assertion. We have found no studies addressing simultaneously the effect of silviculture on the
uniformity of loblolly pine varieties at a stand level, or their performance among different
environmental conditions. In this study we examined the effect of site and intensive silviculture
on the stand uniformity of loblolly pine genotypes at an early stage. We assessed a 4-year-old
experiment established at two contrasting sites, one on the Virginia Piedmont and one on the
North Carolina Coastal Plain. At each site, two silvicultural treatments (operational and
intensive) and 6 genotypes (4 varieties, 1 CMP and 1 OP family) were tested. We hypothesized
60
that: 1) alleviating the soil resource limitations through intensive silviculture will increase stand
uniformity, but the magnitude of the response is site-specific, 2) the stand uniformity will be
higher in varietal than non-varietal stands particularly under intensive silviculture systems, 3) the
increased stand uniformity due to silvicultural intensity will be greater in varieties having broad-
crowns (isolation ideotypes) than narrow-crowns (crop ideotypes), which could be attributed to a
greater demand of soil resources to sustain larger canopies and 4) improved stand uniformity will
increase stand productivity.
METHODS
Study sites
This study was established at two sites in 2009 to assess the interactions among
genotypes (varieties and families), silvicultural intensity, planting density and site. Trials were
located in the North Carolina Coastal Plain (NC), at the Bladen Lakes State Forest (34º 49’
49.63’’N, 78º 35’ 18.52’’W), and at the Virginia Piedmont (VA) at the Reynolds Homestead
Forest Resources Research Center (36º 38’ 35.32’’N, 80º 09’ 18.84’’W).
The soil on the VA site was a well-drained Fairview Series (fine, kaolinitic, mesic Typic
Kanhapludults). Previously, the site supported a mixture of loblolly pine, pitch pine (Pinus
rigida L.) x loblolly pine hybrids and eastern white pine (Pinus strobus L.) stands that were
harvested in 2007 and 2008. The soil at the NC site was a poorly drained Rains series (fine-
loamy, siliceous, semiactive, thermic Typic Paleaquults). Previously, the site supported a
loblolly pine stand that was harvested in 2007. The annual average temperature and precipitation
at VA is 13 ºC and 1159.3 mm, respectively. The annual average temperature and precipitation at
61
NC are 16.9 ºC and 1170.7 mm, respectively (from NOAA online weather data
http://sercc.com/nowdata.html).
Experimental design
The study design is a split split-plot with 4 replications at VA and 3 replications at NC.
Two levels of silviculture (operational and intensive) were the whole plot treatments, six
genotypes (4 clonal varieties, 1 OP family and 1 CMP family) were the split-plot treatments, and
three initial planting densities (617, 1235 and 1852 trees/ha) were the split split-plot treatments
(Figure 1). The total number of plots was 144 at VA (2 silviculture treatments x 6 genotypes x 3
planting spacing x 4 replicates), and 108 at NC (2 silviculture treatments x 6 genotypes x 3
planting spacing x 3 replicates). There are no buffer rows between plots with different spacing
or varieties. The buffer between whole plots with different silvicultural treatment was at least 20
m to avoid cross-over of the fertilization effect in the adjacent whole plots.
Prior to planting, site preparation at VA included an aerial application of mixed solution
of Accord XRTII plus (9.3 L/ha), Milestone VM plus (9.3 L/ha), and Chopper (1.46 L/ha). The
site was then burned. Site preparation at NC included a chemical application of Chopper (2.33
L/ha), Krenite (11.6 L/ha), and Garlon (1.53 L/ha), followed by V-blade bedding on 3.66 m
centers using a Savannah bedding plow (Savannah Global Solutions, Savannah, GA).
At the end of the first growing season, seedlings that died were replanted with extra
seedlings from the same genotype that were grown in containers. This was done to maintain the
target stand density, so that the effect of mortality inter-tree competition was minimized. The
location of each tree replanted was recorded and the growth data from the replanted trees was
excluded from the subsequent analysis.
62
Whole plot treatment: Silvicultural intensity
At both sites, the operational silvicultural treatment was a banded weed control after
planting, with a mix of Arsenal AC (292 ml/ha) and Oust XP (146 ml/ha). At VA, in the third
growing season, a solution of Escort (55 ml/ha) was applied to control blackberry (Rubus spp.).
The intensive silvicultural treatments at both sites consisted of a broadcast weed control with a
mix of Arsenal AC (292 ml/ha), Oust XP (146 ml/ha) and Escort (18 ml/ha) in the first growing
season; Arsenal AC (292 ml/ha) and Oust XP (146 ml/ha) in the second growing season; and
Escort (55 ml/ha) in the third growing season. Tip moth control was applied after planting using
PTM insecticide (BASF Corporation) (1.5 ml/tree) in the intensive treatment. The intensive
treatment was fertilized after planting with 93 g/tree of nitrogen and 10 g/tree of phosphorus in
the form of Arborite coated urea fertilizer, which was spread around the base of each individual
seedling.
Split plot treatment: Genotypes
The genetic entries included one open pollinated family (OP), one control-mass-
pollinated family (CMP) and four clonal varieties (C1, C2, C3 and C4) produced through
somatic embryogenesis by Arbogen Company (Summerville, SC). All the genotypes were
Coastal sources of loblolly pine. The parents of several of the genotypes were related (Table 1).
The OP and CMP families were bare-root seedlings and the clonal varieties were containerized
seedlings.

63
Split-split plot treatment: Planting density
Each genotype was planted in block plots, with 81 trees/plot in a 9 by 9 arrangement at
VA and 63 trees/plot 7 by 9 arrangement at NC, at three densities: 617, 1235 and 1852 trees/ha.
The spacing between rows in all the planting densities was held constant at 3.66 m with distance
between trees within a row varying from 4.42, 2.21 and1.47 m in low, medium and high density,
respectively. For this study of stand uniformity, we used the data from the 1235 trees/ha plots.
Growth traits were measured at the end of the 4th
growing season (January 2013). To
avoid any edge effect, measurements were taken in a 5 by 5 tree internal plot. Tree height was
measured with a Philadelphia rod and diameter at breast height (DBH) was measured at 1.37 m
using a digital caliper. We calculated a volume index for each individual tree as total HT x
DBH2. Then, the productivity at stand level was scaled summing the volume index of the trees
within a block-plot, and adjusted to a per hectare basis based on the size of the plot.
Parameter representing uniformity of growth traits
We assessed stand uniformity for tree height (HT), diameter at breast height (DBH) and
stem volume index (Volume = HT x DBH2) through the calculation of the standard deviation
(STD), coefficient of variation (CV), the Gini-index (GI) and a parameter referred to as P50.
STD accounts for the pure variation in a population, which is expressed in the same unit of the
trait being studied. CV (STD/mean), commonly reported in forestry, allows comparisons among
different populations, adjusting for the larger variation associated with larger individual. It is
often expressed as a percentage. GI, which was originally developed to account for economic
inequality, measures stand uniformity as a deviation from a perfectly uniform population for a
giving growth trait (Katholnig, 2012) (Figure 2). Briefly, the trees within a plot were sorted in

64
ascending order for the response variable of interest (e.g., tree height). Then, the cumulative
proportion of the variable of interest is plotted against the cumulative proportion of the trees,
which yields the Lorenz curve (Katholnig, 2012). The Gini-index is calculated as the difference
between the area under the one-to-one line and the area under the Lorenz curve (Figure 2).
Perfect stand uniformity will have a value of 0; whereas the lowest stand uniformity will result in
a value of 1. P50 is also derived from the Lorenz curve and corresponds to the cumulated
proportion of the trait for 50% of the trees (Hakamada, 2012; Stape et al., 2013) (Figure 2). P50
ranges from 0.5 in perfectly uniform stand to 0 in the lowest uniformity; therefore, GI and P50
are negatively correlated. In this study, all the uniformity parameters were calculated on a block-
plot basis at the planting density of 1235 trees/ha.
Data sets
Traditionally genetic trials such as progeny test are usually planted in very uniform sites
and are managed intensively in order to isolate the genetic influences on growth (White et al.,
2007). As a consequence, measures of stand uniformity may be high in these trials and
overestimate the uniformity that can be expected in operational planting when soils and sites are
more heterogeneous and silvicultural practices are implemented less uniformly across the stand.
We attempted to isolate the impact of increasing genetic uniformity from OP family to varieties
on stand uniformity by carefully examining the microsite around each seedling to identify those
seedlings whose growth was negatively affected by soil and site conditions. The data was
rearranged in two data sets. The first (hereinafter named full dataset) contained all the trees alive
within the block-plots. The second (hereinafter named reduced dataset) contained all the trees in
the full dataset, except the trees with growth that was obviously affected by microsite conditions
on the planting spot such as poor-quality beds at NC, or old skid trails at VA. We observed that

65
the variability caused by these factors was not alleviated by silvicultural treatment or the
increased genetic uniformity. We also eliminated trees with damage caused by the herbicide
applications. We kept all others trees with problems such us top dieback, insect, diseases,
windthrow, and ice, under the assumption that this type of source of variation may still be
present with an optimal implementation of silvicultural treatments. The reduced dataset
contained 97.5% of the tress in the full dataset. We suggest that the full dataset will produce an
evaluation of stand uniformity that will occur in operational conditions that typically exist in the
South. In contrast, the reduced dataset will produce an estimate of stand uniformity that could
exist at very uniform sites and is a more direct evaluation of genetic uniformity on stand
uniformity.
Statistical analysis
Because we only used the data from one planting density, the experimental design was
analyzed as a split-plot design, which was expanded to a multi-location analysis. The
explanatory variables (site, silvicultural intensity (SILV), genotype (GEN), and the interactions
among these factors) were treated as fixed. In order to jointly evaluate the variation of the
uniformity parameters (STD, CV, GI and P50) for each growth trait, we used the four parameters
as responses in a multivariate analysis of variance (MANOVA). The analyses were performed
using PROC GLM of SAS version 9.2 (SAS Institute, Cary, North Carolina, USA), separately
for the full and reduced data sets. We reported the p-values associated with the Wilks’ Lambda
test statistic. The same explanatory variables were used to run the univariate analysis on stand
productivity. Where significant model effects were observed (P-Value<0.05), post hoc analysis
was made on the least-squares means. The relationship among variables was explored by the

66
Pearson-coefficient of correlation (PROC CORR of SAS 9.2). Figure 3 illustrates the
hypothesized relationship between the uniformity parameters and stand productivity.
RESULTS
Descriptive parameters for stem growth and stand uniformity.
Trees were larger at VA than NC. The average height and dbh at VA and NC were 4.6
m, 6.5 cm and 4.1 m, 5.8 cm respectively. At age 4, the intensive silviculture treatment had a
greater effect at VA than NC. Across all the genotypes, the intensive treatment increased the
DBH 14% and 23% at NC and VA, respectively, with a minor effect on tree height (8% and
10%, respectively). At VA there were differences in height and DBH between the varieties and
the OP and CMP families. DBH and height were 21% and 13% greater in the varieties relative
to the families. There were little differences in the mean values for DBH, height and stem
volume among the two data sets, with the variety C2 at NC and the OP family at VA presenting
the greatest differences in growth traits between data sets (Table2).
Uniformity was slightly higher in the reduced dataset than in the full dataset (Table 3).
At both sites, the differences in stand uniformity parameters between the full and reduced dataset
were greater than the difference in stand productivity. At both sites, the uniformity parameters
showed that HT was more uniform than DBH, but both of them were more uniform than tree
volume (Table 3). Overall, the uniformity parameters tended to be higher at NC than VA.
At both sites, the uniformity parameters were highly and significantly correlated, except
the STD for volume (Table 4 and 5). When the coefficients of correlations were significant
between GI, CV and STD, for HT, DBH and volume, they were all positive, but they correlated
negatively with P50. There were minor differences in the coefficient of correlation between data

67
sets, being slightly higher when calculations were based in the full dataset. Coefficients of
correlations were slightly higher at VA than NC. STD for volume did not correlate with the
other uniformity parameters. When the correlations were significant, STD for DBH had a lower
coefficient of correlation with the other uniformity parameters.
Environmental and genetics effects on stand uniformity
We found a significant site x genotype interaction on the uniformity parameters for HT
and DBH (p<0.01) (Table 6). For volume, the site x genotype interaction was only significant in
the full dataset. Because the results of the multivariate analysis of variance were similar for both
data sets, only mean comparisons among the genotypes per site based in the reduced dataset is
presented (Table 7). Significant differences in the uniformity parameters were found among the
genotypes at the VA site, but not at NC (Table 7). All the uniformity parameters ranked the
genotypes similarly. At VA the stand uniformity for HT, DBH and volume was generally
highest in variety C4 and lowest in the CMP and OP family. Among the varieties, C1 was less
uniform, and often comparable to the stand uniformity of the families. Although, there were no
significant differences among the genotypes at NC, there was consistently higher uniformity in
variety C4.
Additionally, we conducted post-hoc analysis using multivariate contrast at VA with the
goal of testing if the vector of the means of the uniformity parameters differs among varietal and
non-varietal sources, and whether it differed among crown ideotype. The analysis indicates that
on average the stand uniformity for HT, DBH and tree volume of the varieties was significantly
higher than the non-varietal sources (CMP and OP family) (p<0.01). Similarly, on average the
broad-crown varieties (C2 and C4) had greater stand uniformity in HT than the narrow-crown

68
varieties (C1 and C3) (p=0.024). In both cases, the results must be interpreted carefully because
the contrasts were mostly influenced by the differences between C1 and C4, being less
conclusive for variety C2 and C3. There were no differences in the stand uniformity on DBH
(p=0.1255) or volume (p=0.1309) associated with the ideotypes.
The silvicultural effect was significant at an alpha of 0.1 for the uniformity of DBH only
for the reduced data set (Table 6). The GI and CV of DBH were lower in the intensive treatment
(0.15 and 28.8%, respectively) than in the operational treatment (0.18 and 33.1%, respectively).
There was no effect of silviculture on the uniformity of height (Table 6). However, the
silvicultural effect was significant (p=0.033) on the uniformity of volume. The GI and CV of
volume were lower in the intensive treatment (0.32 and 61.3%, respectively) than in the
operational treatment (0.36 and 66.1%, respectively). The P50 for DBH and volume was higher
in the intensive treatment (0.28 and 0.4, respectively) than in the operational treatment (0.25 and
0.39, respectively). STD for DBH and volume was higher in the intensive treatment (1.83 cm
and 13704 cm3, respectively) than in the operational treatment (1.77 cm and 10188 cm
3,
respectively). There was no significant effect of the silvicultural treatment on P50 and STD of
HT and DBH.
Influence of stand uniformity on stand productivity
Because the results of the analysis of variance were similar for the two data sets (Table
8), only the results based on the reduced data set are presented. Overall, stand productivity
ranged from 9.3 to 44.1 m3/ha at NC and 13.6 to 57.0 m
3/ha at VA. Significant differences were
found among the genotypes (p=0.033) (Table 8, Figure 4). Across the two sites, the broad crown
varieties had significantly greater stand volume than the OP family (p<0.05). This is somewhat

69
consistent with the rank of varieties found at VA (Table 7). Similarly, intensive silviculture
significantly increased the stand volume 50% relative to the operational treatment (p=0.02),
although the effect of silviculture on stand uniformity was less pronounced. When we correlated
the stand productivity with GI, PT50, and CV of each growth trait at a block-plot level (Table 9),
the coefficient of correlations were moderately high for all the parameters, which indicates that
increasing stand uniformity has a positive impact on the stand productivity. GI, CV and P50 for
DBH, height and stem volume explained 20-40% of the variability in stand productivity. In
contrast, the correlation between stand productivity and STD for DBH and HT was negative,
whereas it was positive for STD of volume (Table 9). The coefficient of correlation between
STD and the mean for DBH was -0.12 (p=0.48) at NC and -0.32 (p=0.02) at VA, whereas the
coefficient of correlation between STD and the mean for height was -0.49 (p=0.002) at NC and -
0.59 (p=0.001) at VA,
DISCUSSION
Many factors contribute to the variability in tree growth observed in this study, including
spatial variability of the soil, initial seedling culture and size, genetic variability, insect damage,
mortality, quality of the site preparation, and competition. To isolate the impact of increasing the
genetic uniformity on stand uniformity, the sources of variation were represented separately in
the two data sets. This was under the assumption that the effect of any of these sources of
variation will be reflected in tree growth. The full data set contained all the trees alive within the
plots, and so contains all the sources of variation. The reduced data set excluded trees that were
obviously affected by microsite differences that were not ameliorated by the silvicultural
treatments. Consequently, the full dataset had slightly lower uniformity for the growth traits
relative to the reduced data set. In the full data set, only 2.5% of the trees were negatively
70
impacted in their growth by observed microsite differences (e.g. skid trails at VA, poor bedding
at NC). The impact of removing these trees from the reduced dataset was disproportionately
greater on uniformity than the measures of productivity. In this study, there was little impact of
removing the small number of trees on the means for HT, DBH or stem volume. However, stand
uniformity was higher in the reduced dataset as illustrated by the decrease in the Gini index of
6.1% for height and 3.19% for DBH at NC (Table 3). This suggests that these microsite
differences decrease stand uniformity, even when varieties are planted. However, microsite
effecs such as we observed may be greater in other plantations. For example, on the site in VA
approximately 3.6% of the seedlings were influenced by the skid trails. The area in skid trials
may reach 10.3% of the total harvested area (Kochenderfer, 1977), which would obviously have
a large impact on tree variability.
All the uniformity parameters indicate that HT is more uniform than DBH, which has
been reported in other studies such as DeBell and Harrington (1997) on Populus clones,
Aspinwall et al. (2011) on loblolly pine clones, and Sharma et al. (2008) on radiata pine (Pinus
radiata D. Don.) clones. However, both HT and DBH were more uniform than tree volume.
Furthermore, the variability in tree growth was greater within each site than between sites, which
is probably caused by the spatial variation in the soil properties within sites. This is illustrated
by the large range for the uniformity parameters within the block-plots at a site. For example,
block-plots with variety C4 had CV’s for DBH ranging from 19-38% at NC and 12-30% at VA.
The OP family had CV’s ranging from 17-42% at NC and 25-48% at VA. The broad range of
the uniformity parameters in this study may be caused by heterogeneity of soil properties that
occur across short distance at these sites. Each study site was approximately 10 ha in size. In
both the VA and NC sites there is large variability in soil properties at these spatial scales

71
(Daniels and Gamble, 1967; Duffera et al., 2007; Phillips et al., 1994). In the Piedmont, soils are
highly eroded from past agricultural practices, which created variation in the depth and
properties of topsoil (Thomas et al., 1989; Sherwood et al., 2010). Small differences in
microtopography on the Coastal Plain can alter soil (Pritchett and Gooding, 1975), and bedding
is a common site preparation practice for loblolly pine plantations in these poorly drained sites
(McKee and Wilhite, 1986). However, the variability in the water table level at NC may have
not been entirely ameliorated by bedding in this study. Some studies on bedding have shown
both positive (Carlson et al., 2006, Xu et al., 2002) and no effect (Will, 2002) on stand
uniformity on loblolly pine. The effectiveness of bedding may be site-specific as well as
determined by its quality. In this study, the reduced dataset did not contain the trees located on
poor beds, which increased the observed uniformity. However, there was still a great variability
in tree growth at NC. This high variability has been reported previously in forest soils. For
instance, in a progeny test study in Douglas-fir, Fu et al. (1999) found that the 11% of the within-
site variation in tree height was attributed to genetic differences, whereas around 59% was
attributed to patchiness and within plot variation. Similarly, in a clonal study, Aspinwall et al.
(2011) found a significant genotype by block interaction effect of tree growth, reflecting the role
of within site heterogeneity on the performance of a genotype at relatively short distances. Plant
roots exploit patches of soil where nutrients are abundant, so the spatial variability at fine-scale
may increase the performance of individual trees (Zhou et al., 2012). Significant spatial
variation in the physicochemical soil properties and its effect on productivity has been reported
even in relatively uniform agricultural fields (Corwin et al., 2003; Kravchenko et al., 2006). The
uniformity parameters determined in this study represent the growth variability at very short
distances (block-plot area of 202 m2), which under the assumption of no genetic variability
72
among the trees within a variety, all the variation might be attributed to micro-site spatial
variation.
If the micro site variation is still high after the site preparation, intensive silvicultural
treatment such as fertilization may 1) exacerbate this variation by promoting the growth of larger
trees growing in more favorable micro-sites, which may decrease uniformity or 2) ameliorate the
resource limitation of the trees and thus decrease competition, which may increase stand
uniformity. The overall results will depend of the intrinsic site variability of the soil properties,
and how well the silvicultural practices are implemented. Across the two sites, and based in the
reduced dataset intensive silviculture increased stand volume by 50% relative to the operational
treatment, and increased the uniformity for DBH (p<0.1) and volume (p<0.05). The GI and CV
of DBH and volume were slightly but significantly lower in the intensive treatment than in the
operational treatment. The fact that silvicultural intensity did not affect the uniformity of DBH
when calculations were based in the full dataset (Table 6) may suggest that the silvicultural
treatments were unable to ameliorate the resource limitation on all microsites, such as the skid
trail at VA or the depressions at NC. We did not include any tillage treatment in the site
preparation at VA, which would likely have ameliorated soil compaction in the skid trail and
increase tree growth (Gent et al., 1986). Likewise, improved and more consistent bedding at the
site in NC might have improved seedling growth at the poorly drained site in NC (Aust and
Blinn, 2004). Previous work has suggested that increasing the silvicultural intensity beyond the
level implemented in this study might lead to an increase in stand uniformity. Increases in stand
uniformity in loblolly pine (measured by the CV) due to intensive silviculture have been shown
in some studies by Carlson at al. (2006), Nilsson et al. (2002), Purvis (2009), and Stape et al.
(2013). Purvis (2009) found an effect of the intensive relative to operational silviculture

73
treatment starting early at age 2, in a site in the lower coastal plain (CV’s of 34 and 27%,
respectively).
In this study, the growth and uniformity of varietal versus non-varietal sources (OP and
CMP family) may be affected by the type of seedling production. The OP and CMP family were
produced as bare root seedlings while the varieties were produced as containerized seedlings. At
planting, the containerized seedlings of the varieties (mean root collar diameter of 6.2 mm and
mean height of 25 cm) were significantly bigger than the bareroot seedlings of the OP and CMP
family (mean root collar diameter of 4.5 mm and mean height of 20 cm). However, there were
no significant differences in the CV for height and root collar diameter among genetic sources.
Genotypes exhibiting broad crowns might demand more soil resources to sustain larger
canopies than narrow crown varieties and may begin to compete earlier in the rotation and thus
decrease stand uniformity. However, we found that the variety exhibiting the broadest crown
(C4) was the most uniform, whereas the variety exhibiting the narrowest crown (C1) was the
least uniform. The other two varieties were in an intermediate situation. Therefore, our results
through age four did not support this hypothesis. Possibly this will develop at a later age.
Further analysis is required in the future to clarify the effect of silvicultural intensity on stand
uniformity. The study of Binkley (2010) and Campoe (2013a) support the hypothesis of a higher
resource use efficiency of dominant trees at expenses of suppressed ones. This implies that stand
uniformity will decrease later in the rotation, as the competition for resources increases over the
stand development. At age 4, the trees in this study were in the onset of the canopy closure.
Once the canopy closures, the intraspecific competition for soil resources and light will affect the
processes of self-thinning, and subsequently the stand uniformity. Some studies reported that
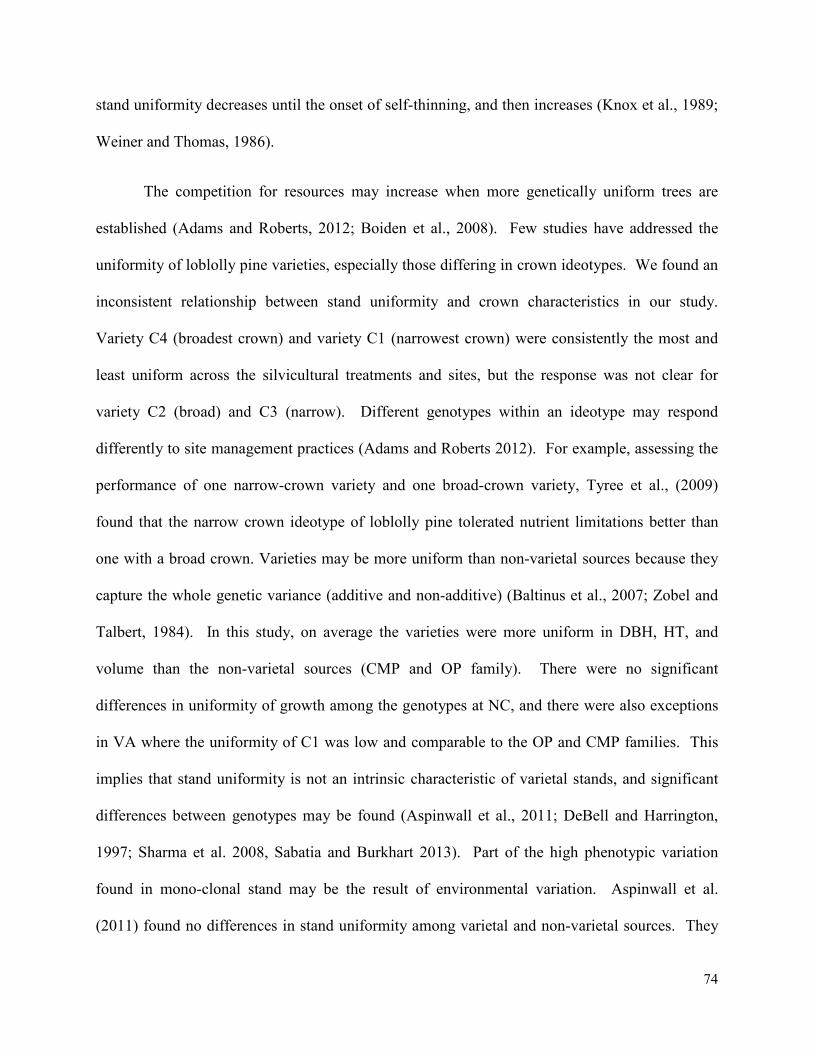
74
stand uniformity decreases until the onset of self-thinning, and then increases (Knox et al., 1989;
Weiner and Thomas, 1986).
The competition for resources may increase when more genetically uniform trees are
established (Adams and Roberts, 2012; Boiden et al., 2008). Few studies have addressed the
uniformity of loblolly pine varieties, especially those differing in crown ideotypes. We found an
inconsistent relationship between stand uniformity and crown characteristics in our study.
Variety C4 (broadest crown) and variety C1 (narrowest crown) were consistently the most and
least uniform across the silvicultural treatments and sites, but the response was not clear for
variety C2 (broad) and C3 (narrow). Different genotypes within an ideotype may respond
differently to site management practices (Adams and Roberts 2012). For example, assessing the
performance of one narrow-crown variety and one broad-crown variety, Tyree et al., (2009)
found that the narrow crown ideotype of loblolly pine tolerated nutrient limitations better than
one with a broad crown. Varieties may be more uniform than non-varietal sources because they
capture the whole genetic variance (additive and non-additive) (Baltinus et al., 2007; Zobel and
Talbert, 1984). In this study, on average the varieties were more uniform in DBH, HT, and
volume than the non-varietal sources (CMP and OP family). There were no significant
differences in uniformity of growth among the genotypes at NC, and there were also exceptions
in VA where the uniformity of C1 was low and comparable to the OP and CMP families. This
implies that stand uniformity is not an intrinsic characteristic of varietal stands, and significant
differences between genotypes may be found (Aspinwall et al., 2011; DeBell and Harrington,
1997; Sharma et al. 2008, Sabatia and Burkhart 2013). Part of the high phenotypic variation
found in mono-clonal stand may be the result of environmental variation. Aspinwall et al.
(2011) found no differences in stand uniformity among varietal and non-varietal sources. They

75
attributed that this variability in varietal stand depends on the variability of the soil properties,
and less genetically uniform stands have more buffering capacity to counteract this within-site
variability. However, this fact did not entirely explain the findings of our study as was shown by
the differences in uniformity of varieties C1 and C4 relative to the uniformity of the OP family.
Another factor that may explain the variability in the varieties found in this study may be
the carry-over effect from the seedling production system (e.g. cuttings versus seedlings
produced by somatic embryogenesis), which may affect the quality and vigor of the plants at
establishment. Mean CVs for DBH for the varieties produced by somatic embryogenesis in this
study range between 19 and 38%. Maier et al. (2012) reported much lower CVs for DBH (8.9-
15.4%) in loblolly pine varieties produced through vegetative rooted cuttings., However, the
Maier et al. (2012) study site also had very uniform site preparation which also likely contributed
to lower CVs. In vegetative propagation systems, characteristics such as the maturation of the
donor tissue, C-effects, and specific interaction between the genotypes and propagation system
may contribute to the plant to plant variability (White et al., 2007). In loblolly pine, there is
some evidence demonstrating genetic variability in the somatic embryogenesis process.
Genotypes may differ (either by its maternal or paternal effect) in their ability to produce quality-
embryonic tissue (Cairney and Pullman, 2006; Mackay et al., 2006). It is possible that
differences in uniformity among varieties C1 and C4 may be associated with differences in the
quality of the embryonic tissue.
The uniformity parameters GI, CV, and P50 were highly correlated as has been shown in
other studies (Bendel et al., 1989, Hakamada, 2012). The coefficients of correlations with STD
were somewhat lower. The preference for any of the uniformity parameters will depend on the
study objectives and the properties of the data distribution (Bendel et al., 1989). GI, CV, and

76
P50 are sensitivity to small changes in the mean, so the correlation among these parameters will
be higher when populations are distributed normally (Bendel et al., 1989), as was found in this
study. For biased populations exhibiting the same GI, P50 penalized much more positively than
negatively skewed distributions, which tends to assign lower uniformity when the proportion of
smaller trees increases relative to the proportion of bigger trees. Nevertheless, all the uniformity
parameters showed that increasing stand uniformity has a positive effect on stand productivity,
except STD for stem volume, which had a positive correlation with volume (Table 9). The later
result was not surprising because of that populations with higher means are associated with
higher variation, which is one of the disadvantages of using STD to assess uniformity (Weiner
and Thomas, 1986). However, this was not the case when we correlated STD of DBH and height
against their means, which constitutes further evidence of the positive effect of stand uniformity
on productivity. Hence, we accept the hypothesis of an increase in stand productivity due to an
improvement of stand uniformity. The increase in stand productivity in more uniform standsmay
be due to an increase in the resource efficiency (Binkley et al., 2010; Stape et al., 2010).
However, this may not be always the case. Luu et al. (2013) stated that there are specific
situations in which stand productivity may be maintained or decreased as a consequence of stand
uniformity, which is associated with the productivity of dominant trees and how they compensate
for the lower productivity of suppressed trees. Sharma et al. (2008) found that stands of radiata
pine clones exhibiting different stand uniformity (CV based) had the same productivity at 12
years.
Overall, our results showed a significant genetic effect on stand uniformity, but the
changes in stand uniformity were not consistent within the ideotypes or genetic sources (varietal
versus non-varietal). Moreover, the genetic effects on stand uniformity were site-specific

77
(genotype by environment interaction), which indicates that the heterogeneity within the site may
obscure the potential greater uniformity of some varieties. Greater uniformity was positively
related with stand productivity. At this young stage of the stand development, the intra-site
heterogeneity and genotypes effects explained the stand uniformity in our sites, with less
attributed to the effect of silvicultural treatments and specific site disturbances such as poor-
quality beds and the presence of skid trails. The effect of silvicultural intensity may become
more important as intraspecific competition becomes intense later in the rotation.

78
TABLES AND FIGURES
Table 1. Parents of the six genotypes assessed. Genotypes C1, C2, C3, and C4 correspond to the
varieties; OP; open pollinated family; CMP; control mass pollinated family. A, B, C, D and E
are arbitrary codes representing the pedigree of the parents.
A B D
A C1
B C4
C C2 CMP
E C3
? OP
Mother
Fat
her
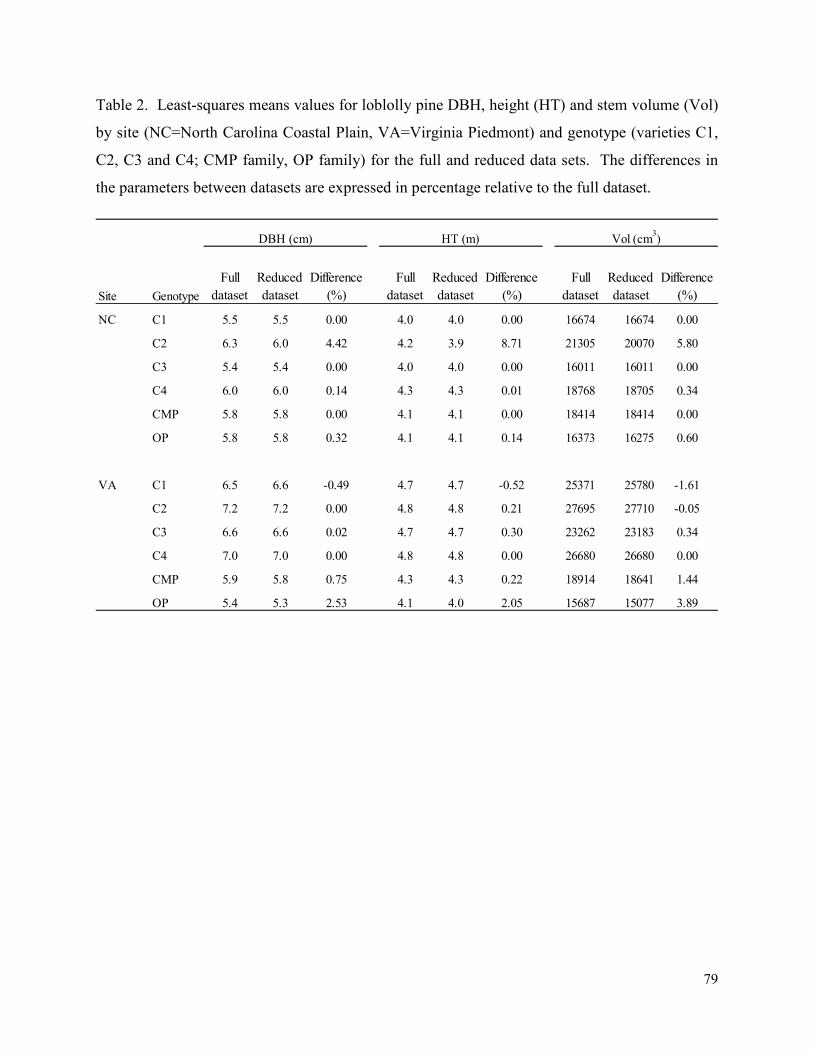
79
Table 2. Least-squares means values for loblolly pine DBH, height (HT) and stem volume (Vol)
by site (NC=North Carolina Coastal Plain, VA=Virginia Piedmont) and genotype (varieties C1,
C2, C3 and C4; CMP family, OP family) for the full and reduced data sets. The differences in
the parameters between datasets are expressed in percentage relative to the full dataset.
Site Genotype
Full
dataset
Reduced
dataset
Difference
(%)
Full
dataset
Reduced
dataset
Difference
(%)
Full
dataset
Reduced
dataset
Difference
(%)
NC C1 5.5 5.5 0.00 4.0 4.0 0.00 16674 16674 0.00
C2 6.3 6.0 4.42 4.2 3.9 8.71 21305 20070 5.80
C3 5.4 5.4 0.00 4.0 4.0 0.00 16011 16011 0.00
C4 6.0 6.0 0.14 4.3 4.3 0.01 18768 18705 0.34
CMP 5.8 5.8 0.00 4.1 4.1 0.00 18414 18414 0.00
OP 5.8 5.8 0.32 4.1 4.1 0.14 16373 16275 0.60
VA C1 6.5 6.6 -0.49 4.7 4.7 -0.52 25371 25780 -1.61
C2 7.2 7.2 0.00 4.8 4.8 0.21 27695 27710 -0.05
C3 6.6 6.6 0.02 4.7 4.7 0.30 23262 23183 0.34
C4 7.0 7.0 0.00 4.8 4.8 0.00 26680 26680 0.00
CMP 5.9 5.8 0.75 4.3 4.3 0.22 18914 18641 1.44
OP 5.4 5.3 2.53 4.1 4.0 2.05 15687 15077 3.89
DBH (cm) HT (m) Vol (cm3)

80
Table 3. Mean values for loblolly pine stand uniformity parameters and stand volume in North
Carolina (NC) and Virginia (VA) site for the full and reduced data sets. The differences in the
parameters between datasets are expressed in percentage relative to the full dataset.
Note: GINI: Gini index, P50, CV: coefficient of variation; STD: standard deviation; DBH: diameter to the breast
height; HT: tree height; Vol: tree volume.
Variable
Full
dataset
Reduced
dataset
Difference
(%)
Full
dataset
Reduced
dataset
Difference
(%)
GINI (DBH) 0.190 0.183 3.19 0.153 0.149 2.81
GINI (HT) 0.116 0.109 6.14 0.100 0.096 3.48
GINI (VOL) 0.381 0.38 0.26 0.307 0.3 2.28
P50 (DBH) 0.379 0.383 -1.03 0.407 0.409 -0.43
P50 (HT) 0.430 0.436 -1.38 0.444 0.445 -0.22
P50 (VOL) 0.239 0.238 0.42 0.293 0.297 -1.37
CV (DBH) (%) 35.0 32.6 6.66 28.8 28.1 2.25
CV (HT) (%) 21.4 19.6 8.67 18.9 18.2 3.38
CV (VOL) 72.6 72.6 0.08 56.0 54.8 2.19
STD (DBH) (cm) 1.91 1.83 4.58 1.76 1.73 1.42
STD (HT) (m) 0.82 0.78 4.55 0.83 0.81 2.72
STD (VOL) (cm3) 12197 12205 -0.06 11895 11778 0.99
Stand Volume (m3/ha) 21.7 22.0 -1.29 28.3 28.6 -1.35
NC VA

81
Table 4. Coefficients of correlations between loblolly pine stand uniformity parameters at the
North Carolina (NC) and Virginia (VA) site for the full dataset.
Note: GINI: Gini index, P50, CV: coefficient of variation; STD: standard deviation; DBH: diameter to the breast
height; HT: tree height; Vol: tree volume. ** denotes significant effects at an alpha level of 0.001
NC
GINI P50 CV STD GINI P50 CV STD GINI P50 CV STD
GINI -0.95 ** 0.99 ** 0.75 ** 0.89 ** -0.82 ** 0.88 ** 0.82 ** 0.98 ** -0.97 ** 0.93 ** -0.05 ns
P50 -0.93 ** -0.62 ** -0.85 ** 0.86 ** -0.83 ** -0.74 ** -0.91 ** 0.97 ** -0.84 ** 0.17 ns
CV 0.75 ** 0.89 ** -0.8 ** 0.88 ** 0.83 ** 0.98 ** -0.96 ** 0.94 ** -0.05 ns
STD 0.63 ** -0.49 ** 0.61 ** 0.74 ** 0.74 ** -0.69 ** 0.7 ** 0.58 **
GINI -0.93 ** 0.98 ** 0.95 ** 0.85 ** -0.86 ** 0.79 ** -0.09 ns
P50 -0.92 ** -0.85 ** -0.79 ** 0.84 ** -0.73 ** 0.16 ns
CV 0.95 ** 0.83 ** -0.84 ** 0.77 ** -0.11 ns
STD 0.79 ** -0.78 ** 0.73 ** 0.14 ns
GINI -0.97 ** 0.97 ** 0.00 ns
P50 -0.91 ** 0.08 ns
CV 0.03 ns
STD
VA
GINI P50 CV STD GINI P50 CV STD GINI P50 CV STD
GINI -0.97 ** 0.99 ** 0.87 ** 0.94 ** -0.88 ** 0.93 ** 0.87 ** 0.96 ** -0.95 ** 0.95 ** 0.09 ns
P50 -0.96 ** -0.85 ** -0.93 ** 0.93 ** -0.91 ** -0.85 ** -0.96 ** 0.97 ** -0.95 ** -0.14 ns
CV 0.88 ** 0.94 ** -0.87 ** 0.94 ** 0.88 ** 0.94 ** -0.93 ** 0.93 ** 0.08 ns
STD 0.82 ** -0.76 ** 0.83 ** 0.89 ** 0.82 ** -0.81 ** 0.81 ** 0.5 **
GINI -0.94 ** 0.99 ** 0.94 ** 0.94 ** -0.92 ** 0.94 ** 0.14 ns
P50 -0.92 ** -0.86 ** -0.9 ** 0.93 ** -0.92 ** -0.17 ns
CV 0.96 ** 0.91 ** -0.89 ** 0.91 ** 0.14 ns
STD 0.85 ** -0.83 ** 0.84 ** 0.35 *
GINI -0.99 ** 0.99 ** 0.14 ns
P50 -0.99 ** -0.16 ns
CV 0.14 ns
STD
VolDBH HT
DB
HH
eigh
tV
olu
me
Volu
me
DBH HT VOL
DB
HH
eight

82
Table 5. Coefficients of correlations between loblolly pine stand uniformity parameters at the
North Carolina (NC) and Virginia (VA) site for the reduced dataset.
Note: GINI: Gini index, P50, CV: coefficient of variation; STD: standard deviation; DBH: diameter to the breast
height; HT: tree height; Vol: tree volume. ** denotes significant effects at an alpha level of 0.001
NC
GINI P50 CV STD GINI P50 CV STD GINI P50 CV STD
GINI -0.95 ** 0.99 ** 0.75 ** 0.89 ** -0.81 ** 0.88 ** 0.82 ** 0.98 ** -0.97 ** 0.93 ** -0.06 ns
P50 -0.94 ** -0.64 ** -0.86 ** 0.86 ** -0.84 ** -0.75 ** -0.91 ** 0.97 ** -0.86 ** 0.15 ns
CV 0.75 ** 0.89 ** -0.8 ** 0.88 ** 0.83 ** 0.98 ** -0.96 ** 0.94 ** -0.05 ns
STD 0.63 ** -0.49 ** 0.61 ** 0.73 ** 0.75 ** -0.7 ** 0.7 ** 0.58 **
GINI -0.93 ** 0.98 ** 0.95 ** 0.85 ** -0.87 ** 0.79 ** -0.09 ns
P50 -0.92 ** -0.86 ** -0.78 ** 0.83 ** -0.74 ** 0.13 ns
CV 0.95 ** 0.84 ** -0.85 ** 0.78 ** -0.11 ns
STD 0.8 ** -0.79 ** 0.74 ** 0.14 ns
GINI -0.97 ** 0.97 ** 0.00 ns
P50 -0.92 ** 0.07 ns
CV 0.04 ns
STD
VA
GINI P50 CV STD GINI P50 CV STD GINI P50 CV STD
GINI -0.96 ** 0.99 ** 0.84 ** 0.93 ** -0.85 ** 0.91 ** 0.82 ** 0.96 ** -0.94 ** 0.95 ** 0.01 ns
P50 -0.94 ** -0.83 ** -0.91 ** 0.92 ** -0.88 ** -0.8 ** -0.95 ** 0.97 ** -0.94 ** -0.1 ns
CV 0.87 ** 0.93 ** -0.84 ** 0.93 ** 0.85 ** 0.94 ** -0.91 ** 0.93 ** 0.01 ns
STD 0.81 ** -0.76 ** 0.84 ** 0.89 ** 0.79 ** -0.79 ** 0.78 ** 0.46 ns
GINI -0.93 ** 0.99 ** 0.93 ** 0.89 ** -0.88 ** 0.88 ** 0.05 ns
P50 -0.9 ** -0.85 ** -0.84 ** 0.89 ** -0.84 ** -0.15 ns
CV 0.96 ** 0.85 ** -0.84 ** 0.84 ** 0.06 ns
STD 0.76 ** -0.76 ** 0.75 ** 0.29 *
GINI -0.98 ** 0.99** 0.05 ns
P50 -0.97 ** -0.1 ns
CV 0.06 ns
STD
HT Vol
Vol
DB
HH
eight
Volu
me
DBH HT
DBH
DB
HH
eight
Volu
me
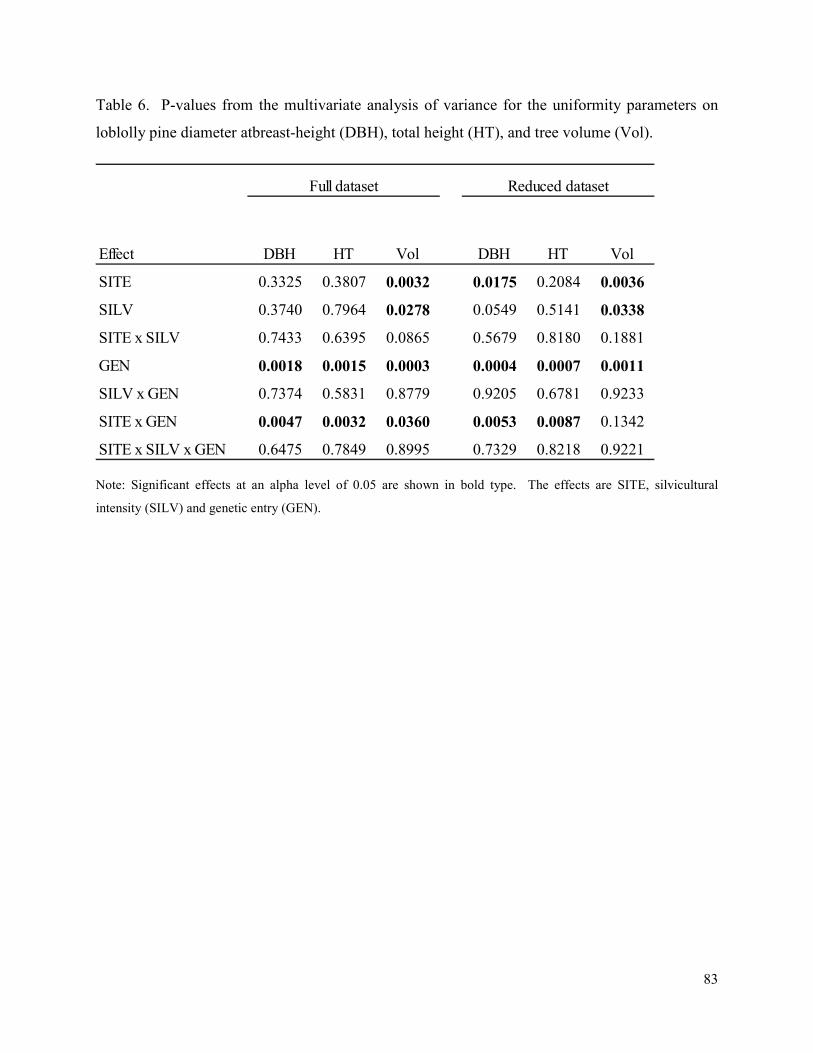
83
Table 6. P-values from the multivariate analysis of variance for the uniformity parameters on
loblolly pine diameter atbreast-height (DBH), total height (HT), and tree volume (Vol).
Note: Significant effects at an alpha level of 0.05 are shown in bold type. The effects are SITE, silvicultural
intensity (SILV) and genetic entry (GEN).
Effect DBH HT Vol DBH HT Vol
SITE 0.3325 0.3807 0.0032 0.0175 0.2084 0.0036
SILV 0.3740 0.7964 0.0278 0.0549 0.5141 0.0338
SITE x SILV 0.7433 0.6395 0.0865 0.5679 0.8180 0.1881
GEN 0.0018 0.0015 0.0003 0.0004 0.0007 0.0011
SILV x GEN 0.7374 0.5831 0.8779 0.9205 0.6781 0.9233
SITE x GEN 0.0047 0.0032 0.0360 0.0053 0.0087 0.1342
SITE x SILV x GEN 0.6475 0.7849 0.8995 0.7329 0.8218 0.9221
Full dataset Reduced dataset
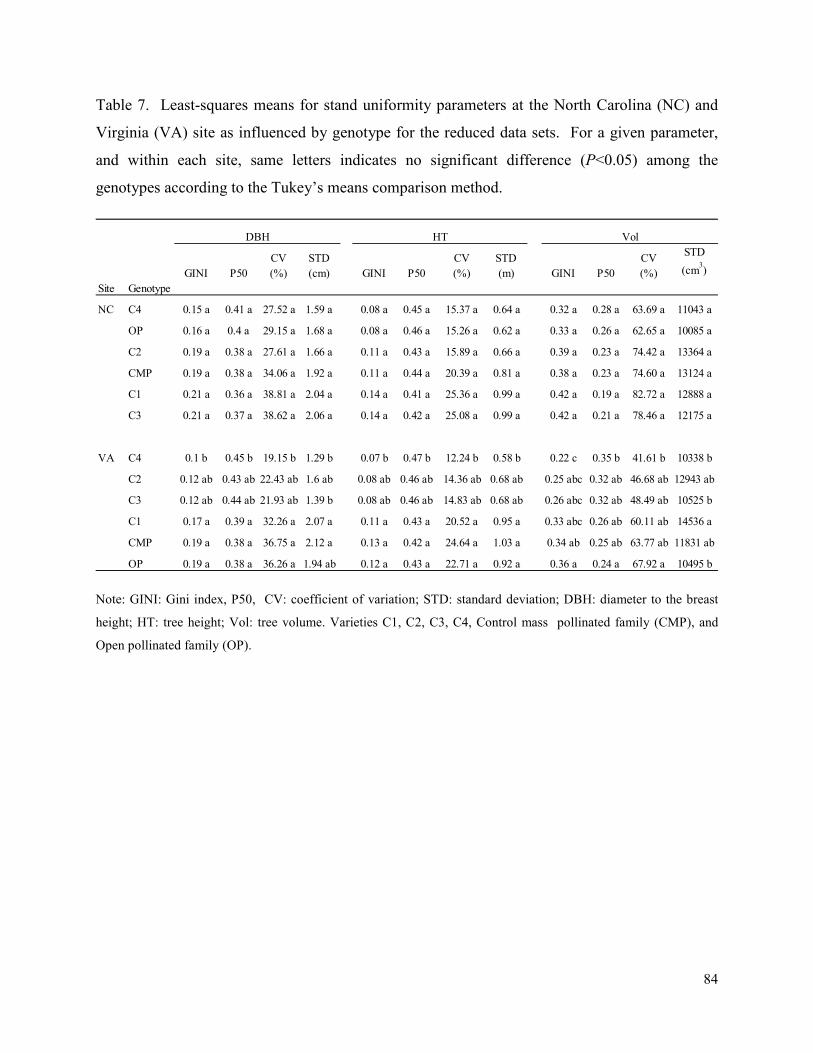
84
Table 7. Least-squares means for stand uniformity parameters at the North Carolina (NC) and
Virginia (VA) site as influenced by genotype for the reduced data sets. For a given parameter,
and within each site, same letters indicates no significant difference (P<0.05) among the
genotypes according to the Tukey’s means comparison method.
Note: GINI: Gini index, P50, CV: coefficient of variation; STD: standard deviation; DBH: diameter to the breast
height; HT: tree height; Vol: tree volume. Varieties C1, C2, C3, C4, Control mass pollinated family (CMP), and
Open pollinated family (OP).
Site Genotype
GINI P50
CV
(%)
STD
(cm) GINI P50
CV
(%)
STD
(m) GINI P50
CV
(%)
STD
(cm3)
NC C4 0.15 a 0.41 a 27.52 a 1.59 a 0.08 a 0.45 a 15.37 a 0.64 a 0.32 a 0.28 a 63.69 a 11043 a
OP 0.16 a 0.4 a 29.15 a 1.68 a 0.08 a 0.46 a 15.26 a 0.62 a 0.33 a 0.26 a 62.65 a 10085 a
C2 0.19 a 0.38 a 27.61 a 1.66 a 0.11 a 0.43 a 15.89 a 0.66 a 0.39 a 0.23 a 74.42 a 13364 a
CMP 0.19 a 0.38 a 34.06 a 1.92 a 0.11 a 0.44 a 20.39 a 0.81 a 0.38 a 0.23 a 74.60 a 13124 a
C1 0.21 a 0.36 a 38.81 a 2.04 a 0.14 a 0.41 a 25.36 a 0.99 a 0.42 a 0.19 a 82.72 a 12888 a
C3 0.21 a 0.37 a 38.62 a 2.06 a 0.14 a 0.42 a 25.08 a 0.99 a 0.42 a 0.21 a 78.46 a 12175 a
VA C4 0.1 b 0.45 b 19.15 b 1.29 b 0.07 b 0.47 b 12.24 b 0.58 b 0.22 c 0.35 b 41.61 b 10338 b
C2 0.12 ab 0.43 ab 22.43 ab 1.6 ab 0.08 ab 0.46 ab 14.36 ab 0.68 ab 0.25 abc 0.32 ab 46.68 ab 12943 ab
C3 0.12 ab 0.44 ab 21.93 ab 1.39 b 0.08 ab 0.46 ab 14.83 ab 0.68 ab 0.26 abc 0.32 ab 48.49 ab 10525 b
C1 0.17 a 0.39 a 32.26 a 2.07 a 0.11 a 0.43 a 20.52 a 0.95 a 0.33 abc 0.26 ab 60.11 ab 14536 a
CMP 0.19 a 0.38 a 36.75 a 2.12 a 0.13 a 0.42 a 24.64 a 1.03 a 0.34 ab 0.25 ab 63.77 ab 11831 ab
OP 0.19 a 0.38 a 36.26 a 1.94 ab 0.12 a 0.43 a 22.71 a 0.92 a 0.36 a 0.24 a 67.92 a 10495 b
DBH HT Vol
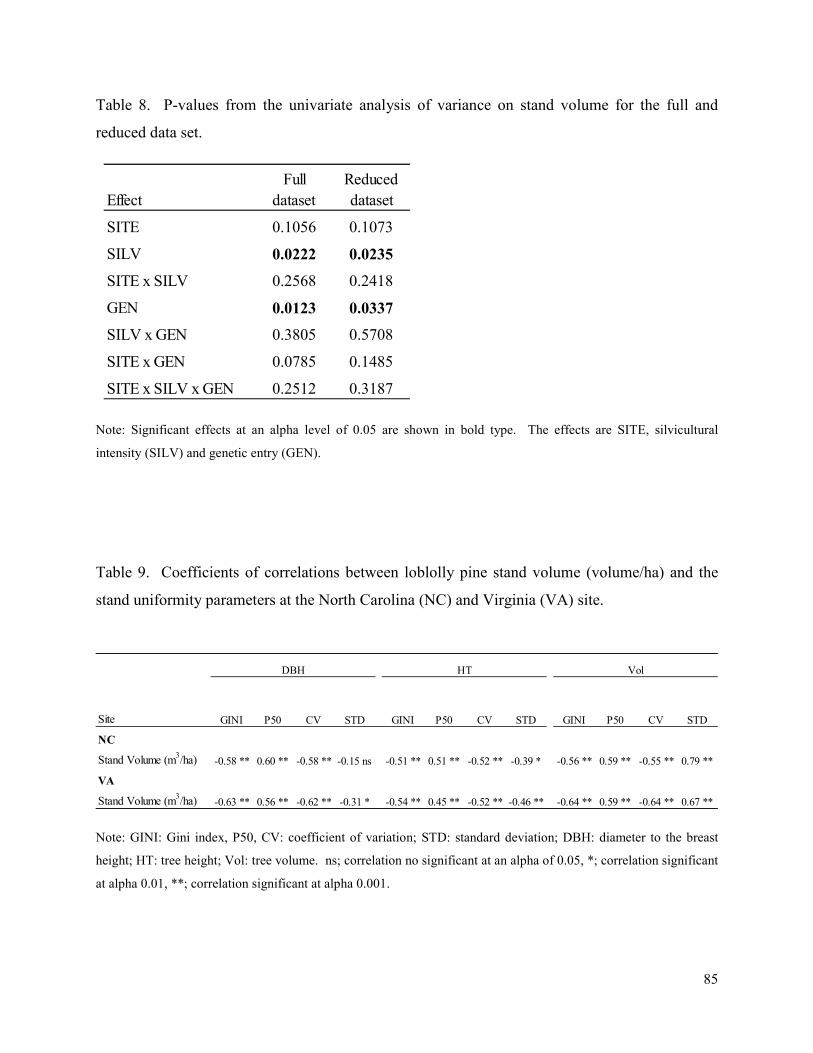
85
Table 8. P-values from the univariate analysis of variance on stand volume for the full and
reduced data set.
Note: Significant effects at an alpha level of 0.05 are shown in bold type. The effects are SITE, silvicultural
intensity (SILV) and genetic entry (GEN).
Table 9. Coefficients of correlations between loblolly pine stand volume (volume/ha) and the
stand uniformity parameters at the North Carolina (NC) and Virginia (VA) site.
Note: GINI: Gini index, P50, CV: coefficient of variation; STD: standard deviation; DBH: diameter to the breast
height; HT: tree height; Vol: tree volume. ns; correlation no significant at an alpha of 0.05, *; correlation significant
at alpha 0.01, **; correlation significant at alpha 0.001.
Effect
Full
dataset
Reduced
dataset
SITE 0.1056 0.1073
SILV 0.0222 0.0235
SITE x SILV 0.2568 0.2418
GEN 0.0123 0.0337
SILV x GEN 0.3805 0.5708
SITE x GEN 0.0785 0.1485
SITE x SILV x GEN 0.2512 0.3187
Site GINI P50 CV STD GINI P50 CV STD GINI P50 CV STD
NC
Stand Volume (m3/ha) -0.58 ** 0.60 ** -0.58 ** -0.15 ns -0.51 ** 0.51 ** -0.52 ** -0.39 * -0.56 ** 0.59 ** -0.55 ** 0.79 **
VA
Stand Volume (m3/ha) -0.63 ** 0.56 ** -0.62 ** -0.31 * -0.54 ** 0.45 ** -0.52 ** -0.46 ** -0.64 ** 0.59 ** -0.64 ** 0.67 **
VolDBH HT

86
Figure 1. Plot layout indicating the silvicultural treatment (whole plot), genotypes (split-plot)
and planting density (split-split plot) were randomized hierarchically within each block. The site
at North Carolina (NC) and Virginia (VA) had 3 and 4 blocks, respectively. Genotypes C1, C2,
C3, and C4 correspond to the varieties; OP; open pollinated family; CMP; control mass
pollinated family. The whole plot was 99 by 146 m at VA and 78 by 146 m at NC.
C1
C2
C3
C4
CMP
OP
Operational Intensive
BLOCKGenotype
1235 trees/ha
617 trees/ha
617 trees/ha
1852 trees/ha
617 trees/ha
1235 trees/ha
1852 trees/ha
1235 trees/ha
1235 trees/ha
617 trees/ha
1852 trees/ha
617 trees/ha
617 trees/ha
1852 trees/ha
617 trees/ha
617 trees/ha
1852 trees/ha
1235 trees/ha
1852 trees/ha
1235 trees/ha
1852 trees/ha
1235 trees/ha
617 trees/ha
617 trees/ha
1235 trees/ha
1235 trees/ha
1235 trees/ha1852 trees/ha
1235 trees/ha
1852 trees/ha
1852 trees/ha
1235 trees/ha
617 trees/ha
1852 trees/ha
1852 trees/ha
617 trees/ha

87
Figure 2. Example of the representation of the Gini-index and P50 calculations. The x-axis
represents the cumulative proportion of trees within the plot sorted by tree height, and the y-axis
represents the cumulative tree height at a given cumulative number of trees. In a perfect uniform
stand the Lorenz curve equals the 45° line, and deviates as the uniformity decreases. The Gini-
index is calculated as the difference between the area under the 45° line and the area under the
Lorenz curve. In the example, the Lorenz curve for one block-plot of variety C1, under planting
density of 1235 TPA at Bladen Lakes, in intensive and operational silviculture treatment is
depicted. PHT50 correspond to the cumulative tree height of the 50% of the trees.
0
0.1
0.2
0.3
0.4
0.5
0.6
0.7
0.8
0.9
1
0 0.1 0.2 0.3 0.4 0.5 0.6 0.7 0.8 0.9 1
Cum
ulat
ive
tree
hei
ght
with
in
the
plo
t
Cumulative proportion of trees within the plot
Variety C1_Operational silvicultural treatment
Perfect uniformity in tree height
Lorenz curve
P50
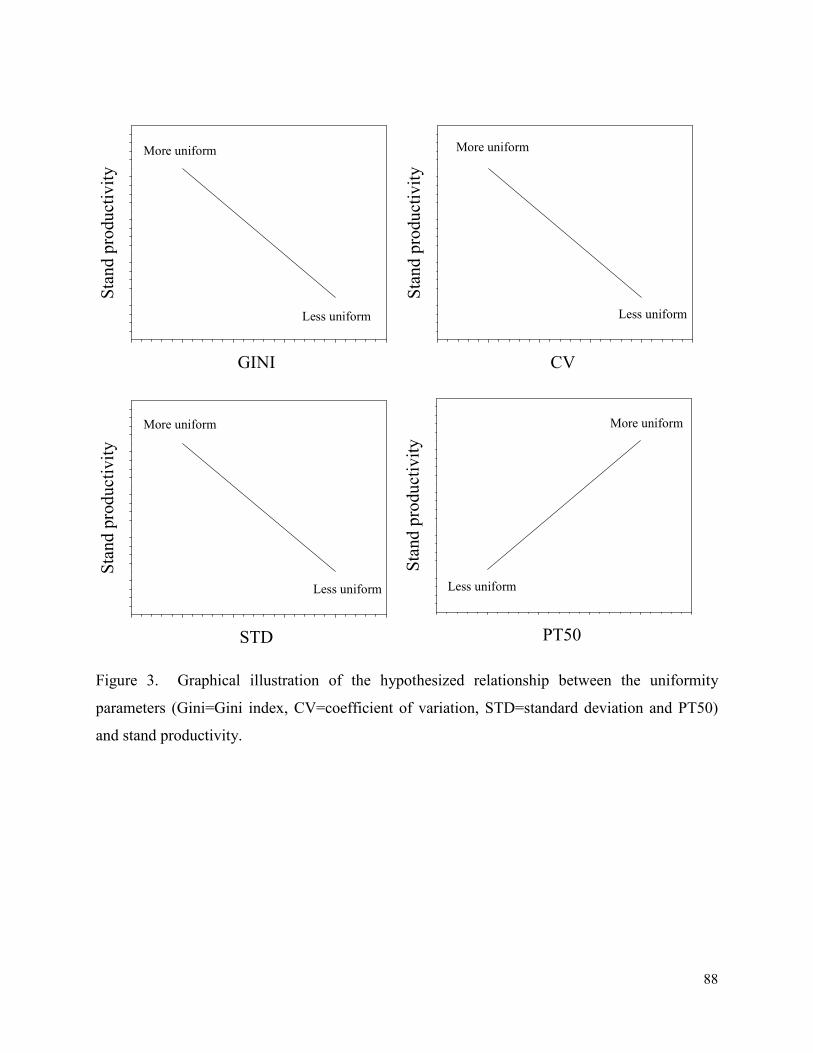
88
Figure 3. Graphical illustration of the hypothesized relationship between the uniformity
parameters (Gini=Gini index, CV=coefficient of variation, STD=standard deviation and PT50)
and stand productivity.
GINI
Sta
nd
pro
du
ctiv
ity
More uniform
Less uniform
STD
Sta
nd
pro
du
ctiv
ity
More uniform
Less uniform
CV
Sta
nd
pro
du
ctiv
ity
More uniform
Less uniform
PT50
Sta
nd
pro
du
ctiv
ityMore uniform
Less uniform

89
Figure 4. Least-squares means of loblolly pine stand volume as influenced by the genotypes
across the two sites. Genotypes with the same letter indicates significant differences (P<0.05)
among the genotypes (Varieties C1, C2, C3, C4, Control mass pollinated family (CMP), and
Open pollinated family (OP) according to the Tukey’s means comparison method.
0
5
10
15
20
25
30
35
C1 C2 C3 C4 CMP OP
Stand volume (m
3/ha)
Genotype
abab
ab
b
aa

90
REFERENCES
Adams, J.P., Roberts, S.D., 2013. A comparison of growth and stand structural characteristics in
pure- and mixed-family stands of loblolly pine. Forest Science 59, 188-196.
Allen, H.L., Fox, T.R., Campbell, R. G., 2005. What is ahead for intensive pine plantation
silviculture in the south?. South. J. Appl. For. 29, 62-69.
Aspinwall, M.J., King, J.S., McKeand, S.E., Bullock, B.P., 2011. Genetic effects on stand-level
uniformity and above- and belowground dry mass production in juvenile loblolly pine. Forest
Ecol. Manag. 262, 609-619.
Aust, W.M., Blinn, C.R., 2004. Forestry best management practices for timber harvesting and
site preparation in the eastern United States: An overview of water quality and productivity
research during the past 20 years (1982–2002). Water Air Soil Pollut. 4(1), 5–36.
Baltunis, B.S., Huber, D.A., White, T.L., Goldfarb, B., Stelzer, H.E., 2007. Genetic analysis of
early field growth of loblolly pine clones and seedlings from the same full-sib families. Can. J.
For. Res. 37, 195-205.
Bendel, R.B., Higgins, S.S., Teberg, J.E., Pyke, D.A., 1989. Comparison of skewness coefficient,
coefficient of variation, and Gini coefficient as inequality measures within populations.
Oecologia 78, 394-400.
Bettinger, P., Clutter, M., Siry, J., Kane, M., Pait, J., 2009. Broad implications of southern
United States pine clonal forestry on planning and management of forests. International Forestry
Review 11, 331-345.
Binkley, D., Stape, J.L., Bauerle, W.L., Ryan, M.G., 2010. Explaining growth of individual
trees: Light interception and efficiency of light use by Eucalyptus at four sites in Brazil. Forest
Ecol. Manag. 259, 1704-1713.
Boyden, S., Binkely, D., Stape, J.L., 2008. Competition among eucalyptus trees depends on
genetic variation and resource supply. Ecology 89, 2850-2859.
Cairney, J., Pullman, G.S., 2007. The cellular and molecular biology of conifer embryogenesis.
The New Phytologist 176, 511-536.
Campoe, O.C., Stape, J.L., Albaugh, T.J., Allen, H.L., Fox, T.R., Rubilar, R., Binkley, D.,
91
2013a. Fertilization and irrigation effects on tree level aboveground net primary production,
light interception and light use efficiency in a loblolly pine plantation. Forest Ecol. Manag. 288,
43-48.
Campoe, O.C., Stape, J.L., Nouvellon, Y., Laclau, J-P., Bauerle, W.L., Binkley, D., Le Maire,
G., 2013b. Stem production, light absorption and light use efficiency between dominant and
non-dominant trees of Eucalyptus grandis across a productivity gradient in Brazil. Forest Ecol.
Manag. 288 14-20.
Carlson, C.A., Fox, T.R., Colbert, S.R., Kelting, D.L., Allen, H.L., Albaugh, T.J., 2006. Growth
and survival of Pinus taeda in response to surface and subsurface tillage in the southeastern
United States. Forest Ecol. Manag. 234, 209-217.
Corwin, D.L., Lesh, S.M., Shouse, P.J., Soppe, R., Ayars, J.E., 2003. Identifying soil properties
that influence cotton yield using soil sampling directed by apparent soil electrical conductivity.
Agronomy Journal 95, 352-364.
Daniels, R.B., Gamble, E.E.,Nelson, L.A., 1967. Relation between A2 horizon characteristics
and drainage in some fine loamy ultisols. Soil Sci. Soc. Am. J. 104, 364-369.
DeBell, D.S., Harrington, C.A., 1997. Productivity of Populus in monoclonal and polyclonal
blocks at three spacings. Can. J. For. Res. 27, 978-985.
Duffera, M., White, J.G., Weisz, R., 2007. Spatial variability of southeastern U.S. Coastal Plain
soil physical properties: Implications for site-specific management. Geoderma 137, 327-339.
Fox, T.R., E.J. Jokela, Allen, H. L., 2007. The development of pine plantation silviculture in the
southern United States. Journal of Forestry. 105 (5), 337-347.
Fu, Y.-B., Yanchuk, A.D., Namkoong, G., 1999. Spatial patterns of tree height variations in a
series of Douglas-fir progeny trials: Implications for genetic testing. Can. J. For. Res. 29, 714-
723.
Gent, J.A., Morris, L.A., 1986. Soil compaction from harvesting and site preparation in the
upper Gulf Coastal Plain. Soil Sci. Soc. Am. J. 50:443-446.
Hakamada, R.E., 2012. Uso do inventario florestal como ferramenta de monitoramento da
qualidade silvicultural em povoamentos clonais de eucaliptus. Master thesis. Universidade de
Sao Paulo, Piracicaba.

92
Jokela, E.J., Martin, Timothy A., Vogel, Jason G. , 2010. Twenty-five years of intensive forest
management with southern pines: Important lessons learned. Journal of Forestry, 338-347.
Katholnig, L., 2012. Growth dominance and Gini-index in even-aged and in uneven-aged
forests. In, Department of Forest- and Soil Sciences. University of Natural Resources and
Applied Life Sciences, Vienna.
Knox, R.G., Peet, R.K., Christensen, N.L., 1989. Population dynamics in loblolly pine stands:
changes in skewness and size inequality. Ecology 70, 1153-1166.
Kochenderfer, J.N., 1977. Area in skidroads truck roads, and landings in the Central
Appalachians. Journal of Forestry, 507-508.
Kravchenko, A.N., Robertson, G.P., Snap, S.S., Smucker, A.J.M., 2006. Using information about
spatial variability to improve estimates of total soil carbon. Agronomy Journal 98(3), 823-829.
Luu, T.C., Binkley, D., Stape, J.L., 2013. Neighborhood uniformity increases growth of
individual Eucalyptus trees. Forest Ecol. Manag .289, 90-97.
MacKay, J.J., Becwar, M.R., Park, Y.S., Corderro, J.P., Pullman, G.S., 2006. Genetic control of
somatic embryogenesis initiation in loblolly pine and implications for breeding. Tree Genetics &
Genomes 2, 1-9.
Maier, C.A., Johnsen, K.H., Dougherty, P., McInnis, D., Anderson, P., Patterson, S., 2012.
Effect of harvest residue management on tree productivity and carbon pools during early stand
development in a loblolly pine plantation. Forest Science 58, 430-445.
McKeand, S.E., Jokela, E.J., Huber, D.A., Byram, T.D., Allen, H.L., Li, B., Mullin, T.J., 2006.
Performance of improved genotypes of loblolly pine across different soils, climates, and
silvicultural inputs. Forest Ecol. Manag. 227, 178-184.
McKee, W.H., Wilhite, L.P. , 1986. Loblolly pine response to bedding and fertilization varies by
drainage class on lower Atlantic Coastal Plain sites. South. J. Appl. For. 10, 16-21.
Nilsson, U., Albaugh, T.J., Allen, H.L., 2002. Development of size hierarchies prior to the onset
of density-dependent mortality in irrigated and fertilized loblolly pine stands. Can. J. For. Res.
32, 989-996.
Phillips, J.D., Gosweiler, J., Tollinger, M.A., Gordon, R., Mayeux, S., Witmeyer, M., Altieri, T.,
1994. Edge effects and spatial variability in coastal plain ultisols. Southeastern Geographer 34,

93
125-137.
Pritchett, W.L., Gooding, J.W., 1975. Fertilizer recommendations for pines in the Southeastern
Coastal Plain of the United States. Univ. of Florida, Agri. Exp. Sta. Bull. 774.
Purvis, S.J., 2009. Impacts of silvicultural practices on within-stand variability of loblolly pine
(Pinus taeda) plantations. Master thesis, University of GA, Athens, Georgia.
Sabatia, C.O., Burkhart, H.E., 2013. Height and diameter relationships and distributions in
loblolly pine stands of enhanced genetic material. Forest Science 59, 278-289.
Sharma, R.K., Mason, E.G., Sorensson, C.T., 2008. Productivity of radiata pine (Pinus radiata
D. Don.) clones in monoclonal and clonal mixture plots at age 12 years. Forest Ecol. Manag.
255, 140-148.
Sherwood, W.C., Hartshorn, T., and Eaton, L.S., 2010, Soils, geomorphology, landscape
evolution, and land use in the Virginia Piedmont and Blue Ridge, in Fleeger, G.M., and
Whitmeyer, S.J., eds., The Mid-Atlantic Shore to the Appalachian Highlands: Field Trip
Guidebook for the 2010 Joint Meeting of the Northeastern and Southeastern GSA Sections:
Geological Society of America Field Guide 16, p. 31–50, doi: 10.1130/2010.0016(02).
Stape, J.L., Binkley, D., Ryan, M.G., Fonseca, S., Loos, R.A., Takahashi, E.N., Silva, C.R.,
Silva, S.R., Hakamada, R.E., Ferreira, J.M.d.A., Lima, A.M.N., Gava, J.L., Leite, F.P., Andrade,
H.B., Alves, J.M., Silva, G.G.C., Azevedo, M.R., 2010. The Brazil eucalyptus potential
productivity project: Influence of water, nutrients and stand uniformity on wood production.
Forest Ecol. Manag. 259, 1684-1694.
Stape, J.L., Lorenzato, R., Biruel, J., Stahl, J., 2013. Effect of uniformity and fertilization of the
productivity of a loblolly pine variety in Parana state, Brazil. In, 17th Biennial Southern
Silvicultural Research Conference, Shreveport, LA.
Steiger, J.J., 2013. Impacts of different levels of genetic homogeneity on juvenile stem
characteristics and potential stand-level value in loblolly pine (Pinus taeda L.). Master thesis.
North Carolina State University, Raleigh, North Carolina.
Stovall, J.P., Carlson, C.A., Seiler, J.R., Fox, T.R., Yanez, M.A., 2011. Growth and stem quality
responses to fertilizer application by 21 loblolly pine clones in the Virginia Piedmont. Forest
Ecol. Manag. 261, 362-372.
Thomas, P.J., Simpson, T.W., Baker, J.C., 1989. Erosion effects on productivity of Cecil soils in

94
the Virginia Piedmont. Soil Sci. Soc. Am. J. 53, 928-933.
Tuskan, G.A., 1998. Short-rotation woody crop supply systems in the United States: what do we
know and what do we need to know?. Biomass and Bioenergy 14, 307-315.
Tyree, M.C., Seiler, J.R., Maier, C.A., Johnsen, K.H., 2009. Pinus taeda clones and soil nutrient
availability: Effects of soil organic matter incorporation and fertilization on biomass partitioning
and leaf physiology. Tree physiology 29, 1117-1131.
Wheeler, M.J., Will, R.E., Markewitz, D., Jacobson, M.A., Shirley, A.M., 2002. I. Early loblolly
pine stands response to tillage on the Piedmont and Upper Coastal Plain of Georgia: Mortality,
stand Uniformity, and second and third Year Growth. South. J. Appl.For. 26, 181-189.
Weiner, J., Thomas, S.C., 1986. Size variability and competition in plant monocultures. Oikos
47, 211-222.
Whetten, R.W., Kellison, R., 2010. Research gap analysis for application of biotechnology to
sustaining US forests. Journal of Forestry, 193-201.
White, T.L., Adams, W. T., Neale, D.B., 2007. Forest genetics. CABI, Wallingford.
Will, R.E., Wheeler, M.J., Markewitz, D., Jacobson, M.A., Shirley, A.M., 2002. I. Early loblolly
pine stands response to tillage on the Piedmont and Upper Coastal Plain of Georgia: Mortality,
stand uniformity, and second and third year growth. South. J. Appl. For. 26, 181-189.
Xu, Y.-J., Burger, J.A., Aust, W.M., Patterson, S.C., Miwa, M., Preston, D.P., 2002. Changes in
surface water table depth and soil physical properties after harvest and establishment of loblolly
pine (Pinus taeda L.) in Atlantic Coastal Plain wetlands of South Carolina. Soil & Tillage
Research 63, 109-121.
Zhou, J., Dong, B-C., Alpert, P., Li, H-L., Zhang, M-Z., Lei, G-C., Yu, F-H., 2012. Effects of
soil nutrient heterogeneity on intraspecific competition in the invasive, clonal plant Alternanthera
philoxeroides. Annals of botany 109, 813-818.
Zobel B., Talbet J. 1984. Applied tree improvements. John Wiley & Sons, New York.

95
CHAPTER 3. CHANGES IN LOBLOLLY PINE NEEDLE PHYSIOLOGY AND
MORPHOLOGY: RESPONSE OF VARIETIES AND FAMILIES TO SILVICULTURE
AND SITE.
ABSTRACT
Varietal forestry is one approach to increase forest productivity of loblolly pine (Pinus
taeda L.) in the southern United States. However, to achieve this potential productivity, the use
of elite genotypes must be linked with intensive silvicultural practices. Although the positive
growth responses due to intensive silviculture have been reported extensively, much less is
known about the physiological processes that drive these responses. This study assessed the
responses of leaf-level gas exchange and foliage morphology of 4 year-old loblolly pine clonal
varieties and families to changes in silvicultural intensity on the Virginia Piedmont (VA) and
North Carolina Coastal Plain (NC). Six genotyes were evaluated, four varieties and one control-
mass-pollinated (CMP) and one open-pollinated (OP) family. Within the varieties two
represented a broad crown ideotype and two a narrow crown ideotype. Two levels of
management intensity were imposed. An operational treatment designed to match current
operational practice and a more intensive treatment that include fertilization, tip moth control and
additional weed control. At the end of the study period, the intensive silvicultural treatment
increased stem volume by 71% and 36 % relative to the operational silvicultural treatment at VA
and NC, respectively. Overall, intensive silviculture had no effect on the gas exchange
parameters during the study period, but it significantly increased fascicle size in all the
genotypes. The broadest crown variety (C4) had a significantly higher photosynthetic rate (Asat)
(4.9 versus 4.6 µmol/m2/s), carbon isotope discrimination (∆
13) (22.5 versus 21.7 ‰, i.e. lower
96
water use efficiency) lower fascicle diameter and number of needles per fascicle than the OP
family. Variety C2 (second broadest crown variety) behaved similarly to the narrowest crown
variety C1. Therefore, leaf level physiology was not consistent within ideotypes. Asat had a
moderately negative correlation with diameter at the root collar (D) (r=-0.37), tree height (r=-
0.24) and tree volume (r=-0.36) at the NC site. Stem dimensions were not correlated with ∆13
.
Mean fascicle diameter and ∆13
were negatively correlated (r=-0.79) only at the VA site. The
relationship between ∆13
and intrinsic water use efficiency (iWUE) differed by site, silvicultural
intensity, and genotype (r= 0 to -0.63). Overall leaf-gas exchange did not explain the differences
in productivity among loblolly pine genotypes in a broad range of environmental conditions (site
and silvicultural treatments).
INTRODUCTION
Tree improvement and silvicultural management have increased the productivity of
loblolly pine in the South almost 3-fold relative to natural stands (Fox et al., 2007). Currently
the majority of loblolly pine is planted as open-pollinated and control-mass-pollinated families
(McKeand et al., 2008). Typical management practices include site preparation, weed control
and fertilization (Fox et al., 2007). Varietal forestry that includes more intensive silvicultural
practices can further increase productivity (Fox et al., 2007; Wright and Dougherty, 2006). The
potential gains of using varieties are estimated to be between 27-70% (Bettinger et al., 2009; Isik
et al., 2005; Whetten and Kellison, 2010).
Genotypes by environment interactions have generally not been observed for OP and
CMP families (McKeand et al., 2006). However, genotype by silvicultural treatment interactions

97
has been reported more often for clonal varieties. For example, King et al. (2008), Stovall et al.,
(2011), Tyree et al. (2009) reported different growth responses of loblolly pine clones to
fertilization. According to these studies some genotypes are more sensitive to nutrient
limitations, so they may have greater responses to fertilization. These studies were made in
young stands, but there is a likelihood that the genotype by silvicultural treatment may be even
greater once the intraspecific competition for resources become more intense (Adams and
Roberts, 2013). Hence, matching specific genotypes to specific sites and silvicultural regimes
may be required to optimize the gains from varietal forestry (Wright and Dougherty, 2007).
Although the positive growth responses due to intensive silviculture have been widely
reported (Albaugh et al., 1998; Jones et al., 2010; Liechty and Fristoe, 2013; Roth et al., 2007;
Samuelson, 1998; Vance and Sanchez, 2006; Zhao et al., 2009; Zhao et al., 2012), much less is
known about the effect of intensive silviculture on the physiological processes that drive these
responses. Both the management of soil resources and genetics may affect, leaf area
development and phenology, photosynthesis, respiration, allocation patterns and growth
efficiency (Kleb’s concept) (as referenced by Pallardy, 2008). In a tree, net carbon gain may be
expressed as a function of the photosynthetic and respiration rates of the photosynthetic tissue
(i.e. leaf area), and of the respiration rate of the non-photosynthetic tissue (Teskey et al., 1987).
Leaf area and light interception is well related to variations in productivity (Cannell, 1989). Leaf
area increases in response to silvicultural treatments leads to greater carbon assimilation and tree
growth (Albaugh et al., 1998; Jokela and Martin, 2000; McGarvey et al., 2004; Vose and Allen,
1988; Will, 2005). It is estimated that an increase in leaf area index (LAI) of 1 unit can increase
volume growth by 7 m3/ha/year (Fox et al., 2007).

98
The relationship between leaf-gas exchange measurements and growth has been generally
poor (Chmura and Tjoelker, 2008; McGarvey et al., 2004). This may be due to a scaling
problem (Martin et al., 2001). The response of photosynthesis to light intensity is non-linear
(Medlyn et al., 2003), and most of the studies are based on instantaneous measurements in
specific positions of the crown. Moreover, the photosynthetic capacity also varies diurnally
(Taylor et al., 2013), within the canopy (Chmura and Tjoelker, 2008), and it may even vary
within a leaf (Chen et al., 2008). Then, differences in when and where photosynthesis is
measured may lead to different values for a given tree. Some studies have shown a significant
effect of management treatments on instantaneous photosynthetic rates (Green and Mitchell,
1992; King et al., 2008; Maier et al., 2008; Samuelson, 2000; Teskey et al., 1994), while others
have not (Gough et al., 1994a; Maier et al., 2002; Munger et al. 2003; Samuelson 1998).
The ratio of leaf intercellular CO2 concentration to atmospheric CO2 concentration
(Ci/Ca) measured through carbon isotope discrimination better integrates the temporal variation
in leaf physiological processes (Farquhar et al., 1989; Johnsen et al., 1999). Carbon isotope
discrimination has been used as a surrogate of water use efficiency (WUE), which has been
shown to be highly correlated with growth (Cregg et al., 2000; Gebremedhin, 2003; Turner et al.,
2010; Xu et al., 2000). Furthermore, there may be potential genetic variability in this trait that
might be coupled with growth traits (Baltunis et al, 2008).
Seasonal patterns of gas exchange in loblolly pine have been studied in stands with
unknown genetic pedigree (Ellsworth, 2000; Munger et al., 2003; Tang et al., 2003),
provenances (Boltz et al., 1986), and half- and full-sib families (Seiler and Johnson, 1988; Yang
et al., 2002; McGarvey et al., 2004; Samuelson, 2000). The few exiting studies on gas exchange
on loblolly pine varieties suggest some degree of variation among varieties that may confer some

99
advantage to those genotypes (Gebremedhin 2003; King et al. 2008; Tyree et al., 2009). Others
studies indicate that the variability in gas exchange may be as high within a variety as between
varieties or even OP and CMP families (Aspinwall et al., 2011). However, there is still a poor
understanding whether gas exchange could explain the differences in productivity among
genotypes in a broad range of environmental conditions and silvicultural treatments.
The present study investigated the responses of loblolly pine leaf-level gas exchange
and leaf morphological traits to changes in site, silvicultural intensity and genotypes. Four
varieties with different crown dimension, broad crown (competition ideotype) and narrow crown
(crop ideotypes) and one control mass pollinated (CMP) and one open pollinated (OP) family
were examined. The experiments were located in two contrasting geographical regions, one on
the Virginia Piedmont and one on the North Carolina Coastal Plain. The objectives were 1) to
assess the effect of intensive silviculture on the seasonal variation of leaf-gas exchange, intrinsic
water use efficiency (iWUE), carbon isotope discrimination (∆13
), and leaf morphological traits
of loblolly pine varieties and families, 2) to assess the stability of those responses between sites
and ideotype level, 3) to assess the relation between iWUE and ∆13
among the different
silvicultural treatments and genotypes and 4) to assess the relationship between gas exchange
and growth parameters. We tested the following specific hypotheses: 1) improving soil resources
by intensive silviculture will enhance leaf-gas exchange and fascicle size of loblolly pine
varieties and families, but the magnitude of the responses will be site-specific, 2) the sensitivity
of gas exchange to environmental effects will be greater in varieties having broad crowns
(competition ideotype) than narrow crown (crop ideotype) and 3) water use efficiency measured
by ∆13
correlates with leaf intrinsic water use efficiency (iWUE) and stem growth in loblolly
pine varieties and families.

100
METHODS
Study sites
This study was established at two sites in 2009 to assess the interactions among
genotypes (varieties and families), silvicultural intensity, planting density and site. Trials were
located in the North Carolina Coastal Plain (NC), at the Bladen Lakes State Forest (34º 49’
49.63’’N, 78º 35’ 18.52’’W), and at the Virginia Piedmont (VA) at the Reynolds Homestead
Forest Resources Research Center (36º 38’ 35.32’’N, 80º 09’ 18.84’’W).
The soil at the VA site was a well-drained Fairview Series (fine, kaolinitic, mesic Typic
Kanhapludults). Previously, the site supported a mixture of loblolly pine, pitch pine (Pinus
rigida L.) x loblolly pine hybrids and eastern white pine (Pinus strobus L.) stands that were
harvested in 2007 and 2008. The soil at the NC site was a poorly drained Rains series (fine-
loamy, siliceous, semiactive, thermic Typic Paleaquults). Previously, the site supported a
loblolly pine stand that was harvested in 2007. The annual average temperature and precipitation
at VA is 13 ºC and 1159.3 mm, respectively. The annual average temperature and precipitation at
NC are 16.9 ºC and 1170.7 mm, respectively (from NOAA online weather data
http://sercc.com/nowdata.html).
Experimental design
The study design is a split split-plot with 4 replications at VA and 3 replications at NC.
Two levels of silviculture (operational and intensive) were the whole plot treatments, six
genotypes (4 clonal varieties, 1 OP family and 1 CMP family) were the split-plot treatments, and
three initial planting densities (617, 1235 and 1852 trees/ha) were the split split-plot treatments
(Figure 1). The total number of plots was 144 at VA (2 silviculture treatments x 6 genotypes x 3
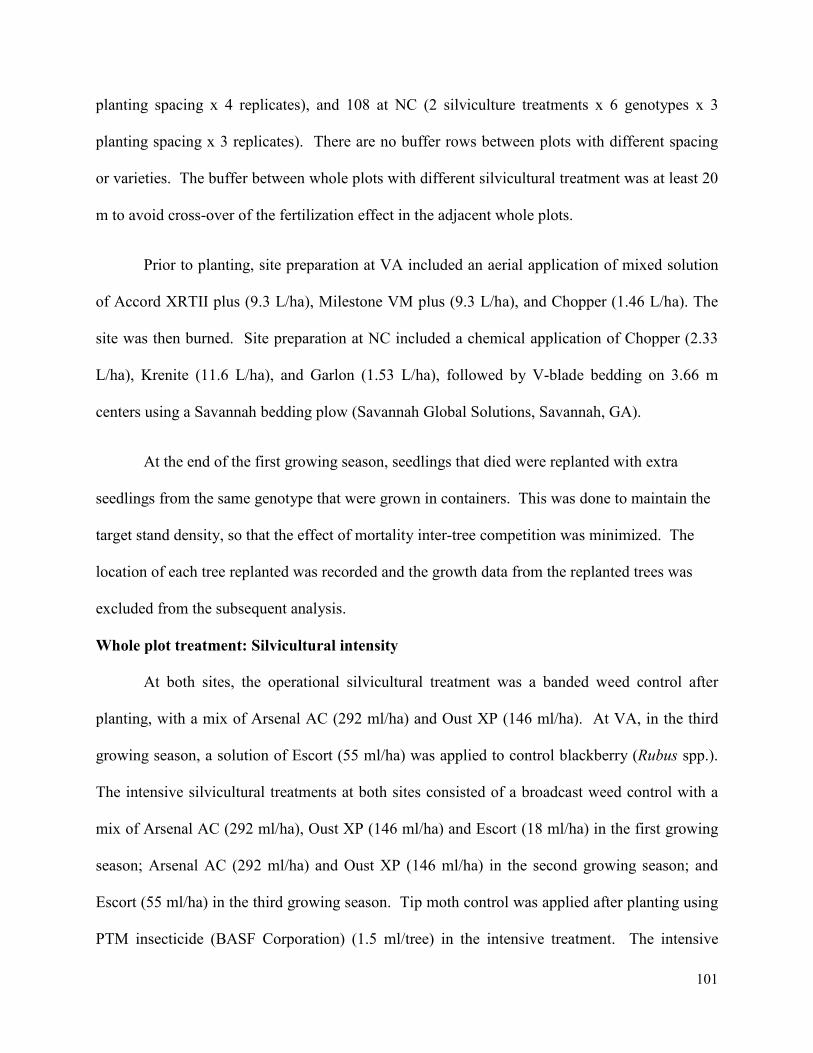
101
planting spacing x 4 replicates), and 108 at NC (2 silviculture treatments x 6 genotypes x 3
planting spacing x 3 replicates). There are no buffer rows between plots with different spacing
or varieties. The buffer between whole plots with different silvicultural treatment was at least 20
m to avoid cross-over of the fertilization effect in the adjacent whole plots.
Prior to planting, site preparation at VA included an aerial application of mixed solution
of Accord XRTII plus (9.3 L/ha), Milestone VM plus (9.3 L/ha), and Chopper (1.46 L/ha). The
site was then burned. Site preparation at NC included a chemical application of Chopper (2.33
L/ha), Krenite (11.6 L/ha), and Garlon (1.53 L/ha), followed by V-blade bedding on 3.66 m
centers using a Savannah bedding plow (Savannah Global Solutions, Savannah, GA).
At the end of the first growing season, seedlings that died were replanted with extra
seedlings from the same genotype that were grown in containers. This was done to maintain the
target stand density, so that the effect of mortality inter-tree competition was minimized. The
location of each tree replanted was recorded and the growth data from the replanted trees was
excluded from the subsequent analysis.
Whole plot treatment: Silvicultural intensity
At both sites, the operational silvicultural treatment was a banded weed control after
planting, with a mix of Arsenal AC (292 ml/ha) and Oust XP (146 ml/ha). At VA, in the third
growing season, a solution of Escort (55 ml/ha) was applied to control blackberry (Rubus spp.).
The intensive silvicultural treatments at both sites consisted of a broadcast weed control with a
mix of Arsenal AC (292 ml/ha), Oust XP (146 ml/ha) and Escort (18 ml/ha) in the first growing
season; Arsenal AC (292 ml/ha) and Oust XP (146 ml/ha) in the second growing season; and
Escort (55 ml/ha) in the third growing season. Tip moth control was applied after planting using
PTM insecticide (BASF Corporation) (1.5 ml/tree) in the intensive treatment. The intensive
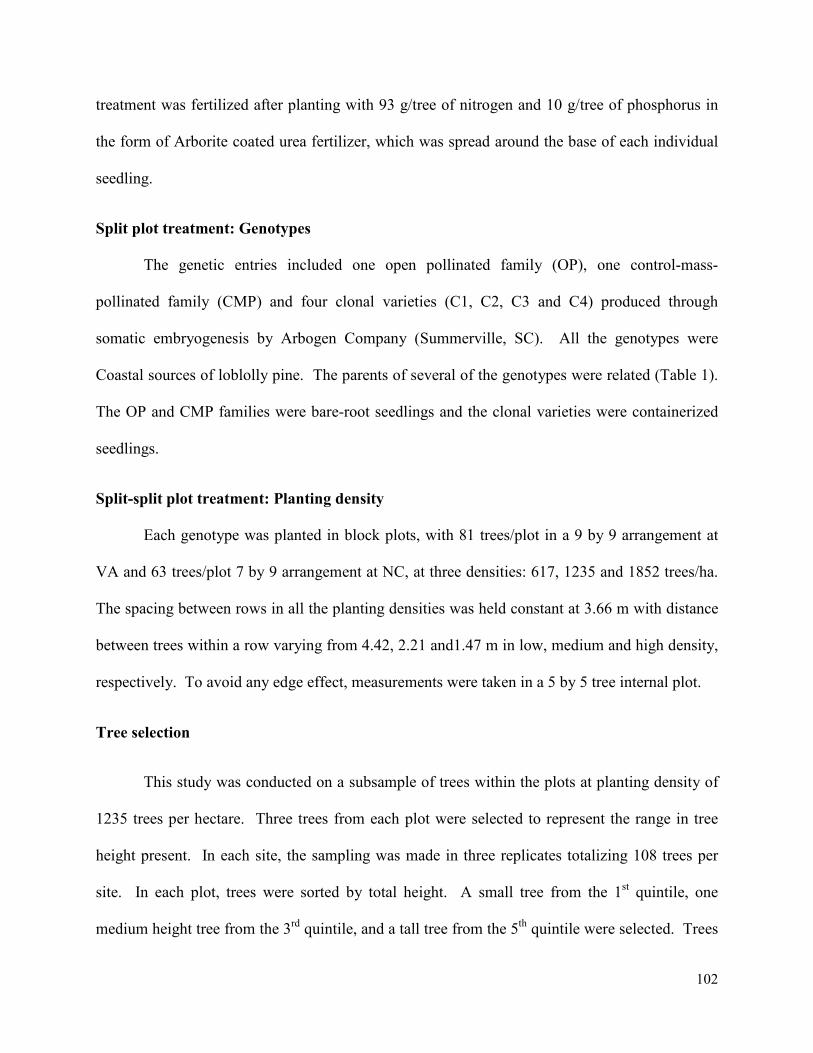
102
treatment was fertilized after planting with 93 g/tree of nitrogen and 10 g/tree of phosphorus in
the form of Arborite coated urea fertilizer, which was spread around the base of each individual
seedling.
Split plot treatment: Genotypes
The genetic entries included one open pollinated family (OP), one control-mass-
pollinated family (CMP) and four clonal varieties (C1, C2, C3 and C4) produced through
somatic embryogenesis by Arbogen Company (Summerville, SC). All the genotypes were
Coastal sources of loblolly pine. The parents of several of the genotypes were related (Table 1).
The OP and CMP families were bare-root seedlings and the clonal varieties were containerized
seedlings.
Split-split plot treatment: Planting density
Each genotype was planted in block plots, with 81 trees/plot in a 9 by 9 arrangement at
VA and 63 trees/plot 7 by 9 arrangement at NC, at three densities: 617, 1235 and 1852 trees/ha.
The spacing between rows in all the planting densities was held constant at 3.66 m with distance
between trees within a row varying from 4.42, 2.21 and1.47 m in low, medium and high density,
respectively. To avoid any edge effect, measurements were taken in a 5 by 5 tree internal plot.
Tree selection
This study was conducted on a subsample of trees within the plots at planting density of
1235 trees per hectare. Three trees from each plot were selected to represent the range in tree
height present. In each site, the sampling was made in three replicates totalizing 108 trees per
site. In each plot, trees were sorted by total height. A small tree from the 1st quintile, one
medium height tree from the 3rd
quintile, and a tall tree from the 5th
quintile were selected. Trees

103
with obvious problems such disease symptoms, mechanical damage, forking, and dieback were
avoided.
Growth measurements, leaf-level gas exchange, leaf morphology
From July 2011 to November 2012, measurements of growth and leaf-level gas exchange
were made every 6 to 8 weeks (a total of 9 dates at each site). Both sites were measured with a
difference of 1 to 2 weeks between them. Diameter at the root collar (D) (using a digital caliper)
and total height (HT) (using a Philadelphia rod) were measured. Volume index (VOL) was
calculated by multiplying HT by D squared and expressed in cubic centimeters (cm3).
Additionally, we measured light-saturated photosynthetic rate (Asat at 1600 µmolm-2
s-1
), and
intrinsic water use efficiency (iWUE=Asat/gs, where gs corresponds to the stomatal
conductance) between 9 am and 4 pm one block at a time with a portable photosynthesis system
(LI-6400, LiCor Inc., Lincoln, NE, USA). Fully sun-exposed fascicles collected from the upper,
medium and lower third of the crown were combined and placed in the chamber immediately
after detachment (< 30 seconds). The chamber air temperature and relative humidity was held
near to ambient conditions. During the study period, we varied the block temperature in the
chamber from 5 to 32ºC at VA and from 9 to 34ºC at NC. Carbon dioxide concentration was set
to 385 µmol mol-1
. Additional measurement of leaf morphology (fascicle diameter and number
of needles per fascicle) were used to calculate leaf area according to the formula used by Ginn et
al., (1991): Leaf area per fascicle = 3.14159(d)(l) + (n)(d)(l), where d = fascicle diameter, l =
needle length, and n = number of needles in the fascicle. The fascicle metrics of all the foliage
collected per each tree during the entire measurement period were treated as a sample for further
analyses in foliage morphology.

104
Carbon isotope discrimination
During the last measurement date (November 2012), the same fascicles used for needle
physiology were used for further determination of carbon isotope discrimination at NC and VA.
The foliage was dried at 65ºC, and finely ground in a ball mill. The ratio of 13
C and 12
C was
determined in 1.8 mg foliage subsample through a stable isotope ratio mass spectrometer
(IsoPrime100, Isoprime Ltd., UK). The ∆13
values were expressed relative to the Pee Dee
Belemnite international standards (Craig, 1957; Farquhar et al., 1989) as:
∆��= �����
����
Where ∆13
is the carbon isotope discrimination(‰), and ��and �� are the stable carbon isotope
ratio for the plant material and air (-8‰), respectively.
Statistical analysis
The split-plot design described above for each site was expanded to a multi-location
repeated measures analysis. All the explanatory variables (site, silvicultural intensity, and
genotype and the interactions among these factors) were considered fixed effects, except the
effects of the replication and its interaction with other factors that were considered random. This
model was applied directly on carbon isotope discrimination. For analysis of Asat and iWUE, a
second-order polynomial containing the variables temperature (T), T2, vapor pressure deficit
(VPD) and VPD2 was used as covariates in the analysis of variance (ANOVA). To account for
some possible temporal correlation among different measurement dates, we contrasted the AR(1)
variance-covariance structures against the independent and identical distributed error structure
(IDD). For the analysis of variance under the AR(1) structure, we assumed that the gap between

105
measurements dates was constant, and that small variation among measurement dates did not
affect the biological interpretation of the data. The model selection was based in the Akaike
(AIC) and Bayesian (BIC) information criteria. The analyses of variances and regressions were
performed using PROC MIXED and PROC REG of SAS version 9.3 (SAS Institute, Cary, North
Carolina, USA), respectively. Post-hoc comparison was based in the Tukey’s means
comparisons method. The relationship between iWUE and ∆13
and between the gas exchange
parameters and growth traits was explored by the Pearson-coefficient of correlation (PROC
CORR of SAS 9.2). The relationship between iWUE and ∆13
was based only in current fully
expanded foliage (cohort 2012), while the other relationships were made with the data collected
during the whole study period.
RESULTS
Descriptive seasonal patterns of stem volume
During the study period, the trees in the intensive silviculture treatment were larger than
in the operational treatment (p<0.05) (Figure 2A and 2B). The effect of the intensive treatment
increased over time, and was greater at VA than NC. At the end of the study period the intensive
treatment was 71% and 36 % higher in VA and NC, respectively. At NC, average tree volume
did not differ among the genotypes over the study period (p>0.05) (Figure 2C). However, at VA,
there were significant (p=0.03) differences among the genotypes at the end of the study (Figure
2D), with the largest mean tree volume (C4) being 40% higher than the lowest one (OP).
Overall, the varieties had higher stem volume than the CMP and OP families.
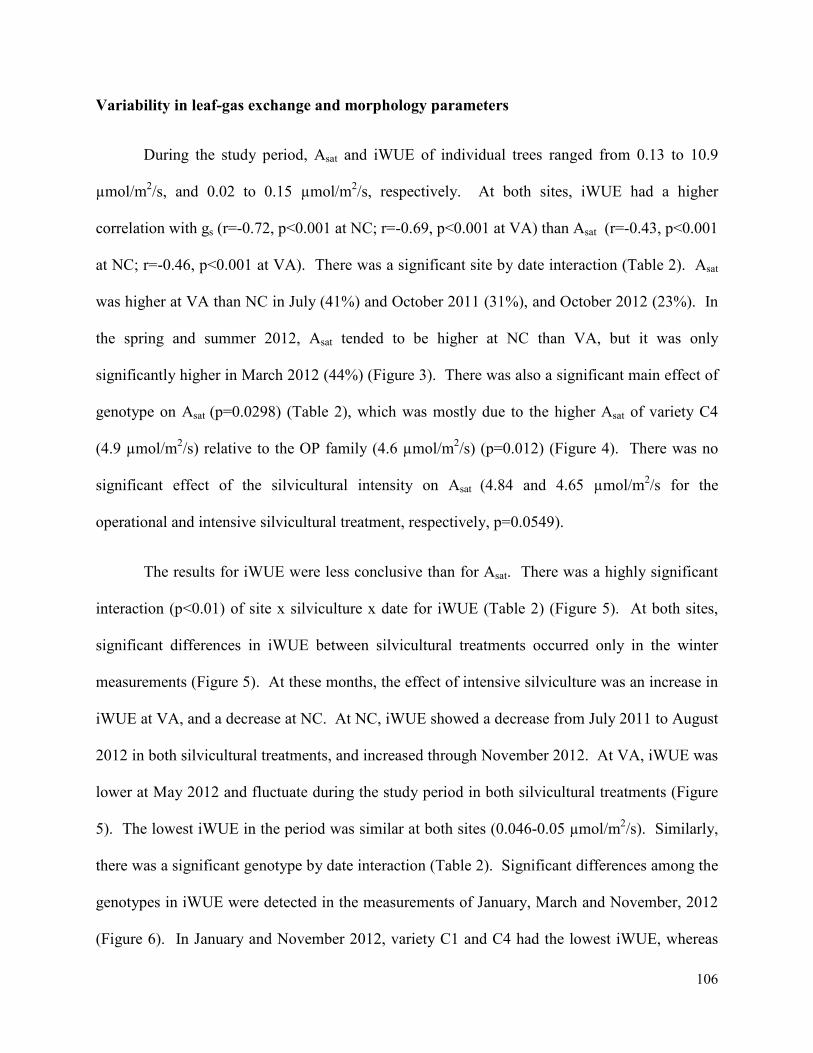
106
Variability in leaf-gas exchange and morphology parameters
During the study period, Asat and iWUE of individual trees ranged from 0.13 to 10.9
µmol/m2/s, and 0.02 to 0.15 µmol/m
2/s, respectively. At both sites, iWUE had a higher
correlation with gs (r=-0.72, p<0.001 at NC; r=-0.69, p<0.001 at VA) than Asat (r=-0.43, p<0.001
at NC; r=-0.46, p<0.001 at VA). There was a significant site by date interaction (Table 2). Asat
was higher at VA than NC in July (41%) and October 2011 (31%), and October 2012 (23%). In
the spring and summer 2012, Asat tended to be higher at NC than VA, but it was only
significantly higher in March 2012 (44%) (Figure 3). There was also a significant main effect of
genotype on Asat (p=0.0298) (Table 2), which was mostly due to the higher Asat of variety C4
(4.9 µmol/m2/s) relative to the OP family (4.6 µmol/m
2/s) (p=0.012) (Figure 4). There was no
significant effect of the silvicultural intensity on Asat (4.84 and 4.65 µmol/m2/s for the
operational and intensive silvicultural treatment, respectively, p=0.0549).
The results for iWUE were less conclusive than for Asat. There was a highly significant
interaction (p<0.01) of site x silviculture x date for iWUE (Table 2) (Figure 5). At both sites,
significant differences in iWUE between silvicultural treatments occurred only in the winter
measurements (Figure 5). At these months, the effect of intensive silviculture was an increase in
iWUE at VA, and a decrease at NC. At NC, iWUE showed a decrease from July 2011 to August
2012 in both silvicultural treatments, and increased through November 2012. At VA, iWUE was
lower at May 2012 and fluctuate during the study period in both silvicultural treatments (Figure
5). The lowest iWUE in the period was similar at both sites (0.046-0.05 µmol/m2/s). Similarly,
there was a significant genotype by date interaction (Table 2). Significant differences among the
genotypes in iWUE were detected in the measurements of January, March and November, 2012
(Figure 6). In January and November 2012, variety C1 and C4 had the lowest iWUE, whereas
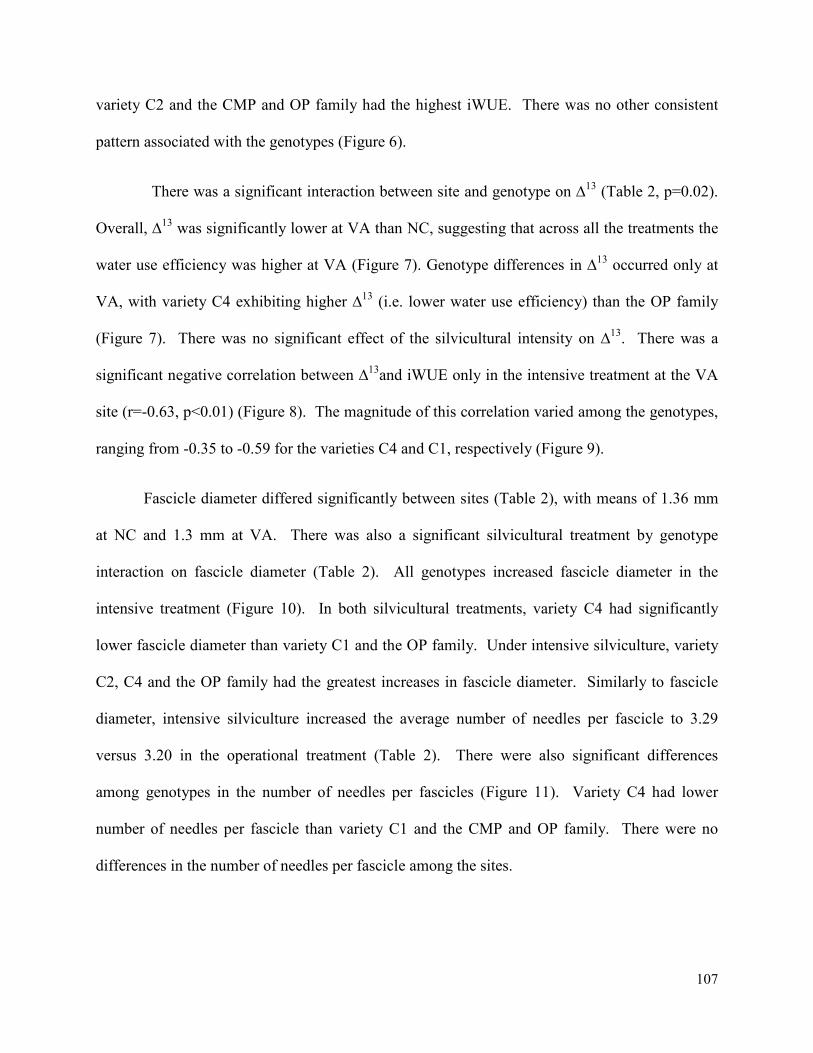
107
variety C2 and the CMP and OP family had the highest iWUE. There was no other consistent
pattern associated with the genotypes (Figure 6).
There was a significant interaction between site and genotype on ∆13
(Table 2, p=0.02).
Overall, ∆13
was significantly lower at VA than NC, suggesting that across all the treatments the
water use efficiency was higher at VA (Figure 7). Genotype differences in ∆13
occurred only at
VA, with variety C4 exhibiting higher ∆13
(i.e. lower water use efficiency) than the OP family
(Figure 7). There was no significant effect of the silvicultural intensity on ∆13
. There was a
significant negative correlation between ∆13
and iWUE only in the intensive treatment at the VA
site (r=-0.63, p<0.01) (Figure 8). The magnitude of this correlation varied among the genotypes,
ranging from -0.35 to -0.59 for the varieties C4 and C1, respectively (Figure 9).
Fascicle diameter differed significantly between sites (Table 2), with means of 1.36 mm
at NC and 1.3 mm at VA. There was also a significant silvicultural treatment by genotype
interaction on fascicle diameter (Table 2). All genotypes increased fascicle diameter in the
intensive treatment (Figure 10). In both silvicultural treatments, variety C4 had significantly
lower fascicle diameter than variety C1 and the OP family. Under intensive silviculture, variety
C2, C4 and the OP family had the greatest increases in fascicle diameter. Similarly to fascicle
diameter, intensive silviculture increased the average number of needles per fascicle to 3.29
versus 3.20 in the operational treatment (Table 2). There were also significant differences
among genotypes in the number of needles per fascicles (Figure 11). Variety C4 had lower
number of needles per fascicle than variety C1 and the CMP and OP family. There were no
differences in the number of needles per fascicle among the sites.
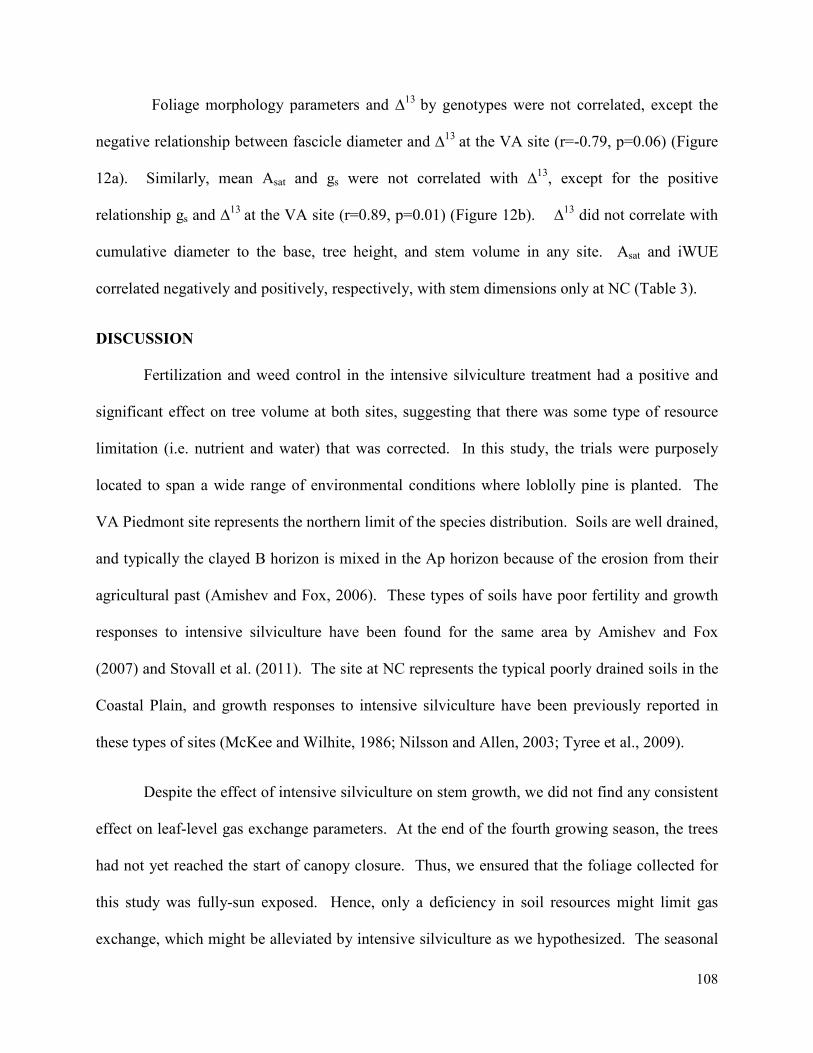
108
Foliage morphology parameters and ∆13
by genotypes were not correlated, except the
negative relationship between fascicle diameter and ∆13
at the VA site (r=-0.79, p=0.06) (Figure
12a). Similarly, mean Asat and gs were not correlated with ∆13
, except for the positive
relationship gs and ∆13
at the VA site (r=0.89, p=0.01) (Figure 12b). ∆13
did not correlate with
cumulative diameter to the base, tree height, and stem volume in any site. Asat and iWUE
correlated negatively and positively, respectively, with stem dimensions only at NC (Table 3).
DISCUSSION
Fertilization and weed control in the intensive silviculture treatment had a positive and
significant effect on tree volume at both sites, suggesting that there was some type of resource
limitation (i.e. nutrient and water) that was corrected. In this study, the trials were purposely
located to span a wide range of environmental conditions where loblolly pine is planted. The
VA Piedmont site represents the northern limit of the species distribution. Soils are well drained,
and typically the clayed B horizon is mixed in the Ap horizon because of the erosion from their
agricultural past (Amishev and Fox, 2006). These types of soils have poor fertility and growth
responses to intensive silviculture have been found for the same area by Amishev and Fox
(2007) and Stovall et al. (2011). The site at NC represents the typical poorly drained soils in the
Coastal Plain, and growth responses to intensive silviculture have been previously reported in
these types of sites (McKee and Wilhite, 1986; Nilsson and Allen, 2003; Tyree et al., 2009).
Despite the effect of intensive silviculture on stem growth, we did not find any consistent
effect on leaf-level gas exchange parameters. At the end of the fourth growing season, the trees
had not yet reached the start of canopy closure. Thus, we ensured that the foliage collected for
this study was fully-sun exposed. Hence, only a deficiency in soil resources might limit gas
exchange, which might be alleviated by intensive silviculture as we hypothesized. The seasonal

109
variation of gas exchange parameters found in this study was in the range previously reported
for loblolly pine; for Asat (2.6-6.7 µmol/m2/s) ( Ellsworth, 2000; Gough et al., 2004a; Munger et
al., 2003; Tang et al., 2003), iWUE (0.045-0.097 µmol/m2/s)(Aspinwall et al., 2011), and ∆
13
(20-24 ‰ ) (Gebremedhin, 2003). Intensive silviculture had no effect on Asat, and affected
iWUE only in the winter months, but the response was not consistent at the two sites. There was
no effect of silviculture on water use efficiency as measured by ∆13
. At this point the soil
resources in both silvicultural treatments were sufficient to keep the levels of gas exchange, but
this may change with stand development as long as those resource become limiting.
Others studies in loblolly pine corroborate the lack of effect of management intensity on
gas exchange, even when growth and foliar nitrogen (N) was affected (Gough et al., 1994a;
Munger et al., 2003; Samuelson et al., 1998; Will et al., 2001). Other studies have found a short
term response in Asat to fertilization. One of the mechanisms suggested by Gough et al. (2004b)
is that the increase in Asat after fertilization is only ephemeral, afterwards Asat is down-regulated
and the extra carbon gained is used to enlarge the canopy and consequently tree growth.
Similarly, studying two contrasting crown-ideotype varieties of loblolly pine, Tyree et al., (2009)
found some evidence of an increase in Asat within the first six month after fertilization,
accompanied with an increase of the foliar mass. The results found by King et al. (2008) showed
that some loblolly pine varieties followed this pattern after fertilization, while others did not.
Two varieties had increases in Asat, volume growth, and crown efficiency; and these varieties
maintained their superiority in Asat during the growing season. Other varieties exhibited higher
response in volume growth to N fertilization; whereas the Asat increased only moderately and the
crown efficiency was low. The results reported by King et al. (2008) highlight that others
110
mechanisms may be present (e.g. changes in carbon allocation), and how the different
physiological processes are coordinated may differ among genotypes.
Fertilization in the south is mainly addressed to correct N and Phosphorous (P) deficiency
(Fox et al., 2007), and both elements were present in the fertilization in the intensive silvicultural
treatment. Proteins in the Calvin cycle and on the thylakoids account for most of the foliar
nitrogen (Evans, 1989), and is the reason why sometimes a higher foliar concentration of
nitrogen is associated with increases in photosynthesis (Manter et al., 2005). However, a poor
relation among those variables had been previously reported for pines (King et al. 2008, Teskey
et al., 1994), and this relationship is more likely in seedlings than trees, in soils with very poor
fertility, and when the evaluation is made close to the fertilization date (Munger et al., 2003).
These factors may explain the results in our study, where physiological measurements were
made in field trials between the 3rd
and 4th
growing season, and started 1.5 year after the
fertilization. We also did measure nitrogen concentration in the same foliage collected for Asat
determination on August 2012 (end of summer), at the peak in leaf area (Albaugh et al., 1998).
At NC, the N concentration ranged from 1-1.9%; whereas at VA it ranged from 1.1-1.7%, with
no significant differences among the silvicultural treatments within the sites. Almost all the trees
(98 and 100% NC and VA, respectively) had N concentration above the critical level of 1.1%
(Allen, 1987); therefore, foliar N deficiency was not likely a limiting factor in our study. We
speculate that the assart effect from the previous harvested stands at the sites was still providing
a sufficient level of N.
It may also be that the excess N coming from fertilization may not be invested in the
photosynthetic apparatus, and the increase of N in the form of rubisco may be a form of storage
N as luxury consumption (Bauer et al., 2004; Warren et al., 2003). The critical level of foliar

111
nitrogen 1.1% reported for loblolly pine is associated with the growth responses to fertilization,
but we have not found a critical level of N in loblolly pine in which the physiological processes
are down-regulated as an effect of N limitations. For instance, Yang et al. (2002) found little
effect of fertilization on gas exchange, even when the control plots had lower foliar N (0.84%)
relative to the fertilized plots (1.26%). Manter et al. (2005) found some cumulative effects of N
fertilization on the photosynthetic capacity of Douglas-fir when N concentration is over 1.3% or
less than 1.1%. When N is in excess, it may be imbalances with other micronutrients such as
Mn, which may inactivate rubisco (Manter et al., 2005). These facts may also explain the poor
and low correlation found between Asat and foliar nitrogen in other studies in loblolly pine
(Gough et al., 2004a, King et al., 2008, Munger et al., 2003, and McGarvey et al., 2004). Hence,
the higher growth responses in the intensive silvicultural treatment are not explained through an
increase in the gas exchange or foliar N status. Similarly, despite the effect of site on stem
growth, we did not find any consistent effect on Asat. Therefore, the effects of site and intensive
silviculture on growth suggests that other mechanisms other than gas exchange could be affected
such as the changes in the above- and below-grown carbon partitioning (Albaugh et al., 1998;
King et al., 1999; Litton et al., 2007), light use efficiency (LUE) (Campoe et al., 2013), or carbon
use efficiency (Ryan et al., 1996).
Both iWUE and ∆13
indicated that the water use efficiency (WUE) was higher at VA than
NC and may be related to the overall greater growth in VA. This may be attributed to the lower
soil moisture at VA relative to the poorly drained soil at NC. Lower soil moisture and higher
VPD may lead to an induced stomatal closure, and consequently a decrease in the stomatal
conductance (gs was 21% lower at VA than NC) and an increase in WUE (Franks et al., 1997;

112
Ocheltree et al., 2013). Similar results have been previously reported for loblolly pine (Choi et
al., 2005; Gebremedhin, 2003), and other conifers (Taylor et al., 2013; Zhang et al., 1997).
At the end of the fourth growing season, and based on the same trees selected for this
study, the intensive silvicultural treatment increased the average leaf area of individual trees by
58% at NC and 120% at VA (M.Yanez, unpublished data). This greater impact of silvicultural
intensity on leaf area has been reported in numerous studies (Albaugh et al., 1998; Jokela and
Martin, 2000; McGarvey et al., 2004; Vose and Allen, 1988). Regarding our data, the intensive
silvicultural treatment altered foliage morphology increasing fascicle diameter and the number of
needles per fascicle. This result is consistent with the findings by Will (2005). He found that
loblolly pine foliage morphology is responsive to fertilization (increasing the fascicle size), but
this accounts for a small change (<10%) in the increase in total leaf biomass, which doubled in
some stands. Similarly, in our study the small but significant increase in fascicle size due to the
intensive silvicultural treatment would not explain the increase in the total leaf area. Moreover,
although it was not assessed in this study, fertilization may also have increased the number of
flushes, size of the fascicles, and number of fascicles per flush (Maier et al., 2002). Nonetheless,
the increased in leaf area (58% at NC and 120% at VA) due to intensive silviculture did not
result in a similar increase in stem volume (36% and 71% higher in NC and VA, respectively).
This disproportionate increase of stem volume versus leaf area may suggest a decrease in the
growth efficiency (understood as the stem growth to leaf area ratio) in the intensive silvicultural
treatment.
Based on process-based-models, McMurtrie et al. (1990) found that the annual canopy
net photosynthesis in radiata pine was 111% higher in the fertilized/irrigated stands than control
stands, and that the increased photosynthetic rate due to N nutrition explained only 10% of the
113
total carbon gain. Although leaf-level physiology had little variation within the species, small
differences may confer some advantage for some genotypes. We hypothesized that the
genotypes having different crown ideotypes were going to respond differently in gas exchange
and leaf morphology to the silvicultural treatments. For example, broad-crown ideotypes might
demand more nutrients and water than the narrow ones. This implies that narrow crown varieties
might tolerate nutrient limitation better than a broad type (Tyree et al., 2009). At the end of the
four growing season, there were no differences on stem growth among the genotypes at NC. At
VA, varieties did not differ significantly in stem volume, but they were significantly different
from the OP family. At this site, variety C4 and the OP family had the highest and lowest tree
volume through the study period. Our results also showed significant differences in the gas
exchange parameters among the genotypes, mainly because of the differences between variety
C4 and the OP family. Variety C4 had a slightly, but significantly higher Asat than the OP
family, but also a lower WUE as measured by both iWUE and ∆13
. Additionally, variety C4
differed significantly in foliage morphology (i.e. lower fascicle diameter and number of needles
per fascicle) than the OP family and variety C1. Variety C2 was also classified as a broad crown
ideotype, but it behaved very similar to the narrowest variety (C1). Hence, although we found
differences among the genotypes in foliage physiology and morphology, these were not
consistent within ideotypes as we hypothesized. Studying one broad and one narrow crown
variety per ideotype, Tyree et al. (2009) found that a broad crown variety consistently had the
same or higher Asat than the narrow crown. Moreover, the broad crown variety was also less
responsive to the management treatments than the narrow crown. Our study indicates little
similarity in physiological processes among varieties classified in the same ideotype.
114
In general, there are few studies showing differences in instantaneous gas exchange in
pines. As growth depends of many physiological processes over time, instantaneous
measurements of photosynthesis does not seem to be a good predictor (Martin et al., 2005), as
was also found in this study. Furthermore, the diurnal and seasonal variations of gas exchange
rates make this type of measurements difficult to implement and interpret (Taylor et al., 2013).
Asat and iWUE did not correlate with stem dimensions at the VA site. At NC, Asat correlated
negatively with the stem dimensions, which might indicate that the bigger trees are starting to
experience some stomatal limitation. This is supported by the moderately higher correlation
between gs and D (r=-0.52 p<0.01) and HT (r=-0.46 p<0.01), and by the positive correlation
between iWUE and stem dimensions at this site (Table 3). Measurements of the foliar carbon
isotope discrimination better integrate the temporal variation in leaf physiological processes
(Farquhar et al., 1989; Johnsen et al., 1999), and have been showed to be highly correlated with
growth (Cregg et al., 2000; Gebremedhin, 2003; Turner et al., 2010; Xu et al., 2000). However,
∆13
did not correlate with stem growth, which agrees with the finding of Chamaillard et al.
(2011) and Monclus et al. (2006). They explain that a lack of correlation among the water use
efficiency parameters and growth occurs when gs is the main driver of iWUE and ∆13
, and
photosynthesis is not related to differences in productivity.
Although this study included only a few genotypes, both Asat, iWUE and ∆13
were
different among the genotypes with variety C4 differing from the OP family. Yang et al. (2002)
found no significant differences in instantaneous iWUE among loblolly pine families; but did
find a difference in stable isotope δ13
C. Other studies have shown the feasibility of using ∆13
to
characterize the clonal genetic variation in WUE (Baltunis et al., 2008; Emhart, 2005;
Gebremedhin, 2003; Prasolova et al., 2003). Otherwise, iWUE may be highly variable since it

115
depends of the fluctuations of Asat, gs or both, and it is the reason why the correlation with the
more integrated parameter (∆13
) is only moderate or non-existent. For some conifers the
correlations between ∆13
and iWUE range from -0.54 to -0.66 (Cregg et al., 2000; Tailor et al.,
2013). In this study, these variables correlated only in the intensive silvicultural treatment at the
VA site. The greater presence and uneven distribution of the weeds in the operational
silvicultural treatment at this site likely increased the heterogeneity in the soil moisture. At NC
the heterogeneity in the soil moisture may also be associated to the differences in
microtopography when bedding was less effective. This heterogeneity in the soil moisture
probably increased the diurnal variability in gas exchange among trees, being reflected in more
experimental error in the instantaneous measurements of gas-exchange, affecting the relations
between ∆13
and iWUE. Similarly, the correlation between iWUE and ∆13
differed among the
genotypes (Figure 9). This could be due to different stomatal sensitivity to VPD (Oren et al.,
1999) among the genotypes. However, we could not support this hypothesis because all the
genotypes had a similar decrease on gs (mean of 34 µmol/m2/s) per unit increase of VPD
(p>0.05). Differences among the genotypes in the relationship between iWUE and ∆13
may be
also linked with stomatal and non-stomatal limitations and their relationship with the variability
in Asat, gs, or both (Cregg et al., 2000; Samuelson et al., 1998), which may require further
research.
This study suggests that the differences in ∆13
among the genotypes may be linked to
their foliage morphology (Figure 12a). To our knowledge, there is no other study in loblolly
pine reporting these relationships. However, in Ponderosa pine, Cregg et al. (2000) found no
relation between ∆13
and specific leaf area (SLA) and stomatal density. In this study, genotypes
with higher fascicle diameter and number of needles per fascicles tended to have higher water
116
use efficiency (as measured by ∆13
). Some facts that may explain this relationships are that
genotypes having higher WUE are associated with lower gs (Figure 12 b), presumable due to
lower stomatal density (Cregg et al., 2000); and that higher values of the morphological
parameters are associated with higher gas exchange surface, with may increase the width of the
boundary layer and reducing the total conductance (Schuepp, 1993). Variety C4 had higher Asat
and gs than the OP family, but the magnitude of the differences between these genotypes were
larger in gs than Asat. Moreover, variety C4 had lower fascicle diameter than the family OP. All
of them are a trait that seems to explain the lower WUE of variety C4 relative to the family OP at
the site of VA.
This study is unique because the assessment of leaf-level physiology of loblolly pine
varieties established at multiple sites has not been reported previously. Our finding suggests that
the growth responses due to the effects of site and silvicultural intensity are not explained
through an effect on leaf level gas exchange or needle morphology. There was not great
variation in gas exchange among sites, and so far the differences in productivity are probably
associated with favorable soils conditions. The growth of individual trees was not also
consistently associated to leaf level gas exchange. We found small, but significant differences in
gas exchange and foliage morphology among some genotypes, but those differences were not
associated with differences at an ideotype level. The correlation between iWUE and ∆13
was
affected by site and silvicultural intensity, and was genotype specific. Genotypes having greater
values of needles morphology tended to have higher WUE (as measured by ∆13
) mostly through
an effect in gs than Asat. We believe these small differences in gas exchange may confer an
advantage to some genotypes as long as it is synchronized at canopy level with other
physiological processes such as carbon partitioning, respiration, and phenology. As was
117
described, broad crown ideotypes allocate more C to branch and foliage development, but they
did not necessarily allocate more C in the stem. The implications of understanding the
differences in the physiological processes among genotypes may help understanding the dynamic
later in the rotation. Once the intraspecific competition increases with the canopy closure, the
positive effect of intensive silviculture on crown development, leaf level physiology, water
demand and growth may be higher in the broad crown ideotypes.

118
TABLES AND FIGURES
Table 1. Parents of the six genotypes assessed. Genotypes C1, C2, C3, and C4 correspond to the
varieties; OP; open pollinated family; CMP; control mass pollinated family. A, B, C, D and E
are arbitrary codes representing the pedigree of the parents.
A B D
A C1
B C4
C C2 CMP
E C3
? OP
Mother
Fat
her

119
Table 2. P-values from the analysis of variance for light-saturated photosynthetic rate (Asat),
intrinsic water use efficiency (iWUE), carbon isotope discrimination (∆��), fascicle diameter and
number of needles per fascicle.
Note: Significant effects are shown in bold type. The effects are SITE, silvicultural intensity (SILV), genetic entry
(GEN) and DATE.
Effect Asat iWUE ∆13 Fascicle
diameter
Needles per
Fascicle
SITE 0.7716 0.0269 0.0161 0.0112 0.4521
SILV 0.0549 0.8559 0.3946 0.0019 0.0117
SITE x SILV 0.0968 0.0679 0.5145 0.3331 0.1771
GEN 0.0298 0.0015 0.2725 <.0001 <.0001
SILV x GEN 0.6315 0.8602 0.1284 0.0176 0.9313
SITE x GEN 0.0756 0.0933 0.0209 0.0559 0.496
SITE x SILV x GEN 0.3851 0.2155 0.4372 0.1279 0.0741
DATE <0.0001 <.0001
SITE x DATE <0.0001 <.0001
SILV x DATE 0.261 0.0073
GEN x DATE 0.9319 0.0333
SITE x SILV x DATE 0.6071 0.0004
SITE x GEN x DATE 0.9588 0.8989
SILV x GEN x DATE 0.9675 0.9355
Foliage morfologyLeaf-physiological parameters
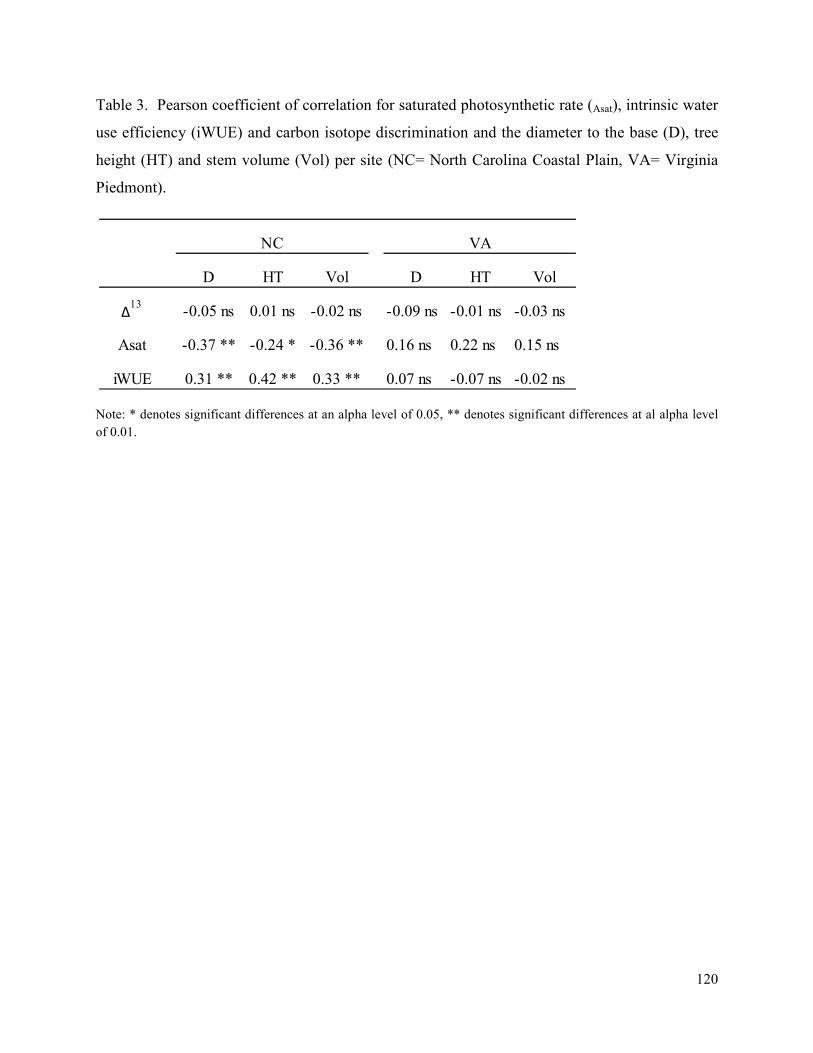
120
Table 3. Pearson coefficient of correlation for saturated photosynthetic rate (Asat), intrinsic water
use efficiency (iWUE) and carbon isotope discrimination and the diameter to the base (D), tree
height (HT) and stem volume (Vol) per site (NC= North Carolina Coastal Plain, VA= Virginia
Piedmont).
Note: * denotes significant differences at an alpha level of 0.05, ** denotes significant differences at al alpha level
of 0.01.
D HT Vol D HT Vol
∆13
-0.05 ns 0.01 ns -0.02 ns -0.09 ns -0.01 ns -0.03 ns
Asat -0.37 ** -0.24 * -0.36 ** 0.16 ns 0.22 ns 0.15 ns
iWUE 0.31 ** 0.42 ** 0.33 ** 0.07 ns -0.07 ns -0.02 ns
VANC
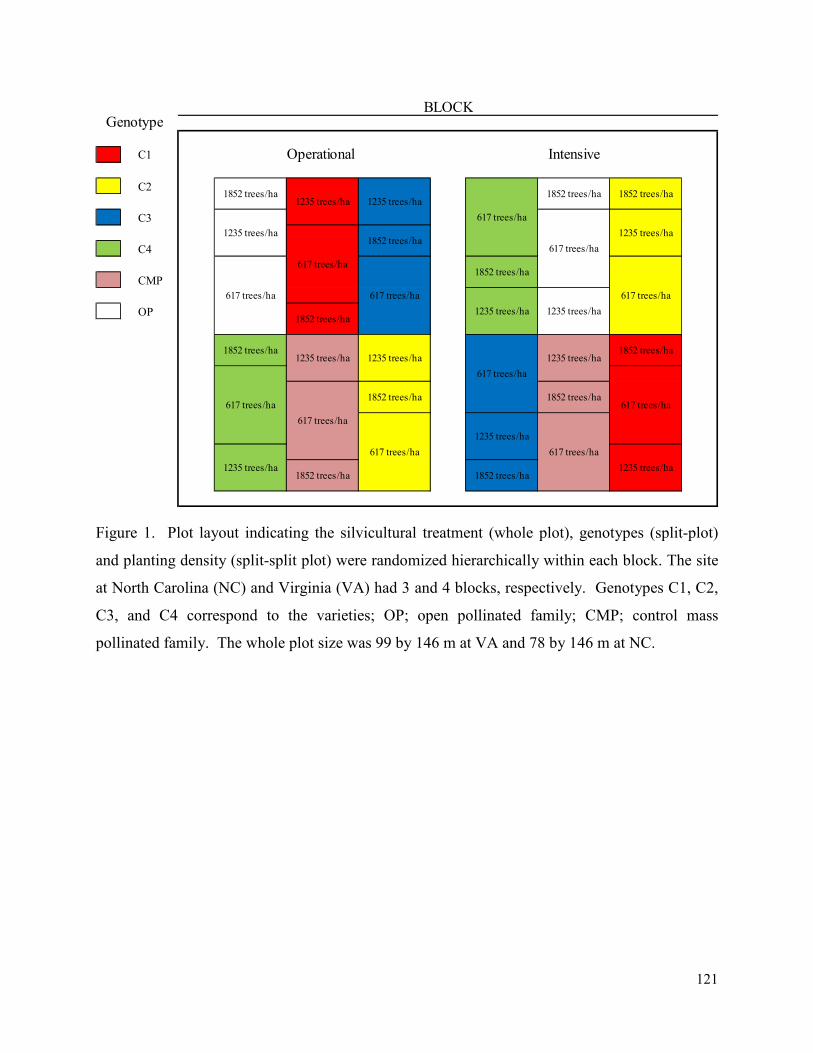
121
Figure 1. Plot layout indicating the silvicultural treatment (whole plot), genotypes (split-plot)
and planting density (split-split plot) were randomized hierarchically within each block. The site
at North Carolina (NC) and Virginia (VA) had 3 and 4 blocks, respectively. Genotypes C1, C2,
C3, and C4 correspond to the varieties; OP; open pollinated family; CMP; control mass
pollinated family. The whole plot size was 99 by 146 m at VA and 78 by 146 m at NC.
C1
C2
C3
C4
CMP
OP
Operational Intensive
BLOCKGenotype
1235 trees/ha
617 trees/ha
617 trees/ha
1852 trees/ha
617 trees/ha
1235 trees/ha
1852 trees/ha
1235 trees/ha
1235 trees/ha
617 trees/ha
1852 trees/ha
617 trees/ha
617 trees/ha
1852 trees/ha
617 trees/ha
617 trees/ha
1852 trees/ha
1235 trees/ha
1852 trees/ha
1235 trees/ha
1852 trees/ha
1235 trees/ha
617 trees/ha
617 trees/ha
1235 trees/ha
1235 trees/ha
1235 trees/ha1852 trees/ha
1235 trees/ha
1852 trees/ha
1852 trees/ha
1235 trees/ha
617 trees/ha
1852 trees/ha
1852 trees/ha
617 trees/ha
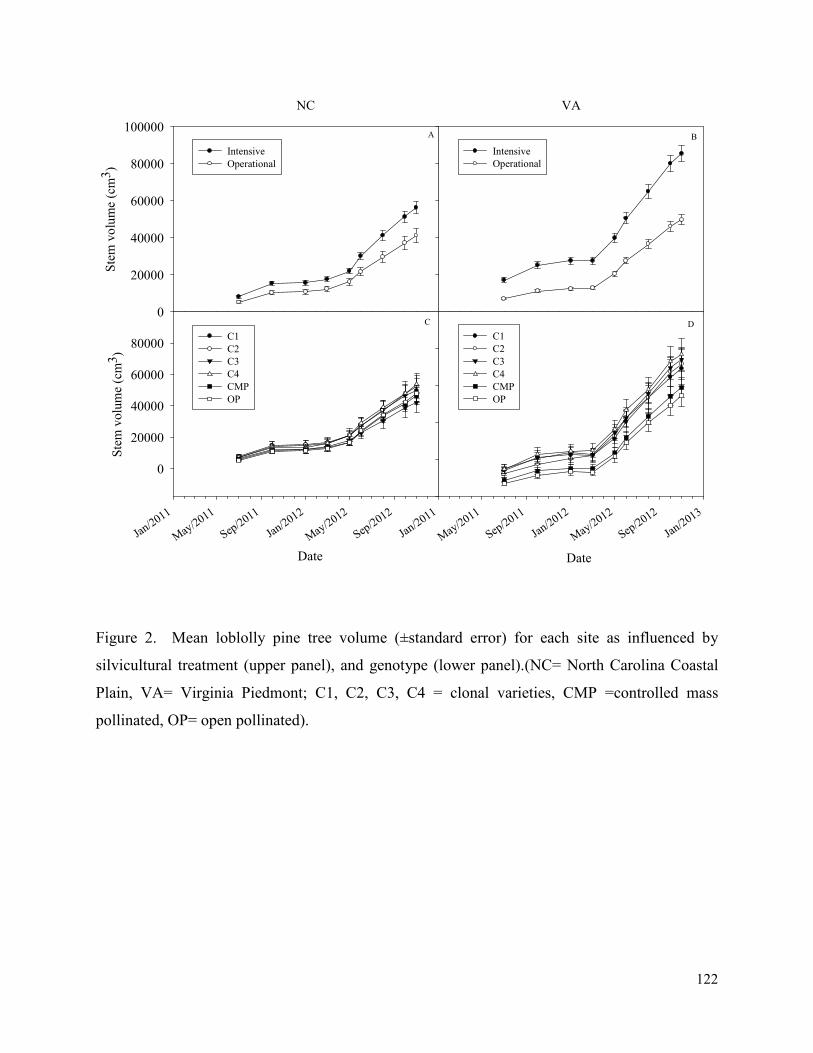
122
NCS
tem
vo
lum
e (c
m3
)
0
20000
40000
60000
80000
100000
Intensive
Operational
VA
Intensive
Operational
Date
Jan/2011
May
/2011
Sep/2011
Jan/2012
May
/2012
Sep/2012
Ste
m v
olu
me
(cm
3)
0
20000
40000
60000
80000C1
C2
C3
C4
CMP
OP
Jan/2011
May
/2011
Sep/2011
Jan/2012
May
/2012
Sep/2012
Jan/2013
C1
C2
C3
C4
CMP
OP
Date
A B
C D
Figure 2. Mean loblolly pine tree volume (±standard error) for each site as influenced by
silvicultural treatment (upper panel), and genotype (lower panel).(NC= North Carolina Coastal
Plain, VA= Virginia Piedmont; C1, C2, C3, C4 = clonal varieties, CMP =controlled mass
pollinated, OP= open pollinated).

123
Figure 3. Least-squares means (±standard error) for loblolly pine saturated photosynthetic rate
(Asat) as influenced by site and date (site by date interaction). * denotes significant differences at
an alpha level of 0.05, ** denotes significant differences at al alpha level of 0.01. NC= North
Carolina Coastal Plain, VA= Virginia Piedmont.
Date
Jan/2011
May
/2011
Sep/2011
Jan/2012
May
/2012
Sep/2012
Jan/2013
Asa
t (m
icro
mol/
m2/s
)
0
2
4
6
8
NC
VA
***
*
*
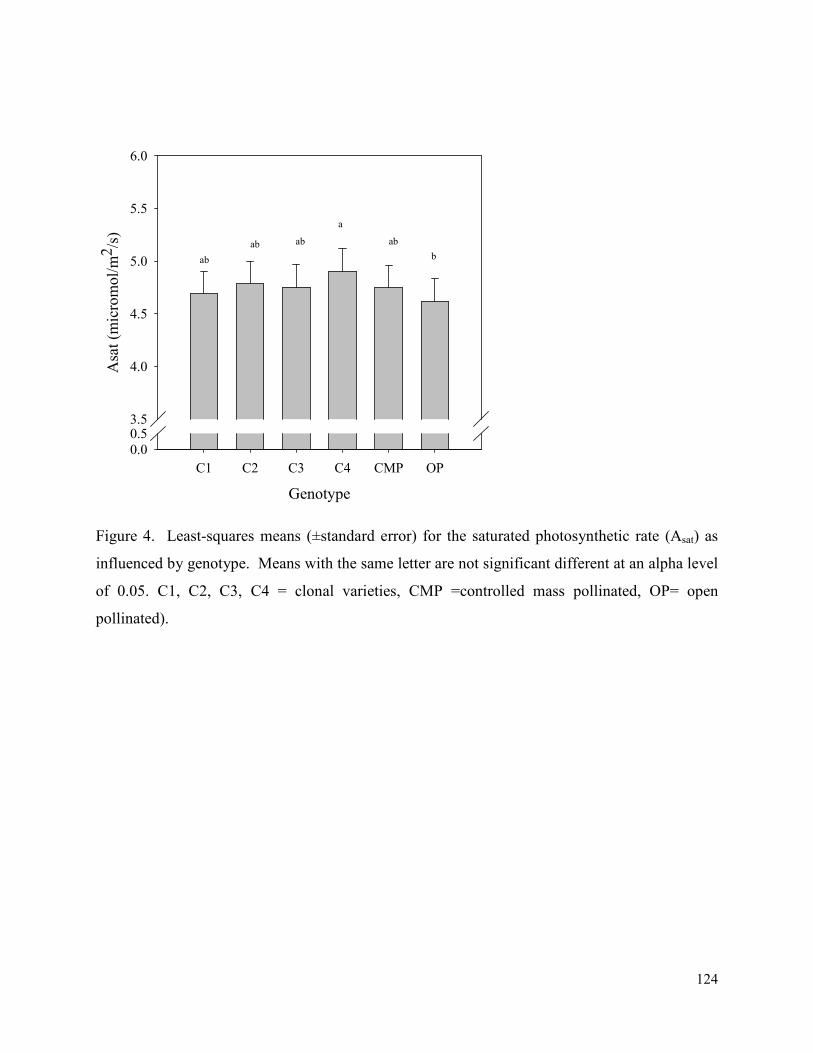
124
Genotype
C1 C2 C3 C4 CMP OP
Asa
t (m
icro
mo
l/m
2/s
)
0.0
0.53.5
4.0
4.5
5.0
5.5
6.0
ab
ab ab
a
ab
b
Figure 4. Least-squares means (±standard error) for the saturated photosynthetic rate (Asat) as
influenced by genotype. Means with the same letter are not significant different at an alpha level
of 0.05. C1, C2, C3, C4 = clonal varieties, CMP =controlled mass pollinated, OP= open
pollinated).

125
Figure 5. Least-squares means (±standard error) for the intrinsic water use efficiency (iWUE) as
influenced by site, silvicultural treatment and date (site by silviculture by date interaction). *: it
denotes significant differences at al alpha level of 0.05, **: it denotes significant differences at al
alpha level of 0.01. NC= North Carolina Coastal Plain, VA= Virginia Piedmont.
Date
Jan/2011
May
/2011
Sep/2011
Jan/2012
May
/2012
Sep/2012
iWU
E (
mic
rom
ol/
m2
/s)
0.00
0.02
0.04
0.06
0.08
0.10
Intensive
Operational
Date
Jan/2011
May
/2011
Sep/2011
Jan/2012
May
/2012
Sep/2012
Jan/2013
Intensive
Operational
NC VA
**
**
*
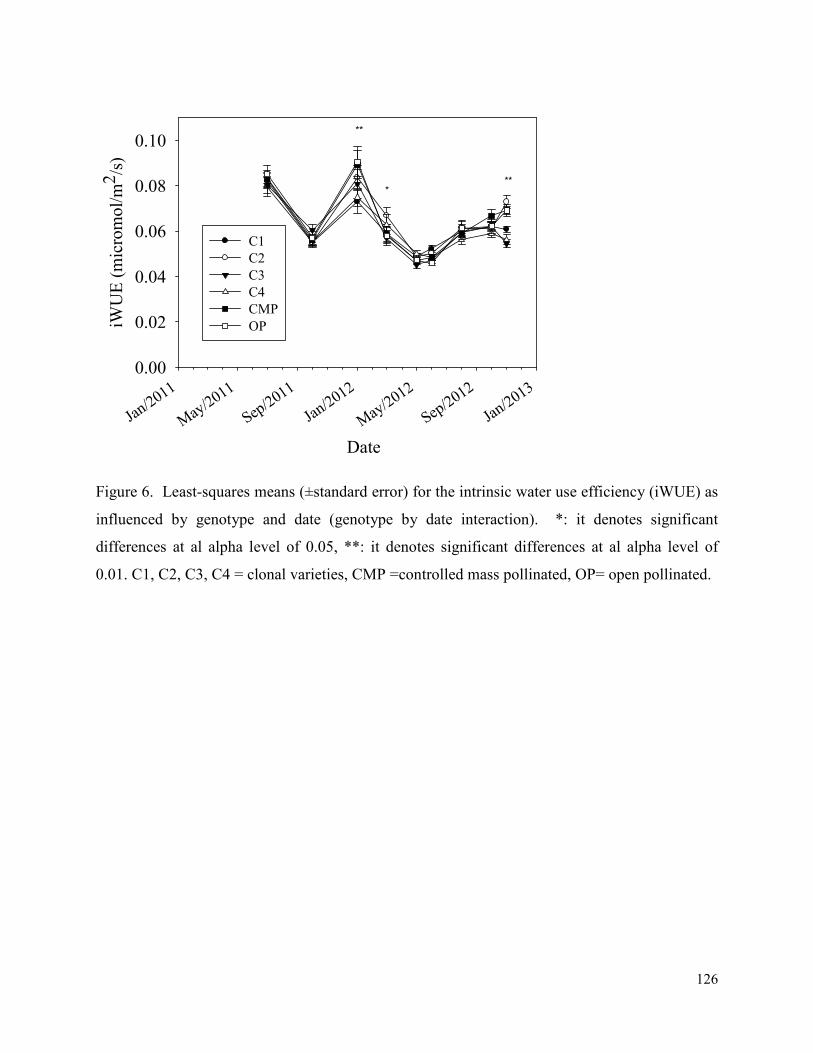
126
Date
Jan/2011
May
/2011
Sep/2011
Jan/2012
May
/2012
Sep/2012
Jan/2013
iWU
E (
mic
rom
ol/
m2/s
)
0.00
0.02
0.04
0.06
0.08
0.10
C1
C2
C3
C4
CMP
OP
**
*
**
Figure 6. Least-squares means (±standard error) for the intrinsic water use efficiency (iWUE) as
influenced by genotype and date (genotype by date interaction). *: it denotes significant
differences at al alpha level of 0.05, **: it denotes significant differences at al alpha level of
0.01. C1, C2, C3, C4 = clonal varieties, CMP =controlled mass pollinated, OP= open pollinated.

127
Figure 7. Least-squares means (±standard error) for carbon isotope discrimination (∆��) as
influenced by genotype. Means with the same letter are not significant different at an alpha level
of 0.1. C1, C2, C3, C4 = clonal varieties, CMP =controlled mass pollinated, OP= open
pollinated. NC= North Carolina Coastal Plain, VA= Virginia Piedmont.
NC
Genotype
C1 C2 C3 C4 CMP OP
0.0
21.0
21.5
22.0
22.5
23.0
23.5
24.0
VA
Genotype
C1 C2 C3 C4 CMP OP
aa a a a
a
ab abab
a
ab
b
<
13
(‰)

128
Figure 8. Relationship between intrinsic water use efficiency (iWUE) and carbon isotope
discrimination ∆13
by site and silvicultural intensity. *: it denotes significant differences at al
alpha level of 0.05, **: it denotes significant differences at al alpha level of 0.01. NC= North
Carolina Coastal Plain, VA= Virginia Piedmont.
NC_Operational
iWU
E
0.02
0.04
0.06
0.08
0.10
0.12
0.14
0.16NC_Intensive
VA_Operational
20 21 22 23
iWU
E
0.02
0.04
0.06
0.08
0.10
0.12
0.14
0.16VA_Intensive
20 21 22 23 24
r=-0.13 ns r=-0.21 ns
r=-0.11 ns r=-0.63 **
(‰)13∆ (‰)13
∆

129
Figure 9. Relationship between intrinsic water use efficiency (iWUE) and carbon isotope
discrimination ∆13
for each genotype. *: it denotes significant differences at al alpha level of
0.05, **: it denotes significant differences at al alpha level of 0.01. C1, C2, C3, C4 = clonal
varieties, CMP =controlled mass pollinated, OP= open pollinated.
C1iW
UE
0.02
0.04
0.06
0.08
0.10
0.12
0.14
0.16
0.18C2
C3
iWU
E
0.02
0.04
0.06
0.08
0.10
0.12
0.14
0.16C4
CMP
20 21 22 23
iWU
E
0.02
0.04
0.06
0.08
0.10
0.12
0.14
0.16OP
20 21 22 23 24
r=-0.59 ** r=-0.48 *
r=-0.57 ** r=-0.35 ns
r=-0.35 ns r=-0.60 **

130
Operational
Genotype
C1 C2 C3 C4 CMP OP
Fas
cicl
e d
iam
eter
(m
m)
1.10
1.15
1.20
1.25
1.30
1.35
1.40
1.45
0.00
a
aba
b
ab
a
Genotype
C1 C2 C3 C4 CMP OP
a a
abb
ab
a
Intensive
Figure 10. Least-squares means (±standard error) for the fascicle diameter as influenced by
silvicultural treatment and genotype (silvicultute by genotype interaction). Means with the same
letter are not significant different at an alpha level of 0.05. C1, C2, C3, C4 = clonal varieties,
CMP =controlled mass pollinated, OP= open pollinated.
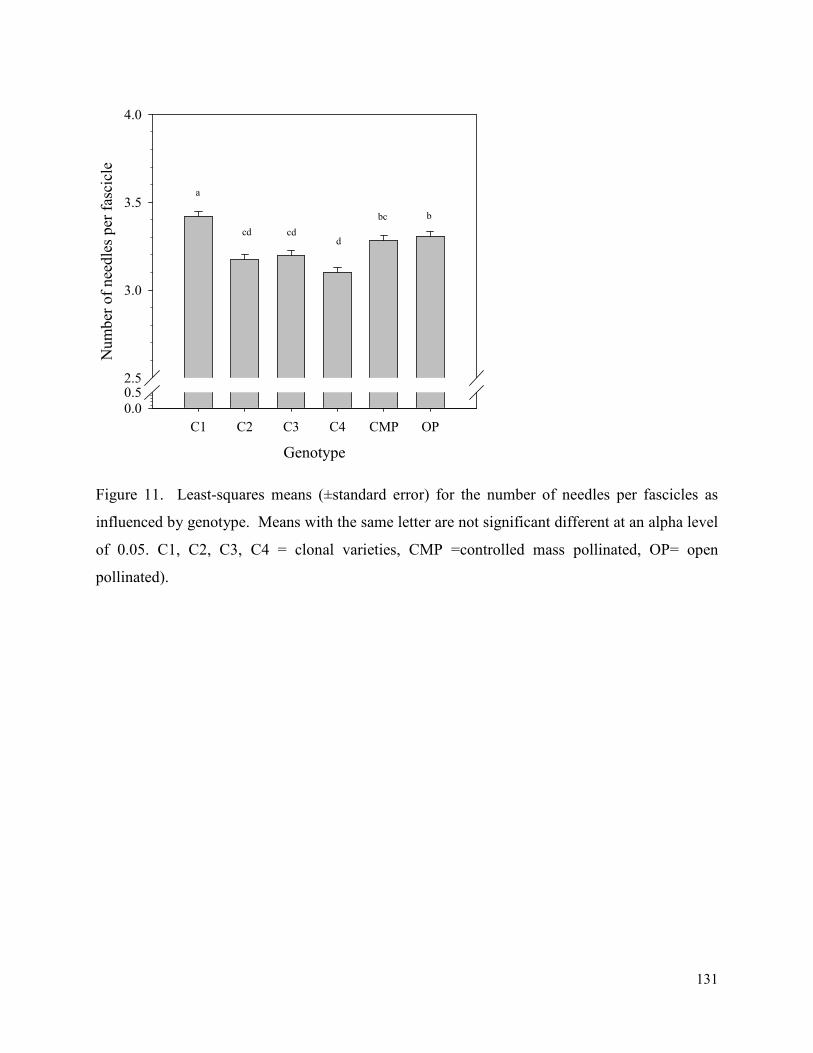
131
Genotype
C1 C2 C3 C4 CMP OP
Num
ber
of
nee
dle
s p
er f
asci
cle
0.0
0.52.5
3.0
3.5
4.0
a
cd cdd
bc b
Figure 11. Least-squares means (±standard error) for the number of needles per fascicles as
influenced by genotype. Means with the same letter are not significant different at an alpha level
of 0.05. C1, C2, C3, C4 = clonal varieties, CMP =controlled mass pollinated, OP= open
pollinated).
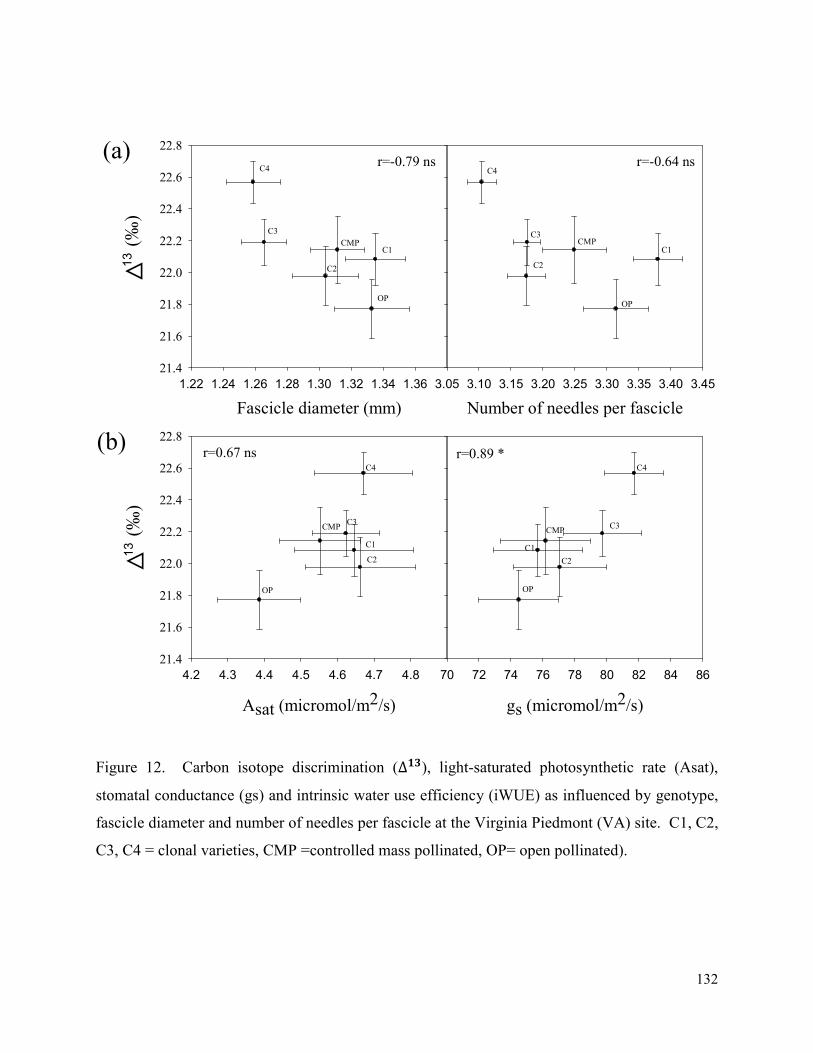
132
Figure 12. Carbon isotope discrimination (∆��), light-saturated photosynthetic rate (Asat),
stomatal conductance (gs) and intrinsic water use efficiency (iWUE) as influenced by genotype,
fascicle diameter and number of needles per fascicle at the Virginia Piedmont (VA) site. C1, C2,
C3, C4 = clonal varieties, CMP =controlled mass pollinated, OP= open pollinated).
Fascicle diameter (mm)
1.22 1.24 1.26 1.28 1.30 1.32 1.34 1.36
21.4
21.6
21.8
22.0
22.2
22.4
22.6
22.8
Number of needles per fascicle
3.05 3.10 3.15 3.20 3.25 3.30 3.35 3.40 3.45
r=-0.79 ns r=-0.64 nsC4 C4
C3 C3CMP CMP
C1 C1
C2 C2
OPOP
Asat (micromol/m2/s)
4.2 4.3 4.4 4.5 4.6 4.7 4.8
21.4
21.6
21.8
22.0
22.2
22.4
22.6
22.8
gs (micromol/m2/s)
70 72 74 76 78 80 82 84 86
r=0.67 ns r=0.89 *C4 C4
C3 C3CMP CMP
C1 C1
C2 C2
OP OP
(a)
(b)
<
13
(‰)
<
13
(‰)
133
REFERENCES
Adams, J.P., Roberts, S.D., 2013. A comparison of growth and stand structural characteristics in
pure- and mixed-family stands of loblolly pine. Forest Science 59, 188-196.
Albaugh, T.J., Allen, H.L., Dougherty, P.M., Kress, L.W., King, J.D, 1998. Leaf area and
above- and belowground growth responses of loblolly pine to nutrient and water additions.
Forest Science 44, 317-328.
Allen, H.L., 1987. Nutrient amendment, stand productivity, and environmental impact. Journal
of Forestry, 37-46.
Allen, H.L., Dougherty, P.M., Campbell, R.G., 1990. Manipulation of water and nutrients -
practice and opportunity in southern U.S. pine forests. Forest Ecol. Manag. 30, 437-453.
Amishev, D.Y., Fox, T.R., 2006. Impact of weed control and fertilization on growth of four
species of pine in the Virginia Piedmont. Gen. Tech. Rep. SRS-92. Asheville, NC: U.S.
Department of Agriculture, Forest Service, Southern Research Station, 121-123.
Aspinwall, M.J., King, J.S., McKeand, S.E., Domec, J.C., 2011. Leaf-level gas-exchange
uniformity and photosynthetic capacity among loblolly pine (Pinus taeda L.) genotypes of
contrasting inherent genetic variation. Tree physiology 31, 78-91.
Baltunis, B., Martin, T., Huber, D., Davis, J., 2008. Inheritance of foliar stable carbon isotope
discrimination and third-year height in Pinus taeda clones on contrasting sites in Florida and
Georgia. Tree Genetics & Genomes 4, 797-807.
Bauer, G.A., Bazzaz, F.A., Minocha, R., Long, S., Magill, A., Aber, J., Berntson, G.M., 2004.
Effects of chronic N additions on tissue chemistry, photosynthetic capacity, and carbon
sequestration potential of a red pine (Pinus resinosa Ait.) stand in the NE United States. Forest
Ecol. Manag. 196, 173-186.
Bettinger, P., Clutter, M., Siry, J., Kane, M., Pait, J., 2009. Broad implications of Southern
United States pine clonal forestry on planning and management of forests. International Forestry
Review 11, 331-345.
Boltz, B.A., Bongarten, B.C., Teskey, R.O., 1986. Seasonal patterns of net photosynthesis of
loblolly pine from diverse origins. Can. J. For. Res. 16, 1063-1068.
Campoe, O.C., Stape, J.L., Albaugh, T.J., Allen, H.L., Fox, T.R., Rubilar, R., Binkley, D., 2013.
Fertilization and irrigation effects on tree level aboveground net primary production, light
134
interception and light use efficiency in a loblolly pine plantation. Forest Ecol. Manag. 288, 43-
48.
Cannell, M.G.R. 1989. Physiological basis of wood production: a review. Scand. J. For. Res. 4,
459-490.
Chamaillard, S., Fichop, R., Vincent-Barbaroux, C., Bastien, C., Depierreux, C., Dreyer, E.,
Villar, M., Brignolas, F., 2011. Variations in bulk leaf carbon isotope discrimination, growth
and related leaf traits among three Populus nigra L. populations. Tree Physiology 31: 1076-
1087.
Chen, C.P., Zhu, X.G., Long, S.P., 2008. The effect of leaf-level spatial variability in
photosynthetic capacity on biochemical parameter estimates using the Farquhar model: A
theoretical analysis. Plant physiology 148, 1139-1147.
Chmura, D.J., Tjoelker, M.G., 2008. Leaf traits in relation to crown development, light
interception and growth of elite families of loblolly and slash pine. Tree physiology 28, 729-742.
Choi, W-J., Chang, S.X., Allen, H.L., Kelting, D.L., Ro, H-M., 2005. Irrigation and fertilization
effects on foliar and soil carbon and nitrogen isotope ratios in a loblolly pine stand. Forest Ecol.
Manag. 213:90-101.
Cregg, B.M., Olivas-Garcia, J.M., Hennessey, T.C., 2000. Provenance variation in carbon
isotope discrimination of mature ponderosa pine trees at two locations in the Great Plains. Can. J.
For. Res. 30, 428-439.
Ellsworth, D.S., 2000. Seasonal CO2 assimilation and stomatal limitations in a Pinus taeda
canopy. Tree physiology 20, 435-445.
Emhart, V.I., 2005. Physiological genetics of contrasting loblolly and slash pine families and
clones. PhD. Dissertation, Univ. Florida, Gainesville, Florida.
Evans, J.R., 1989. Photosynthesis and nitrogen relationships in leaves of C3 plants. Oecologia,
78:9-19.
Farquhar, G.D., Ehleringer, J.R, Hubick, K.T., 1989. Carbon isotope discrimination and
photosynthesis. Annu. Rev. Plant Physiol. 40, 503–537.
Fox, T.R., E.J. Jokela, Allen, H. L., 2007. The development of pine plantation silviculture in the
southern United States. Journal of Forestry. 105 (5), 337-347.

135
Franks, P.J., Cowen, I.R., and Farquhar, G.D. 1997. The apparent feed forward response of
stomata to air vapor deficit: Information revealed by different experimental procedures with two
rainforest trees. Plant Cell Environ. 20:142-145.
Gebremedhin, M.T. 2003. Variation in growth, water relations, gas exchange, and stable isotope
composition among clones of loblolly pine (Pinus taeda L.) under water stress. Master thesis,
Univ. Florida, Gainesville, Florida.
Gough, C.M., Seiler, J.R., Johnsen, K.H., Sampson, D.A., 2004a. Seasonal photosynthesis in
fertilized and nonfertilized loblolly pine. Forest Science 50(1), 1-9.
Gough, C.B., Seiler, J.R., Maier, C.A., 2004b. Short-term effects of fertilization on loblolly pine
(Pinus taeda L.) physiology. Plant, Cell and Environ. 27:876-886.
Green, T.H., Mitchell, R.J., 1992. Effect of nitrogen on the response of loblolly pine to water
stress. New Phytology 122:627-633.
Isik, F., Goldfarb, B., LeBude, A., Li, B., McKeand, S., 2005. Predicted genetic gains and testing
efficiency from two loblolly pine clonal trials. Can. J. For. Res. 1754-1766.
Johnsen, K.H., Flanagan, L.B., Hiber, D.A., Major, J.E., 1999. Genetic variation in growth,
carbon isotope discrimination, and foliar N concentration in Picea mariana: analysis from a half-
diallel mating design using field-grown trees. Can. J. For. Res. 29:1727-1735.
Jokela, E.J., Martin, T.A., 2000. Effects of ontogeny and soil nutrient supply on production,
allocation, and leaf area efficiency in loblolly and slash pine stands. Can. J. For. Res. 30, 1511-
1524.
Jones, P.D., Ezell, A.W., Demarais, S., 2010. Growth response of loblolly pine (Pinus taeda L.)
3–5 years after plantation establishment using different management intensities. J. Sustainable,
For. 29, 486-502.
King, J.S., Albaugh, T.J., Allen, H.L., Kress, L.W., 1999. Stand-level allometry in Pinus taeda
as affected by irrigation and fertilization. Tree physiology 19, 769-778.
King, N.T., Seiler, J.R., Fox T.R., Johnsen, K.H., 2008. Post-fertilization physiology and growth
performance of loblolly pine clones. Tree physiology 28, 703-711.
Liechty, H.O, Fristoe, C., 2013. Response of midrotation pine stands to fertilizer and herbicide
application in the western gulf Coastal Plain. South. J. Appl. For. 37(2), 69-74.
Litton, C.M., Raich, J.W., Ryan, M.G., 2007. Carbon allocation in forest ecosystems. Global

136
Change Biology 13, 2089-2109.
Maier, C.A., Johnsen, K.H., Butnor, J., Kress, L.W., Anderson, P.H., 2002. Branch growth and
gas exchange in 13-year-old loblolly pine (Pinus taeda) trees in response to elevated carbon
dioxide concentration and fertilization. Tree physiology 22, 1093-1106.
Maier, C.A., Palmroth, S., Ward, E., 2008. Short-term effects of fertilization on photosynthesis
and leaf morphology of field-grown loblolly pine following long-term exposure to elevated CO2
concentrations. Tree physiology 28, 597-606.
Manter, D.K., Kavanagh, K.L., Rose, C.L., 2005. Growth response of Douglas-fir seedlings to
nitrogen fertilization: importance of Rubisco activation state and respiration rates. Tree
physiology 25, 1015-1021.
Martin, T.A., Johnsen, K. H., White, T., L., 2001. Ideotype development in southern pines:
Rationale and strategies for overcoming scale-related obstacles. Forest Science 47:21–28.
Martin, T.A., Dougherty, P.M.., Topa, M.A., McKeand, S.E.. 2005. Strategies and case studies
for incorporating ecophysiology into southern pine tree improvement programs. South. J. Appl.
For. 29:70-79.
McGarvey, R.C., Martin, T.A., White, T.L., 2004. Integrating within-crown variation in net
photosynthesis in loblolly and slash pine families. Tree physiology 24, 1209-1220.
McKeand, S.E., Jokela, E.J., Huber, D.A., Byram, T.D., Allen, H.L., Li, B., Mullin, T.J., 2006.
Performance of improved genotypes of loblolly pine across different soils, climates, and
silvicultural inputs. Forest Ecol. Manag. 227, 178-184.
McKeand, S.E., Gerwig, D. M., Cumbie, W. P., Jett. J. B., 2008. Seed orchard management
strategies for deployment of intensively selected loblolly pine families in the southern U.S. P.
177–182, in Lindgren, D. (ed.). Seed orchards, Proc. from a conf. at Umeå, Sweden, Sept 26–28,
2007, (ISBN:978-91-85911-28-8).
McKee, W.H., Wilhite, L.P. , 1986. Loblolly pine response to bedding and fertilization varies by
drainage class on lower Atlantic coastal plain sites. South. J. Appl. For. 10, 16-21.
McMurtrie, R.E., Benson, M.L., Linder, S., Running, S.W., Talsma, T., Crane, W.J.B., Myers,
B.J., 1990. Water/nutrient interactions affecting the productivity of stands of Pinus radiata.
Forest Ecol. Manag. 30, 415-423.
Medlyn, B., Barrett, D., Landsberg, J., Sands, P., Clement, R., 2003. Conversion of canopy

137
intercepted radiation to photosynthate: Review of modelling approaches for regional scales.
Functional Plant Biology 30, 153-169.
Monclus, R., Dreyer, E., Villar, M., Delmotte, F.M., Delay, D., Petit, J.M., Barbaroux, C., Le
Thiec, D., Brechet, C., Brignolas, F., 2006. Impact of drought on productivity and water use
efficiency in 29 genotypes of Populus deltoides x Populus nigra. New Phytologist 169, 765-777.
Munger, G.T., Will, R.E., Borders, B.E., 2003. Effects of competition control and annual
nitrogen fertilization on gas exchange of different-aged Pinus taeda. Can. J. For. Res. 33, 1076-
1083.
Nilsson, U., Allen, H.L., 2003. Short- and long-term effects of site preparation, fertilization and
vegetation control on growth and stand development of planted loblolly pine. Forest Ecol.
Manag. 175, 367-377.
Ocheltree, T.W., Nippert, J.B., Prasad, P.V., 2014. Stomatal responses to changes in vapor
pressure deficit reflect tissue-specific differences in hydraulic conductance. Plant, cell &
environment 37, 132-139.
Oren, R., Sperry, J.S., Katul, G.G., Pataki, D.E., Ewers, B.E., Phillips, N., Schäfer, K.V.R., 1999.
Survey and synthesis of intra- and interspecific variation in stomatal sensitivity to vapour
pressure deficit. Plant, cell & environment 22, 1515-1526.
Palardy, S., 2005. Physiology of woody plants. Third ed. San Diego, California.
Prasolova, N.V., Xu, Z.H., Lundkvist, K., Farquhar, G.D., Dieters, M.J., Walker, S., Saffigna,
P.G., 2003. Genetic variation in foliar carbon isotope composition in relation to tree growth and
foliar nitrogen concentration in clones of the F1 hybrid between slash pine and caribbean pine.
Forest Ecol. Manag. 172, 145-160.
Roth, B.E., Jokela, E.J., Martin, T.A., Huber, D.A., White, T.L., 2007. Genotype × environment
interactions in selected loblolly and slash pine plantations in the Southeastern United States.
Forest Ecol. Manag. 238, 175-188.
Ryan, M.R., Hubbard, R.M., Pongracic, S., Raison, R.J., McMurtrie, R.E., 1996. Foliage, fine-
root, woody-tissue and stand respiration in Pinus radiata in relation to nitrogen status. Tree
physiology, 16:333-343.
Samuelson, L.J., 1998. Influence of intensive culture on leaf net photosynthesis and growth of
sweetgum and loblolly pine seedlings. Forest Science 44, 308-316.

138
Samuelson, L.J., 2000. Effects of nitrogen on leaf physiology and growth of different families of
loblolly and slash pine. New Forests 19, 95-107.
Samuelson, L.J., Eberhartd, T.L., Butnor, J. R., Stokes, T. A., Johnsen, K. H., 2010. Maximum
growth potential in loblolly pine: Results from a 47-year-old spacing study in Hawaii. Can. J.
For. Res. 40, 1914-1929.
Schuepp, P.H., 1993. Tansley Review No. 59 Leaf boundary layers. New Phytologist 125, 477-
507.
Seiler, J.R., Johnson, J.D., 1988. Physiological and morphological responses of three half-sib
families of loblolly pine to water-stress conditioning. Forest Science 34, 487-495.
Stovall, J.P., Carlson, C.A., Seiler, J.R., Fox, T.R., Yanez, M.A., 2011. Growth and stem quality
responses to fertilizer application by 21 loblolly pine clones in the Virginia Piedmont. Forest
Ecol. Manag. 261, 362-372.
Tang, Z., Chambers, J.L., Sword, M.A., Barnett, J.P., 2003. Seasonal photosynthesis and water
relations of juvenile loblolly pine relative to stand density and canopy position. Trees - Structure
and Function 17, 424-430.
Taylor, A.J., Fernandez, R.T., Nzokou, P., Cregg, B., 2013. Carbon isotope discrimination, gas
exchange, and growth of container-grown conifers under cyclic irrigation. HortScience 48, 848-
854.
Teskey, R.O., Bongarten, B.C., Cregg, B.M., Dougherty, P.M., Hennessey, T.C., 1987.
Physiology and genetics of tree growth response to moisture and temperature stress: An
examination of the characteristics of loblolly pine (Pinus taeda L.). Tree physiology 3, 41-61.
Teskey, R.O., Whitehead, D., Linder, S., 1994. Photosynthesis and carbon gain by pines. Ecol.
Bull. 43, 35–49.
Turner, N.C., Schulze, E.D., Nicolle, D., Kuhlmann, I., 2010. Growth in two common gardens
reveals species by environment interaction in carbon isotope discrimination of Eucalyptus. Tree
physiology 30, 741-747.
Tyree, M.C., Seiler, J.R., Maier, C.A., Johnsen, K.H., 2009. Pinus taeda clones and soil nutrient
availability: Effects of soil organic matter incorporation and fertilization on biomass partitioning
and leaf physiology. Tree physiology 29, 1117-1131.
Vance, E.D., Sanchez, F.G., 2006. Perspectives on site productivity of loblolly pine plantations

139
in the Southern United States. Forest Ecol. Manag. 227, 135-136.
Vose, J.M., Allen, H.L., 1988. Leaf Area, stemwood growth, and nutrition relationships in
loblolly pine. Forest Science 34, 547-563.
Warren, C., Dreyer, E., Adams, M., 2003. Photosynthesis-Rubisco relationships in foliage of
Pinus sylvestris in response to nitrogen supply and the proposed role of Rubisco and amino acids
as nitrogen stores. Trees 17, 359-366.
Wertin, T.M., McGuire, M.A., Teskey, R.O., 2010. The influence of elevated temperature,
elevated atmospheric CO2 concentration and water stress on net photosynthesis of loblolly pine
(Pinus taeda L.) at northern, central and southern sites in its native range. Glob. Change
Biol. 16(7), 2089-2103.
Whetten, R.W., Kellison, R., 2010. Research gap analysis for application of biotechnology to
sustaining US forests. Journal of Forestry, 193-201.
Will, R.E., Barron, G.A., Burkes, E.C., Shiver, B., Teskey, R.O., 2001. Relationship between
intercepted radiation, net photosynthesis, respiration, and rate of stem volume growth of Pinus
taeda and Pinus Elliottii stands of different densities. Forest Ecol. Manag. 154, 155-163.
Will, R., 2005. The effects of annual fertilization and complete competition control on fascicle
morphology of different aged loblolly pine stands. Trees 19, 129-136.
Wright, J., Dougherty, D. 2006. Varietal forestry. Forest Landonwer. September/October. 3-4.
Wright, J., Dougherty, D., 2007. Silviculture for your varietal loblolly pine plantation. Forest
Landonwer. May/June. 26-29.
Xu, Z.H., Saffigna, P.G., Farquhar, G.D., Simpson, J.A., Haines, R.J., Walker, S., Osborne,
D.O., Guinto, D., 2000. Carbon isotope discrimination and oxygen isotope composition in
clones of the F1 hybrid between slash pine and caribbean pine in relation to tree growth, water-
use efficiency and foliar nutrient concentration. Tree physiology 20, 1209-1217.
Yang, W.Q., Murthy, R., King, P., Topa, M.A., 2002. Diurnal changes in gas exchange and
carbon partitioning in needles of fast- and slow-growing families of loblolly pine (Pinus taeda).
Tree physiology 22, 489-498.
Zhao, D., Kane, M., Borders, B., Harrison, M., Rheney, J., 2009. Site preparation and competing
vegetation control affect loblolly pine long-term productivity in the southern Piedmont/Upper
Coastal Plain of the United States. Annals of Forest Science 66, 705-705.

140
SUMMARY AND FINAL REMARKS
The planting of varieties is becoming a reality in loblolly pine, and greater gains in
productivity and uniformity are expected. However, to achieve the potential growth, the planting
of varieties has to be linked with intensive silvicultural systems. Many varieties are tested and
selected simultaneously, and silvicultural prescriptions are site specific, which may result in
multiple growth responses and significant genotype by silvicultural treatment interactions.
Ignoring these important interactions may cause losses in productivity. Overall, in this study we
attempted to assess the responses in growth and stand uniformity of loblolly pine clonal varieties
and families to silvicultural management in two contrasting geographical areas in the southern
United States, the Virginia Piedmont and the North Carolina Coastal Plain. Moreover, to get
more insights from the ecophysiological point of view, we tested the effects of silvicultural
management at a crown ideotype level, and its effects on leaf-gas exchange parameters. Two
varieties of each crown ideotype (narrow vs broad) and two families (CMP and OP family) were
tested in one site in the Virginia Piedmont (VA) and one site in the North Carolina Coastal Plain
(NC) under different silvicultural intensities (operational vs intensive), and planting density (617,
1235 and 1852 trees per hectare). Data were collected for the first four growing season. This
dissertation was structured in three chapters, comprising the assessment of the site by silviculture
by genotype interactions on growth and crown attributes in chapter 1, the assessment of sources
of variability on stand uniformity in chapter 2, and the assessment of those sources of variability
on the gas exchange and its relationship with tree growth in chapter 3. The most important
results are as follow:

141
Chapter 1
Stem growth and crown attributes were measured during the first four growing seasons.
Overall, we found complex interactions among site, silvicultural treatments and genotypes on
stem growth and crown attributes. Across all treatments and sites, the varieties generally had
higher stem growth than the OP family, but their differences were higher at the VA site and
under the intensive silvicultural treatment. The CMP family generally performed between
varieties and the OP family. Tree growth at the poorly drained site at NC was more
heterogeneous than at VA, which probably dampened the genetic and silvicultural effects
relative to the VA site. These facts agree with the hypothesis that the superior growth responses
of varieties over the OP and CMP families (genetic controls) are more evident in better
conditions of soil and silviculture.
Crown characteristics were more responsive than height and dbh to the environmental
effect of site, silvicultural treatment, and planting density. The intensive silvicultural treatment
increased crown width and decreasing HTLC. The combined effect of resource availability on
crown attributes was evident by the effect of the planting density at age 4. The greater
intraspecific competition in the highest planting density decreased crown width and increased
branch mortality (higher HTLC). Varieties having broad-crown ideotypes were more responsive
in crown attributes to the effect of site, silviculture, and planting density than the narrow-crown
ideotype. However, those responses in crown attributes were not expressed in the stem growth,
indicating that larger canopies are not necessarily allocating more C in the stem. Then, we reject
the hypothesis that varieties differ in the growth response to the silvicultural intensity and
planting density, and the magnitude of that response is associated to the size and plasticity of
their crowns.
142
Chapter 2
Stand uniformity of tree height, dbh and stem volume was assessed after four years at the
planting density of 1235 trees/ha. Stand uniformity was evaluated with the standard deviation
(STD), coefficient of variation (CV), and two parameters derived from the Lorenz curve (Gini
index and P50). Intensive silviculture increased stand volume by 50% relative to the operational
treatment, but it had a minor effect on stand uniformity at this young stage of the stand
development. Among the varieties, the narrowest crown variety (C1) was the least uniform,
whereas the one with the broadest crown (C4) was the most uniform. The other two varieties
were in an intermediate situation. Hence, we did not have evidence to accept the hypothesis that
the response on stand uniformity due to intensive silviculture may be greater on the broad-crown
varieties. Similarly, the low uniformity of variety C1 was comparable to the uniformity of the
OP family, which indicates that stand uniformity is not an attribute of all varietal stands as we
hypothesized, and certain varieties may be more uniform than others. Overall, there increasing
the stand uniformity had a positive effect on stand productivity. The differences in stand
uniformity among genotypes and their impact on productivity differed between the sites. Highly
heterogeneous sites as the one at NC may dampen the effect of increasing either the silvicultural
intensity or the genetic uniformity (from non-varietal to varietal) on the stand uniformity.
Chapter 3
Gas exchange parameters (Asat, iWUE and ∆13
) and foliage morphology (fascicle
diameter an number of needles per fascicle) were intensively measure from mid-summer in the
third growing season (2011) until late fall in the fourth growing season (2012). At the end of the
four growing season, the intensive silvicultural treatment had a significant increase in stem
143
volume, but the magnitude of this effect was higher at VA. Varieties differed in stem volume
only at the VA site. There was not a silvicultural effect on gas exchange parameters, but it did
impact foliage morphology. We speculate that soil resources that may limit gas exchange were
enough in both silvicultural treatments. The broadest crown variety (C4) had higher
photosynthetic rate and carbon isotope discrimination (i.e. lower water use efficiency) than the
OP family; whereas, variety C4 had the lower fascicle diameter and number of needles per
fascicle. Variety C2 (second broadest crown variety) behaved similarly to the narrowest crown
variety C1. Therefore, gas exchange differences were not consistent within ideotypes as we
hypothesized. Asat did not show great variation in response to the two silvicultural treatments or
the sites. The relationship between ∆13
and iWUE differed by site, silvicultural intensity, and
genotype. Overall leaf-gas exchange did not explain the differences in productivity among
loblolly pine genotypes in a broad range of environmental conditions (site and silvicultural
treatments).
Final remarks
This study showed the complex interactions that may rise with the deployment of
varieties. Regarding the cost associated to varietal seedling, varieties must be planted in the
better sites with higher silvicultural input; otherwise, they may not express their potential in
growth and uniformity. Our results also showed that differences in crown development, leaf-
level physiology, and stand uniformity may exist among the varieties. However, at the young
phase of the stand development assessed in this study, we could not evaluate entirely their effect
on productivity. A greater intraspecific competition later in the rotation may exacerbate these
differences among genotypes. Although, it has been reported previously that leaf-level
physiology does not vary much among different environmental conditions, we believe that small
144
differences among genotypes matter when they are integrated at a canopy level. The plasticity of
the crown attributes of some of the varieties, even small differences, could influence their
success.
To our knowledge, there are no others studies reporting the variation in morphological
and physiological attributes in loblolly pine varieties. This information may help process-based
model for the prediction of varietal stands. The experiments of this study comprised different
varieties (differing in crown ideotype), silvicultural intensities, planting density, contrasting sites
characteristics and large block-plots. As our study showed, the scale of these experiments allows
testing complex interaction with a higher statistical power. The differences in crown attributes
among the varieties were not necessarily expressed in higher stem growth. Futures studies may
focus their attention on below-ground fluxes. The range of sites considered also may allow
testing other factors driving higher productivity as phenology, nutrient use efficiency, disease
incidence, light interception and light use efficiency, etc. This study is the first on this trial
network, and important clues among the genetic by environment interaction may also be
obtained assessing the individual abilities of the varieties under a greater intraspecific
competition after the canopy closure.