management information release - gov.uk
TRANSCRIPT

Management information release Management Information for Probation, 1 June – 30 September England & Wales Ministry of Justice
17 November 2014

Section 1 – Background
Background
On 1 June 2014, as part of the Transforming Rehabilitation reforms to probation, responsibility for delivery of probation services moved from 35 probation trusts to 21 Community Rehabilitation Companies (CRCs) and the National Probation Service (NPS). CRCs are responsible for managing offenders who pose a low or medium risk of serious harm. The NPS is responsible for managing offenders who pose a high risk of serious harm and those who have committed the most serious offences. The NPS also provides advice to the courts on issues such as sentencing, determines whether offenders should be allocated to a CRC or to the NPS, and deals with enforcement action for offenders who are alleged to have breached a court order.
This ad‐hoc management information release presents the management information used by the
Planning and Analysis Group (PAG) within the National Offender Management Service (NOMS) to
monitor probation performance since CRCs and the NPS became responsible for delivery of
probation services on 1 June 2014. The measures in this report include management information
against which the performance of probation trusts was monitored before 1 June. They also include
two new measures that reflect processes which were only introduced on 1 June: carrying out a Risk
of Serious Recidivism (RSR) assessment and allocating cases to a CRC or to the NPS.
These data are presented at national level to examine performance across the probation system,
with distinctions made between the NPS and CRCs where appropriate. Comparisons to historic
information have also been made where appropriate.
2

Section 2 ‐ Public Protection
2.1 Serious Further Offence Notifications
A notification is triggered where an offender under statutory probation supervision is charged with a
qualifying offence for the purposes of the Probation Serious Further Offence Review Procedures. If
an offender is charged with a serious sexual or violent offence1 he or she will be considered to have
committed a serious further offence if the offence is either murder or listed in the qualifying
offences based on Schedule 15 of the Criminal Justice Act 2003.
The number of SFO notifications between 1 June 2014 and 30 September 2014 was 151. This is a
reduction compared with the same periods in the last 2 years, as shown in Table 1.
Table 1: Serious Further Offence notifications 1 June and 30 September in each year
Period Notifications
1 June – 30 September 2012 181
1 June – 30 September 2013 181
1 June – 30 September 2014 151
Figure 1 shows that the number of SFO notifications per month for the period 1 June to 30
September for 2014, 2013 and 2012.
Figure 1: Serious Further Offence notifications received per month between 1 June and 30 September in
each year
0
10
20
30
40
50
60
70
Jun Jul Aug Sep Jun Jul Aug Sep Jun Jul Aug Sep
2012 2013 2014
1 An offender may be charged with more than one serious further offence.
3

Table 2: Serious Further Offence notifications received per month between 1 June and 30 September in each
year
Date SFO notifications ‐ Probation
2012 2013 2014
Jun 41 36 37
Jul 46 45 37
Aug 54 61 34
Sep 40 39 43
Total 181 181 151
2.2 Licence Recalls
Offender managers will seek to recall an offender on licence in the community if:
1) his or her behaviour indicates that they present an increased Risk of Serious Harm (RoSH) to the
public and can no longer be managed in the community; or
2) an imminent risk of further offences being committed exists; or
3) contact between the offender manager and the offender has broken down.
Table 3 shows a slight increase in the number of licence recalls between the first quarter of 2013/14
and the second quarter of 2014/15.
Table 3: Licence Recalls each quarter between Q1 2013/14 and Q2 2014/152
Period Licence recalls
Q1 2013/14 4348
Q2 2013/14 4499
Q3 2013/14 4472
Q4 2013/14 4196
Q1 2014/15 4216
3Q2 2014/15 4621
2 The data from Q1 2013/14 to Q1 2014/15 has been sourced from the Offender Management Quarterly Statistical Publication April ‐ June 2014. 3 The data for Q2 2014/15 is based on unpublished weekly data, the data in this quarter begins on Tuesday 1st July to avoid double counting.
4

Figure 2 shows the number of recalls in weekly intervals from week commencing 31 March 2014 to
22 September 2014 and splits the national data into CRC and NPS from 1 June onwards. Figure 2
shows that the variation in the weekly data is consistent between CRC and NPS.
Figure 2: Licence recalls between week commencing 31 March and 22 September 2014
0
50
100
150
200
250
300
350
400
450
31/0
3/20
14
07/0
4/20
14
14/0
4/20
14
21/0
4/20
14
28/0
4/20
14
05/0
5/20
14
12/0
5/20
14
19/0
5/20
14
26/0
5/20
14
02/0
6/20
14
09/0
6/20
14
16/0
6/20
14
23/0
6/20
14
30/0
6/20
14
07/0
7/20
14
14/0
7/20
14
21/0
7/20
14
28/0
7/20
14
04/0
8/20
14
11/0
8/20
14
18/0
8/20
14
25/0
8/20
14
01/0
9/20
14
08/0
9/20
14
15/0
9/20
14
22/0
9/20
14
Probation Services CRC NPS
5

Table 4: Licence recalls between week commencing 31 March and 22 September 2014
6

Section 3 ‐ Staffing
This section presents workforce figures from 1 June 2014 to 30 September 2014 compared with
historical baselines where possible and appropriate. The areas covered in this publication are
sickness, staff‐in‐post, joiners and leavers.
The new arrangements meant that there was a change in the way that workforce figures were
recorded across probation. Due to the split of staff between the NPS and CRCs, much of the data
presented in this publication are either newly collected data from 1 June 2014, or incomparable to
historic figures.
The sources of data in this publication are as follows:
i) NPS workforce data from Phoenix HR System.4 ii) CRC workforce data from CRC Workforce Returns.5
3.1 Sickness
Staff sickness absence is recorded and collected for a number of different reasons and these data
are used for a variety of different purposes. The main measure used is annualised Average Working
Days Lost (AWDL). This measure looks at the average number of days’ absence in each month per
each notional full time equivalent (FTE) member of staff, multiplied up by 12 to represent an
annualised number. Table 5 shows that from June 2014 to September 2014, there has been an
increase in sickness from 9.9 to 11.9 AWDL nationally.
Table 5: Annualised AWDL from June 2014 to September 2014
June 2014 July 2014 August 2014 September 2014
NPS 9.0 10.9 10.9 11.7
CRC 10.7 11.8 11.2 12.1
National 9.9 11.4 11.0 11.9
Figure 3 shows the annualised Average Working Days Lost (AWDL) in each month. For NPS and CRCs,
annualised AWDL is shown for June 2014 to September 2014. This is compared with the annualised
AWDL in probation in the previous year, for consistent comparison and to capture seasonal
fluctuations which are evident in sickness absence. The broken line in Figure 3 represents the
historic 5 year average of annualised AWDL in probation. The period from June 2013 to April 2014
shows a gradual rise in sickness in Probation Trusts. The period from June 2014 to September 2014
4 The records of staff transferring to the NPS were partially migrated to Phoenix HR System in June 2014. A validation exercise of this data took place in September 2014, in which additional data relating to staff has been appended. 5 To capture workforce figures for CRCs, a workforce data collection template (CRC Workforce Return) was implemented in June 2014. CRCs are required to submit returns on a monthly basis to enable the monitoring of staffing levels and to inform statutory returns.
7

shows an increase in AWDL compared to the previous year, but follows a similar seasonal pattern to
the previous year and to the historic 5 year trend.
Figure 3: Probation sickness trends
0
2
4
6
8
10
12
14
May Jun Jul Aug Sep Oct Nov Dec Jan Feb Mar Apr
Sickness in month
Ann
ualis
ed A
WD
L
5 Year Trend (2009 to 2014) Probation May 2013 to Apr 2014CRC (Jun 14 - Sep 14) NPS (Jun 14 - Sep 14)
Figure 4a shows the length of sickness absence that is contributing to the total working days lost in
each month for CRCs. Long term sickness (one sickness absence period greater than or equal to 29
calendar days) is contributing more towards the total working days lost, with over 50% of working
days lost from July to September 2014 being as a result of absences of 29 days or more. DDA
represents any sickness absence which falls within the meaning of the Disability Discrimination Act6.
Figure 4b shows a similar picture for the NPS, with long term sickness consistently contributing to
67% of total sickness absence between July and September 2014.
6 http://www.legislation.gov.uk/ukpga/2005/13/contents
8

Figure 4a: Sickness absence length in CRCs
0%
10%
20%
30%
40%
50%
60%
70%
Jun-14 Jul-14 Aug-14 Sep-14
% o
f To
tal W
ork
ing
Da
ys L
ost
29+ days <29 days Disability Discrimination Act
Figure 4b: Sickness absence length in NPS
0%
10%
20%
30%
40%
50%
60%
70%
Jun-14 Jul-14 Aug-14 Sep-14
% o
f Tot
al W
orki
ng D
ays
Lost
29+ days <29 days
9

3.2 Staff in Post
The overall staffing levels in both NPS and CRCs have remained fairly constant from June 2014 to
September 2014, with a marginal increase in funded staff in post in CRCs and a small decrease in
funded staff in post in the NPS. Staffing levels across probation are 500 higher overall in comparison
to pre‐transition levels.
Table 6 shows all funded staff in post in the NPS and CRCs.
Table 6: Funded Staff in Post (FTE)
Probation Services CRC NPS Total
Jan‐14 16,200 16,200
Feb‐14 16,200 16,200
Mar‐14 16,100 16,100
Apr‐14 16,100 16,100
May‐141 ‐
Jun‐14 8,330 8,300 16,630
Jul‐14 8,330 8,280 16,610
Aug‐14 8,380 8,260 16,640
Sep‐14 8,450 8,200 16,650
1 ‐ Data for May 2014 are unavailable
Tables 7a and 7b show a breakdown of the funded staff in post within CRCs and NPS by bands. The
tables show that the overall increase in staff in post in CRCs is attributable primarily to rises in Bands
1 to 3 and the overall fall is seen in NPS staff is attributable to a fall in NPS Bands 1 to 3. The level of
Probation Officers within both sectors has remained fairly stable.
Table 7a: Funded Staff in Post (FTE) in CRCs from June to September 20147
CRC Staff Jun 14 Jul 14 Aug 14 Sept 14
CEO 20 20 20 20
Manager Bands A to D 210 210 210 200
Probation Officer Band 4 2,040 2,030 2,040 2,040
Other Bands 5 to 6 900 880 880 900
Bands 1 to 3, including
Probation Support Officers
5,150 5,180 5,210 5,280
Other 10 10 20 0
Total 8,330 8,330 8,380 8,450
7 Please note that staffing figures are rounded and therefore staff in post figures may not directly tally with figures for joiners and leavers
10
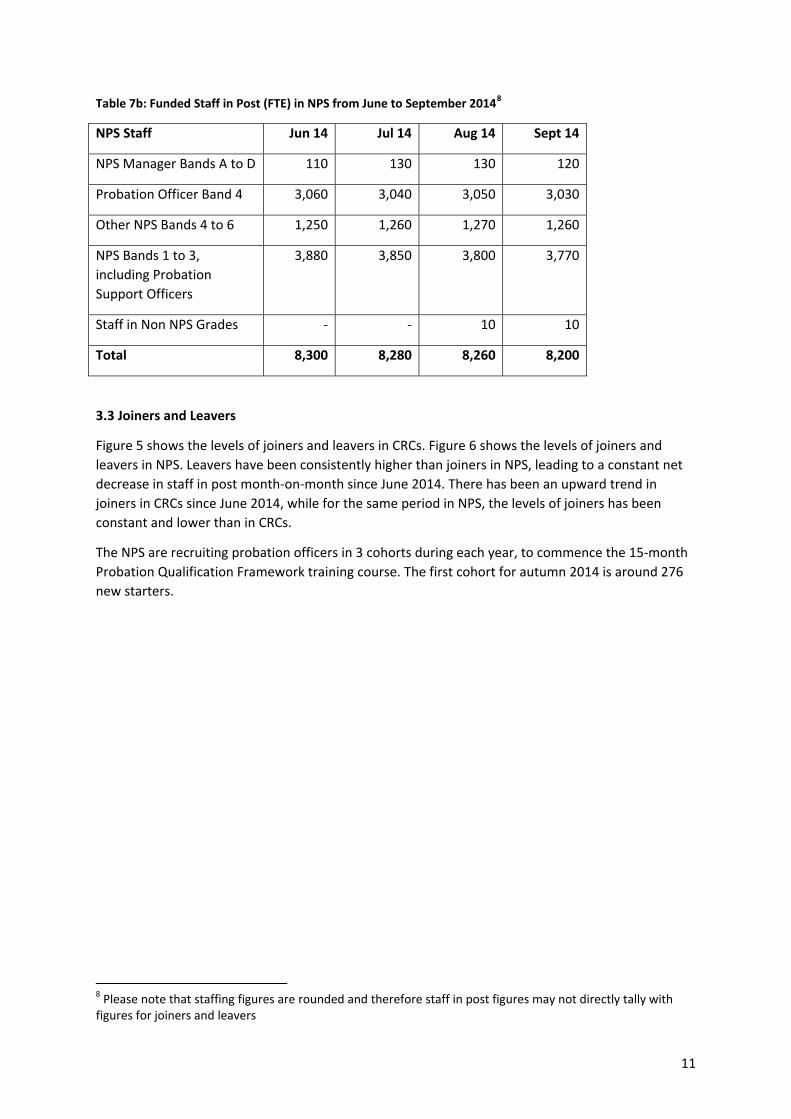
Table 7b: Funded Staff in Post (FTE) in NPS from June to September 20148
NPS Staff Jun 14 Jul 14 Aug 14 Sept 14
NPS Manager Bands A to D 110 130 130 120
Probation Officer Band 4 3,060 3,040 3,050 3,030
Other NPS Bands 4 to 6 1,250 1,260 1,270 1,260
NPS Bands 1 to 3,
including Probation
Support Officers
3,880 3,850 3,800 3,770
Staff in Non NPS Grades ‐ ‐ 10 10
Total 8,300 8,280 8,260 8,200
3.3 Joiners and Leavers
Figure 5 shows the levels of joiners and leavers in CRCs. Figure 6 shows the levels of joiners and
leavers in NPS. Leavers have been consistently higher than joiners in NPS, leading to a constant net
decrease in staff in post month‐on‐month since June 2014. There has been an upward trend in
joiners in CRCs since June 2014, while for the same period in NPS, the levels of joiners has been
constant and lower than in CRCs.
The NPS are recruiting probation officers in 3 cohorts during each year, to commence the 15‐month
Probation Qualification Framework training course. The first cohort for autumn 2014 is around 276
new starters.
8 Please note that staffing figures are rounded and therefore staff in post figures may not directly tally with figures for joiners and leavers
11

Figure 5: Joiners and Leavers in CRCs (FTE)9
0
20
40
60
80
100
120
140
Jun-14 Jul-14 Aug-14 Sep-14
FT
E
CRC Leavers CRC Joiners
Table 8: Joiners and Leavers in CRCs (FTE)10
June 2014 July 2014 August 2014 September 2014
CRC Joiners 80 120 110 130
CRC Leavers 100 130 80 80
9 Please note that staffing figures are rounded and therefore staff in post figures may not directly tally with figures for joiners and leavers 10 Please note that staffing figures are rounded and therefore staff in post figures may not directly tally with figures for joiners and leavers
12

Figure 6: Joiners and Leavers in NPS (FTE)
0
10
20
30
40
50
60
Jun-14 Jul-14 Aug-14 Sep-14
FT
E
NPS Leavers NPS Joiners
Table 9: Joiners and Leavers in NPS (FTE)
June 2014 July 2014 August 2014 September 2014
NPS Joiners 10 10 10 ~
NPS Leavers 50 50 50 50
Figure 7 shows the annualised turnover rate11 for CRCs and NPS. The annualised turnover rate in
CRCs is higher than NPS, despite a downward trend since July 2014, but Figure 5 shows that this is
replenished by joiners. The leaving rate in NPS has been approximately consistent from June 2014 to
September 2014.
It should be noted that Figure 7 and Table 10 represent annualised turnover figures based on
monthly figures. These figures are therefore likely to be more volatile than annual figures, and are
unlikely to represent actual turnover across the entire year.
11 For CRCs, leavers (FTE) in the month divided by the staff in post (FTE including staff seconded in, excluding staff seconded out) at the end of the month, multiplied up by 12 to represent an annualised figure. For NPS, leavers (FTE) in the month divided by the funded staff in post (FTE) at the end of the month, multiplied up by 12 to represent an annualised figure.
13

Figure 7: Annualised turnover rates in NPS and CRCs
0%
2%
4%
6%
8%
10%
12%
14%
16%
18%
20%
Jun-14 Jul-14 Aug-14 Sep-14
Ann
ualis
ed le
avin
g ra
te
CRC NPS
Table 10: Annualised turnover rates in NPS and CRCs
June 2014 July 2014 August 2014 September 2014
NPS 7.5% 7.4% 7.1% 7.5%
CRC 14.2% 18.2% 10.7% 11.1%
14
Section 4 – Performance
When responsibility for delivery of probation services in England and Wales transferred on 1 June to
CRCs and the NPS, critical performance measures (or ‘metrics’) from the previous structure that
were used to monitor performance of the 35 probation trusts were carried forward. Once ownership
of CRCs transfers to new owners, this rolled‐forward set of measures will be replaced with a new
performance framework for both the CRCs and the NPS.
In the interim, the rolled‐forward probation trust metrics are monitored monthly and comparisons
are made with the previous year. The measures cover three main areas of performance:
timeliness of service delivery;
delivery of the sentence of the court;
completion of sentence requirements.
The performance for metrics that measure rates have been charted as time series – using monthly
management information data from April 2012 to September 2014. The metrics measuring volumes
show absolute figures from each month, compared year on year.
It is worth noting that since the introduction of the new probation arrangements, the NPS and CRCs
are managing cohorts of offenders that have different characteristics and demographics. This should
be considered when comparing performance between the NPS and CRCs.
15
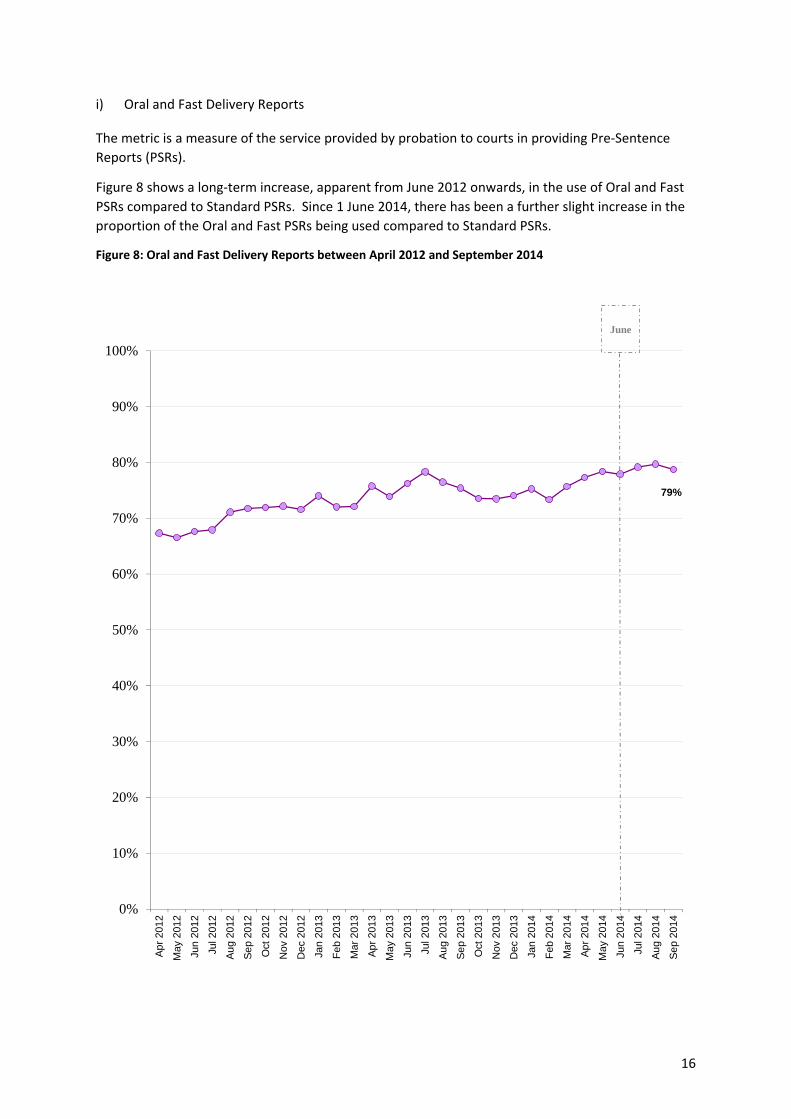
i) Oral and Fast Delivery Reports
The metric is a measure of the service provided by probation to courts in providing Pre‐Sentence
Reports (PSRs).
Figure 8 shows a long‐term increase, apparent from June 2012 onwards, in the use of Oral and Fast
PSRs compared to Standard PSRs. Since 1 June 2014, there has been a further slight increase in the
proportion of the Oral and Fast PSRs being used compared to Standard PSRs.
Figure 8: Oral and Fast Delivery Reports between April 2012 and September 2014
79%
0%
10%
20%
30%
40%
50%
60%
70%
80%
90%
100%
Ap
r 20
12
May
201
2
Jun
201
2
Jul 2
012
Au
g 20
12
Se
p 20
12
Oct
201
2
Nov
201
2
Dec
201
2
Jan
201
3
Feb
201
3
Mar
20
13
Ap
r 20
13
May
201
3
Jun
201
3
Jul 2
013
Au
g 20
13
Se
p 20
13
Oct
201
3
Nov
201
3
Dec
201
3
Jan
201
4
Feb
201
4
Mar
20
14
Ap
r 20
14
May
201
4
Jun
201
4
Jul 2
014
Au
g 20
14
Se
p 20
14
June
16
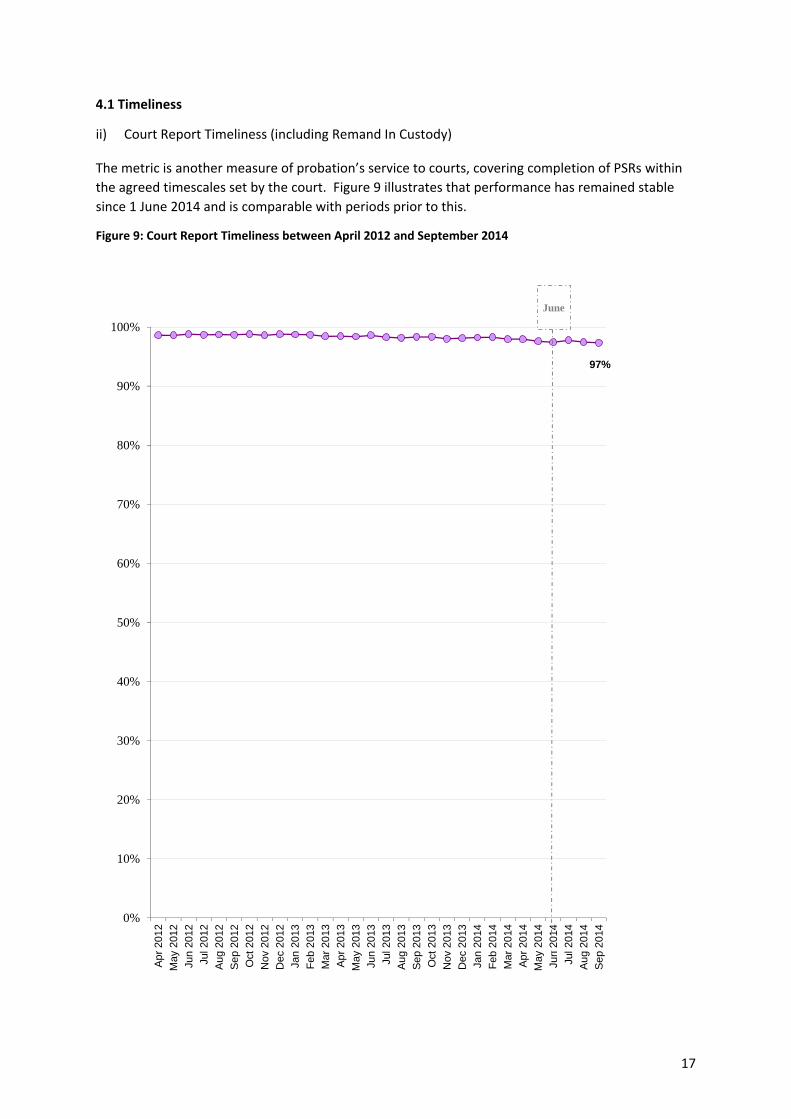
4.1 Timeliness
ii) Court Report Timeliness (including Remand In Custody)
The metric is another measure of probation’s service to courts, covering completion of PSRs within
the agreed timescales set by the court. Figure 9 illustrates that performance has remained stable
since 1 June 2014 and is comparable with periods prior to this.
Figure 9: Court Report Timeliness between April 2012 and September 2014
97%
0%
10%
20%
30%
40%
50%
60%
70%
80%
90%
100%
Ap
r 20
12
May
201
2
Jun
201
2
Jul 2
012
Au
g 20
12
Se
p 20
12
Oct
201
2
Nov
201
2
Dec
201
2
Jan
201
3
Feb
201
3
Mar
20
13
Ap
r 20
13
May
201
3
Jun
201
3
Jul 2
013
Au
g 20
13
Se
p 20
13
Oct
201
3
Nov
201
3
Dec
201
3
Jan
201
4
Feb
201
4
Mar
20
14
Ap
r 20
14
May
201
4
Jun
201
4
Jul 2
014
Au
g 20
14
Se
p 20
14
June
17
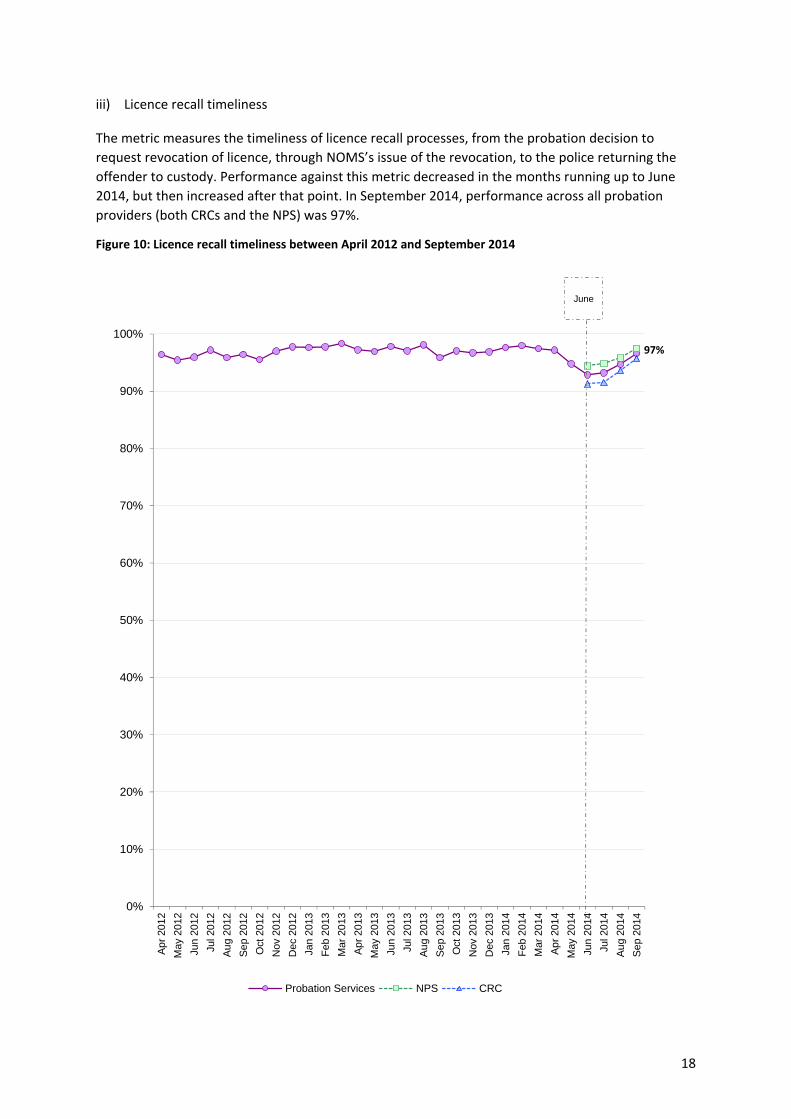
iii) Licence recall timeliness
The metric measures the timeliness of licence recall processes, from the probation decision to
request revocation of licence, through NOMS’s issue of the revocation, to the police returning the
offender to custody. Performance against this metric decreased in the months running up to June
2014, but then increased after that point. In September 2014, performance across all probation
providers (both CRCs and the NPS) was 97%.
Figure 10: Licence recall timeliness between April 2012 and September 2014
97%
0%
10%
20%
30%
40%
50%
60%
70%
80%
90%
100%
Ap
r 20
12
May
201
2
Jun
201
2
Jul 2
012
Au
g 20
12
Se
p 20
12
Oct
201
2
Nov
201
2
Dec
201
2
Jan
201
3
Feb
201
3
Mar
20
13
Ap
r 20
13
May
201
3
Jun
201
3
Jul 2
013
Au
g 20
13
Se
p 20
13
Oct
201
3
Nov
201
3
Dec
201
3
Jan
201
4
Feb
201
4
Mar
20
14
Ap
r 20
14
May
201
4
Jun
201
4
Jul 2
014
Au
g 20
14
Se
p 20
14
Probation Services NPS CRC
June
18

iv) Generic Parole Process – PAROM1 Return timeliness
This metric measures the timeliness of the submission of parole reports by probation as part of the
Generic Parole Process for indeterminate prisoners. Figure 11 shows that from February 2014
onwards there has been a fall in the percentage of PAROM1 forms completed within agreed
timescales.
Figure 11: Percentage of PAROM1 reports sent within timescales between April 2012 and August 201412
83%
0%
10%
20%
30%
40%
50%
60%
70%
80%
90%
100%
Ap
r 20
12
May
201
2
Jun
201
2
Jul 2
012
Au
g 20
12
Se
p 20
12
Oct
201
2
Nov
201
2
Dec
201
2
Jan
201
3
Feb
201
3
Mar
20
13
Ap
r 20
13
May
201
3
Jun
201
3
Jul 2
013
Au
g 20
13
Se
p 20
13
Oct
201
3
Nov
201
3
Dec
201
3
Jan
201
4
Feb
201
4
Mar
20
14
Ap
r 20
14
May
201
4
Jun
201
4
Jul 2
014
Au
g 20
14
June
12 Since this measure is reported one month in arrears, the latest data available is August 2014.
19
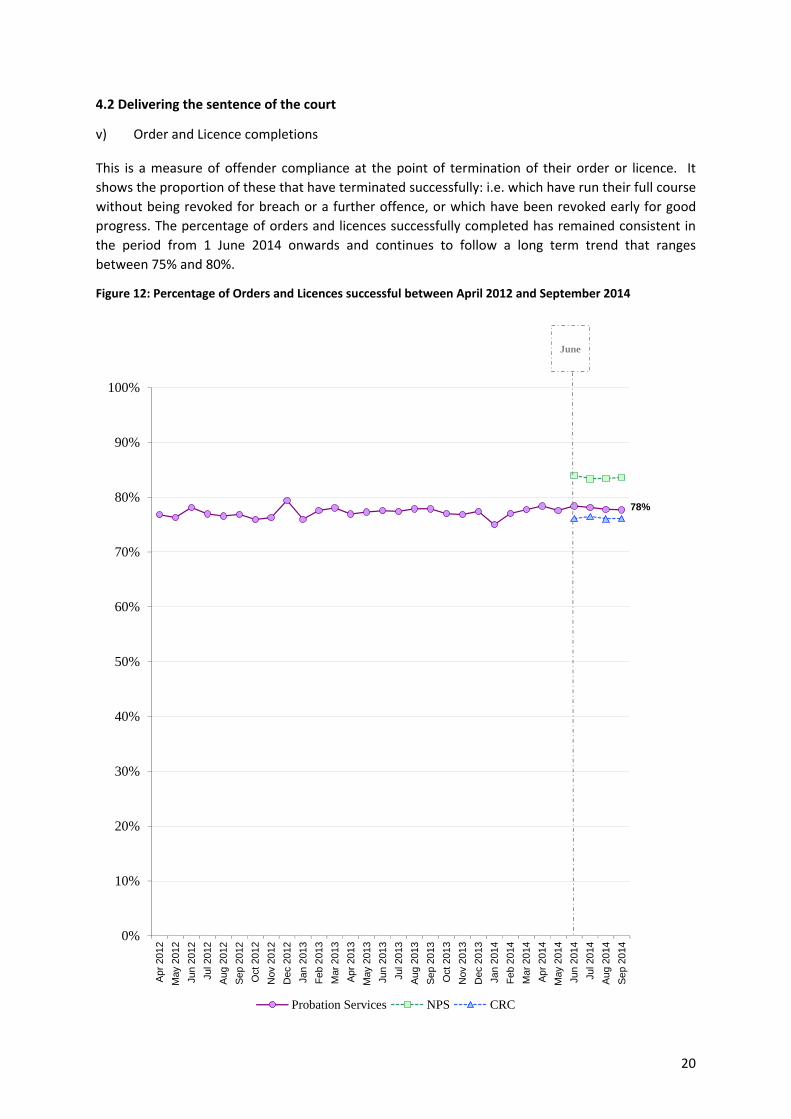
4.2 Delivering the sentence of the court
v) Order and Licence completions
This is a measure of offender compliance at the point of termination of their order or licence. It
shows the proportion of these that have terminated successfully: i.e. which have run their full course
without being revoked for breach or a further offence, or which have been revoked early for good
progress. The percentage of orders and licences successfully completed has remained consistent in
the period from 1 June 2014 onwards and continues to follow a long term trend that ranges
between 75% and 80%.
Figure 12: Percentage of Orders and Licences successful between April 2012 and September 2014
78%
0%
10%
20%
30%
40%
50%
60%
70%
80%
90%
100%
Ap
r 20
12
May
201
2
Jun
201
2
Jul 2
012
Au
g 20
12
Se
p 20
12
Oct
201
2
Nov
201
2
Dec
201
2
Jan
201
3
Feb
201
3
Mar
20
13
Ap
r 20
13
May
201
3
Jun
201
3
Jul 2
013
Au
g 20
13
Se
p 20
13
Oct
201
3
Nov
201
3
Dec
201
3
Jan
201
4
Feb
201
4
Mar
20
14
Ap
r 20
14
May
201
4
Jun
201
4
Jul 2
014
Au
g 20
14
Se
p 20
14
Probation Services NPS CRC
June
20

vi) Employment at termination
The purpose of this metric is to assess the employment status of offenders at the end of their order
or licence to support a reduction in the levels of reoffending.
The percentage of offenders with employment at termination has been on an upward trend for the
past two years. Figure 13 shows that this upward trend has continued since 1 June 2014.
Figure 13: Percentage of offenders in employment at termination of their order or licence between April
2012 and September 2014
56%
0%
10%
20%
30%
40%
50%
60%
70%
80%
90%
100%
Ap
r 2
012
May
201
2
Jun
201
2
Jul 2
012
Au
g 20
12
Se
p-1
2
Oct
201
2
Nov
201
2
Dec
201
2
Jan
201
3
Feb
201
3
Mar
20
13
Ap
r 2
013
May
201
3
Jun
201
3
Jul 2
013
Au
g 20
13
Se
p 20
13
Oct
201
3
Nov
201
3
Dec
201
3
Jan
201
4
Feb
201
4
Mar
20
14
Ap
r 2
014
May
201
4
Jun
201
4
Jul 2
014
Au
g 20
14
Se
p 20
14
Probation Services NPS CRC
June
21

vii) Accommodation at termination
This metric assesses the accommodation status of offenders at the end of their order or licence to
support reduction in levels of reoffending.
Since 1 June 2014 the overall combined performance of CRC and NPS remains consistent with
national performance prior to this date. Figure 14 shows that NPS performance against this measure
has fallen slightly from 85% in June 2014 to 81% in September 2014.
Figure 14: Percentage of offenders in settled or suitable accommodation at termination of their order or
licence between April 2012 and September 2014
86%
0%
10%
20%
30%
40%
50%
60%
70%
80%
90%
100%
Ap
r 20
12
May
201
2
Jun
201
2
Jul 2
012
Au
g 20
12
Se
p 20
12
Oct
201
2
Nov
201
2
Dec
201
2
Jan
201
3
Feb
201
3
Mar
20
13
Ap
r 20
13
May
201
3
Jun
201
3
Jul 2
013
Au
g 20
13
Se
p 20
13
Oct
201
3
Nov
201
3
Dec
201
3
Jan
201
4
Feb
201
4
Mar
20
14
Ap
r 20
14
May
201
4
Jun
201
4
Jul 2
014
Au
g 20
14
Se
p 20
14
Probation Services NPS CRC
June
22

4.3 Completions
Requirements available as part of a sentence served in part or in full in the community can include a range of activities, programmes and interventions. Items viii) – xiii) set out the volumes of such requirements delivered successfully (they do not represent the completion rate). Volumes for each of these requirements need to be considered in the wider context of overall probation caseload, which has decreased in recent years (as shown in Table 11). Changes to the volume or case mix of overall caseloads may affect completion volumes for particular interventions.
Table 11: April snapshot of probation caseload (offenders) for 2012, 2013 and 2014
Date Caseload
National 01/04/2012 236,200
National 01/04/2013 224,300
National 01/04/2014 223,900
viii) Unpaid work
Figure 15 shows the volume of unpaid work completions per month for 2014/15 so far and for the
previous two financial years. The level of monthly completions is unchanged from the start of this
year through to June 2014 and beyond. The overall year on year fall may be attributable to the
decreasing trend in community orders being imposed by the courts.
Figure 15: Number of Unpaid work completions in April 2014 to September 2014 and the previous two years
0
1000
2000
3000
4000
5000
6000
Apr May Jun Jul Aug Sep Oct Nov Dec Jan Feb Mar
2012/13 2013/14 2014/15
ix) Offender Behaviour Programme (OBP) Completions
NOMS currently commissions a number of accredited offending behaviour programmes which are
designed to reduce reoffending by helping offenders to learn new skills that improve the way in
which they think and solve problems: for example by helping them to cope with pressures, to
consider the consequences of their actions, to see things from the perspective of others, and to act
less impulsively.
Figure 16 shows the volume of OBP completions, and illustrates that performance in 2014/15 to
date has been consistent before and after 1 June 2014. There has been a year on year drop to date
between 2013/14 and 2014/15 but this is also apparent between 2012/13 to 2013/14.
23

Figure 16: Number of OBP completions in April 2014 to September 2014 and the previous two years
0
200
400
600
800
1000
1200
1400
Apr May Jun Jul Aug Sep Oct Nov Dec Jan Feb Mar
2012/13 2013/14 2014/15
ix) Sex Offender Treatment Programme Completions
Sex offender treatment programmes aim to reduce reoffending by adult male sex offenders. A range
of programmes are available to meet the level of risk and need of the offender.
The slight downward trend in completions continued after 1 June 2014. However, Figure 17
demonstrates volumes increased in September and are now in line with volumes completed in
September of the previous two years.
Figure 17: Number of SOTP completions in April 2014 to September 2014 and the previous two years
0
50
100
150
200
250
Apr May Jun Jul Aug Sep Oct Nov Dec Jan Feb Mar
2012/13 2013/14 2014/15
x) Domestic Violence Completions
NOMS accredited programmes for domestic violence are programmes targeted at men who are or
were in heterosexual relationships at the time the offence was committed. They aim to reduce
aggressive behaviour through teaching social skills, emotional management techniques and
challenging attitudes and beliefs to help change behaviour.
The volume of domestic violence completions in 2014/15 is comparable and in line with the last two
years. Figure 18 shows volumes of domestic violence programme completions, and indicates that
there has been not notable change in delivery since 1 June 2014.
24

Figure 18: Number of Domestic Violence completions in April 2014 to September 2014 and the previous
years
0
100
200
300
400
500
600
700
800
Apr May Jun Jul Aug Sep Oct Nov Dec Jan Feb Mar
2012/13 2013/14 2014/15
xi) Drug Rehabilitation Requirement Completions
The drug rehabilitation requirement (DRR) is the primary means for offenders serving sentences in
the community to address identified drug misuse. The DRR is an intensive vehicle for tackling drug
misuse and offending of many of the most serious and persistent drug misusing offenders.
Figure 19 shows volumes of DRR programme completions, and shows that the monthly completions
of DRRs in 2014/15 followed the trend in 2013/14, with the exception of May.
Figure 19: Number of DRR completions in April 2014 to September 2014 and the previous years
0
100
200
300
400
500
600
700
Apr May Jun Jul Aug Sep Oct Nov Dec Jan Feb Mar
2012/13 2013/14 2014/15
xii) Alcohol Treatment Requirement Completions
The alcohol treatment requirement (ATR) provides access to a tailored treatment programme with
the aim of reducing or eliminating alcohol dependency and is targeted at offenders with the most
25

serious alcohol misuse and offending who require intensive, specialist, care‐planned treatment and
integrated care involving a range of agencies.
Similarly to the performance delivery of DRR completions, the delivery of ATR completions in
2014/15 to date follows the same seasonal trend, with the exception of May, as 2013/14 as shown
in Figure 20.
Figure 20: Number of ATR completions in April 2014 to September 2014 and the previous years
0
100
200
300
400
500
600
Apr May Jun Jul Aug Sep Oct Nov Dec Jan Feb Mar
2012/13 2013/14 2014/15
26

Section 5 – New processes: risk assessment and case allocation
As part of the allocation process, NPS staff use a new additional tool that was introduced from June 2014 onwards to assess how likely offenders are to commit a seriously harmful re‐offence within the next 2 years, based on a Risk of Serious Recidivism (RSR) measure. The RSR tool is primarily based on static factors but can include dynamic factors too. This tool supplements the existing, wider risk assessment process, involving a risk of serious harm screening and the professional judgment of the member of NPS staff carrying out the allocation, which is used to assess the level of risk of serious harm to inform the allocation decision. This section sets out information on the completion of the new RSR tool and on timeliness of allocation decisions. 5.1 Recording of RSR assessment
Figure 21 shows, for each week independently, the proportion of offenders for whom an RSR
assessment was recorded on the nDelius case management system. Each weekly figure is
independent, not cumulative. Where an RSR assessment has been fully completed but not recorded
on nDelius, it will not appear in these figures.
Figure 21 shows that since 15 September 2014, the proportion of offenders for whom an RSR
assessment was completed and recorded on nDelius has increased from 46% to 57%.
5.2 Case Allocation to CRCs
Figure 22 shows, for each week independently, the timeliness of NPS allocation decisions to CRCs.
The NPS remains responsible for managing offenders unless and until they are allocated to a CRC.
Figure 22 shows that for the week commencing 20 October, 82% of cases allocated to CRCs were
allocated by the end of the second full working day following the date of sentence. 65% of cases
27

allocated to CRCs were allocated by the end of the next full working day following the date of
sentence. Both these measures have seen an upward trend since 1 June.
For the avoidance of doubt, a case sentenced at any time on 16 January which was allocated at any
time on 17 January would count as allocated by the end of the next full working day.
28

29
Contact points for further information
Press enquiries should be directed to the Ministry of Justice press office: Tel: 020 3334 3536
Other enquiries about these statistics should be directed to:
Sandy Rass Planning and Analysis Group National Offender Management Services Red Zone, 5th Floor Clive House 70 Petty France London SW1H 9EX
General enquiries about the statistical work of the Ministry of Justice can be e‐mailed to: [email protected] General information about the official statistics system of the UK is available from www.statistics.gov.uk
© Crown copyright Produced by the Ministry of Justice
Alternative formats are available on request from [email protected]