management in plastics processing - tangram management in plastics... · possible to be ‘green’...
TRANSCRIPT

Energy
Management
in Plastics
Processing
A Signposting
Guide by
The British
Plastics
Federation
Written By
Dr Robin Kent Sponsored by
ENERGY MANAGEMENT IN PLASTICS PROCESSINGENERGY MANAGEMENT IN PLASTICS PROCESSINGENERGY MANAGEMENT IN PLASTICS PROCESSINGENERGY MANAGEMENT IN PLASTICS PROCESSING 2
Energy Management in Plastics Processing
Signposting Guide
Foreword
This Guide has been commissioned by the British Plastics Federation in order to assist
companies in meeting energy efficiency targets associated with the Federation’s Climate
Change Agreement. It is brought to you by BPF Energy the company managing the
Agreement.
This guide has been designed as a starting point for companies looking at reducing their
energy usage and will provide companies with an initial list of projects and actions to
take.
For a more detailed guide, the BPF commissioned ‘Controlling Energy Use in Plastics
Processing’ (also written by energy expert Dr Robin Kent) is available free of charge to
all BPF Members and companies taking part in the Federation’s Climate Change
Agreement.
Peter Davis
Director-General
British Plastics Federation
Introduction
This guide is designed to provide British plastics processors with a ‘first primer’ in
energy management. It gives the first actions that processors should take to reduce
energy use and associated costs. Using this guide, plastics processors should be able to
review their operations and take some basic actions to reduce their energy use.
This guide is not an exhaustive list of projects or actions, it is designed to stimulate
companies to action. A more comprehensive list of projects is given in the larger BPF
Energy publication ’Controlling energy in plastics processing’ (available from the BPF -
www.bpf.co.uk) and it is recommended that companies obtain a copy of this.
Energy management is potentially one of the most cost-effective actions that a
company can take to reduce both carbon emissions and costs. There is no conflict,
improving environmental performance and reducing costs are synergistic. It is not only
possible to be ‘green’ and save money, becoming ‘green’ almost always reduces costs.
Dr Robin Kent
Tangram Technology Ltd.
Hitchin
August 2011
Note:
Whilst all reasonable steps have been taken to ensure that the information contained within this guide is correct, the
content is necessarily general in nature.
Accordingly, BPF Energy and Tangram Technology Ltd. can make no warranties or representations of any kind as to
the content of this guide and, to the maximum extent permitted by law, accept no liability whatsoever for the same
including without limit, for direct, indirect or consequential loss, business interruption, loss of profits, production,
contracts, goodwill or anticipated savings.
Any person making use of this guide does so at their own risk.
© BPF Energy 2011 (Issue 1).

ENERGY MANAGEMENT IN PLASTICS PROCESSING ENERGY MANAGEMENT IN PLASTICS PROCESSING ENERGY MANAGEMENT IN PLASTICS PROCESSING ENERGY MANAGEMENT IN PLASTICS PROCESSING 3
Energy management
Why do we need energy management?
Energy costs are rising and there is no reason to believe that they will decrease in the
future. This is driven by factors such as:
• Increasing use of taxation and other financial instruments.
• Increasing supply and distribution shortages.
• Decreasing security of supply.
• Increasing importance of environmental issues and the public perception of these.
• Increasing importance of corporate social responsibility.
For many plastics processing sites, energy costs are approaching the cost of direct
labour and energy costs are almost always higher than the actual profits of the site.
Experience shows that for typical sites, where little action has been taken in the past,
over 30% of the energy use is ‘discretionary’ - this means that the cost is incurred
because the site management has either decided to take no action or because it has not
recognised the opportunities for improvement. In most cases, energy use and costs can
be reduced by over 30% and these savings add directly to the site profits.
Where are the savings?
Energy costs can be reduced by:
• Management actions that typically cost less than
£1,000.
• Maintenance actions that typically cost less than
£1,000.
• Capital investment actions that typically cost
more than £1,000.
What are the returns?
The returns from energy management actions are quick, certain and need only internal
effort. The payback for almost all management and maintenance actions is 6-9 months
and for almost all capital investment actions is less than 4 years.
The returns from energy management are much better than the returns from increasing
sales.
What do we need to start?
Implementing energy management requires an energy management system and this
must cover:
• The company energy policy.
• Performance assessment.
• Targets for short and long-term performance.
• Reporting - Systems must show results to get resources.
• Auditing.

ENERGY MANAGEMENT IN PLASTICS PROCESSINGENERGY MANAGEMENT IN PLASTICS PROCESSINGENERGY MANAGEMENT IN PLASTICS PROCESSINGENERGY MANAGEMENT IN PLASTICS PROCESSING 4
Base and variable loads Energy management requires both measurements and an understanding of the process.
The measurements are very simple to obtain and can come from most standard
accounts packages.
The measurements need very little treatment to give vital information on the site and
process operations.
Energy use is not fixed and uncontrollable, it is variable and controllable and is directly
related to the production volume of the site.
The Performance Characteristic Line (PCL)
The basic information is the Performance Characteristic Line (PCL).
Get energy and production volume data
for at least 12 months. Use a
spreadsheet to plot the energy use for
the month (kWh) versus the production
volume for the month (kg) as a scatter
chart and use the same spreadsheet to
insert a linear best fit trend line to
generate to PCL.
The equation for the PCL gives the ‘base’
and the ‘process’ loads of the site and
the correlation coefficient (R2) indicates
how well the PCL fits the data.
The base load
The base load of a site is the intersection of the best fit line with the vertical axis. It is
the ‘energy overhead’ and for plastics processing will range between 20 and 40% of the
total load of the site.
A low base load generally indicates good management control of energy at the site and
a high base load generally indicates poor management control of energy at the site.
Reducing the base load is easy to carry out, low cost and has rapid payback. Savings in
the base load are very profitable because the base load is largely a dead weight that is
unrelated to production output.
The process load
The process load of a site is the slope of the best fit line and is the energy needed to
run the process. Reducing the process load is more difficult to achieve because it
generally (but not always) requires more fundamental process improvements. The
process load depends on the type of process being used at the site.
Typical process loads are:
• Injection moulding: 0.9 to 1.6 kWh/kg.
• Extrusion: 0.4 to 0.6 kWh/kg.
• Extrusion blow moulding: 2.0 to 2.6 kWh/kg.
Base and variable loads (injection moulding)
kWh = 1.5751 x Production volume + 152,440
R2 = 0.9397
0
100,000
200,000
300,000
400,000
500,000
600,000
700,000
800,000
0 50,000 100,000 150,000 200,000 250,000 300,000 350,000 400,000
Production volume (kg)
En
erg
y u
se (
kW
h)
Base load = Intersection with axis = 152,440 kWh
Process load = Slope of line = 1.5751 kWh/kg
Correlation coefficient = 0.9397
ENERGY MANAGEMENT IN PLASTICS PROCESSING ENERGY MANAGEMENT IN PLASTICS PROCESSING ENERGY MANAGEMENT IN PLASTICS PROCESSING ENERGY MANAGEMENT IN PLASTICS PROCESSING 5
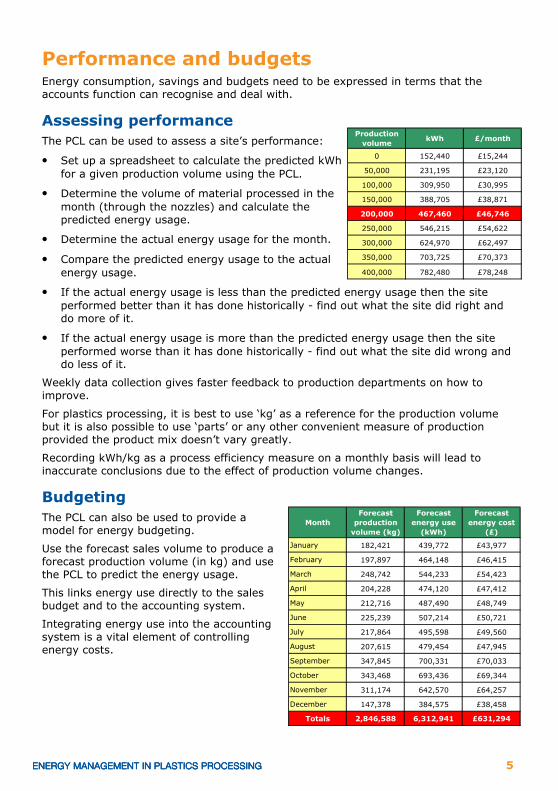
Performance and budgets Energy consumption, savings and budgets need to be expressed in terms that the
accounts function can recognise and deal with.
Assessing performance
The PCL can be used to assess a site’s performance:
• Set up a spreadsheet to calculate the predicted kWh
for a given production volume using the PCL.
• Determine the volume of material processed in the
month (through the nozzles) and calculate the
predicted energy usage.
• Determine the actual energy usage for the month.
• Compare the predicted energy usage to the actual
energy usage.
• If the actual energy usage is less than the predicted energy usage then the site
performed better than it has done historically - find out what the site did right and
do more of it.
• If the actual energy usage is more than the predicted energy usage then the site
performed worse than it has done historically - find out what the site did wrong and
do less of it.
Weekly data collection gives faster feedback to production departments on how to
improve.
For plastics processing, it is best to use ‘kg’ as a reference for the production volume
but it is also possible to use ‘parts’ or any other convenient measure of production
provided the product mix doesn’t vary greatly.
Recording kWh/kg as a process efficiency measure on a monthly basis will lead to
inaccurate conclusions due to the effect of production volume changes.
Budgeting
The PCL can also be used to provide a
model for energy budgeting.
Use the forecast sales volume to produce a
forecast production volume (in kg) and use
the PCL to predict the energy usage.
This links energy use directly to the sales
budget and to the accounting system.
Integrating energy use into the accounting
system is a vital element of controlling
energy costs.
Production
volumekWh £/month
0 152,440 £15,244
50,000 231,195 £23,120
100,000 309,950 £30,995
150,000 388,705 £38,871
200,000 467,460 £46,746
250,000 546,215 £54,622
300,000 624,970 £62,497
350,000 703,725 £70,373
400,000 782,480 £78,248
Month
Forecast
production
volume (kg)
Forecast
energy use
(kWh)
Forecast
energy cost
(£)
January 182,421 439,772 £43,977
February 197,897 464,148 £46,415
March 248,742 544,233 £54,423
April 204,228 474,120 £47,412
May 212,716 487,490 £48,749
June 225,239 507,214 £50,721
July 217,864 495,598 £49,560
August 207,615 479,454 £47,945
September 347,845 700,331 £70,033
October 343,468 693,436 £69,344
November 311,174 642,570 £64,257
December 147,378 384,575 £38,458
Totals 2,846,588 6,312,941 £631,294

ENERGY MANAGEMENT IN PLASTICS PROCESSINGENERGY MANAGEMENT IN PLASTICS PROCESSINGENERGY MANAGEMENT IN PLASTICS PROCESSINGENERGY MANAGEMENT IN PLASTICS PROCESSING 6
Monitoring and targeting
Targeting and cost drivers
Monitoring and targeting is used to set targets based on the PCL of the site. Simply
assessing performance provides an incentive for improvement but setting targets
provides a better incentive for improvement.
Targets can be set on the basis of simple charts, e.g. CUSUM charts are very sensitive
to changes in performance and a ‘challenging but achievable’ performance target can be
set from the data used to generate the PCL. This is based on the best possible historic
performance of the site.
Targeting energy use needs an understanding of what drives energy use. Energy use
can be ‘activity’ driven (by production volume) or ‘condition’ driven (generally by the
weather). Measuring and understanding the relevant cost drivers allows cost
assignment to the relevant areas and ownership of the costs can be created.
Energy costs are not ‘somebody else’s problem’ and assigning ownership is often the
quickest way to reduce costs.
Reporting
Energy management needs a formal reporting structure to ensure that targets are met
and translated into real financial performance improvements.
To be effective, reporting must:
• Be regular - ideally part of the monthly management accounts for management
purposes and posted on notice boards for all staff to see.
• Be concise and effective - reports should fit onto 1 A4 page at most.
• Be suitable for the audience - simple graphs are the key to attracting and retaining
the audience’s attention.
• Be focused on real improvements in performance and the financial implications.
External targets (sites and machines)
Targets based on external benchmarking at the site level are possible using industry
data but the results are only relevant for a specific process and production rate.
Targets based on external benchmarking at the machine level are possible using
industry data but the results are only relevant for a specific process and production
rate.
Investment decisions
Investment in improving energy usage performance can change the rules of energy use
and make energy cost reduction automatic.
Investment in improving energy efficiency is often neglected because of the lack of a
recognisable income stream from the investment.
Investment in capital equipment should consider the whole life cycle of the equipment
and particularly the energy costs over the life cycle.

ENERGY MANAGEMENT IN PLASTICS PROCESSING ENERGY MANAGEMENT IN PLASTICS PROCESSING ENERGY MANAGEMENT IN PLASTICS PROCESSING ENERGY MANAGEMENT IN PLASTICS PROCESSING 7
Power supply
Understanding billing information
Understanding the energy consumption (electricity or gas) is a key task in energy
management and many companies do not understand how to read their bill or fail to do
so. Simply knowing how to read energy bills can save money by revealing areas for
potential cost reduction.
Actions to take are:
• Learn how to read the energy bills. Contact the supplier if in doubt about any
elements of the bill.
• Read and check the energy bills every month. Bills are not always correct and often
contain errors.
• Record energy billing data in a spreadsheet every month.
• Cross-check the energy billing data with manual reading of the relevant meters.
• Make the person responsible for energy use (generally the Production Manager)
responsible for signing off the energy bills each month.
Energy costs are often in the region of 8% of production costs and most companies do
not spend enough time looking at the bills.
Available capacity and maximum demand
The Available Capacity is the amount of power that a site is allowed to draw from the
supply network (in kVA). This is a set amount and is the limit of power that can be
drawn without penalty charges being applied.
The Maximum Demand is the actual monthly maximum power drawn from the network.
If the Available Capacity is too high there will be high fixed monthly charges and if the
Available Capacity is too low there will be penalty charges.
Setting the correct Available Capacity is a strategic decision for management.
Power factor correction
The power factor (or cos φ) is the ratio of ‘useful power’ to ‘apparent power’.
A low power factor increases losses and improving the power factor with Power Factor
Correction (PFC) equipment will reduce the maximum demand (in kW) and allow
reductions in the Available Capacity.
Interval data
Most sites will have a recording meter and ½-hour data should be available from the
supplier. This is a vital tool and simple plots of energy use versus time will reveal
abnormal events and allow these to be investigated.
Energy mapping
An ‘energy map’ of a site is easily prepared and will show where most of the energy is
being used at a site. This is often not where it is expected to be! The ‘energy map’ can
be used to target efforts to the most rewarding areas and to decide on sub-metering
arrangements.
ENERGY MANAGEMENT IN PLASTICS PROCESSINGENERGY MANAGEMENT IN PLASTICS PROCESSINGENERGY MANAGEMENT IN PLASTICS PROCESSINGENERGY MANAGEMENT IN PLASTICS PROCESSING 8
Motor management
Motor management policy and motor register
Motors are the largest energy user in most plastics processing and motor management
is a necessity for modern plastics processing.
Sites should create a simple Motor Management policy and decision matrix for the
purchase and maintenance of all electric motors that covers:
• Repair and replacement based on lifetime costing.
• Specification of high efficiency motors for all new motors.
• A ‘rewind’ policy (rewound electric motors are less efficient).
• A ‘motor register’ to manage the motors on the site.
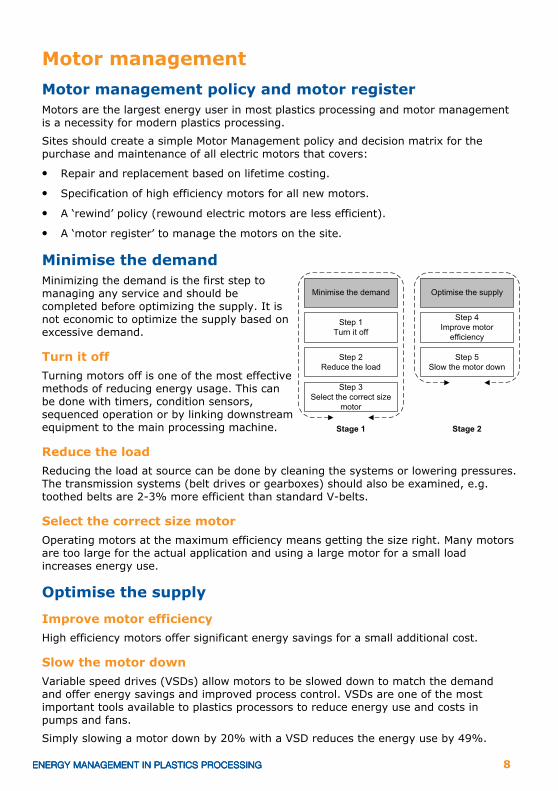
Minimise the demand
Minimizing the demand is the first step to
managing any service and should be
completed before optimizing the supply. It is
not economic to optimize the supply based on
excessive demand.
Turn it off
Turning motors off is one of the most effective
methods of reducing energy usage. This can
be done with timers, condition sensors,
sequenced operation or by linking downstream
equipment to the main processing machine.
Reduce the load
Reducing the load at source can be done by cleaning the systems or lowering pressures.
The transmission systems (belt drives or gearboxes) should also be examined, e.g.
toothed belts are 2-3% more efficient than standard V-belts.
Select the correct size motor
Operating motors at the maximum efficiency means getting the size right. Many motors
are too large for the actual application and using a large motor for a small load
increases energy use.
Optimise the supply
Improve motor efficiency
High efficiency motors offer significant energy savings for a small additional cost.
Slow the motor down
Variable speed drives (VSDs) allow motors to be slowed down to match the demand
and offer energy savings and improved process control. VSDs are one of the most
important tools available to plastics processors to reduce energy use and costs in
pumps and fans.
Simply slowing a motor down by 20% with a VSD reduces the energy use by 49%.

ENERGY MANAGEMENT IN PLASTICS PROCESSING ENERGY MANAGEMENT IN PLASTICS PROCESSING ENERGY MANAGEMENT IN PLASTICS PROCESSING ENERGY MANAGEMENT IN PLASTICS PROCESSING 9
Compressed air management Compressed air is NOT free, it is a very expensive resource. In most sites, compressed
air is approximately 10% of the total energy use.
Minimise the demand
Reduce leakage
Compressed air leakage is an avoidable waste.
In the average site, leaks use from 20-40% of
the compressed air generated.
Leaks are very expensive and a 3mm
diameter hole @ 7 bar can cost up to £1,500/
year in lost air. A ‘rule of thumb’ is that if you
can hear a compressed air leak in a quiet site
then it is costing more than £200/year.
Implement a regular check of all systems and
consider purchasing an ultrasonic detector to
find leaks at noisy sites.
A compressed air map of the site is a vital tool to locate leaks and poor usage. Map
where compressed air goes and how it is used.
Reduce usage
Compressed air usage should be reduced by using other means of power where
possible. Almost any other method of doing a job will be cheaper than using
compressed air. Areas to examine are:
• Robots using compressed air to provide vacuum.
• Assembly areas with bowl feeders and air lines for product movement.
• Air-operated power tools which cost 10 times more than direct electric drives to
operate.
Optimise the supply
Reduce generation costs
Feeding cold air to the compressor inlet will reduce the cost of compressing the air (it is
already more dense).
Compressed air costs can be reduced by reducing the system pressure to the minimum
required to actually operate the process.
Consider purchasing a VSD compressor to dramatically reduce generation costs.
Reduce treatment costs
Compressed air treatment is expensive and the bulk of air should be treated to the
minimum quality necessary, e.g. 40-micron filters are usually sufficient. Filters should
be tested regularly to make sure that the pressure drop does not exceed 0.4 bar and
electronic condensate traps should be used instead of manual condensate traps.
Improve distribution
A ring main and good smooth bore piping should be used to reduce distribution costs.

ENERGY MANAGEMENT IN PLASTICS PROCESSINGENERGY MANAGEMENT IN PLASTICS PROCESSINGENERGY MANAGEMENT IN PLASTICS PROCESSINGENERGY MANAGEMENT IN PLASTICS PROCESSING 10
Cooling water management Cooling water (chilled and cool) is a major hidden cost for plastics processors and in
most sites, cooling water air is approximately 10-15% of the total energy use.
Minimise the demand
Reduce heat gains
Insulate chilled water piping wherever possible
to reduce parasitic heat gains. The
temperature that counts is the temperature at
the point of application not the temperature at
the point of generation.
Good insulation reduces parasitic heat gains
and allows increased generation temperatures
with no effect on the process. Typically
insulation projects will have a payback of less than 1 year.
If you can see condensation on pipes during summer then it is obvious that there is a
need for insulation on the piping.
Increase temperatures
Increasing water temperatures will reduce energy costs. For a chiller system (chillers
are basically compressors), a 1°C increase in the flow temperature will decrease the
generation costs by ≈ 3%.
Sites should find out what the flow temperatures are and ask why they are set at this
level. Increasing the flow temperature by 4°C will decrease chiller operating costs by >
10%.
Optimise the supply
Reduce cooling costs
For cooling water (16°C to 30°C), cooling towers are widely used and offer good
opportunities for energy saving through low-cost actions such as VSDs for fan control.
The total cost of cooling when using cooling towers is often increased substantially
because of the need for Legionella controls. Many modern sites use air blast or free
cooling to remove the need for cooling towers and the associated testing.
For chilled water (5°C to 16°C), chillers are almost always used to produce the chilled
water. If the flow temperatures are high enough (> 12°C) it is possible to use air blast
or free cooling to act as pre-cooling for the return water. In this case, when the
external temperature is < 9°C the pre-cooler will provide the complete cooling load and
the chiller will not operate. This arrangement will reduce cooling costs dramatically and
have a payback of less than 2 years.
Reduce distribution costs
Most sites use fixed speed pumps for distribution of the cooling and chilled water. This
is a perfect application for VSDs. A VSD can be used to control the speed of the pump
based on the temperature of the return water from the process - as the water gets
warmer the pump slows down to adjust to the needs of the process. VSDs in this type
of application often generate paybacks of less than 6 months.
ENERGY MANAGEMENT IN PLASTICS PROCESSING ENERGY MANAGEMENT IN PLASTICS PROCESSING ENERGY MANAGEMENT IN PLASTICS PROCESSING ENERGY MANAGEMENT IN PLASTICS PROCESSING 11
General processing
Everything is more efficient
Plastic processing technology is rapidly improving in energy efficiency and old machines
are inevitably less energy efficient than new machines. Processors using old machinery
are not saving money, they are paying more to run their process than their competitors
and they may well be putting themselves at a permanent cost disadvantage.
Compared to the machines available in 1996, modern machines are at least 20% more
energy efficient and in the case of injection moulding machines where all-electric
machines are the new technology the new machines are up to 60% more efficient than
the standard 1996 hydraulic machine.
There is no conflict!
Most processing methods offer significant opportunities for energy management and
energy efficiency improvements and it is important for processors to understand that
there is no conflict between energy efficiency and productivity - both can be achieved.
In fact, increasing the production rate of most plastics machinery decreases the kWh/kg
because the base load of the machine is amortised into a greater process load.
Specifying new machines
When considering purchasing new machines, sites need to consider the ‘whole life cost’
of the machine rather than the simple ‘initial cost’.
The cost of operating a machine over a 10-year life will always be greater than the
initial purchase cost. In addition, this cost will increase as energy prices increase - a
cheap ‘initial cost’ machine can easily be the most expensive machine over a 10-year
life.
Specifiers should look particularly for large motors that are not used to their design
specification on small machines.
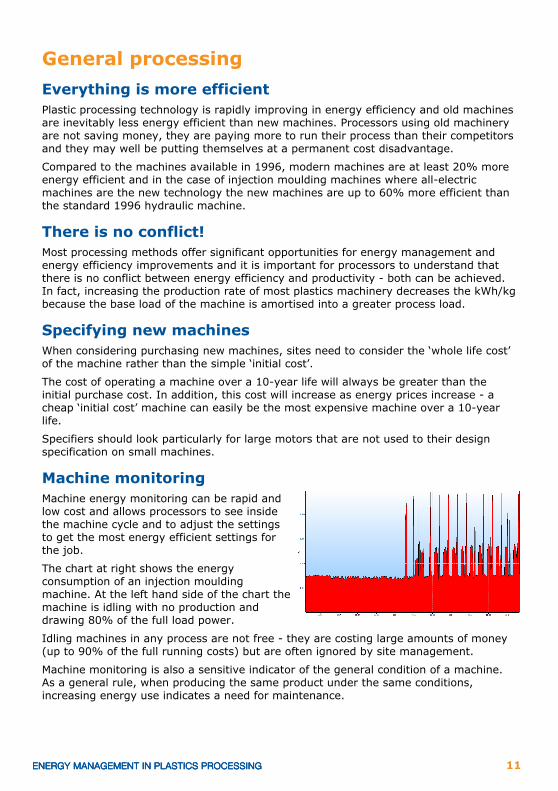
Machine monitoring
Machine energy monitoring can be rapid and
low cost and allows processors to see inside
the machine cycle and to adjust the settings
to get the most energy efficient settings for
the job.
The chart at right shows the energy
consumption of an injection moulding
machine. At the left hand side of the chart the
machine is idling with no production and
drawing 80% of the full load power.
Idling machines in any process are not free - they are costing large amounts of money
(up to 90% of the full running costs) but are often ignored by site management.
Machine monitoring is also a sensitive indicator of the general condition of a machine.
As a general rule, when producing the same product under the same conditions,
increasing energy use indicates a need for maintenance.

ENERGY MANAGEMENT IN PLASTICS PROCESSINGENERGY MANAGEMENT IN PLASTICS PROCESSINGENERGY MANAGEMENT IN PLASTICS PROCESSINGENERGY MANAGEMENT IN PLASTICS PROCESSING 12
Injection moulding
Get the right machine
Always check that the machine is right for the job. Large machines making small
products are energy inefficient and will increase costs. For some smaller machines the
use of accumulators can reduce transient power requirements.
Process setting and controls
Process setting is the key to energy efficiency in injection moulding. Optimised process
settings will increase productivity and reduce energy use.
Barrel heating and insulation
Barrel heating in injection moulding machines is a major energy user and the energy
use can easily be reduced by fitting barrel insulation. Barrel insulation will reduce
energy use in heating with payback periods of around 1 year. Barrel insulation also
reduces Health and Safety concerns with hot surfaces. At sites which also use air
conditioning, barrel insulation will also reduce the air conditioning energy use.
Even if barrel insulation is not used it is essential that barrel heaters are ‘bedded-in’ and
use a conductive metal compound between the heater and the barrel for good heat
transfer. Sites should also ensure that barrel heater thermostats are accurate and can
control the heater.
All-electric machines
Injection moulding machines have made a huge leap in efficiency with the introduction
of all-electric machines and these can give processors a permanent advantage over
competitors using conventional hydraulic machines. All-electric machines not only use
up to 60% less energy in operation but also have lower standing losses, are easier to
maintain and are more accurate in operation.
Retro-fitting VSDs
Retro-fitting VSDs to hydraulic machines is very cost effective if the machine
parameters are right. VSDs will save energy by slowing down or stopping the hydraulic
motor when the cycle does not need it. Investigate if the machines are suitable (large
fixed displacement motors, long cycle times and long operating hours).
Mould temperature controllers
Mould temperature controllers (MTCs) are a hidden cost in injection moulding and the
need to use them should be examined carefully. Insulate piping between MTCs and
tooling to reduce parasitic heat gains or losses.
Mould design
Initial mould design can affect energy use and designers need to be aware of the cost
of their decisions. Areas to look at are:
• Investigate ‘conformal cooling’ to reduce cooling times and energy use.
• Minimise sprue and runner sizes to minimise the material processed in the cycle.
Sprues and runners are not free even if they are regranulated.
• Handling systems should operate ‘on-demand’ and use gravity if possible. It is free.

ENERGY MANAGEMENT IN PLASTICS PROCESSING ENERGY MANAGEMENT IN PLASTICS PROCESSING ENERGY MANAGEMENT IN PLASTICS PROCESSING ENERGY MANAGEMENT IN PLASTICS PROCESSING 13
Extrusion
Get the right machine
As with injection moulding, using large extruders for small profiles wastes energy and
costs money. It is often possible to switch extruder motors to match the size of the job.
This is sometimes a cost-effective operation if the cost of changing the motor is less
than the extra energy used.
AC motors and VSDs
Extrusion costs can be reduced by replacing DC motors with high efficiency AC motors
and VSDs.
The energy savings will be in the region of 4% but the main advantages are the
increased reliability, decreased maintenance load and ease of motor replacement.
Motor sizing
Check the loading on extruder motors and modify gear ratios to optimise the energy
usage. Extruder motor gear ratios can be managed to optimise the motor load and
maximise energy efficiency.
Where belt drives are used then replacing the standard V-belt drives with toothed belts
can give 2-3% energy savings.
Insulation
Barrel insulation in extrusion is not generally needed and can lead to a ‘runaway
process’ because shear heating should supply most of the heating load. Shear heating
is also much more energy efficient than electrically applied heating. In most cases,
extruders will need barrel blowers to remove excess shear heat generated. It is
important to check the heating and cooling controls to make sure that heating and
blowing are not fighting one another.
Insulation is cost effective in areas where shear heating is low such as the first zone
where the incoming material absorbs a lot of heat and for most areas forward of the
screw tips where there is little shear heating. Areas forward of the screw tips suitable
for insulation include:
• Transfer pipes from secondary to primary extruders.
• Hot oil pipes.
• Melt pumps and filters.
• Dies.
Downstream equipment
For profile extrusion using vacuum calibration, the vacuum tanks should be regularly
checked for seal efficiency and the vacuum pumps should be fitted with VSDs to control
the amount of vacuum generated.
For sheet extrusion the method of treating any edge trim should be carefully examined.
For blown film extrusion the fans for the chilling bubble should be VSD controlled to
give energy savings and improved control.

ENERGY MANAGEMENT IN PLASTICS PROCESSINGENERGY MANAGEMENT IN PLASTICS PROCESSINGENERGY MANAGEMENT IN PLASTICS PROCESSINGENERGY MANAGEMENT IN PLASTICS PROCESSING 14
Injection and extrusion blow moulding Injection and extrusion blow moulding are similar to standard injection and extrusion
and many of the actions listed for injection moulding and extrusion should be carried
out.
All-electric machines
All-electric machines are now available for both injection and extrusion blow moulding.
These have all the benefits of all-electric injection moulding machines and can reduce
energy use significantly.
Barrel insulation
Shear heating in blow moulding does not contribute greatly to the heat input to the
melt and barrel insulation can be very profitable for both injection and extrusion blow
moulding.
Melt temperature
Cooling is a major part of the cycle time for both types of blow moulding and a major
energy use (at the chillers). Minimising the melt temperature to the minimum needed
will reduce the cooling demand and will improve both cycle times and energy use.
Parison control
Good parison control in extrusion blow moulding will improve product quality, process
efficiency and reduce energy use. Investment in improved parison control will have a
good payback.
Compressed air
The blowing step is a large user of compressed air in both injection and extrusion blow
moulding and good compressed air management is vital, particularly for injection blow
moulding of PET pre-forms where the compressed air pressure is generally much higher
(40 bar).
Actions to take are:
• Minimise the blowing pressure to just enough to get full blowing.
• Reduce compressed air pressures when holding after initial blowing.
• Use compressed air recovery systems to recover the high-pressure air (40 bar) for
use in the low-pressure (7 bar) system.
Tops and tails
Tops and tails management is a key energy issue in extrusion blow moulding. The
material from the tops and tails may be recycled but the energy and production
capacity is lost forever. Setters should be given targets for tops and tails (< 20% by
weight) and machines should not be released for production until this target is
achieved.
Recrystallization
Recrystallization of regrind from PET pre-forms or mouldings can be combined with
drying through the use of infra-red drying to give good energy savings.

ENERGY MANAGEMENT IN PLASTICS PROCESSING ENERGY MANAGEMENT IN PLASTICS PROCESSING ENERGY MANAGEMENT IN PLASTICS PROCESSING ENERGY MANAGEMENT IN PLASTICS PROCESSING 15
Thermoforming Extrusion is a first stage of thermoforming and processors should carry out the actions
listed for extrusion. This section only considers the thermoforming process from sheet
(either from roll or in-line).
Pre-warming ovens
Where pre-warming ovens are used these should be well sealed and insulated to
prevent excessive heat losses. Examination with a thermal camera will quickly reveal
degraded seals and areas of heat leakage.
Minimising the distance between the pre-warming oven and the actual thermoformer
will minimise heat losses.
Insulation and seals
Primary heating ovens should be well sealed and insulated.
Entrances and exits
Minimising the size of entrances and exits on pre-warming and primary ovens will
minimise heat losses. If the sheet being warmed is only 0.5 mm thick then the entrance
and exit gaps do not have to be more than 4 mm.
Heater banks
Thermoformer heater banks should use heating elements that match the emissivity of
the heater to the absorption of the material.
Heaters should be kept clean to ensure good emissivity at the right wavelength for the
material.
Catalytic flameless gas heaters are a new technology that can remove the need to
electric heating of the sheet.
Heater banks should be sealed and insulated where possible to reduce heat losses from
radiation, convection and conduction.
Cooling
Cooling is often a limiting factor in cycle times and the sheet temperature should be the
minimum required for good forming.
Web handling
Thermoforming generates a large amount of web waste that is reground and recycled.
The regrinders and blowers should be linked to the thermoformer operation so that they
stop operating when the thermoformer is not producing.

ENERGY MANAGEMENT IN PLASTICS PROCESSINGENERGY MANAGEMENT IN PLASTICS PROCESSINGENERGY MANAGEMENT IN PLASTICS PROCESSINGENERGY MANAGEMENT IN PLASTICS PROCESSING 16
Rotational moulding
Gas use data
Rotational moulding is the one plastics processing method where gas use is higher than
electricity use. It is possible to create a Performance Characteristic Line (PCL) for both
electricity and gas use for rotational moulding and these can be combined to give a
total PCL for the site.
Gas meters do not normally provide interval data but it is possible to fit an interval data
meter to the main gas feed. This is strongly recommended for rotational moulding sites.
The energy efficiency of individual ovens can be examined by fitting standard or interval
gas meters to ovens.
Burners
Gas burner efficiency is a key driver of efficiency in rotational moulding and all burners
should be monitored to give complete combustion of the gas.
Combustion efficiency can be improved by a variety of methods and these should be
investigated.
Tooling
The rotational moulding process does not need a hot mould, it needs a hot plastic that
will flow and the quicker the heat can be got into (and out of) the mould the faster the
process and the better the process efficiency. Increasing the heat flow can be achieved
by:
• Reducing the thermal mass of the mould by using high heat transfer rate materials.
• Using heat pipes and other techniques to get heat into the mould quicker.
Insulation
Rotational moulding ovens are often poorly sealed and insulated and seals and
insulation will always degrade with time. Examination of ovens with a thermal camera
will quickly reveal degraded seals and areas of heat leakage through poor insulation.
Process settings
Process settings for rotational moulding are often poorly defined and offer good
opportunities for improvement.
Actions to take are:
• Reduce door opening times to minimise heat losses from the oven.
• Minimise the size of the door opening to minimise heat losses.
VSDs for pumps and fans
Rotational moulding uses many fans for recirculation and exhaust of the hot combustion
gases. These are ideal applications for VSDs to improve process control and minimise
energy use.
The cooling phase of rotational moulding uses fans and sometimes water pumps for
spraying water onto the mould. These are ideal applications for VSDs to reduce energy
use.
ENERGY MANAGEMENT IN PLASTICS PROCESSING ENERGY MANAGEMENT IN PLASTICS PROCESSING ENERGY MANAGEMENT IN PLASTICS PROCESSING ENERGY MANAGEMENT IN PLASTICS PROCESSING 17
Operations Operations is where the technical improvements are put into practice - it is where the
‘rubber meets the road’. Operations depends on people, improvements are cheap but
can often be difficult to implement and sustain. Training and motivation are the key
issues in operations.
Controlling machine operations (start-up, stand-by and shut-down) is a key factor in
reducing energy costs.
Process setting
Optimized settings for production consistency and cycle time reduction will also give
optimised energy use.
The initial process setting needs a scientific approach to find the best setting and give
the best results. These setting must be adequately recorded and used to be effective.
No settings should be changed without justification and high-level approval.
Start-up
Start-up should follow setting sheets at all times. Correct sequencing of operations and
a simple time-line approach to start-up will reduce energy use dramatically, e.g. in
injection moulding there is no logic in turning on the main motor (the major energy
use) until the latest possible time.
Fast tool changes will reduce energy costs in idling machines.
Stand-by
Machines should be set into ‘stand-by’ when they are not going to be used for a short
time, e.g. main motor off, downstream, equipment off. If machines are not going to be
operated for more than 4 hours then they should be shut-down. Automation can help
here.
Shut-down
Shut-down should take the high energy loads off-line as soon as possible, e.g. in
injection moulding then the main motor should be turned off as soon as possible.
Automation can help here.
Training
Staff training is one of the quickest and most profitable actions in energy efficiency and
can reduce energy use by up to 20%. Training should explain the process, motivate
staff and be relevant to the role of the staff. Empowering staff to switch machines/
processes/services off can lead to remarkable results.
Maintenance
Maintenance is a key issue in achieving and sustaining the energy efficiency of
processes and machines. The maintenance function has a key role to play in both
achieving and maintaining energy management.

ENERGY MANAGEMENT IN PLASTICS PROCESSINGENERGY MANAGEMENT IN PLASTICS PROCESSINGENERGY MANAGEMENT IN PLASTICS PROCESSINGENERGY MANAGEMENT IN PLASTICS PROCESSING 18
Buildings Building energy costs are not always a significant percentage of the total energy costs
in plastics processing and at the typical site they are 7– 8% of the total energy costs.
Despite this, they are almost always the first area to be considered and improving
building energy efficiency can reduce costs, improve staff comfort and improve work
output.
Lighting
Lighting only represents around 5% of the energy use at a typical plastics processing
but some lighting projects are strongly recommended as a visible sign of management
commitment to energy management.
Lighting can be divided into ‘ambient’ and ‘task’ lighting - they are very different.
Ambient lighting is to allow safe movement, task lighting is to allow completion of a
specific task. The lighting levels are very different, recognising this and taking action to
separate them can reduce costs.
A ‘lighting map’ is vital in reducing lighting energy use. Map the lights, switches and
controls on the site to identify areas for improvements.
Investment in controls such as PIRs, timers and push switches can automatically reduce
lighting costs without affecting product or lighting quality.
Heating
Heating energy use in buildings is ‘condition’ driven, i.e. the driver is the external
temperature. Monitoring and targeting for heating use should be carried out using
Heating Degree Days (HDD = a measure of how cold it is). It is possible to create a PCL
for heating use and HDD to set targets and assess performance.
Quality and comfort heating are very different. Taking action to separate them can
reduce costs.
Reducing the heating load is the first task and heating levels should be set to match the
activity.
Investment in heating controls can reduce heating costs but they must be set correctly
and be tamper-proof.
Air conditioning
Air conditioning is a rapidly rising energy user but is mostly ‘comfort cooling’ for a few
days of the year, this can cost as much as the yearly heating bill. Air conditioning
controls are often tampered with by staff.
Building fabric
Building fabric improvements can reduce both heating and air conditioning loads and
reduce costs.
The main tasks are to reduce air leakage and to improve building insulation. Air leakage
is not the same thing as ventilation. Insulation can be improved through simple local
measures.
Office equipment
The energy use of office equipment is generally low but can be reduced through simple
staff measures, energy saving setting and simple 24/7 timers.
ENERGY MANAGEMENT IN PLASTICS PROCESSING ENERGY MANAGEMENT IN PLASTICS PROCESSING ENERGY MANAGEMENT IN PLASTICS PROCESSING ENERGY MANAGEMENT IN PLASTICS PROCESSING 19
Site surveys Site surveys are a key part of energy management. They identify the status of a site
and are a reference point for future progress.
Follow the data
Information is the key to an effective site survey.
Basic energy consumption data, and an energy map are needed for a site survey. These
allow targeting of the largest energy usage areas to provide the greatest rewards.
Equipment
The equipment needed for a basic site survey is minimal. It is possible to carry out a
site survey with virtually no equipment. The equipment needed for an advanced site
survey is inexpensive but allows more value to be added.
Planning
Site surveys should be planned and carried out during normal production and also, if
possible, during shut-down periods.
Project generation
Site surveys should produce a range of clearly defined projects that will pay back
rapidly and should report in financial terms to gain top management support.
Site surveys should be regularly repeated to check progress, to report success, to close
out completed projects and to generate new projects.
Non-conformance reports
Site surveys should drive action to reduce energy usage and effective non-conformance
reports are a key to action. Most sites have a quality management system, use this as a
model for non-conformance reporting.

The British Plastics Federation
5 - 6 Bath Place
Rivington Street
London
EC2A 3JE
Tel: 020 7457 5000
Fax: 020 7457 5020
E-mail: [email protected]
www.bpf.co.uk