management: from waste reduction toward circular economy ... · management: from waste reduction...
TRANSCRIPT

9/11/2017
1
Overview of National Policies on Solid Waste
Management: From Waste Reduction toward
Circular Economy Implementation
Directorate General of Solid Waste, Hazardous Waste and Hazardous Substance Management
Ministry of Environment and Forestry
Jakarta, 11th September 2017
KEMENTERIAN LINGKUNGAN HIDUP DAN KEHUTANAN
REPUBLIK INDONESIA
Introduction
65,088,257.71
65,999,493.32
66,923,486.23
67,860,415.03
68,810,460.84
2015 2016 2017 2018 2019
Projection of SW Produced SW Composition 2016
Source: BPS &
MoEF, 2015
Solid Waste Treatment Percentage
Landfilled 69%
Buried 10%
Composted and recycled 7.5%
Burned 5%
Untreated 8.5%
Source: Adipura
Secretariat, 2013
0.00
200,000.00
400,000.00
600,000.00
800,000.00
1,000,000.00
1,200,000.00
1,400,000.00
2011 2012 2013 2014 2015
Increasing of Plastic Waste Generation Volume
in 22 Metropolitan and Big Cities
Source: Adipura Secretariat, 2016

9/11/2017
2
WASTE MANAGEMENT IN INDONESIA
WASTE
LAW 32/2009
Environmental
Protection
and
Management
LAW 18/2008
Solid Waste
Management
Regulated by 2 regime of
laws
• INDUSTRIAL WASTE BOTH
SOLID AND LIQUID
• DOMESTIC WASTE WATER
• INDUSTRIAL HAZARDOUS
WASTE
• HOUSEHOLD SOLID WASTE
• HOUSEHOLD-LIKE SOLID WASTE
(FROM COMMERCIAL, MARKET,
OFFICE, ETC.)
• SPECIFIC WASTE (HOUSEHOLD
HAZARDOUS WASTE, DISASTER
WASTE, CONSTRUCTION &
DEMOLITION WASTE, ETC.)
POLICY DIRECTIVE
(LAW NO. 18/2008 AND PP NO. 81/2012)
• WASTE JUST POLLUTANT LOADS
• NO WASTE REDUCTION• NO WASTE TO
RESOURCE• NO RESOURCE
EFFICIENCY• FULL VIRGIN RESOURCE
EXTRACTION• LINIER ECONOMY
4
SHIFTING THE PARADIGM
END OF PIPE
SOLUTION3R & EPR
CIRCULAR
ECONOMY
• REDUCE WASTE AS POLLUTANT LOADS
• REDUCTION AT SOURCE• WASTE TO RESOURCE• RESOURCE EFFICIENCY• LIMIT VIRGIN RESOURCE
EXTRACTION• PRODUCER
RESPONSIBILITY
• MAKE WASTE A NEW LIFE AS LONG AS POSSIBLE
• SUSTAINABLE CITIES AND COMMUNITIES (SDG GOAL NO 11)
• RESPONSIBLE CONSUMPTION AND PRODUCTION (SDG GOAL NO 12)

9/11/2017
3
SOLID WASTE MANAGEMEN NATIONAL POLICY AND
STRATEGY TARGET 2017–2025
Indicator 2017 2018 2019 2020 2021 2022 2023 2024 2025
Waste generation
projection
(mil tons)
65.8 66.5 67.1 67.8 68.5 69.2 69.9 70.6 70.8
Waste reduction target
(mil tons)
9.80
(15%
12
(18%)
13.4
(20%)
14
(22%)
16.4
(24%)
17.99
(26%)
18.9
(27%)
19.7
(28%)
20.9
(30%)
Waste handling target
(mil tons)
47.3
(72%)
48.5
(73%)
50.3
(75%)
50.8
(75%)
50.7
(74%)
50.5
(73%)
50.3
(72%)
50.1
(71%)
49.9
(70%)
POLICY DIRECTIVE MEASUREMENTINDICATORS
1. Decreasing amount of waste generation per capita
2. Increasing amount of recycled waste at the source
3. Increasing amount of reused waste at the source
6
30% WASTE
REDUCTION BY
2025
70% WASTE
HANDLING BY
2025
INDICATORS
1. Increasing amount of segregated waste at the source
2. Decreasing amount of waste transported to the landfill site
3. Increasing amount of waste transferred to the waste treatment facility for material and energy resources
4. Increasing amount of waste treated into material resource
5. Increasing amount of waste utilized as energy source
6. Decreasing amount of waste treated at the landfill site

9/11/2017
4
Potency of Solid Waste as Renewable
Resources in Indonesia
Household Waste Utilization Potency
Source : MoE 2013
NO. Utilization Type Technology Potency (TON/Year)
1 Source of Alternative
Energy
• Incinerator
• Landfill Biogas
• Gasification
• Pyrolysis
• RDF
31.644.000
2 Source of Industrial
Resources / Solid
Waste Bank
Recycling 22.374.400
3 Organic fertilizer Composting 6.500.000
4 Creative Industry Recycling 1.945.600

9/11/2017
5
Solid Waste Potential as New Resource
NO.
CompositionAMOUNT GENERATED
(TON / YEAR)UTILIZATION POTENCY
Type %
1 ORGANIC 60 38.400.000 Compost, Renewable energy
2 PLASTIC 14 8.960.000 Industrial resources, creative industry
3 PAPER 9 5.760.000 Paper indutry resource
4 METAL 4,3 2.752.000 Metal industry resource
5 RUBBER 5,5 3.520.000 Industry Fuel
6 FABRIC 3,5 2.240.000 Creative Industry
7 GLASS 1,7 1.088.000 Glass industry, creative industry
8 OTHER 2,4 1.536.000 Other use
National Policy and Strategy for Solid Waste
Management: Circular Economy Implementation
1. Waste Reduction Policy
9/11/2017
6
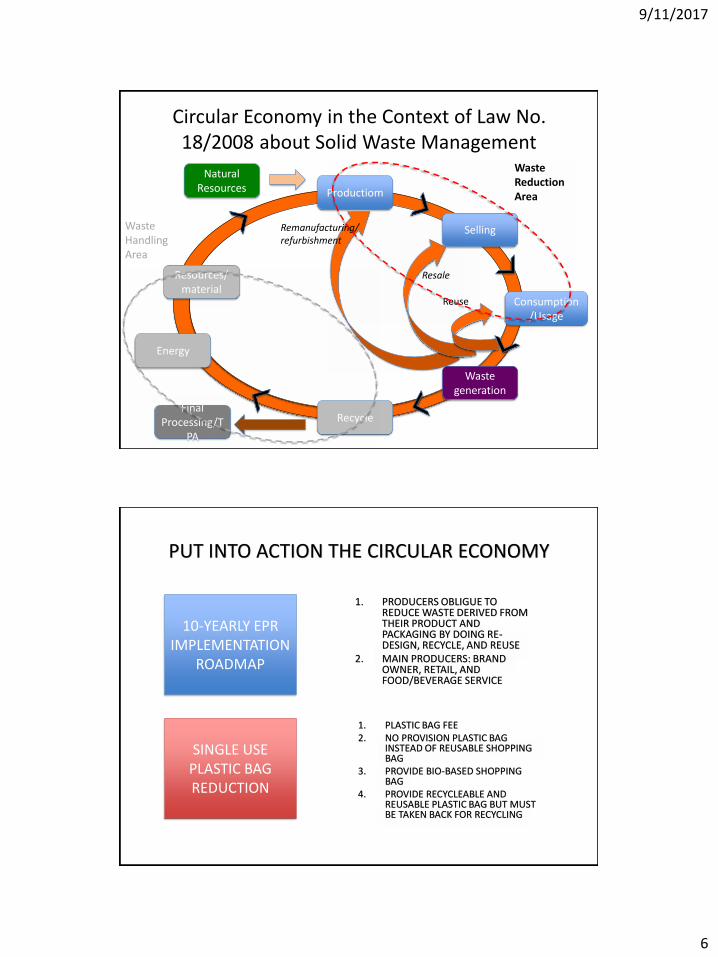
Circular Economy in the Context of Law No.
18/2008 about Solid Waste Management
Productiom
Selling
Consumption
/Usage
Waste
generation
Recycle
Resources/
material
Energy
Natural
Resources
Final
Processing/T
PA
Resale
Remanufacturing/
refurbishment
Reuse
Waste
Reduction
Area
Waste
Handling
Area
PUT INTO ACTION THE CIRCULAR ECONOMY
1. PRODUCERS OBLIGUE TO REDUCE WASTE DERIVED FROM THEIR PRODUCT AND PACKAGING BY DOING RE-DESIGN, RECYCLE, AND REUSE
2. MAIN PRODUCERS: BRAND OWNER, RETAIL, AND FOOD/BEVERAGE SERVICE
12
10-YEARLY EPR
IMPLEMENTATION
ROADMAP
SINGLE USE
PLASTIC BAG
REDUCTION
1. PLASTIC BAG FEE
2. NO PROVISION PLASTIC BAG INSTEAD OF REUSABLE SHOPPING BAG
3. PROVIDE BIO-BASED SHOPPING BAG
4. PROVIDE RECYCLEABLE AND REUSABLE PLASTIC BAG BUT MUST BE TAKEN BACK FOR RECYCLING

9/11/2017
7
Implementation Schemes for Extended
Producer Responsibility
Design for environment
Take-back system
Deposit refund system
Disposal fee system
10-YEARLY EPR IMPLEMENTATION
•Baseline Study
•Piloting plastic
bag fee at modern retail
• Implementati
on of single-use plastic
bag reduction
•Communication,
information and education
2016-2017
• Implementation at
traditional
retail
•Piloting plastic
bag take-back
scheme
•Communicatio
n, information
and education
2018-2019
•Replication
•Scalling up
Cummincatio
n, information
and
education
2020-2023
•Repllication
•Scaling up
2023-2024
Fully implemented2025
RETAIL INDUSTRY
Percentage of plastic bag reduction
Percentage of plastic bag recycling using take-back scheme
TARGET

9/11/2017
8
• Inventory Initiative by
producers
•Baseline Study
•Piloting
•Communication
, information and education
2016-2017
•Piloting (continued)
•Business
Model development
•Communicatio
n, information and education
2018-2019
•Scaling up
•Replication
2020-2023
•Scalling up (continued)
•Replication
(continued)
2023-2024
Fully implemented2025
Manufacture/Brand Owner
Percentage of re-designed product
and packaging
Percentage of recycled product
and packaging using take-back scheme
Percentage of reused product and
packaging using take-back scheme
10-YEARLY EPR IMPLEMENTATION
TARGET
• Inventory Initiative by
producers
•Baseline Study
•Piloting
•Communication,
information and education
2016-2017
•Piloting (continued)
•Business
Model development
•Communicatio
n, information and education
2018-2019
•Scaling up
•Replication
2020-2023
•Scalling up (continued)
•Replication
(continued)
2023-2024
Fully implemented2025
Food and Beverage Service
Percentage of PS foam-base tableware
Percentage of single-use tableware
Percentage of food waste reduction and
food waste treatment
10-YEARLY EPR IMPLEMENTATION
TARGET

9/11/2017
9
WHAT HAVE WE BEEN DOING IN CIRCULAR
ECONOMY?1. 1ST PILOT CONDUCTED IN FEB-MAY 2016
2. PARTNERSHIP WITH LOCAL GOVERNMENT, ASSOCIATION OF MODERN RETAIL, AND COMMUNITY
3. SUCCEEDED TO REDUCE 55% PLASTIC BAG USAGE
4. THE RETAIL SPENT THE MONEY FROM PLASTIC BAG FOR SOLID WASTE TREATMENT, PUBLIC AWERENESS, ETC.
5. AS MAIN REFERENCE TO FORMULATE MINISTERIAL REGULATION REGARDING PLASTIC BAG REDUCTION
17
PILOTING PLASTIC
BAG FEE IN 23
CITIES
PILOTING EPR
MODELLING &
IMPLEMENTATION
IN BALI
1. CONDUCTING SINCE EARLY 2016 UNTIL NOW
2. PARTNERSHIP WITH DANONE AND TETRAPAK, FOCUS ON PET BOTTLE AND TETRAPAK CARTON USING TAKE-BACK SCHEME
3. SUPPORTED THROUGH MULTI-STAKEHOLDERS COLLABORATION (NATIONAL GOVT, LOCAL GOVT, BRAND OWNER, RETAIL INDUSTRY, RECYCLING INDUSTRY, BANK SAMPAH, DESA ADAT, AND COMMUNITY)
4. LAUNCHED DROPPING BOX PROGRAM IN 2016 IN KAB. BADUNG
National Policy and Strategy for Solid Waste
Management: Circular Economy Implementation
1. Waste Reduction Policy
2. Waste Handling Policy

9/11/2017
10
Circular Economy in the Context of Law No.
18/2008 about Solid Waste Management
Productiom
Selling
Consumption
/Usage
Waste
generation
Recycle
Resources/
material
Energy
Natural
Resources
Final
Processing/T
PA
Resale
Remanufacturing/
refurbishment
Reuse
Waste
Reduction
Area
Waste
Handling
Area
Business Process of Waste Handling
Waste segregation Waste collection Waste transportation Waste treatment Waste final processing
Organic
Recyclable
Reusable
Temporarily
Collection Point (TPS)
- TPS 3R
- TPS with Multi
Compartment
- TPS with waste
type-based
schedule
Multi Compartment
transportation
Scheduled
transportation
based on waste
categories
- Composting house
- Urban farming
- Black fly soldier
- Central solid waste bank
- Recycle center
- Integrated solid waste
treatment plant
- Material recovery facility
- Incinerator
- Pyrolysis plant
- RDF plant
- Sanitary landfill
- Controlled
landfill
Landfill gas capture and
utilization:
- Thermal use
- Electricity use
Hazardous
contained
Others- Used goods market
- Used goods donation
Licensed hazardous waste
collector/treatment/userDrop box, TPS LB3
Licensed hazardous
waste transporter
Primary keys for Circular Economy
Implementation

9/11/2017
11
Concept of Circular Economy
Implementation on Waste Handling Aspect
Waste segregation Waste collection Waste transportation Waste treatment Waste final processing
Organic
waste
Temporarily
Collection Point
(TPS)
- TPS 3R
- TPS with Multi
Compartment
- TPS with waste
type-based
schedule
Multi
Compartment
transportation
Scheduled
transportation
based on waste
categories
• Composting house
• Urban farming
• Black fly soldier
• Bio digester
• Sanitary landfill
• Controlled
landfill
Landfill gas capture
and utilization:
• Thermal use
• Electricity use
CompostPlant and Crop
Energy source
Production and/or
consumption
processesBiogas
Residu
Concept of Circular Economy
Implementation on Waste Handling Aspect
Recyclable
Temporarily
Collection Point
(TPS)
- TPS 3R
- TPS with Multi
Compartment
- TPS with waste
type-based
schedule
Multi
Compartment
transportation
Scheduled
transportation
based on waste
categories
• Central waste bank
• Recycle center
• Integrated SW
treatment plant
• Material recovery
facility
• Sanitary landfill
• Controlled
landfill
Landfill gas capture
and utilization:
• Thermal use
• Electricity use
Production resources
and/or product
Electricity
Production and/or
consumption
processes
Energy sources
• Incinerator
• Pyrolysis plant
• RDF plant
Thermal energy
Residu
Waste segregation Waste collection Waste transportation Waste treatment Waste final processing

9/11/2017
12
Concept of Circular Economy
Implementation on Waste Handling Aspect
Reusable
Temporarily
Collection Point
(TPS)
- TPS 3R
- TPS with Multi
Compartment
- TPS with waste
type-based
schedule
Multi
Compartment
transportation
Scheduled
transportation
based on waste
categories
• Central waste bank
• Recycle center
• Integrated SW
treatment plant
• Material recovery
facility
• Sanitary landfill
• Controlled
landfill
Landfill gas capture
and utilization:
• Thermal use
• Electricity use
Production resources
and/or product
• Used goods
market
• Used goods
donation
Residu
Waste segregation Waste collection Waste transportation Waste treatment Waste final processing
Production and/or
consumption
processes
Concept of Circular Economy
Implementation on Waste Handling Aspect
Others/resi
dual
Temporarily
Collection Point
(TPS)
- TPS 3R
- TPS with Multi
Compartment
- TPS with waste
type-based
schedule
Multi
Compartment
transportation
Scheduled
transportation
based on waste
categories
• Sanitary landfill
• Controlled landfill
Landfill gas capture
and utilization:
• Thermal use
• Electricity use
Electricity
Energy sources
• Incinerator
• Pyrolysis plant
• RDF plant
Thermal energy
Residu
Waste segregation Waste collection Waste transportation Waste treatment Waste final processing
Production and/or
consumption
processes

9/11/2017
13
Concept of Circular Economy
Implementation on Waste Handling Aspect
Waste segregation Waste collection HW Transportation Further HW Management
Hazardous
contained
• Dropping box
• Specific TPS for
HW/HS
contained
Licensed HW
transporter
Licensed HW landfill
Licensed HW
treatment/user
Production resources
and/or product
Energy sourcesThermal energy
SW Management Regime HW Management Regime
Production and/or
consumption
processes
Existing Implementation of Circular Economy in
Indonesia : Waste to Energy

9/11/2017
14
Waste to Energy: Improvement of landfill
methane gas utilization as energy source
2 311 11
27
5 6
26
66
103
1 1 3 38
2 1 3 17
Metropolitan Besar Sedang Kecil JUMLAH
Number of Municipalities/Regencies that utilize landfill
Methane gas 2015 - 2016
Termal 2015 Termal 2016 Listrik 2015 Listrik 2016
Sumber: Database Adipura
There was significant
improvement of
municipalities/regencies
number that utilize landfill
methane gas as energy source:
- Year 2015 : 35 kab/kota
- Year 2016 : 110 kab/kota
214,3% increasing
Methane Gas Canteen, Semarang
Biodigester skala wilayah,
Bandung
Methane Gas Use in TPA Kendari

9/11/2017
15
LANDFILL GAS POWER PLANT 2 MW TPA BENOWO,
SURABAYA Using 2 units of Gas Engine, each capacity 1 MW
WASTE BASED POWER GENERATION UNIT, Surabaya
Composting House
Bratang
Waste Based Power Generation Unit (UPLTS)
For Lighting of Composting House and Flora
Park
Objective
• 4000 Watt / 12 hours for lighting
of composting house and Flora
Park
Spesification
• Diesel enggine with power 10,5 hp
• Power Generator 5 kW, 3 phase,
380 V

9/11/2017
16
Waste to Energy: Regulation and policy for
thermal-based solid waste treatment
• Act No. 18/2008 about Solid Waste Management
• Presidential Regulation No. 18/2016 about Waste-based Power Plant Acceleration in 7 cities– Priority cities: DKI Jakarta, Surabaya, Bandung, Tangerang, Makassar,
Semarang, and Solo.
– Recently has been revoked by the Supreme Court.
– Government is still revising the regulation; there will be one city addition, Denpasar City
• MoEF Regulation No. P.70/2016 about Emission Standard for thermal-based solid waste treatment business and/or activity
• MoEMR Regulation No 50/2017 about Renewable Energy Utilization for Electricity Provision– Basically regulate feeding tariff for renewable energy business
including the utilization of solid waste to energy
• Guideline of EIA and Environmental Permit for Waste-based Power Plant
Local Government
Feasibility StudyConsultant
MoEMR
(KemenESDM)
MoHA
(Kemendagri)
Waste treatment Fee Regulation
Electricity price compensation
MoEF (KLHK)EIA and Env. PermitPararel dng konstruksi
Local Govt.IMB
Pararel dng konstruksi
BKPMDirect Investment for Construction Facility
Ensuring: 1.000 T/day
Ensuring : land
MoHA Regulation : ongoing progress
MOU PLN – 7 Kota : ready
Air Pollution Emission Standard : ReadyEIA improvement process : ongoing progress
IMB : local government
MoEF facility : Ready
Implementation Progress
Government Readiness

9/11/2017
17
CitiesArea[km2]
Population[people]
Waste[ton/day]
Development Progress
Initial Prep.
Pre-FS
BiddingPre
constructionConstruc
tionCommiss
ioning Operati
on
DKI Jakarta 664.01 9,988,495 7,500 Sunter
(Jakpro+
Finland)
Kota Tangerang 184.24 1,900,000 1,400
Kota Bandung 167.30 2,748,732 1,500
Kota Semarang 373.67 1,765,396 800
Kota Surakarta 250
Kota Surabaya 350.54 2,863,059 1,400
Kota Makasar 175.77 1,652,395 1,280
Kota Denpasar 127.78 863,600 750
Progress of Solid Waste-based Power Plant
Development in 8 Cities
Thank You
Terima Kasih