management discussion and analysis€˜easternisation’ in production of chemicals. while this was...
TRANSCRIPT

Seya Industries Ltd
Annual Report | 2015-20166
MANAGEMENT DISCUSSION AND ANALYSIS
BUSINESS ENVIRONMENT
Global
The global economic environment continues to remain challenging with trimmed forecast of world GDP growth from 3.4% to 3.2% in 2016-17 on account of weakening growth prospects in emerging and developing economies led by slowdown in the Chinese economy, depressed commodity prices and strains in some large emerging market economies like Brazil and Russia. A modest albeit uneven recovery continue in the advanced economies with the US continuing to grow moderately, supported by consumption; however, lower investments and exports could weigh on growth.
In the Euro area, real GDP growth is expected to decrease to 1.5% in 2016 from 1.6% in 2015 prompting European Central Bank (ECB) to expand the scope of its quantitative easing programme, cutting its policy rates and reviving up asset purchases, which monetary stimulus is expected to continue till 2017 due to decelerating global growth outlook, increasing geopolitical risks and a revised inlation forecast (0.1% from 1%) for 2016. Consumer spending and investment are backed by low oil prices and favourable inancing conditions. However, high public and private sector debt, elevated unemployment, and structural rigidities will continue to weigh on the outlook. Further, uncertainty around the European Union (EU) referendum on Brexit could weigh on business investment.
Japan’s economic performance remains subdued despite a volatile yen and low oil prices keeping the economy on a positive growth trajectory. Aging population and slow productivity growth due to lack of structural reforms continue to create challenges necessitating government measures to achieve the growth and inlation targets through an ultra-accommodative monetary policy.
Strong decelerating forces due to the structural changes of moving from investment towards consumption and services continue to slowdown China’s economy to 6.5% in 2016 compared to 6.9% in 2015. Chinese banks can deleverage on the vertebrae of governmental support due to Government Debt in the range of 40-50% of GDP. Potential dumping of chemicals, metals, and electronic items by China in the global trade markets could be an area of concern tractioned by heavy overhang of capacity in China across sectors. China’s faster-than-expected slowdown in exports and imports is relecting its weak investment and manufacturing activity, which is having spillovers to other economies, thus impacting conidence and increasing volatility in inancial markets.
Low global crude oil prices will impact the fuel exporters’ growth prospects, while supporting growth and demand prospects in importer countries. The four key transitions that are likely to continue inluencing the global outlook are:
i. The gradual slowdown and rebalancing of economic activity in China away from investment and manufacturing towards consumption and services;
ii. Lower prices for energy and other commodities;
iii. Gradual tightening in monetary policy in the US led by a resilient US recovery even while several other major advanced economies continue to ease monetary policy;
iv. Downside risks to the EU economy closely linked to Brexit.
Domestic
The Indian economy continues to recover from a growth slowdown in the past two years, high iscal deicit and stagnant industrial activity. The investment activity is likely to pick up, led by Government efforts to boost investment in infrastructure, particularly roads, railways and urban infrastructure. The growth, based on the new GDP series was 6.6% in FY 2014, 7.2% in FY 2015 and is expected at 7.6% in FY 2016.
Expectations of a normal monsoon after two consecutive years of rainfall deiciency, improving real incomes of households and lower input costs of irms should contribute to strengthening the growth aiding RBI to cut interest rates further on the Governments’ commitment to stick to the iscal discipline (3.5% in FY 2017) as per the Union Budget 2016-17.
India has emerged as the fastest growing major economy driven by rising real incomes, domestic demand, lower inlation, downward trend in global commodity prices, improving trade, current account and iscal deicit levels, strong foreign capital inlows and a stable rupee. The proposed Goods and Services Tax (GST), a key milestone, with growing public investments and improving environment for infrastructure investments shall create a platform for sustainable growth, ranking India in the global index in the ease of doing business and claiming its rightful place in the global economy.
With realistic growth in tax revenue estimated for the current iscal in line with expected growth, various measures announced to eliminate tax distortions and improving the ease of doing business has enthused foreign investors. The Government has upheld a strong thrust on rural and infrastructure spending and accommodating the additional expenses for the pay commission recommendations, without violating the iscal deicit targets. The farm sector saw a 94% increase in allocation, with crop insurance and irrigation being the biggest beneiciaries against modest increase in safety net for non-farm community. Unabridged, rural development spend is budgeted to nurture at a moderate pace of 11% per year in FY 2017 compared to 15% in PY. However, development of agri-markets and push to agriculture investment, steps to increase farm proitability, long-term solutions to impart skills training and creating employment in the non-farm sector are key challenges for rural India which need to be addressed.
Effective implementation of infrastructure investments shall spill-over growth creating leeway for infrastructure spending through the Government’s own resources on roads, highways, agriculture and rural development despite pressure on iscal consolidation. On conjecture of normal monsoon, current level of international crude oil prices and exchange rate RBI’s 5% inlation estimate and 2.5% Wholesale Price Index (WPI) for FY 2016-17 seems squat.
CHEMICAL INDUSTRY OVERVIEW AND OUTLOOK
Global
The global chemical industry witnessed steady progress in the last decade relecting an average annual growth of about 11%. The industry however witnessed a gradual shift to the emerging Asian regions from the developed western world which led to ‘easternisation’ in production of chemicals. While this was largely led by China where chemicals sales swelled rapidly, other emerging markets also contributed to this growth. While China continues to
7.6% FY167.2% FY15
6.6% FY14
7.6% FY16
Management Discussion and Analysis
7
remain the most important chemical market, the recent slowdown in that country is viewed as a positive factor for chemical manufacturers in other emerging markets like India where the chemical industry is worth US$ 144 billion and IBEF expecting the industry to touch US$ 224 billion by FY 2017. The Indian Chemical Industry forms a backbone for the Indian economy, accounting for about 2.5% of the Gross Domestic Product (GDP), 16% of India’s manufacturing and 9% of the exports. Robust demand for chemicals over the past few years has been fuelled by strong economic growth, large population and rise in per-capita income. As a result of strong domestic demand and Asia’s increasing contribution to the global chemicals industry, India has emerged as one of the ‘focus destinations’ of companies worldwide.
Domestic
The Indian chemical industry enjoys the position of third largest producer in Asia and sixth largest producer in the world, in terms of volume of production. Bulk chemicals account for 39% of the Indian Chemical Industry, followed by agrochemicals 20.3% and speciality chemicals 19.5%. Pharmaceuticals and biotechnology account for the remaining share. India’s growing per capita consumption and demand for agriculture related chemicals offer huge scope of growth for the sector in the near-term. Consequently foreign irms have increasingly strengthened their presence in the Indian chemical space attracted by the emerging size and returns. From April 2000 to May 2015, the total foreign direct investment (FDI) into the Indian chemicals industry (excluding fertilisers) stood at US$ 10.49 billion. In line with increase in the demand of value-added products, the Indian speciality chemicals, is now one of the fastest growing industries globally (next only to China), delivering 13% annual average growth over the last ive years reaching US$ 25 billion in 2014. Apart from exports, steadily rising domestic demand has supported this momentum. This is further backed by faster GDP growth, domestic demand attaining critical mass, low cost manufacturing, and enhanced focus on process R&D and engineering capabilities. More importantly, several bulk chemical producers have started moving up the value chain to manufacture Speciality Chemicals with applications across consumer, industrial and infrastructure segments which are driven by the overall growth of the economy. On the other hand, exports have been growing rapidly as India is becoming an important manufacturing hub for such chemicals. Tightening environmental norms in developed countries and slowdown in China (in certain segments) are key contributors to export-led growth. The road ahead looks encouraging with healthy double-digit growth expected in the end-user industries, which will help the Indian speciality chemical industry to continue to deliver robust growth. The ‘Make in India’ initiative of the Government of India is also likely to add impetus to the emergence of India as a manufacturing hub for the Chemical Industry in the medium term. Overall, the Indian Speciality Chemical space is set to emerge as the fastest growing globally and is projected to reach US$ 80-100 billion by FY 2023.
SpecialityChemicals
Agrochemicals
Petrochemicals
Bulk Chemiclas
$ 16 billion inFY 09-10
$ 25 billion inFY 13-14
SpecialityChemicals
Agrochemicals
Fertilizers
Petrochemicals
$ 44 billion byFY 18-19
INDIAN SPECIALTY CHEMICAL INDUSTRY
The Indian Speciality Chemicals Industry has been an integral part of the Indian economy even as the story has recently gained prominence. The $ 25 billion Indian speciality chemicals sector has grown from one dominated by small niche players into a multi-faceted global footprint. Speciality chemicals comprise high value, low volume chemicals recognized for their performance enhancing end use applications. Being ‘usage-speciic’, speciality chemicals touch upon every population segment, inding downstream applications in paints, coatings, plastics, home care surfactants, lavours and fragrances. Traditionally, a majority of the Indian market was characterised by SMEs working around low costs but without processes, quality and customer engagement capabilities at par with global peers.
In recent years, there has been a decisive shift, the Indian specialty chemicals industry moving from a generic space to a knowledge based and innovation driven niche. The industry grew from $ 16 billion in FY 09-10 to $ 25 billion in FY 13-14 and projected to grow to $ 44 billion by FY 18-19. The structural foundation of the Indian speciality chemicals sector remains strong, catalysed by a visible increase in the consumption of-value added high performance products in all spheres of life. India’s position as a manufacturing hub for specialty chemicals strengthened following an increasing shift in manufacturing capacities to Asia, following a weakening in Chinese exports and a sustained improvement in India’s competitiveness. Going ahead, the Make in India campaign is set to accelerate sectoral growth by attracting foreign direct investment that validates India’s emergence as a leading global speciality chemicals manufacturing location on the back of improvements in infrastructure, regulation, licenses and taxes.
FINANCIAL PERFORMANCE
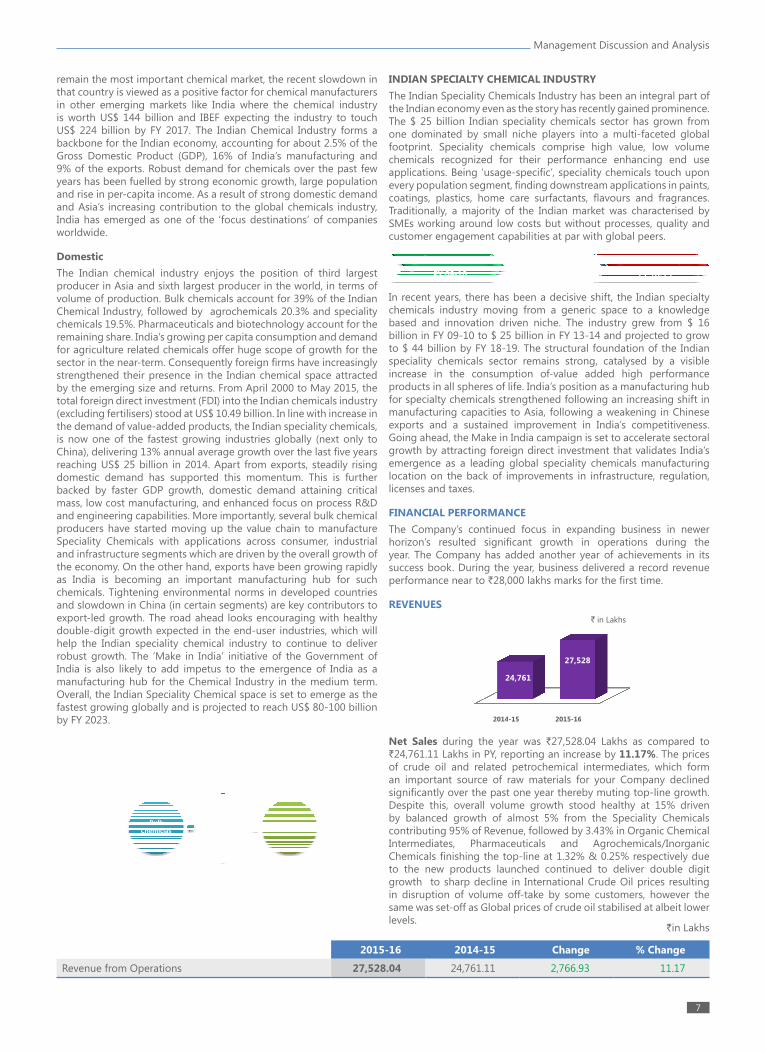
The Company’s continued focus in expanding business in newer horizon’s resulted signiicant growth in operations during the year. The Company has added another year of achievements in its success book. During the year, business delivered a record revenue performance near to `28,000 lakhs marks for the irst time.
REVENUES
Net Sales during the year was `27,528.04 Lakhs as compared to `24,761.11 Lakhs in PY, reporting an increase by 11.17%. The prices of crude oil and related petrochemical intermediates, which form an important source of raw materials for your Company declined signiicantly over the past one year thereby muting top-line growth. Despite this, overall volume growth stood healthy at 15% driven by balanced growth of almost 5% from the Speciality Chemicals contributing 95% of Revenue, followed by 3.43% in Organic Chemical Intermediates, Pharmaceuticals and Agrochemicals/Inorganic Chemicals inishing the top-line at 1.32% & 0.25% respectively due to the new products launched continued to deliver double digit growth to sharp decline in International Crude Oil prices resulting in disruption of volume off-take by some customers, however the same was set-off as Global prices of crude oil stabilised at albeit lower levels.
SpecialityChemicals
Agrochemicals
Petrochemicals
Bulk Chemiclas
$ 16 billion inFY 09-10
$ 25 billion inFY 13-14
SpecialityChemicals
Agrochemicals
Fertilizers
Petrochemicals
$ 44 billion byFY 18-19
3,417
1,371
5,009
1,371
2,644
1,303
2,678
`in Lakhs
2015-16 2014-15 Change % Change
Revenue from Operations 27,528.04 24,761.11 2,766.93 11.17

Seya Industries Ltd
Annual Report | 2015-20168
0.12x
0
0.5
1
1.5
2
2.5
3
3.5
2013-14 2014
0.20x
0.27x
0.00x
0.05x
0.10x
0.15x
0.20x
0.25x
0.30x
2014-15 2015-16
FINANCIAL HIGHLIGHTS
(` in Lakhs)
(` in Lakhs)
(` in Lakhs)
(` )
(` in Lakhs)
(` in Lakhs)
(` )
Management Discussion and Analysis
9
Segment Revenue
For better understanding of Company’s business, your Company has classiied its business segments based on the respective end use of its products which does not have any inancial impact, viz.
Fine & Speciality Chemicals
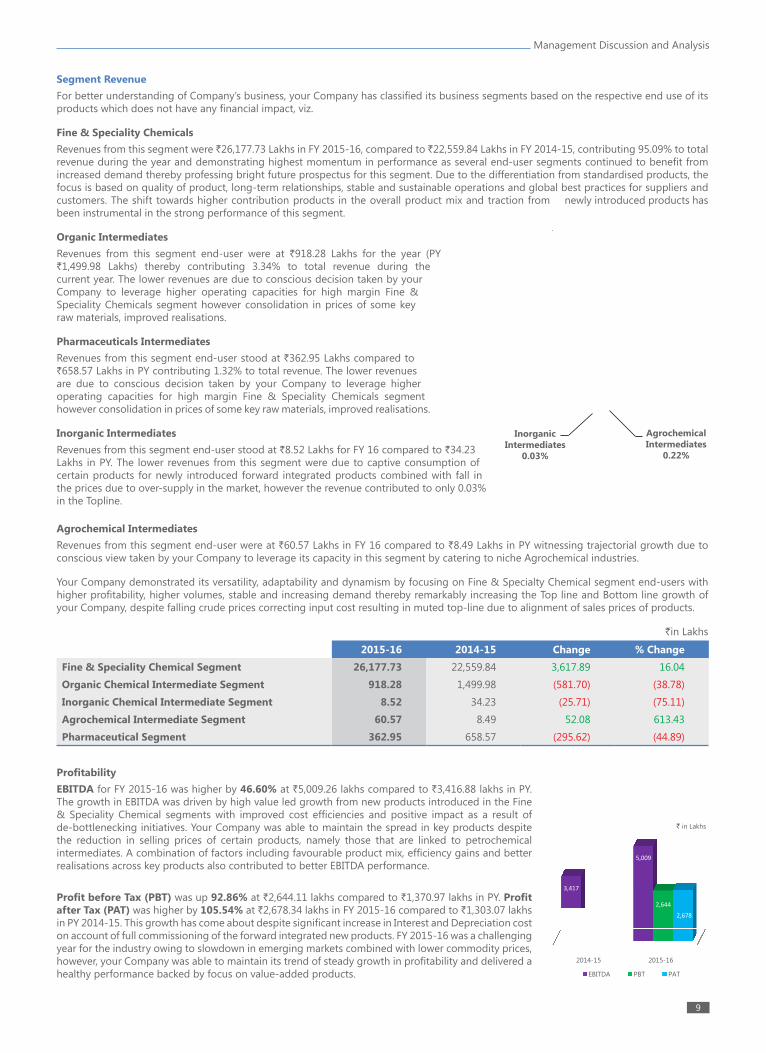
Revenues from this segment were `26,177.73 Lakhs in FY 2015-16, compared to `22,559.84 Lakhs in FY 2014-15, contributing 95.09% to total revenue during the year and demonstrating highest momentum in performance as several end-user segments continued to beneit from increased demand thereby professing bright future prospectus for this segment. Due to the differentiation from standardised products, the focus is based on quality of product, long-term relationships, stable and sustainable operations and global best practices for suppliers and customers. The shift towards higher contribution products in the overall product mix and traction from newly introduced products has been instrumental in the strong performance of this segment.
Organic Intermediates
Revenues from this segment end-user were at `918.28 Lakhs for the year (PY `1,499.98 Lakhs) thereby contributing 3.34% to total revenue during the current year. The lower revenues are due to conscious decision taken by your Company to leverage higher operating capacities for high margin Fine & Speciality Chemicals segment however consolidation in prices of some key raw materials, improved realisations.
Pharmaceuticals Intermediates
Revenues from this segment end-user stood at `362.95 Lakhs compared to `658.57 Lakhs in PY contributing 1.32% to total revenue. The lower revenues are due to conscious decision taken by your Company to leverage higher operating capacities for high margin Fine & Speciality Chemicals segment however consolidation in prices of some key raw materials, improved realisations.
Inorganic Intermediates
Revenues from this segment end-user stood at `8.52 Lakhs for FY 16 compared to `34.23 Lakhs in PY. The lower revenues from this segment were due to captive consumption of certain products for newly introduced forward integrated products combined with fall in the prices due to over-supply in the market, however the revenue contributed to only 0.03% in the Topline.
Agrochemical Intermediates
Revenues from this segment end-user were at `60.57 Lakhs in FY 16 compared to `8.49 Lakhs in PY witnessing trajectorial growth due to conscious view taken by your Company to leverage its capacity in this segment by catering to niche Agrochemical industries.
Your Company demonstrated its versatility, adaptability and dynamism by focusing on Fine & Specialty Chemical segment end-users with higher proitability, higher volumes, stable and increasing demand thereby remarkably increasing the Top line and Bottom line growth of your Company, despite falling crude prices correcting input cost resulting in muted top-line due to alignment of sales prices of products.
`in Lakhs
2015-16 2014-15 Change % Change
Fine & Speciality Chemical Segment 26,177.73 22,559.84 3,617.89 16.04
Organic Chemical Intermediate Segment 918.28 1,499.98 (581.70) (38.78)
Inorganic Chemical Intermediate Segment 8.52 34.23 (25.71) (75.11)
Agrochemical Intermediate Segment 60.57 8.49 52.08 613.43
Pharmaceutical Segment 362.95 658.57 (295.62) (44.89)
ProitabilityEBITDA for FY 2015-16 was higher by 46.60% at `5,009.26 lakhs compared to `3,416.88 lakhs in PY. The growth in EBITDA was driven by high value led growth from new products introduced in the Fine & Speciality Chemical segments with improved cost eficiencies and positive impact as a result of de-bottlenecking initiatives. Your Company was able to maintain the spread in key products despite the reduction in selling prices of certain products, namely those that are linked to petrochemical intermediates. A combination of factors including favourable product mix, eficiency gains and better realisations across key products also contributed to better EBITDA performance.
Proit before Tax (PBT) was up 92.86% at `2,644.11 lakhs compared to `1,370.97 lakhs in PY. Proit after Tax (PAT) was higher by 105.54% at `2,678.34 lakhs in FY 2015-16 compared to `1,303.07 lakhs in PY 2014-15. This growth has come about despite signiicant increase in Interest and Depreciation cost on account of full commissioning of the forward integrated new products. FY 2015-16 was a challenging year for the industry owing to slowdown in emerging markets combined with lower commodity prices, however, your Company was able to maintain its trend of steady growth in proitability and delivered a healthy performance backed by focus on value-added products.
3,417
1,371
5,009
1,371
2,644
1,303
2,678
AgrochemicalIntermediates
0.22%
3,417
1,371
5,009
1,371
2,644
1,303
2,678
InorganicIntermediates
0.03%

Seya Industries Ltd
Annual Report | 2015-201610
`in Lakhs
2015-16 2014-15 Change % Change
Earnings before Interest, Depreciation & Tax 5,009.26 3,416.88 1,592.38 46.60
Proit Before Tax 2,644.12 1,370.96 1,273.16 92.87
Proit After Tax 2,678.34 1,303.07 1,375.27 105.54
There has been no transfer to the general reserve account during the period under review. Total reserves and surplus increased by 44.28% to reach the level of `7,809.10 Lakhs as compared to previous year of `5,414.40 Lakhs.
`in Lakhs
2015-16 2014-15 Change % Change
General Reserves 2,013.53 2,013.53 - -
Proit & Loss account 5,795.57 3,400.87 2,394.70 70.41
Reserves & Surplus 7,809.10 5,414.40 2,394.70 44.23
Earnings per Share (EPS) increased to `24.35 in FY 2015-16 as compared to `11.85 in FY 2014-15. It has showed 105% growth on Y-o-Y. Your Company initiated a dividend paying track record during the year and the Board of Directors recommended a dividend of `1.00 (Rupee One Only) per Equity Share of a Face Value of `10/- each.
2015-16 2014-15 Change % Change
Earnings Per Share (`) 24.35 11.85 12.50 105.46
Raw material cost stood at `20,330 Lakhs compared to `21,811 Lakhs in PY, an decrease of 6.79%, mainly due to decrease in prices of principal inputs related to crude oil prices, however there were no Inventory losses due to eficient Inventory Management and Price correction forecast by your Company.
Finance cost was higher at `1,272 Lakhs due to post commissioning interest cost against Long Term Loan and Short Term Working Capital Loan availed from Banks & Institutions for Upgradation, modernisation and added capacity of Nitro Chlorobenzene Plants which were commissioned during the year under review.
Depreciation and Amortisation Expenses increased to `1,093 Lakhs from `1,055 Lakhs (YOY) due to post commissioning Depreciation expense of added capacity of Nitro Chlorobenzene Production Plants which was commissioned during the year.
Employee Beneit Expenses increased to ̀ 214 Lakhs from ̀ 168 Lakhs (YOY) due to escalation in annual remuneration and induction of new employees for Forward Integration Products & Added Capacity of Nitro Chlorobenzene Production Plants which were commissioned during previous year.
Your Company has delivered strong and consistent record of revenue and proit growth yet again, demonstrating resilience in the current uncertain environment
`in Lakhs
2015-16 2014-15 Change % Change
Raw Material Cost 20,330.55 21,810.81 (1,480.26) (6.79)
Finance Cost 1,271.94 991.04 280.90 28.34
Depreciation & Amortisation Expenses 1,093.21 1,054.87 38.34 3.63
Employee Beneit Expenses 214.18 168.44 45.74 27.16
Other Expenses 804.31 884.87 (80.56) (9.10)
21,811
20,330
991
1,272
1,0551,093
168 214
885804
21,811
20,330
991
1,272
1,0551,093
168 214
885804
21,811
20,330
991
1,272
1,0551,093
168 214
885804
(`)

Management Discussion and Analysis
11
SWOT ANALYSIS
Although the present per capita consumption in India is very low as compared to other countries, the growing domestic household promises increasing opportunities for growth on the back of increasing disposable income of a growing middle class. Though China at a feverish pace controls the market, its present pricing policy is repellent due to increasingly stringent pollution control policy and measures being strictured by its Government. The brand value ‘Made in India’ is lead by knowledge, power and vast experience in handling customer demands and is at its brightest spot in the Chemical industry. Challenges of REACH compliance, escalation of Crude Oil prices, fuelling, cascading and spiralling effect of prices of Inputs and Rupee v/s Dollar remain matter of concern. Your Company has adjudicated its SWOT for clutching the Opportunities and extenuating the Threats.
Key Strengths
Leadership & Management Team: Seya is led by a strong and experienced management team with strong fundamental knowledge and keen awareness of the shifts in the industry landscape comprising irst generation technocrats all possessing excellence in Chemical Engineering. Your Company has established a record of blockbuster returns with capex execution leading to consistent revenue growth, value-addition and margins expansion. Your management possesses a proven track record in formulating strategies, implementing pioneering technologies and introducing high value high margin products to accelerate the growth momentum by establishing best-in-class global practices which have enabled your Company to enhance stakeholder value while adhering to the code of Responsible Care and ethical values.
Integration & Global Size Plant: Seya’s sustained focus on process development, plant automation and high quality benchmarks has made it possible to emerge as one of the highest quality at lowest-cost producers of benzene derivatives in the world. Your Company’s integrated facilities with backward and forward cost-eficient processes and diversiied downstream applications complemented by competitive, large and integrated supply chains empower your Company to address the growing needs of large global customers. Your Company has the largest installed capacities for its premium high valve and high margin products. Your Company is a global entity in integrated backwards and forwards in its range of chemicals and also across various value chains, enhancing its capability to supply a basket of products and becoming a one-stop source. This has resulted in the fragmentation of competitive risks as very few global players are as integrated and diversiied as your Company.
Diversiied Product portfolio: Your Company’s de-risked portfolio with diverse products addresses different end-user applications across customers and geographies spanning from Agrochemicals, Polymers, Dyes, Pigments, Printing Inks, Pharmaceuticals, Health & Home Care, Oil & Gas, Rubber Chemicals, Flavours & Fragrances, Food Ingredients, Cattle Feed, etc. thereby insulating itself from vagaries in any one product or segment. Your Company supplies products to more than 100 customers. Each Product results in engagements with multiple customers, an effective entry barrier for competition providing lexibility to shift products based on market dynamics, countering demand vagaries and converting process by-products into commercially viable products, enhancing value.
Innovation & Technical Expertise: Innovation is deep-rooted in the DNA of your Company. Seya executes complex and hazardous chemical processes with high success rates by leveraging its experience in indigenous development and capability in developing, managing, storing and handling various types of chemicals in quantities ranging from a few kilos to several tonnes. Your Company’s expertise and competence provides customers the comfort that it will undertake these complex processes safely and in a cost competitive manner while adhering to the highest standards of quality has built technological capabilities through know-how transfer, resulting in
several differentiated processes/ chemistries. The enriching product mix combined with scale has enhanced the earning eficiency.
Quality, Safety, Sustainability: Your Company practices the most stringent global environment, health and safety standards, ensuring optimal productivity and business sustainability. Seya has been REACH-compliant and emphasizes on Reduce-Reuse-Recover principles across its manufacturing site following the highest SHE (Safety, Health & Environment) standards. Your Company is looked upon as a benchmark and standard of Quality. Your company has revolutionized Quality of all the Products it manufactures to standard which can be matched by none and commands premium pricing for all its products.
Key Opportunities
Make in India – Geographical shift: India has recently developed into an important manufacturing hub for Speciality Chemicals on account of superior compliance with environmental norms, increasing competitiveness and decline in Chinese competitiveness. India is poised to capitalize growing opportunities in the export of speciality chemicals with increasingly stringent compliance to environment norms in China which has affected global supply enabling Indian producers with large capacities, international quality compliance and environment standards to beneit. Maturing of the Chinese economy has increased labour and other Costs in China with incremental compliances necessitating additional investments in efluent treatment thereby enhancing costs and impacting capacity utilization assessed by increased competitiveness of Rupee v/s. Chinese Yuan widening the Indian fosse. Amidst this the Government’s ambitious ‘Make in India’ initiative has given tremendous boost to the Indian manufacturing sector attracting capital, technological investment and toting impetus to the emergence of India as a manufacturing hub for the chemical industry. Your Company driven by extensive product and process innovation, a signiicant differentiator over the commoditized Indian chemical industry. With strong technical expertise, high Safety, Health & Environment standards as well as deep customer relationships, it remain at the forefront to make signiicant headway in high value chemicals strengthening product mix and scale resultantly driving earnings eficiency.
Large addressable market: To address the country’s large and dispersed end-user market, companies have to start adopting a key-account strategy for large customers and partnership with other companies to build distribution networks across geographies. Companies have realized the importance of having a strong vendor base and partnership arrangements with cost effective local companies to achieve a leadership position.
India as an R&D hub for specialty chemicals: Large MNCs have started tapping the India’s cost advantage by investing in production for exports and also moving some of their R&D work to India. There is a large untapped potential in this space.
Opportunities for local customization: A key success factor in the Indian specialty chemical market is the local customization. Many customers are willing to sacriice on some of the product attributes for a lower product price. These offerings can also be expanded to other Asian markets.
Key Challenges
Regulatory and environment: While chemical industry addresses growing need for materials required by different sectors, the industry employs highly complex manufacturing process that often involves handling of toxic and hazardous chemicals. The process being energy intensive, the importance of safety, health, security and environmental protection cannot be underestimated. The export performance of specialty chemicals so far has been good. European and developed markets have progressively tightened their import regulations citing environmental concerns and protection of domestic manufacturers. The most impactful regulation from an Indian perspective has been the European Union’s REACH (Registration, Evaluation, Authorization

Seya Industries Ltd
Annual Report | 2015-201612
and Restriction of Chemicals) which addresses the production and use of chemicals and their potential impact on human health and environment. The substantial impact of REACH will come into effect from June 2018 that will regulate any chemical supplied to EU. REACH increases the safety, health and environmental compliance of chemical manufacturers supplying to EU, affecting underlying process costs. In a scenario where a number of Indian companies are likely to ind this transition challenging, Seya has been REACH-complaint since its inception by adhering to highest standards of SHE (safety, Health & Environment).
Non-availability of Alternate Energy Sources: Chemicals manufacturing Industry consistently requires high amount of energy in production processes through conventional fuels like coal, furnace oil, etc. for generation of power or as a heat energy source. Use of non-conventional energy like wind power, solar power or natural gas becomes unfeasible as these alternate fuels have shortcomings like lack of reliability of continual supply, inability to generate energy in large quantity, sizeable capital expenditure, availability at higher costs, etc. However your Company has implemented state-of-art Energy Management Systems and continues to focus sharply on improving Utility eficiencies at its facilities along with widening its scope of Green Chemistry.
Volatility in Raw Materials Prices: Volatility in the global prices of raw materials is the foremost challenges faced by the chemical industry which can be well mitigated due to the time lag before price hikes or cost revision enabling the same to be passed on to customers. While your Company has enhanced inventory management procedure, it periodically reviews prices with suppliers, which remains as an inherent weakness in the industry. Sharp corrections in the crude oil prices aligns prices of various raw materials procured by the Company which inluence topline even as they have a limited impact on proitability due to adoption of a cost plus pricing model for all its products. While the topline remains elastic to raw material price movements, enhanced volumes and superior product mix drive the proit capturing the essence of your Company’s value chain.
STRATEGIES FOR GROWTH
SEYA hasenvisaged its growth path, by a clear and deined vision to:l Invest locally with Scale and Size matching global norms and
adopt cutting edge technology (developed or acquired)
l Secure Feedstock and Technology
l Become a coveted employer - Attract and Retain talent
l Establish a targeted innovation platform, Invest more in R&D
l Create a positive, consumer & environment friendly image
Your Company is addressing cost issues of raw materials and its price volatility and high energy costs which shall result in reduction in energy and ixed costs, yield better cash lows and aid in debt reduction, all of which will result in long-term value creation for its stakeholders. Cash generation through operational excellence and to realize the synergies of being a fully integrated facility shall drive eficiencies and effectiveness in transitioning to value-added products. To meet the increasing demand last year your Company had announced setting-up of a Greenield project to be self-reliant for most of its Raw materials, Reduce Cost of Energy, Diversify into Specialised High Value & High Margin products, Value addition to By-Products by reusing the same for manufacturing of high margin products and expansion in capacity of its captive use products. With a Capital Outlay of `73,458 Lakhs and having so far incurred `31,533 Lakhs, this phase of expansion shall phoenix up the Bottom and Top-line of the Company and shall make it achieve leading and dominant position in Speciality Chemicals globally for all its products. The Project entails: a) Expansion of Intermediate Product for downstream
consumption
b) Backward Integration into manufacture of Bulk Raw Material so as to reduce Raw material & Logistics Cost and Environmental Hazard
c) Recovery of Waste Heat and Recycle/Reuse of By-products so as to reduce Cost of: Materials, Energy and Efluent treatment
d) Forward Integration & Diversiication into high value & high margin Speciality Chemicals based on existing product mix which are having high demand and growth potential considering their application in end-user industries to achieve better integration in the existing value chain through established market network and customer base
e) Captive consumption of 50% of products proposed to be manufactured
f) Setting-up of Captive & Cogen Power plants based on Waste Heat Recovery Systems.
The recently introduced forward integrated products in the Fine and Speciality chemicals are expected to report good volumes. Increasing utilisation of these newly launched products will further propel volume growth and proitability. Going forward, your Company foresees stronger customer relations, higher eficiencies and robust growth in Fine & Speciality Chemicals end-user segment.
INTERNAL CONTROL SYSTEMS & ITS ADEQUACY
The Company has robust systems for internal audit, risk assessment and mitigation and well-established internal control and risk management processes both at the business and operational levels. The Internal Auditor reports directly to the Chairman of the Audit & Risk Management Committee of the Board of Directors, which ensures process independence. Internal audit function plays a key role in providing to both the operating management and to the Audit & Risk management Committee of the Board, an objective is to view and reassurance of the overall control systems and effectiveness of the risk management processes across the Company. Internal Audit also assesses opportunities for improvement in business processes, systems and controls and provides recommendations designed to add value to the operations. The scope and authority of the Internal Audit Department is derived from the Audit Charter approved by the Audit Committee. Internal Audits with respect to inancial and compliance matters are performed by an Internal Auditor and operational level internal audit is performed by the in house team of managers, engineers and project and production team. The internal audit department which operates on a decentralised basis continuously monitors the adequacy and effectiveness of the internal control environment across the Company and the status of compliance
GROWTH
STRATEGY
Management Discussion and Analysis
13
RISK MANAGEMENT
Managing Risk is an integral part of Seya’s business. The Company operates a structured and continuous process of identifying, analysing, responding and mitigating the risk events that have the potential to generate adverse effect on the achievements of organisational objectives. This section discusses various dimensions of our enterprise risk management and is not exhaustive and is for information purpose only. Our business model is subject to uncertainties that could cause actual results to differ materially from those relected in the forward looking statements. The overall approach to Risk Management at Seya is based on the following principles: Aims at value creation and protection
An integral part of processes and decision making
Addresses uncertainties explicitly
Is structured, dynamic and responsive to change
Risk Categories & Mitigants
Operational RiskThese are those risks which are associated with operational uncertainties like failure in critical equipment, attrition etc.
MitigantHazop Study and Safety studies for Process risks are carried out at regular intervals through EHS initiatives and dedicated committee formed for Managing process related hazards and safety
Financial RiskThis covers inancial risk facing the organisation in terms of internal systems, planning & funding.
MitigantApart from detailed review across levels and functions an independent risk team evaluates all deals before the approval
Reputational RiskSeya is expected to maintain global quality standards in manufacturing. Any deviation with regards to quality compliance of products would impact the Consumers and hence adversely affect the Company’s performance.
MitigantDedicated quality control and assurance team actively monitors the adherence to prescribed quality standards. Most stringent Quality Control and Quality Management systems are in place and reviewed periodically.
HUMAN RESOURCES
Seya’s talent base, as on March 31, 2016 stands at 103. With a view to equip the Company to address the business challenges of a dynamic economic environment, the HR function focused on retaining and attracting suitable talent, enhancing the technical / behavioural skills of employees and optimising employee costs. Learning and Development has been prioritized as a means of expanding the knowledge base of employees, which is seen as a key driver of growth. Taken together, these initiatives and processes are making a positive impact on talent attraction, retention and commitment.
Managing the human asset for an Organization is a strategy that helps build the resources for a robust future. A ready second line of leadership; a highly engaged workforce; low manpower turnovers are few of the multiple gambits handled by the Human Resources Team. We hire high-caliber professionals to augment the current team to lead teams into the future, by building the base cadres, as well as, through induction of experienced professionals into senior leadership positions. Leadership development is considered as an essential requirement to Talent Management. The important aspect of building leadership is through alignment with the strategic learning and development agenda. Keeping the above in mind, there is an increasing focus on Strategic Leadership Planning to create a leadership and talent pipeline for the next 3 years for future readiness. We therefore focus on identifying the strengths of individuals and leverage them by providing relevant trainings and a successful career path. The strategy of leadership development has ensured that each of our businesses is managed by a team of competent, passionate and inspiring leaders.
A productive and innovative workplace has been and will continue to remain a key requirement for successful business performance in the Company’s perspective. Therefore, there is huge emphasis on Senior Leadership commitment for Human Resource Development practices that seek and nurture employee participation and involvement in managing the shop loor by strengthening the employee engagement initiatives. Innovation is at the core of our business and at the very heart of everything that we do, be it in research, operations and this is true for HR as well. It is in the DNA of SEYA where employees are empowered with the ability to bring new ideas to the table. The Company believes in the conduct of affairs of the Company in a fair and transparent manner by adopting the highest standards of professionalism, honesty, integrity and ethical behaviour. With this aim, the Company has introduced the “Whistle Blower Policy/Vigil Mechanism” for Directors and Associates to report genuine
RISK CATEGORIES
Strategic
Regulatory & Compliance Financial
Reputational
Operational
RISK MANAGEMENT PROCESS
Risk
Identification
and
Assessment
Integration
with Strategy
& Business
Plan
Risk
Mitigation
and
Monitoring
Risk
Handling,
Reporting &
Disclosures
RISK MANAGEMENT POLICY
Governance Structure
The Policy has been approved by Board and the implementation of
the Policy is reviewed at various levels. Audit & Risk Management
Committee reviews the aggregated risks and proposed mitigants
across Seya at aperiodic frequency.
Execution
The execution of Risk management across Seya is carried out by
various Risk Owners. The Risk owner is responsible for creation of
appropriate Risk assessment methodologies, risk mitigation plan and
policies.
Risk Identification
To ensure that Risk is considered in every decision taken across Seya,
efforts are being made to train and sensitise the whole organisation
on various risks Seya exposed to.
The following broad categories of risks have been considered in the risk management framework: Strategic Risk
It includes the range of external events and trends (like government policies that can adversely impact the Company’s strategic growth trajectory and destroy stakeholder value.
MitigantThe applicable regulatory framework is continuously tracked by various teams within Seya. Appropriate action as necessary is being undertaken to ensure compliance with all regulatory requirements.

Seya Industries Ltd
Annual Report | 2015-201614
concerns or grievances of unethical behaviour, actual or suspected fraud or violation of the Company’s Code of Conduct or Ethics Policy. The main objective of the policy is to build and strengthen a culture of transparency and trust within the organisation. As per the requirement of The Sexual Harassment of Women at Workplace (Prevention, Prohibition & Redressal) Act, 2013 (‘Act’), the Company has constituted Internal Complaints Committees (ICC) across all the locations which are responsible for redressal of complaints related to sexual harassment at respective locations. The objective of the Policy is to create and provide a work environment that is safer, civilized, free from any sort of hostility, supportive to the diversity & dignity of all Associates, where Associates feel secure at the workplace on the basis of natural justice and conidentiality.
COMPANY OUTLOOK
The sharp fall in crude oil prices during 2015-16 triggered a massive correction in petrochemicals and intermediate prices with users drawing on stocks. This coupled with reduction in global demand occasioned adverse global environment. Notwithstanding subsisting constraints of dificult market conditions, the current year should end on a positive note since the demand in the Speciality Chemicals is largely driven by domestic market considering the low per capita consumption ratio and increase in discretionary spending. Comparative low labour costs, excellent army of technical manpower, capabilities to research and develop facilities, potential to increase share in undeveloped domestic and global markets shall empower Speciality Chemicals growth. Your company has geared itself for growth even in the backdrop of leaden markets by leveraging its low cost, fully integrated and automated manufacturing facilities with improved service skills though luctuations in foreign exchange and crude oil prices may impact sales realisation however the operating proit margins shall continue to grow. Considering the overwhelming response of your company’s participation in Chemspec Europe 2016, your company has strategized to set up of Sales ofice in Europe and North America to further propel its momentous growth by i) broadening its market reach in new geographies, ii) increasing its manufacturing and working capital eficiencies and iii) introducing new products.
Your company is in the business of manufacture of Specialty Chemicals which have applications in end user segments like Computer Printing Inks, Pigments & Paints, Pharmaceuticals, Personal & Health Care
Products, Agrochemicals, Insecticides/Pesticides, Organic Chemical Intermediates, Rubber chemicals, Textile dyes, Thermic luids, etc. The products proposed to be manufactured by the Company are falling under the category of Speciality Chemicals which have good demand and market potential in both domestic and International markets, with demand in domestic market expected to follow an accelerated growth path considering that the present capita consumption is only 40% of International standards. Moreover, after the REACH (Registration, Evaluation, Authorization and Restriction of Chemicals) regulation imposed by European Countries and stringent Pollution Control norms being recently implemented in China, costs of handling efluents have increased resulting in relocation of manufacturing operations by large number of companies to India. Due to greater use of polyester and cotton-based fabrics, there has been a shift towards reactive dyes used in cotton-based fabrics and disperse dyes used in polyester, hence the demand is expected to grow with textile industry being the largest consumer; however substantial growth will also be driven by markets such as printing inks, paints and plastics considering increasing use of these products in recent times.
Compliance with global regulations and India’s manufacturing competitiveness has helped the Speciality Chemicals market to grow signiicantly especially with focus & initiatives taken by the Indian Govt. to increase the share of manufacturing in GDP from 16% to 25% by 2022 and that the demand be met through domestic production by increased use of Technology & Innovation available in India through large pool of Technical man-power as well as scientists and researchers. Several initiatives have been taken by the Indian Govt. to support the growth of Specialty chemicals; However the execution of these initiatives is likely to deine the rate of growth of Specialty Chemicals market.
Cautionary Statement The report contains forward-looking statements, identiied by words like ‘plans’, ‘expects’, ‘will’, ‘anticipates’, ‘believes’, ‘intends’, ‘projects’, ‘estimates’ and so on. All statements that address expectations or projections about the future, but not limited to the Company’s strategy for growth, product development, market position, expenditures and inancial results, are forward-looking statements. Since these are based on certain assumptions and expectations of future events, the Company cannot guarantee that these are accurate or will be realised. The Company’s actual results, performance or achievements could thus differ from those projected in any forward-looking statements. The Company assumes no responsibility to publicly amend, modify or revise any such statements on the basis of subsequent developments, information or events.