management accounting fundamentals - cga-education.org · part 1 – flexible budgets (topic 8.1)...
TRANSCRIPT

Management AccountingFundamentals
Module 8Flexible budgets and
decentralizationLectures and handouts by:Shirley Mauger, HB Comm, CGA
2
Module 8 - Table of Contents
8.1 Flexible budgets8.2 Variable overhead variances8.3 Overhead rates and standard costing8.4 Fixed overhead budget and volume variances8.5 Computer illustration 8-1: Fixed costs in a flexible
budget8.6 Full income statement variance analysis8.7 Decentralization in organizations8.8 Segment reporting8.9 Revenue variance and marketing expense analysis8.10 Rate of return and residual incomeReview question: Variance analysis, working backwards
from dataReview question: Segmented statementsReview question: Segmented statements, ROI and residual
incomeReview question: Multiple choice
1
2
N/A
3
456
78
9
Part Content
3
Part 1
Flexible budgetsVariable overhead
variances
Topics 8.1-8.2
MA1 – MODULE 8
Part 1 – Flexible budgets (Topic 8.1)Prepare a flexible budget, and explain the advantages of theflexible budget approach over the static budget approach. (Level 1)
4
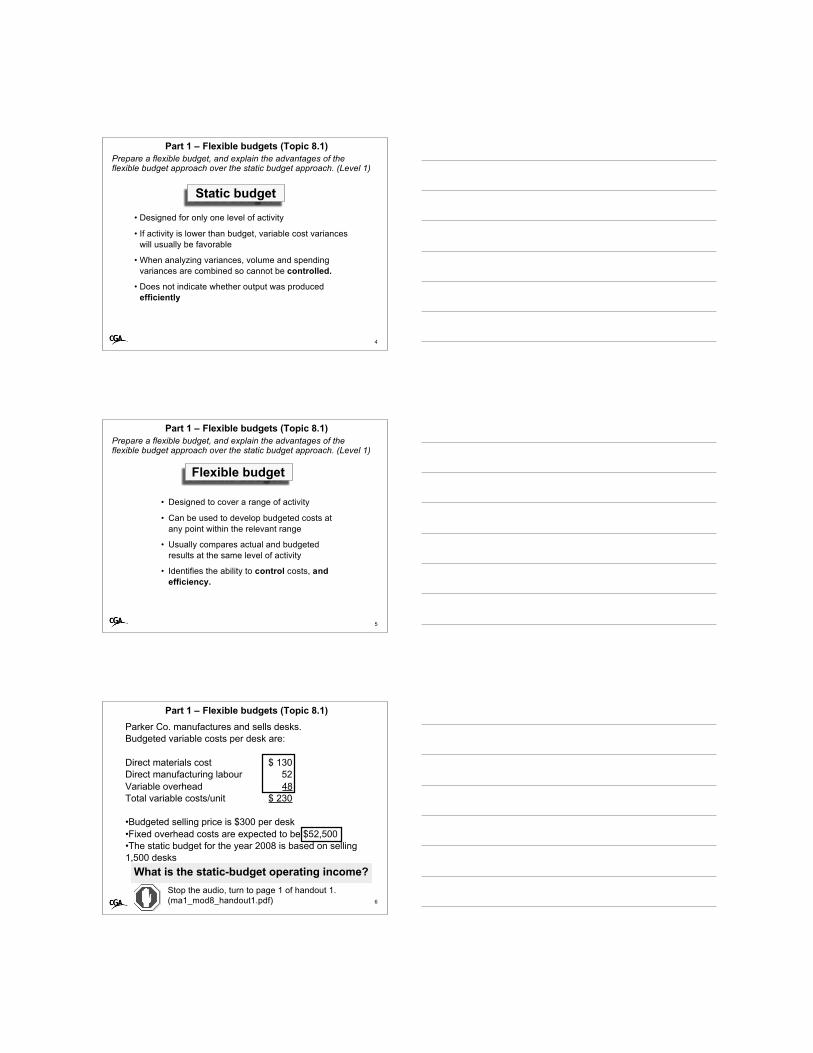
Static budget
• Designed for only one level of activity
• If activity is lower than budget, variable cost varianceswill usually be favorable
• When analyzing variances, volume and spendingvariances are combined so cannot be controlled.
• Does not indicate whether output was producedefficiently
Part 1 – Flexible budgets (Topic 8.1)Prepare a flexible budget, and explain the advantages of theflexible budget approach over the static budget approach. (Level 1)
5
Flexible budget
• Designed to cover a range of activity
• Can be used to develop budgeted costs atany point within the relevant range
• Usually compares actual and budgetedresults at the same level of activity
• Identifies the ability to control costs, andefficiency.
Part 1 – Flexible budgets (Topic 8.1)
6
What is the static-budget operating income?
Parker Co. manufactures and sells desks.Budgeted variable costs per desk are:
Direct materials cost $ 130Direct manufacturing labour 52Variable overhead 48Total variable costs/unit $ 230
•Budgeted selling price is $300 per desk•Fixed overhead costs are expected to be $52,500•The static budget for the year 2008 is based on selling1,500 desks
Stop the audio, turn to page 1 of handout 1.(ma1_mod8_handout1.pdf)

Part 1 – Flexible budgets (Topic 8.1)
7
1. What is the static-budget operating income?
Parker Co.
Unit costs StaticBudget
Activity level 1,500Sales: $ 300 $ 450,000Variablecosts 230 (345,000)Fixedoverhead 52,500 (52,500)Income fromoperations $ 52,500
Part 1 – Flexible budgets (Topic 8.1)
8
Actual costs incurred….
Parker Co.
Actual StaticBudget
Activity level 1,300 1,500Sales: $300 $410,000 $450,000Variablecosts $230 (330,000) (345,000)Fixedoverhead (61,500) (52,500)Income fromoperations $ 18,500 $52,500
Part 1 – Flexible budgets (Topic 8.1)
9
Budget variances….
Parker Co.
Actual Variance StaticBudget
Activity level 1,300 200 1,500Sales: $300 $410,000 $40,000U $450,000Variablecosts $230 (330,000) 15,000F (345,000)Fixedoverhead (61,500) 9,000U (52,500)Income fromoperations $ 18,500 $ 34,000U $52,500

Part 1 – Flexible budgets (Topic 8.1)
10
Budget variances….
Parker Co.
Actual Variance StaticBudget
Activity level 1,300 200 1,500Sales: $300 $410,000 $40,000U $450,000Variablecosts $230 (330,000) 15,000F (345,000)Fixedoverhead (61,500) 9,000U (52,500)Income fromoperations $ 18,500 $ 34,000U $52,500
Is this reallyfavorable?
Part 1 – Flexible budgets (Topic 8.1)
11
2. Prepare a flexible budget at the actuallevel of operations.
Parker Co.
Actual FlexibleBudget
StaticBudget
Activity level 1,300 1,300 1,500Sales: $300 $410,000 $450,000Variablecosts $230 (330,000) (345,000)Fixedoverhead (61,500) (52,500)Income fromoperations $ 18,500 $52,500
Part 1 – Flexible budgets (Topic 8.1)
12
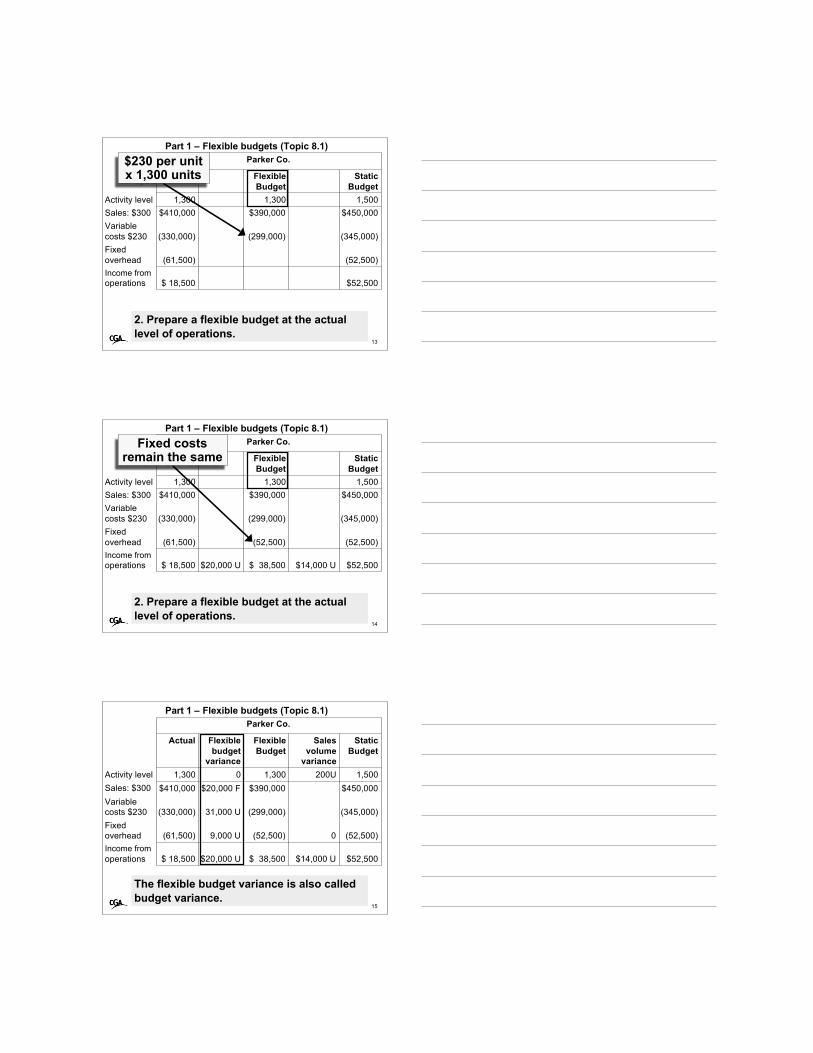
2. Prepare a flexible budget at the actuallevel of operations.
Parker Co.
Actual FlexibleBudget
StaticBudget
Activity level 1,300 1,300 1,500Sales: $300 $410,000 $390,000 $450,000Variablecosts $230 (330,000) (345,000)Fixedoverhead (61,500) (52,500)Income fromoperations $ 18,500 $52,500
$300 per unitx 1,300 units
Part 1 – Flexible budgets (Topic 8.1)
13
2. Prepare a flexible budget at the actuallevel of operations.
Parker Co.
Actual FlexibleBudget
StaticBudget
Activity level 1,300 1,300 1,500Sales: $300 $410,000 $390,000 $450,000Variablecosts $230 (330,000) (299,000) (345,000)Fixedoverhead (61,500) (52,500)Income fromoperations $ 18,500 $52,500
$230 per unitx 1,300 units
Part 1 – Flexible budgets (Topic 8.1)
14
2. Prepare a flexible budget at the actuallevel of operations.
Parker Co.
Actual FlexibleBudget
StaticBudget
Activity level 1,300 1,300 1,500Sales: $300 $410,000 $390,000 $450,000Variablecosts $230 (330,000) (299,000) (345,000)Fixedoverhead (61,500) (52,500) (52,500)Income fromoperations $ 18,500 $20,000 U $ 38,500 $14,000 U $52,500
Fixed costsremain the same
Part 1 – Flexible budgets (Topic 8.1)
15
The flexible budget variance is also calledbudget variance.
Parker Co.
Actual Flexiblebudget
variance
FlexibleBudget
Salesvolume
variance
StaticBudget
Activity level 1,300 0 1,300 200U 1,500Sales: $300 $410,000 $20,000 F $390,000 $450,000Variablecosts $230 (330,000) 31,000 U (299,000) (345,000)Fixedoverhead (61,500) 9,000 U (52,500) 0 (52,500)Income fromoperations $ 18,500 $20,000 U $ 38,500 $14,000 U $52,500

Part 1 – Flexible budgets (Topic 8.1)
16
A sales volume variance identifies the variancesresulting from changes in activity levels.
Parker Co.
Actual Flexiblebudget
variance
FlexibleBudget
Salesvolume
variance
StaticBudget
Activity level 1,300 0 1,300 200U 1,500Sales: $300 $410,000 $20,000 F $390,000 $ 60,000 U $450,000Variablecosts $230 (330,000) 31,000 U (299,000) 46,000 F (345,000)Fixedoverhead (61,500) 9,000 U (52,500) 0 (52,500)Income fromoperations $ 18,500 $20,000 U $ 38,500 $14,000 U $52,500
Part 1 – Flexible budgets (Topic 8.1)
17
A sales volume variance identifies the variancesresulting from changes in activity levels.
Parker Co.
Actual Flexiblebudget
variance
FlexibleBudget
Salesvolume
variance
StaticBudget
Activity level 1,300 0 1,300 200U 1,500Sales: $300 $410,000 $20,000 F $390,000 $ 60,000 U $450,000Variablecosts $230 (330,000) 31,000 U (299,000) 46,000 F (345,000)Fixedoverhead (61,500) 9,000 U (52,500) 0 (52,500)Income fromoperations $ 18,500 $20,000 U $ 38,500 $14,000 U $52,500
Fixed OH nevershows a sales
volume variance
Part 1 – Flexible budgets (Topic 8.1)
18
A closer look at overhead…
Parker Co.
Actual Flexiblebudget
variance
FlexibleBudget
Salesvolume
variance
StaticBudget
Activity level 1,300 0 1,300 200U 1,500Sales: $300 $410,000 $20,000 F $390,000 $ 60,000 U $450,000Variablecosts $230 (330,000) 31,000 U (299,000) 46,000 F (345,000)Fixedoverhead (61,500) 9,000 U (52,500) 0 (52,500)Income fromoperations $ 18,500 $20,000 U $ 38,500 $14,000 U $52,500

Part 1 – Flexible budgets (Topic 8.1)
19
STANDARD COST CARD – 1 DESK
Direct materials: $126Direct labour (5 hours at $12/hour 60Variable overhead (5 DLH at $8.80/hour) 44*Fixed overhead (5 DLH at $7.00/hour) 35Total standard costs per desk: $265
(*Based on a denominator level of activity of 1,500 desks)
Part 1 – Flexible budgets (Topic 8.1)
20
Parker Co.
Actual Flexiblebudget
variance
FlexibleBudget
Salesvolume
variance
StaticBudget
Activity level 1,300 0 1,300 200U 1,500Sales: $300 $410,000 $20,000 F $390,000 $ 60,000 U $450,000Direct mat. (180,000) (189,000)Direct labour (87,800) (90,000)Variable OH (62,200) (66,000)Fixed OH (61,500) 9,000 U (52,500) 0 (52,500)Income fromoperations $ 18,500 $20,000 U $ 38,500 $14,000 U $52,500
DM: 1,500 x $126DL: 1,500 x $ 60VOH: 1,500 x $ 44
Part 1 – Flexible budgets (Topic 8.1)
21
Parker Co.
Actual Flexiblebudget
variance
FlexibleBudget
Salesvolume
variance
StaticBudget
Activity level 1,300 0 1,300 200U 1,500Sales: $300 $410,000 $20,000 F $390,000 $ 60,000 U $450,000Direct mat. (180,000) (163,800) (189,000)Direct labour (87,800) (78,000) (90,000)Variable OH (62,200) (57,200) (66,000)Fixed OH (61,500) 9,000 U (52,500) 0 (52,500)Income fromoperations $ 18,500 $20,000 U $ 38,500 $14,000 U $52,500
DM: 1,300 x $126DL: 1,300 x $ 60VOH: 1,300 x $ 44
Part 1 – Flexible budgets (Topic 8.1)
22
Parker Co.
Actual Flexiblebudget
variance
FlexibleBudget
Salesvolume
variance
StaticBudget
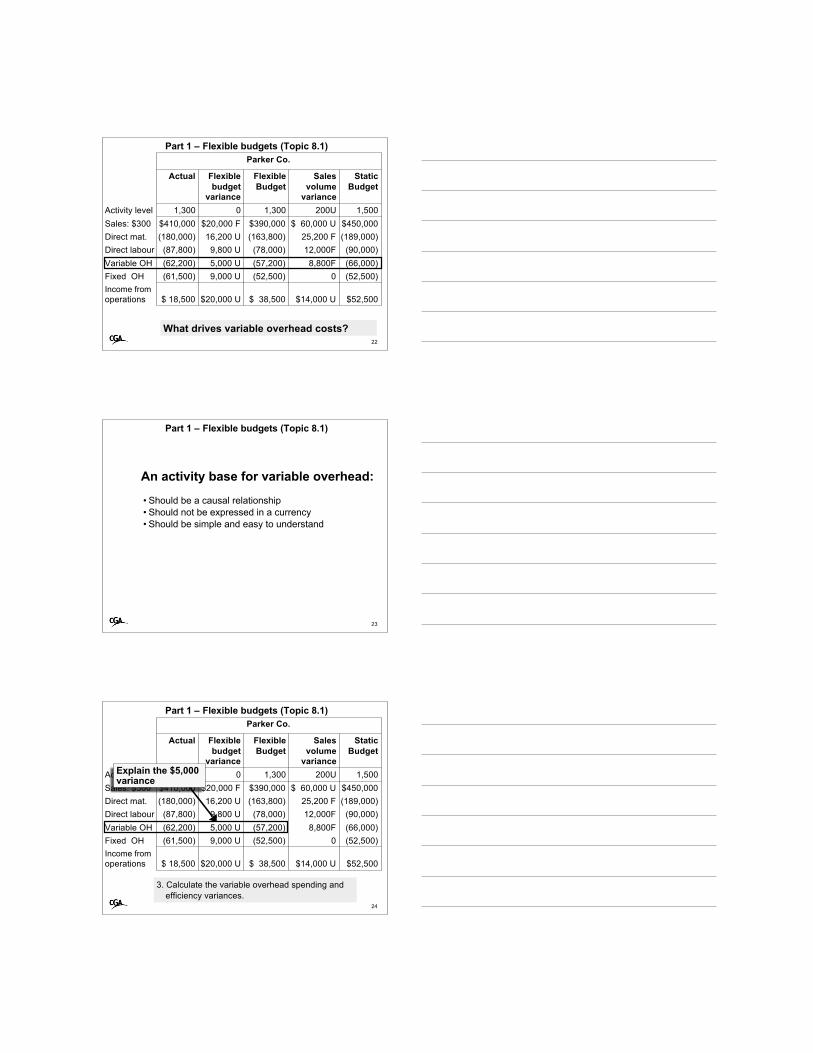
Activity level 1,300 0 1,300 200U 1,500Sales: $300 $410,000 $20,000 F $390,000 $ 60,000 U $450,000Direct mat. (180,000) 16,200 U (163,800) 25,200 F (189,000)Direct labour (87,800) 9,800 U (78,000) 12,000F (90,000)Variable OH (62,200) 5,000 U (57,200) 8,800F (66,000)Fixed OH (61,500) 9,000 U (52,500) 0 (52,500)Income fromoperations $ 18,500 $20,000 U $ 38,500 $14,000 U $52,500
What drives variable overhead costs?
Part 1 – Flexible budgets (Topic 8.1)
23
An activity base for variable overhead:
• Should be a causal relationship• Should not be expressed in a currency• Should be simple and easy to understand
Part 1 – Flexible budgets (Topic 8.1)
24
Parker Co.
Actual Flexiblebudget
variance
FlexibleBudget
Salesvolume
variance
StaticBudget
Activity level 1,300 0 1,300 200U 1,500Sales: $300 $410,000 $20,000 F $390,000 $ 60,000 U $450,000Direct mat. (180,000) 16,200 U (163,800) 25,200 F (189,000)Direct labour (87,800) 9,800 U (78,000) 12,000F (90,000)Variable OH (62,200) 5,000 U (57,200) 8,800F (66,000)Fixed OH (61,500) 9,000 U (52,500) 0 (52,500)Income fromoperations $ 18,500 $20,000 U $ 38,500 $14,000 U $52,500
Explain the $5,000variance
3. Calculate the variable overhead spending andefficiency variances.

Efficiency variance:(2) – (3)
Spending variance:(1) – (2)
25
Variable overhead variances(1)
AQ x AR$62,200(given)
(3)SQ x SR
Total variance (1)-(3)
(2)AQ x SR
Part 1 – Variable overhead variances (Topic 8.2)Prepare a variable overhead performance report using theflexible budget to show only a spending variance and to showboth spending and efficiency variances. (Level 1)
Efficiency variance:(2) – (3)
Spending variance:(1) – (2)
26
Variable overhead variances(1)
AQ x AR$62,200(given)
(3)SQ x SR
5 hours x 1,500desks x $8.80 =
$57,200
Total variance $62,200 - $57,200=$5,000 U
(2)AQ x SR
Part 1 – Variable overhead variances (Topic 8.2)
Efficiency variance:(2) – (3)
Spending variance:$62,200-68,640 =
$6,440 F
27
Variable overhead variances(1)
AQ x AR$62,200(given)
(3)SQ x SR
5 hours x 1,500desks x $8.80 =
$57,200
Total variance $62,200 - $57,200=$5,000 U
(2)AQ x SR
6 hours x 1,300desks x $8.80 =
$68,640
Part 1 – Variable overhead variances (Topic 8.2)

Efficiency variance:$68,640-57,200 =
$11,440 U
Spending variance:$62,200-68,640 =
$6,440 F
28
Variable overhead variances(1)
AQ x AR$62,200(given)
(3)SQ x SR
5 hours x 1,500desks x $8.80 =
$57,200
Total variance $62,200 - $57,200=$5,000 U
(2)AQ x SR
6 hours x 1,300desks x $8.80 =
$68,640
Part 1 – Variable overhead variances (Topic 8.2)
29
What is the significance of the:Spending variance?•If based on actual hours worked it indicates how muchshould have been spent on variable overhead.
Efficiency variance?•If based on actual hours worked it indicates how manymore resources were used as a result of inefficient use ofthe activity base. (DLH in this case)
(AQxAR)-(AQ-SR)$62,200 – (6500 hours x $8.80)
$62,200-68,640 = $6,440 F
(AQxSR)-(SQ-SR) (6500 hours x $8.80)-(7,500 hours x $8.80)
$68,640-57,200 = 11,440 U
Part 1 – Variable overhead variances (Topic 8.2)
30
Part 2Overhead rates and standard
costingFixed overhead budget and
volume variancesFull income statement variance
analysis
Topics 8.3-8.6
MA1 – MODULE 8
Part 2 – Overhead rates and standard costing (Topic 8.3)Explain the significance of the denominator activity figure indetermining the standard cost of a unit of product. (Level 1)
31
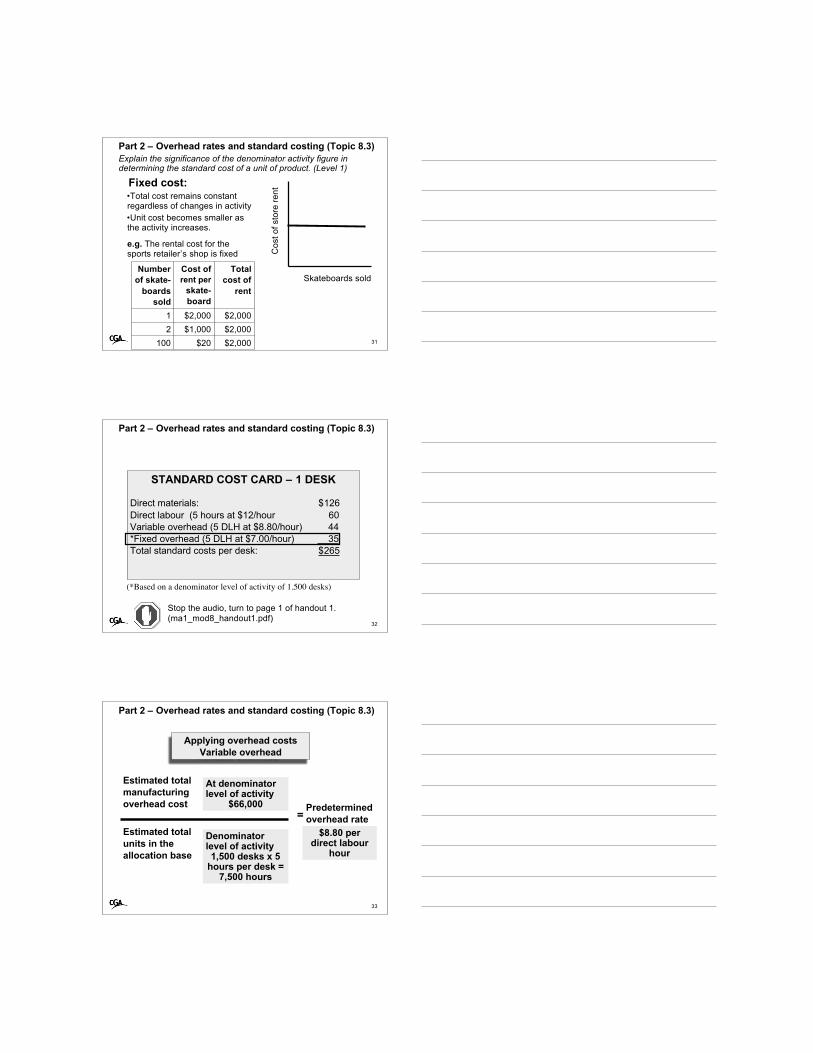
Fixed cost:•Total cost remains constantregardless of changes in activity•Unit cost becomes smaller asthe activity increases.
e.g. The rental cost for thesports retailer’s shop is fixed
Skateboards soldC
ost o
f sto
re re
ntNumber
of skate-boards
sold
Cost ofrent per
skate-board
Totalcost of
rent
1 $2,000 $2,0002 $1,000 $2,000
100 $20 $2,000
32
STANDARD COST CARD – 1 DESK
Direct materials: $126Direct labour (5 hours at $12/hour 60Variable overhead (5 DLH at $8.80/hour) 44*Fixed overhead (5 DLH at $7.00/hour) 35Total standard costs per desk: $265
(*Based on a denominator level of activity of 1,500 desks)
Part 2 – Overhead rates and standard costing (Topic 8.3)
Stop the audio, turn to page 1 of handout 1.(ma1_mod8_handout1.pdf)
Part 2 – Overhead rates and standard costing (Topic 8.3)
33
Predeterminedoverhead rate
Applying overhead costsVariable overhead
=
Estimated totalmanufacturingoverhead cost
Estimated totalunits in theallocation base
At denominatorlevel of activity
$66,000
Denominatorlevel of activity1,500 desks x 5
hours per desk =7,500 hours
$8.80 perdirect labour
hour

Part 2 – Overhead rates and standard costing (Topic 8.3)
34
Predeterminedoverhead rate
Applying overhead costsFixed overhead
=
Estimated totalmanufacturingoverhead cost
Estimated totalunits in theallocation base
At denominatorlevel of activity
$52,500
Denominatorlevel of activity1,500 desks x 5
hours per desk =7,500 hours
$7.00 perdirect labour
hour
Part 2 – Overhead rates and standard costing (Topic 8.3)
35
Applying overhead costs ina standard costing system
Fixed overhead
Manufacturing overhead
Actualcosts
incurred
Overheadapplied
Manufacturing overhead
$61,500 1,300 desks at$7 per DLH x 5hours =$45,500$16,000underapplied
Volume variance:(2)-(3)
Budget variance:(1)-(2)
36
Fixed overhead variances(1)
Actual cost$61,500
(3)AU x SQ x SR
Total variance (1)-(3)
(2)BU x SQ x SR
Budgeted units= Denominatorlevel of activity
Part 2 – Fixed overhead budget and volume variances(Topic 8.4)
Compute and properly interpret the fixed overhead budget andvolume variances. (Level 1)

Volume variance:(2)-(3)
Budget variance:(1)-(2)
37
Fixed overhead variances(1)
Actual cost$61,500
(3)AU x SQ x SR
1,300 desks x 5hours x $7=
$45,500
Total variance $61,500 - $45,500 = $16,000 U
(2)BU x SQ x SR
Budgeted units= Denominatorlevel of activity
Part 2 – Fixed overhead budget and volume variances(Topic 8.4)
Volume variance:(2)-(3)
Budget variance:(1)-(2)
38
Fixed overhead variances(1)
Actual cost$61,500
(3)AU x SQ x SR
1,300 desks x 5hours x $7=
$45,500
Total variance $61,500 - $45,500 = $16,000 U
(2)BU x SQ x SR
1,500 desks x 5hours x $7=
$52,500
Part 2 – Fixed overhead budget and volume variances(Topic 8.4)
Volume variance:(2)-(3)
Budget variance:$61,500 - $52,500 =
$9,000 U
39
Fixed overhead variances(1)
Actual cost$61,500
(3)AU x SQ x SR
1,300 desks x 5hours x $7=
$45,500
Total variance $61,500 - $45,500 = $16,000 U
(2)BU x SQ x SR
1,500 desks x 5hours x $7=
$52,500
Part 2 – Fixed overhead budget and volume variances(Topic 8.4)
More was spentthan planned

Volume variance:$52,500 - $45,500 =
$7,000 U
Budget variance:$61,500 - $52,500 =
$9,000 U
40
Fixed overhead variances(1)
Actual cost$61,500
(3)AU x SQ x SR
1,300 desks x 5hours x $7=
$45,500
Total variance $61,500 - $45,500 = $16,000 U
(2)BU x SQ x SR
1,500 desks x 5hours x $7=
$52,500
Part 2 – Fixed overhead budget and volume variances(Topic 8.4)
200 less units wereproduced and sold
Part 2 – Full income statement variance analysis (Topic 8.6)Prepare an income statement incorporating variance analysis.(Level 2)
41
Direct Materials
Direct Labour
Variable Manufacturing OH
Fixed Manufacturing OH
Variable Selling and Admin Exp.
Fixed Selling and Admin Exp.
VariableCosting
AbsorptionCosting
ProductCosts
PeriodCosts
ProductCosts
PeriodCosts
© McGraw-Hill Ryerson Limited., 2004
Product and period costs
Part 2 – Full income statement variance analysis (Topic 8.6)
42
Direct Mat.
Direct Labour
VMOH
FMOH
Variable S&A
Fixed S&A
AbsorptionCosting
ProductCosts
PeriodCosts
© McGraw-Hill Ryerson Limited., 2004
Product and period costs
Write off allvariances to cost
of goods sold
No variances.Report as period
costs

43
Income statement format – Absorption costing
Part 2 – Full income statement variance analysis (Topic 8.6)
Sales $xxxCost of goods sold (standard costs) $xxx
Writeoff variancesDirect materials price and quantity xxxDirect labour rate and efficiency xxxVariable overhead spending and efficiency xxxFixed overhead spending and volume xxx
Adjusted cost of goods sold xxxGross profit xxxVariable selling and administration xxxFixed selling and administration xxx
Net income $xxx
Part 2 – Full income statement variance analysis (Topic 8.6)
44
VariableCosting
ProductCosts
PeriodCosts
© McGraw-Hill Ryerson Limited., 2004
Product and period costs
Direct Mat.
Direct Labour
VMOH
FMOH
Variable S&A
Fixed S&A
Write off allvariances to cost
of goods sold
No variances.Report as period
costs
45
Income statement format – Variable costing
Part 2 – Full income statement variance analysis (Topic 8.6)
Sales $xxxCost of goods sold (standard costs) $xxx
Writeoff variancesDirect materials price and quantity xxxDirect labour rate and efficiency xxxVariable overhead spending and efficiency xxx
Adjusted cost of goods sold xxxVariable selling and administration xxx xxx
Contribution margin xxxFixed manufacturing overhead xxxFixed selling and administration xxx
Net income $xxx

46
Part 3
Decentralization inorganizations
Segment reporting
Topics 8.7-8.8
MA1 – MODULE 8
Part 3 – Decentralization in organizations (Topic 8.7)Differentiate between cost centres, profit centres, andinvestment centres, and explain how performance is measuredin each. (Level 2)
47
Board of directors
CEO
Westerndivision
Easterndivision
Director ofhumanresources
Consumerproducts
Industrialproducts
Consumerproducts
Industrialproducts
DecentralizationDecision making isspread throughoutthe organization
48
Segment
‘Any part or activity of an organizationabout which the manager seeks cost,revenue or profit data.’
Chapter 12, p.547
Part 3 – Decentralization in organizations (Topic 8.7)

49
Responsibilityaccounting
• Gives managers greater control over theirsegments
• Keeps decisions in the hands of people whosee and understand the problems
• Serves as a motivating tool
• Enhances employee development
• Promotes job satisfaction
• Provides a basis for evaluation
Part 3 – Decentralization in organizations (Topic 8.7)
Part 3 – Decentralization in organizations (Topic 8.7)
50
Performance is measuredbased on control over:
Investmentcentre
Costcentre
Profitcentre
Costs RevenuesInvest-ments
Part 3 – Decentralization in organizations (Topic 8.7)
51
Board of directors
CEO
Westerndivision
Easterndivision
Director ofhumanresources
Consumerproducts
Industrialproducts
Consumerproducts
Industrialproducts
Responsibility centres
Costcentre
Profit centres
Investmentcentre

Part 3 – Segment reporting (Topic 8.8)Prepare a segmented income statement using the contributionformat, and explain the difference between traceable fixed costsand common fixed costs. (Level 1)
52
Segment reporting
• Provides more information on profitability thancompany wide reports
• Can highlight problems and opportunities withinan organization
• Reduces the effects of cross subsidization• Costs not traced directly to the segment• Costs allocated using an inappropriate base
Part 3 – Segment reporting (Topic 8.8)
53
Classifying costs for segment reporting
Traceddirectly tothe segment
Variable Fixed
Variable costof goods sold
Stop the audio, turn to page 4 of handout 1.(ma1_mod8_handout1.pdf)
Part 3 – Segment reporting (Topic 8.8)
54
Classifying costs for segment reporting
Traceddirectly tothe segment
Variable Fixed
Traceable Common
Supports morethan one segmentand not traceableto any segment
• Salary of the CEO• Shared
equipment costs
Directly supportsthe segment. Canbecome commonas segments arefurther divided.• Salary of the
segment manager.
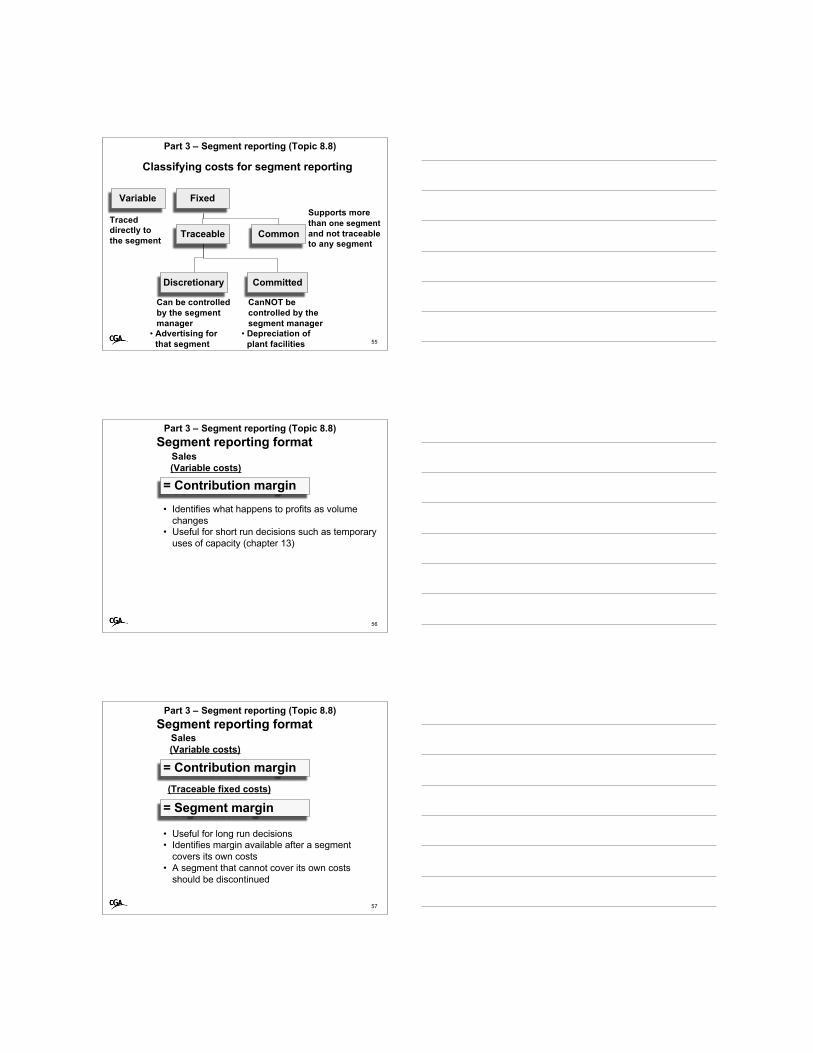
Part 3 – Segment reporting (Topic 8.8)
55
Classifying costs for segment reporting
Traceddirectly tothe segment
Variable Fixed
Common
Supports morethan one segmentand not traceableto any segment
Can be controlledby the segmentmanager
CanNOT becontrolled by thesegment manager
• Advertising forthat segment
• Depreciation ofplant facilities
Traceable
Discretionary Committed
Part 3 – Segment reporting (Topic 8.8)
56
• Identifies what happens to profits as volumechanges
• Useful for short run decisions such as temporaryuses of capacity (chapter 13)
= Contribution margin
Sales(Variable costs)
Segment reporting format
Part 3 – Segment reporting (Topic 8.8)
57
• Useful for long run decisions• Identifies margin available after a segment
covers its own costs• A segment that cannot cover its own costs
should be discontinued
= Contribution margin
Sales(Variable costs)
(Traceable fixed costs)
= Segment margin
Segment reporting format

Part 3 – Segment reporting (Topic 8.8)
58
= Contribution margin
Sales(Variable costs)
(Traceable fixed costs)
= Segment margin
• Corporate wide income
Segment reporting format
= Net income(Common costs)
Part 3 – Segment reporting (Topic 8.8)
59
Restructuring a segmented income statement
Stop the audio, and turn to problem12-16, page 592-593 and page 5 ofhandout 1.
Part 3 – Segment reporting (Topic 8.8)
60
Restructuring a segmented income statementS. Europe Mid.Europe N.Europe
Sales € 300,000 €800,000 €700,000Territorial expenses
Cost of goods sold 93,000 240,000 315,000Salaries 54,000 56,000 112,000Insurance 9,000 16,000 14,000Advertising 105,000 240,000 245,000Depreciation 21,000 32,000 28,000Shipping 15,000 32,000 42,000
Total territorial expenses 297,000 616,000 756,000Income/loss before corp.exp. 3,000 184,000 (56,000)Corporate expenses
Advertising (general) 15,000 40,000 35,000General administrative 20,000 20,000 20,000
Total corporate expenses 35,000 60,000 55,000Net operating income(loss) €(32,000) €124,000 €(111,000)
VariableCosts
problem 12-16, page 592-593

Part 3 – Segment reporting (Topic 8.8)
61
Restructuring a segmented income statementS. Europe Mid.Europe N.Europe
Sales € 300,000 €800,000 €700,000Territorial expenses
Cost of goods sold 93,000 240,000 315,000Salaries 54,000 56,000 112,000Insurance 9,000 16,000 14,000Advertising 105,000 240,000 245,000Depreciation 21,000 32,000 28,000Shipping 15,000 32,000 42,000
Total territorial expenses 297,000 616,000 756,000Income/loss before corp.exp. 3,000 184,000 (56,000)Corporate expenses
Advertising (general) 15,000 40,000 35,000General administrative 20,000 20,000 20,000
Total corporate expenses 35,000 60,000 55,000Net operating income(loss) €(32,000) €124,000 €(111,000)
Traceablefixed costs
problem 12-16, page 592-593
Part 3 – Segment reporting (Topic 8.8)
62
Restructuring a segmented income statementS. Europe Mid.Europe N.Europe
Sales € 300,000 €800,000 €700,000Territorial expenses
Cost of goods sold 93,000 240,000 315,000Salaries 54,000 56,000 112,000Insurance 9,000 16,000 14,000Advertising 105,000 240,000 245,000Depreciation 21,000 32,000 28,000Shipping 15,000 32,000 42,000
Total territorial expenses 297,000 616,000 756,000Income/loss before corp.exp. 3,000 184,000 (56,000)Corporate expenses
Advertising (general) 15,000 40,000 35,000General administrative 20,000 20,000 20,000
Total corporate expenses 35,000 60,000 55,000Net operating income(loss) €(32,000) €124,000 €(111,000)
Commonfixed costs
problem 12-16, page 592-593
Part 3 – Segment reporting (Topic 8.8)
63
SOLUTION - In €s Total S. Eur. Mid.Eur.
N.Eur.Sales 1,800,000 300,000 800,000 700,000Less variable expenses:
Cost of goods sold 648,000 93,000 240,000 315,000Shipping expense 89,000 15,000 32,000 42,000
Total variable expenses 737,000 108,000 272,000 357,000Contribution margin 1,063,000 192,000 528,000 343,000
VariableCosts
problem 12-16, handout 1 page 5
Part 3 – Segment reporting (Topic 8.8)
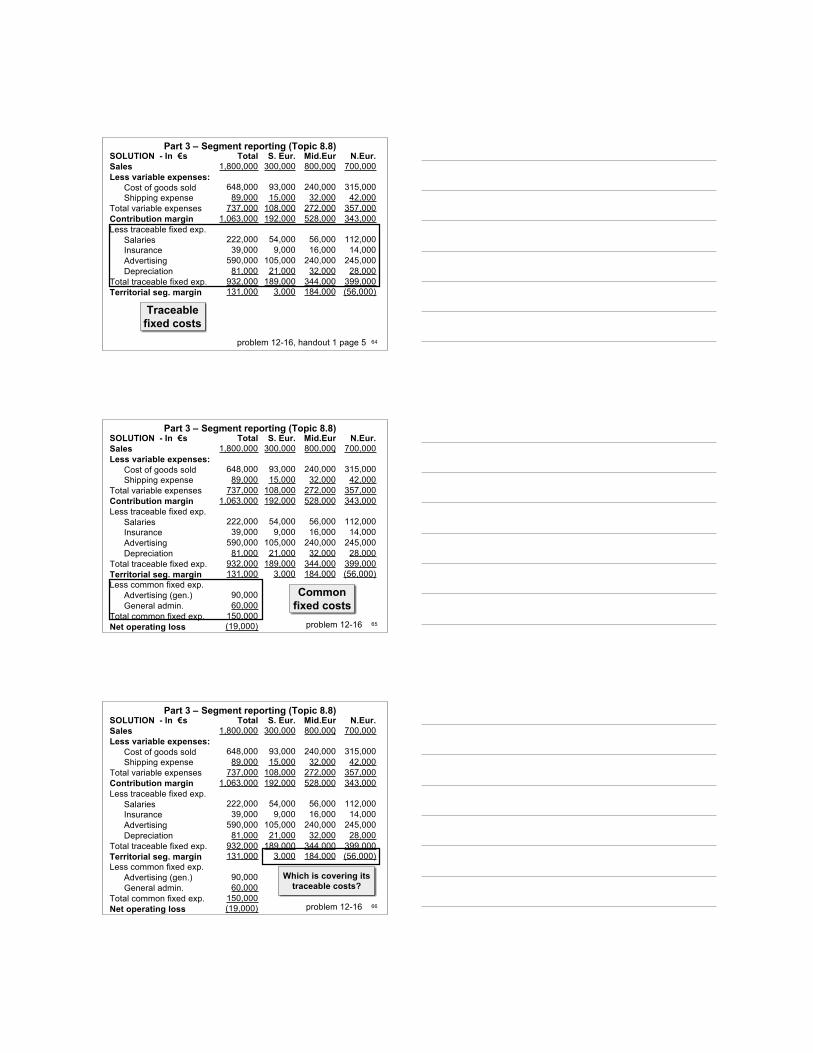
64
SOLUTION - In €s Total S. Eur. Mid.Eur.
N.Eur.Sales 1,800,000 300,000 800,000 700,000Less variable expenses:
Cost of goods sold 648,000 93,000 240,000 315,000Shipping expense 89,000 15,000 32,000 42,000
Total variable expenses 737,000 108,000 272,000 357,000Contribution margin 1,063,000 192,000 528,000 343,000Less traceable fixed exp.
Salaries 222,000 54,000 56,000 112,000Insurance 39,000 9,000 16,000 14,000Advertising 590,000 105,000 240,000 245,000Depreciation 81,000 21,000 32,000 28,000
Total traceable fixed exp. 932,000 189,000 344,000 399,000Territorial seg. margin 131,000 3,000 184,000 (56,000)
Traceablefixed costs
problem 12-16, handout 1 page 5
Part 3 – Segment reporting (Topic 8.8)
65
SOLUTION - In €s Total S. Eur. Mid.Eur.
N.Eur.Sales 1,800,000 300,000 800,000 700,000Less variable expenses:
Cost of goods sold 648,000 93,000 240,000 315,000Shipping expense 89,000 15,000 32,000 42,000
Total variable expenses 737,000 108,000 272,000 357,000Contribution margin 1,063,000 192,000 528,000 343,000Less traceable fixed exp.
Salaries 222,000 54,000 56,000 112,000Insurance 39,000 9,000 16,000 14,000Advertising 590,000 105,000 240,000 245,000Depreciation 81,000 21,000 32,000 28,000
Total traceable fixed exp. 932,000 189,000 344,000 399,000Territorial seg. margin 131,000 3,000 184,000 (56,000)Less common fixed exp.
Advertising (gen.) 90,000General admin. 60,000
Total common fixed exp. 150,000Net operating loss (19,000)
Commonfixed costs
problem 12-16
Part 3 – Segment reporting (Topic 8.8)
66
SOLUTION - In €s Total S. Eur. Mid.Eur.
N.Eur.Sales 1,800,000 300,000 800,000 700,000Less variable expenses:
Cost of goods sold 648,000 93,000 240,000 315,000Shipping expense 89,000 15,000 32,000 42,000
Total variable expenses 737,000 108,000 272,000 357,000Contribution margin 1,063,000 192,000 528,000 343,000Less traceable fixed exp.
Salaries 222,000 54,000 56,000 112,000Insurance 39,000 9,000 16,000 14,000Advertising 590,000 105,000 240,000 245,000Depreciation 81,000 21,000 32,000 28,000
Total traceable fixed exp. 932,000 189,000 344,000 399,000Territorial seg. margin 131,000 3,000 184,000 (56,000)Less common fixed exp.
Advertising (gen.) 90,000General admin. 60,000
Total common fixed exp. 150,000Net operating loss (19,000)
Which is covering itstraceable costs?
problem 12-16

Part 3 – Segment reporting (Topic 8.8)
67
SOLUTION - In €s Total S. Eur. Mid.Eur. N.Eur.Sales 1,800,000 300,000 800,000 700,000Less variable expenses:
Cost of goods sold 648,000 93,000 240,000 315,000Shipping expense 89,000 15,000 32,000 42,000
Total variable expenses 737,000 108,000 272,000 357,000Contribution margin 1,063,000 192,000 528,000 343,000Less traceable fixed exp.
Salaries 222,000 54,000 56,000 112,000Insurance 39,000 9,000 16,000 14,000Advertising 590,000 105,000 240,000 245,000Depreciation 81,000 21,000 32,000 28,000
Total traceable fixed exp. 932,000 189,000 344,000 399,000Territorial seg. margin 131,000 3,000 184,000 (56,000)Less common fixed exp.
Advertising (gen.) 90,000General admin. 60,000
Total common fixed exp. 150,000Net operating loss (19,000) problem 12-16
S. Europe sales are lowerthan mid. Europe, however,
salaries are comparable
Part 3 – Segment reporting (Topic 8.8)
68
SOLUTION - In €s Total S. Eur. Mid.Eur.
N.Eur.Sales 1,800,000 300,000 800,000 700,000Less variable expenses:
Cost of goods sold 648,000 93,000 240,000 315,000Shipping expense 89,000 15,000 32,000 42,000
Total variable expenses 737,000 108,000 272,000 357,000Contribution margin 1,063,000 192,000 528,000 343,000Less traceable fixed exp.
Salaries 222,000 54,000 56,000 112,000Insurance 39,000 9,000 16,000 14,000Advertising 590,000 105,000 240,000 245,000Depreciation 81,000 21,000 32,000 28,000
Total traceable fixed exp. 932,000 189,000 344,000 399,000Territorial seg. margin 131,000 3,000 184,000 (56,000)Less common fixed exp.
Advertising (gen.) 90,000General admin. 60,000
Total common fixed exp. 150,000Net operating loss (19,000) problem 12-16
S. Europe spends less onadvertising than mid. Europe.Is this a reason for low sales?
Part 3 – Segment reporting (Topic 8.8)
69
SOLUTION - In €s Total S. Eur. Mid.Eur.
N.Eur.Sales 1,800,000 300,000 800,000 700,000Less variable expenses:
Cost of goods sold 648,000 93,000 240,000 315,000Shipping expense 89,000 15,000 32,000 42,000
Total variable expenses 737,000 108,000 272,000 357,000Contribution margin 1,063,000 192,000 528,000 343,000Less traceable fixed exp.
Salaries 222,000 54,000 56,000 112,000Insurance 39,000 9,000 16,000 14,000Advertising 590,000 105,000 240,000 245,000Depreciation 81,000 21,000 32,000 28,000
Total traceable fixed exp. 932,000 189,000 344,000 399,000Territorial seg. margin 131,000 3,000 184,000 (56,000)Less common fixed exp.
Advertising (gen.) 90,000General admin. 60,000
Total common fixed exp. 150,000Net operating loss (19,000) problem 12-16
N. Europe spends twiceas much on sales
salaries as Mid. Europe

Part 3 – Segment reporting (Topic 8.8)
70
SOLUTION - In €s Total S. Eur. Mid.Eur. N.Eur.Sales 100 100 100 100Less variable expenses:
Cost of goods sold 36 31 30 45Shipping expense 5 5 4 6
Total variable expenses 41 36 34 51Contribution margin 59 64 66 49Less traceable fixed exp.
Salaries 12 18 7 16Insurance 2 3 2 2Advertising 33 35 30 35Depreciation 5 7 4 4
Total traceable fixed exp. 52 63 43 57Territorial seg. margin 7 1 23 (8)Less common fixed exp.
Advertising (gen.) 5General admin. 3
Total common fixed exp. 8Net operating loss (1)
N. Europe’scontribution
margin is lowerproblem 12-16
Part 3 – Segment reporting (Topic 8.8)
71
SOLUTION - In €s Total S. Eur. Mid.Eur.
N.Eur.Sales 100 100 100 100Less variable expenses:
Cost of goods sold 36 31 30 45Shipping expense 5 5 4 6
Total variable expenses 41 36 34 51Contribution margin 59 64 66 49Less traceable fixed exp.
Salaries 12 18 7 16Insurance 2 3 2 2Advertising 33 35 30 35Depreciation 5 7 4 4
Total traceable fixed exp. 52 63 43 57Territorial seg. margin 7 1 23 (8)Less common fixed exp.
Advertising (gen.) 5General admin. 3
Total common fixed exp. 8Net operating loss (1)
N. Europe is notcovering its
traceable costs
problem 12-16
72
Part 4
Revenue variance andmarket expense
analysis
Topic 8.9
MA1 – MODULE 8
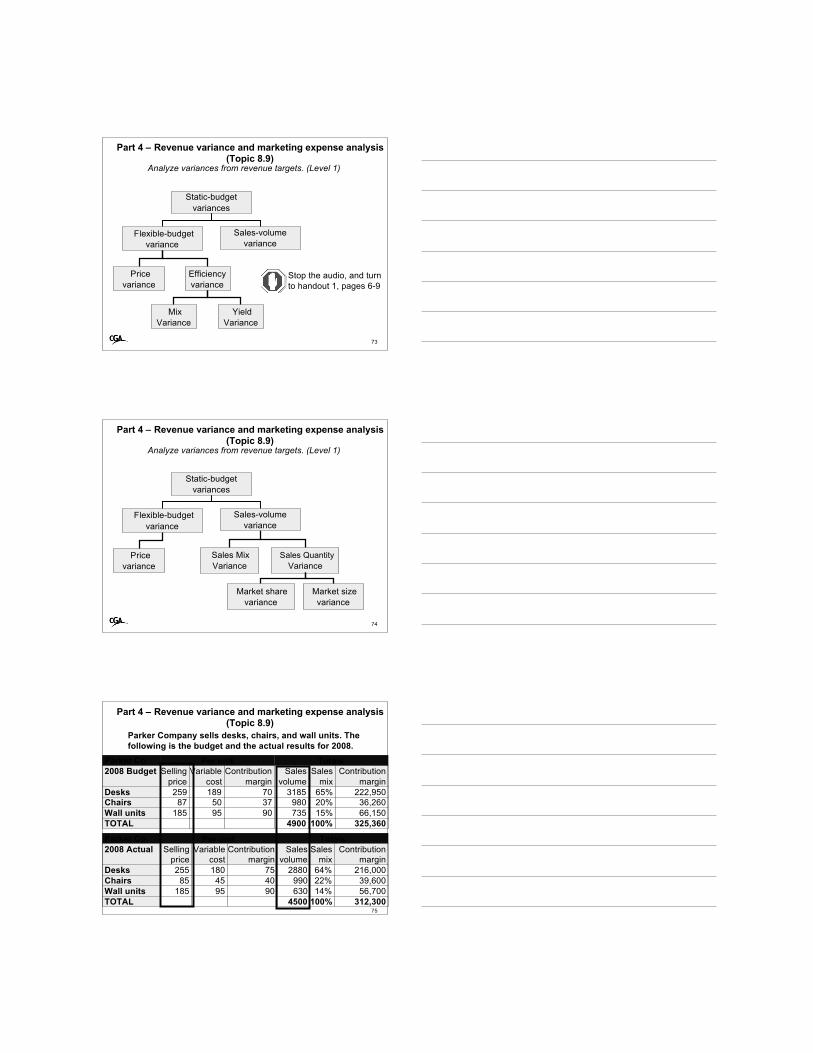
Part 4 – Revenue variance and marketing expense analysis(Topic 8.9)
Analyze variances from revenue targets. (Level 1)
73
Static-budgetvariances
Flexible-budgetvariance
Sales-volumevariance
Pricevariance
Efficiency variance
MixVariance
YieldVariance
Stop the audio, and turnto handout 1, pages 6-9
Part 4 – Revenue variance and marketing expense analysis(Topic 8.9)
Analyze variances from revenue targets. (Level 1)
74
Sales MixVariance
Sales QuantityVariance
Market sharevariance
Market sizevariance
Static-budgetvariances
Flexible-budgetvariance
Sales-volumevariance
Pricevariance
Part 4 – Revenue variance and marketing expense analysis(Topic 8.9)
75
Parker Co. Per unit Totals2008 Budget Selling
priceVariable
costContribution
marginSales
volumeSales
mixContribution
marginDesks 259 189 70 3185 65% 222,950Chairs 87 50 37 980 20% 36,260Wall units 185 95 90 735 15% 66,150TOTAL 4900 100% 325,360
Parker Co. Per unit Totals2008 Actual Selling
priceVariable
costContribution
marginSales
volumeSales
mixContribution
marginDesks 255 180 75 2880 64% 216,000Chairs 85 45 40 990 22% 39,600Wall units 185 95 90 630 14% 56,700TOTAL 4500 100% 312,300
Parker Company sells desks, chairs, and wall units. Thefollowing is the budget and the actual results for 2008.

Part 4 – Revenue variance and marketing expense analysis(Topic 8.9)
76
Sales MixVariance
Sales QuantityVariance
Market sharevariance
Market sizevariance
Static-budgetvariances
Flexible-budgetvariance
Sales-volumevariance
Pricevariance
Part 4 – Revenue variance and marketing expense analysis(Topic 8.9)
77
Parker Co. - Static BudgetActual
ResultsStatic
BudgetStatic Budget
VarianceDesks 734,400 824,915 90,515 UChairs 84,150 85,260 1,110 UWall units 116,550 135,975 19,425 UTOTAL 935,100 1,046,150 111,050 U
How much of the variance is due to the factthat they sold less and how much of it is dueto the fact that the selling price has changed?
1. Prepare the static budget
Part 4 – Revenue variance and marketing expense analysis(Topic 8.9)
78

2. Prepare the flexible budget
Part 4 – Revenue variance and marketing expense analysis(Topic 8.9)
79
Parker Co.Flexible and Sales volume variances
ActualResults
FlexibleBudget/Price
Variance
FlexibleBudget
SalesVolume
Variance
StaticBudget
Desks 734,400 745,920 824,915Chairs 84,150 86,130 85,260Wall units 116,550 116,550 135,975TOTAL 935,100 948,600 1,046,150
Bud.sell.price Act.unitsDesks $259 x 2880 = $745,920Chairs $87 x 990 = $86,130Wall units $185 x 630 = $116,550
2. Prepare the flexible budget
Part 4 – Revenue variance and marketing expense analysis(Topic 8.9)
80
Parker Co.Flexible and Sales volume variances
ActualResults
FlexibleBudget/Price
Variance
FlexibleBudget
SalesVolume
Variance
StaticBudget
Desks 734,400 11,520U 745,920 78,995U 824,915Chairs 84,150 1,980U 86,130 870 F 85,260Wall units 116,550 0 116,550 19,425 U 135,975TOTAL 935,100 13,500 U 948,600 97,550 U 1,046,150
Sales price variance
2. Prepare the flexible budget
Part 4 – Revenue variance and marketing expense analysis(Topic 8.9)
81
How much of this variance is due to a change in the salesmix of the three products and how much of it is due to anoverall change in the number of units sold?This next analysis will be based on contribution margin
Parker Co.Flexible and Sales volume variances
ActualResults
FlexibleBudget/Price
Variance
FlexibleBudget
SalesVolume
Variance
StaticBudget
Desks 734,400 11,520U 745,920 78,995U 824,915Chairs 84,150 1,980U 86,130 870 F 85,260Wall units 116,550 0 116,550 19,425 U 135,975TOTAL 935,100 13,500 U 948,600 97,550 U 1,046,150

Part 4 – Revenue variance and marketing expense analysis(Topic 8.9)
82
Sales MixVariance
Sales QuantityVariance
Market sharevariance
Market sizevariance
Static-budgetvariances
Flexible-budgetvariance
Sales-volumevariance
Pricevariance
3. Prepare the sales mix and sales quantity variances
Part 4 – Revenue variance and marketing expense analysis(Topic 8.9)
83
Based on contribution margin:Act.sls. CM
Desks: 2880 x $70 = $201,600Chairs: 990 x $37 = $36,630Wall units: 630 x $90 = $56,700TOTAL $294,930
Parker Co.Flexible and Sales volume variances
ActualResults
FlexibleBudget/Price
Variance
FlexibleBudget
SalesVolume
Variance
StaticBudget
Desks 734,400 11,520U 745,920 78,995U 824,915Chairs 84,150 1,980U 86,130 870 F 85,260Wall units 116,550 0 116,550 19,425 U 135,975TOTAL 935,100 13,500 U 948,600 97,550 U 1,046,150
$325,360
3. Prepare the sales mix and sales quantity variances
Part 4 – Revenue variance and marketing expense analysis(Topic 8.9)
84
Desks: 4500 x 65% x $70= $204,750Chairs 4500 x 20% x $37 = $33,300Wall units 4500 x 15% x $90 = $60,750
Parker Co.Sales Mix and Sales Quantity Variances
Bud.sls.mix
Flexiblebudget
Sls. mixvariance
Act. unitsx bud.
sls. mix xbud. CM
Salesquantityvariance
Staticbudget
Desks 65% 201,600 204,750 222,950Chairs 20% 36,630 33,300 36,260Wall units 15% 56,700 60,750 66,150TOTAL 100% 294,930 298,800 325,360
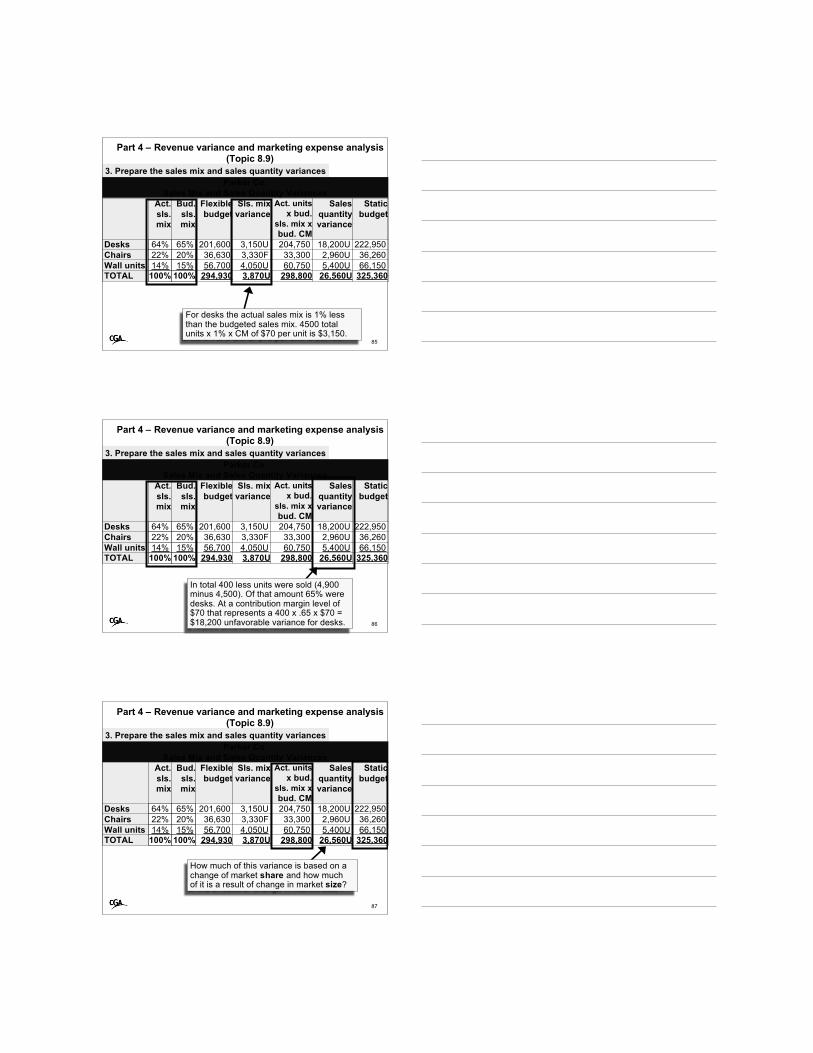
3. Prepare the sales mix and sales quantity variances
Part 4 – Revenue variance and marketing expense analysis(Topic 8.9)
85
For desks the actual sales mix is 1% lessthan the budgeted sales mix. 4500 totalunits x 1% x CM of $70 per unit is $3,150.
Parker Co.Sales Mix and Sales Quantity Variances
Act.sls.mix
Bud.sls.mix
Flexiblebudget
Sls. mixvariance
Act. unitsx bud.
sls. mix xbud. CM
Salesquantityvariance
Staticbudget
Desks 64% 65% 201,600 3,150U 204,750 18,200U 222,950Chairs 22% 20% 36,630 3,330F 33,300 2,960U 36,260Wall units 14% 15% 56,700 4,050U 60,750 5,400U 66,150TOTAL 100% 100% 294,930 3,870U 298,800 26,560U 325,360
3. Prepare the sales mix and sales quantity variances
Part 4 – Revenue variance and marketing expense analysis(Topic 8.9)
86
In total 400 less units were sold (4,900minus 4,500). Of that amount 65% weredesks. At a contribution margin level of$70 that represents a 400 x .65 x $70 =$18,200 unfavorable variance for desks.
Parker Co.Sales Mix and Sales Quantity Variances
Act.sls.mix
Bud.sls.mix
Flexiblebudget
Sls. mixvariance
Act. unitsx bud.
sls. mix xbud. CM
Salesquantityvariance
Staticbudget
Desks 64% 65% 201,600 3,150U 204,750 18,200U 222,950Chairs 22% 20% 36,630 3,330F 33,300 2,960U 36,260Wall units 14% 15% 56,700 4,050U 60,750 5,400U 66,150TOTAL 100% 100% 294,930 3,870U 298,800 26,560U 325,360
3. Prepare the sales mix and sales quantity variances
Part 4 – Revenue variance and marketing expense analysis(Topic 8.9)
87
How much of this variance is based on achange of market share and how muchof it is a result of change in market size?
Parker Co.Sales Mix and Sales Quantity Variances
Act.sls.mix
Bud.sls.mix
Flexiblebudget
Sls. mixvariance
Act. unitsx bud.
sls. mix xbud. CM
Salesquantityvariance
Staticbudget
Desks 64% 65% 201,600 3,150U 204,750 18,200U 222,950Chairs 22% 20% 36,630 3,330F 33,300 2,960U 36,260Wall units 14% 15% 56,700 4,050U 60,750 5,400U 66,150TOTAL 100% 100% 294,930 3,870U 298,800 26,560U 325,360

Part 4 – Revenue variance and marketing expense analysis(Topic 8.9)
88
Sales MixVariance
Sales QuantityVariance
Market sharevariance
Market sizevariance
Static-budgetvariances
Flexible-budgetvariance
Sales-volumevariance
Pricevariance
Part 4 – Revenue variance and marketing expense analysis(Topic 8.9)
89
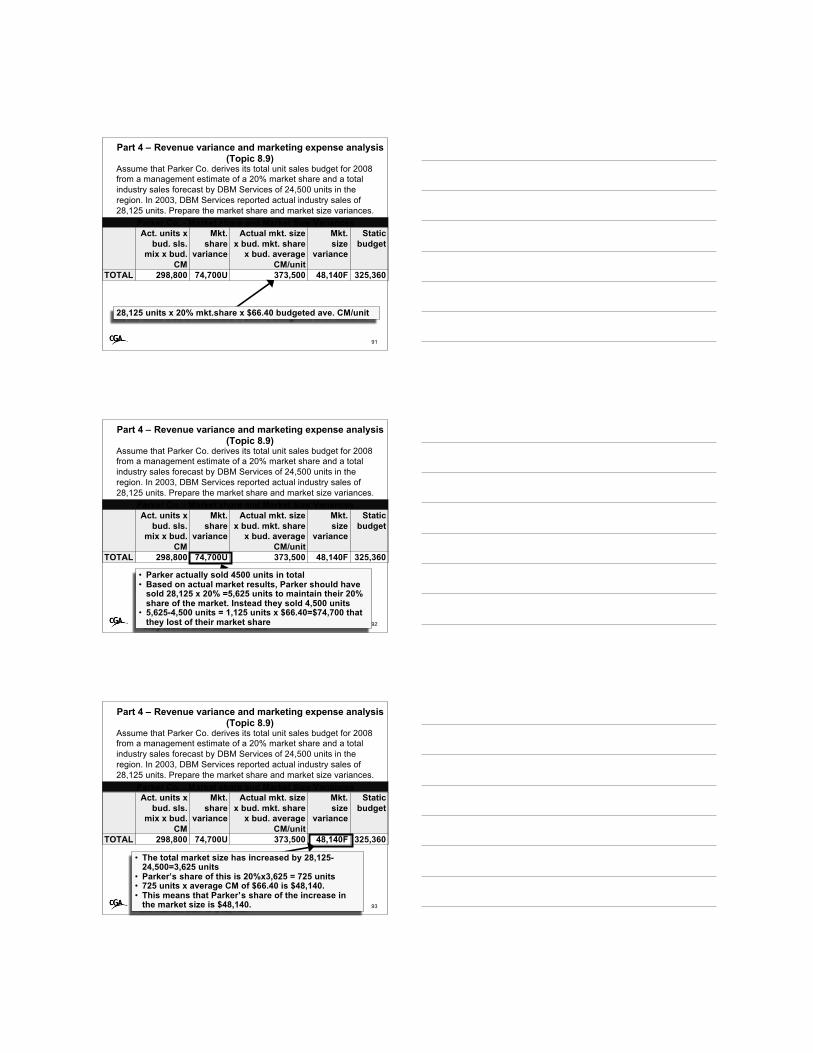
Assume that Parker Co. derives its total unit sales budget for 2008from a management estimate of a 20% market share and a totalindustry sales forecast by DBM Services of 24,500 units in theregion. In 2003, DBM Services reported actual industry sales of28,125 units. Prepare the market share and market size variances.
Parker Co. - Market share and Market Size VariancesAct. units x
bud. sls.mix x bud.
CM
Mkt.share
variance
Actual mkt. sizex bud. mkt. share
x bud. averageCM/unit
Mkt.size
variance
Staticbudget
TOTAL 298,800 325,360
Part 4 – Revenue variance and marketing expense analysis(Topic 8.9)
90
Budgeted average CM:Desks: $70x3185units=$222,950Chairs: $37x980 units=$ 36,260Wall units: $90x735 units=$ 66,150 TOTAL $325,360/4900 units=$66.40
Assume that Parker Co. derives its total unit sales budget for 2008from a management estimate of a 20% market share and a totalindustry sales forecast by DBM Services of 24,500 units in theregion. In 2003, DBM Services reported actual industry sales of28,125 units. Prepare the market share and market size variances.
Parker Co. - Market share and Market Size VariancesAct. units x
bud. sls.mix x bud.
CM
Mkt.share
variance
Actual mkt. sizex bud. mkt. share
x bud. averageCM/unit
Mkt.size
variance
Staticbudget
TOTAL 298,800 74,700U 373,500 48,140F 325,360
Part 4 – Revenue variance and marketing expense analysis(Topic 8.9)
91
28,125 units x 20% mkt.share x $66.40 budgeted ave. CM/unit
Assume that Parker Co. derives its total unit sales budget for 2008from a management estimate of a 20% market share and a totalindustry sales forecast by DBM Services of 24,500 units in theregion. In 2003, DBM Services reported actual industry sales of28,125 units. Prepare the market share and market size variances.
Parker Co. - Market share and Market Size VariancesAct. units x
bud. sls.mix x bud.
CM
Mkt.share
variance
Actual mkt. sizex bud. mkt. share
x bud. averageCM/unit
Mkt.size
variance
Staticbudget
TOTAL 298,800 74,700U 373,500 48,140F 325,360
Part 4 – Revenue variance and marketing expense analysis(Topic 8.9)
92
Assume that Parker Co. derives its total unit sales budget for 2008from a management estimate of a 20% market share and a totalindustry sales forecast by DBM Services of 24,500 units in theregion. In 2003, DBM Services reported actual industry sales of28,125 units. Prepare the market share and market size variances.
Parker Co. - Market share and Market Size VariancesAct. units x
bud. sls.mix x bud.
CM
Mkt.share
variance
Actual mkt. sizex bud. mkt. share
x bud. averageCM/unit
Mkt.size
variance
Staticbudget
TOTAL 298,800 74,700U 373,500 48,140F 325,360
• Parker actually sold 4500 units in total• Based on actual market results, Parker should have
sold 28,125 x 20% =5,625 units to maintain their 20%share of the market. Instead they sold 4,500 units
• 5,625-4,500 units = 1,125 units x $66.40=$74,700 thatthey lost of their market share
Part 4 – Revenue variance and marketing expense analysis(Topic 8.9)
93
Assume that Parker Co. derives its total unit sales budget for 2008from a management estimate of a 20% market share and a totalindustry sales forecast by DBM Services of 24,500 units in theregion. In 2003, DBM Services reported actual industry sales of28,125 units. Prepare the market share and market size variances.
Parker Co. - Market share and Market Size VariancesAct. units x
bud. sls.mix x bud.
CM
Mkt.share
variance
Actual mkt. sizex bud. mkt. share
x bud. averageCM/unit
Mkt.size
variance
Staticbudget
TOTAL 298,800 74,700U 373,500 48,140F 325,360
• The total market size has increased by 28,125-24,500=3,625 units
• Parker’s share of this is 20%x3,625 = 725 units• 725 units x average CM of $66.40 is $48,140.• This means that Parker’s share of the increase in
the market size is $48,140.

94
Part 5
Rate of return andresidual income
Topic 8.10
MA1 – MODULE 8
Part 5 – Rate of return and residual income (Topic 8.10)Compute and interpret the return on investment and residualincome and list the strengths and weaknesses of each method.(Level 1)
95
Return oninvestment
(ROI)
Measuring performance ofinvestment centres
Net operating income Sales Sales Average operating
assets
x
MarginManagement’s abilityto control expenses inrelation to sales
TurnoverAmount of salesgenerated by theinvestment in assets
Part 5 – Rate of return and residual income (Topic 8.10)Compute and interpret the return on investment and residualincome and list the strengths and weaknesses of each method.(Level 1)
96
Return oninvestment
(ROI)
Measuring performance ofinvestment centres
• Percentages are easy to understand andcompare with other divisions/companies
• Forces control of investments in assets and costs• Includes major ingredients of profitability
Advantages
Disadvantages• May encourage short run increases in ROI or
changes that are inconsistent with strategies• A manager may not be able to control
committed costs• Ignores product quality• May reject profitable investment opportunities to
maximize ROI
Part 5 – Rate of return and residual income (Topic 8.10)Compute and interpret the return on investment and residualincome and list the strengths and weaknesses of each method.(Level 1)
97
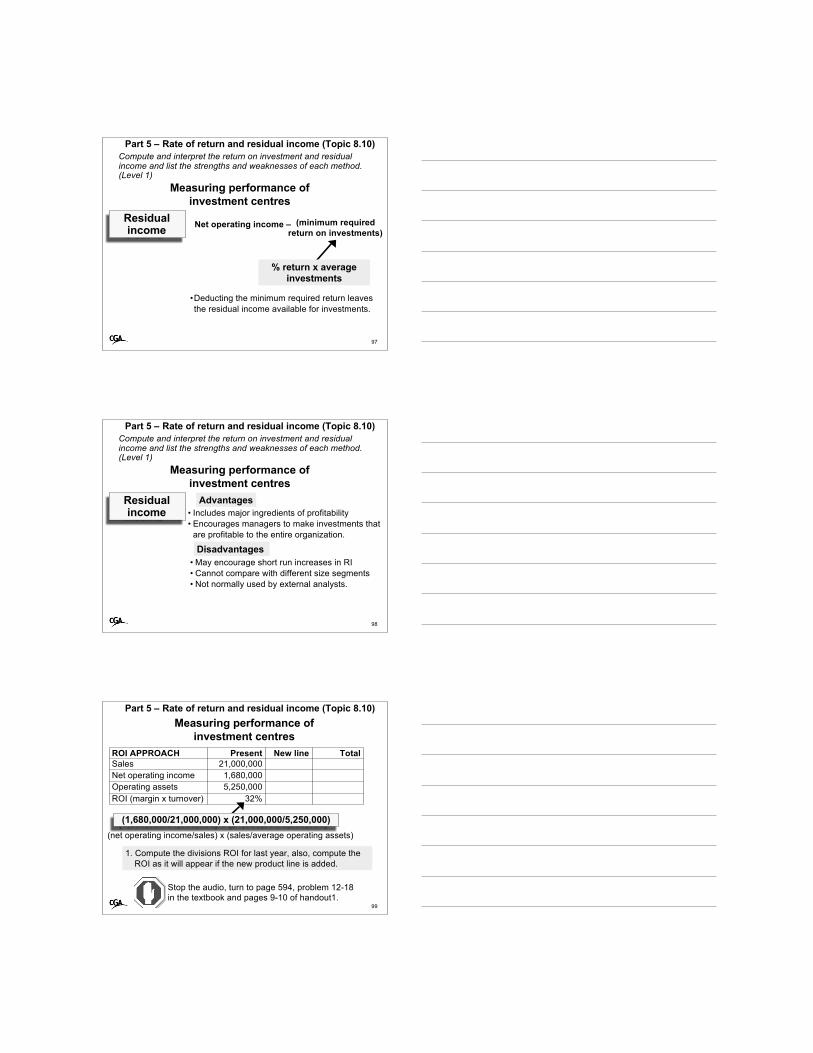
Residualincome
Measuring performance ofinvestment centres
Net operating income – (minimum requiredreturn on investments)
% return x averageinvestments
•Deducting the minimum required return leavesthe residual income available for investments.
Part 5 – Rate of return and residual income (Topic 8.10)Compute and interpret the return on investment and residualincome and list the strengths and weaknesses of each method.(Level 1)
98
Measuring performance ofinvestment centres
• Includes major ingredients of profitability• Encourages managers to make investments that
are profitable to the entire organization.
Advantages
Disadvantages• May encourage short run increases in RI• Cannot compare with different size segments• Not normally used by external analysts.
Residualincome
ROI APPROACH Present New line TotalSales 21,000,000Net operating income 1,680,000Operating assets 5,250,000ROI (margin x turnover) 32%
Part 5 – Rate of return and residual income (Topic 8.10)
99
Measuring performance ofinvestment centres
Stop the audio, turn to page 594, problem 12-18in the textbook and pages 9-10 of handout1.
(1,680,000/21,000,000) x (21,000,000/5,250,000)(net operating income/sales) x (sales/average operating assets)
1. Compute the divisions ROI for last year, also, compute theROI as it will appear if the new product line is added.

ROI APPROACH Present New line TotalSales 21,000,000 9,000,000Net operating income 1,680,000 630,000*Operating assets 5,250,000 3,000,000ROI (margin x turnover) 32% 21%
Part 5 – Rate of return and residual income (Topic 8.10)
100
Measuring performance ofinvestment centres
(630,000/9,000,000) x (9,000,000/3,000,000)
*(9,000,000-(65% of 9,000,000)-2,520,000)
Problem 12-18, page 594
1. Compute the divisions ROI for last year, also, compute theROI as it will appear if the new product line is added.
(net operating income/sales) x (sales/average operating assets)
ROI APPROACH Present New line TotalSales 21,000,000 9,000,000 30,000,000Net operating income 1,680,000 630,000 2,310,000Operating assets 5,250,000 3,000,000 8,250,000ROI (margin x turnover) 32% 21% 28%
Part 5 – Rate of return and residual income (Topic 8.10)
101
Measuring performance ofinvestment centres
(2,310,000/30,000,000) x (30,000,000/8,250,000)
Problem 12-18, page 594
(net operating income/sales) x (sales/average operating assets)
1. Compute the divisions ROI for last year, also, compute theROI as it will appear if the new product line is added.
Part 5 – Rate of return and residual income (Topic 8.10)
102
Measuring performance ofinvestment centres
2. Fred has no incentive to accept theinvestment if it will reduce his ROI from32% to 28%.
3. Yet it will increase the company’s overallROI of 18%
ROI APPROACH Present New line TotalSales 21,000,000 9,000,000 30,000,000Net operating income 1,680,000 630,000 2,310,000Operating assets 5,250,000 3,000,000 8,250,000ROI (margin x turnover) 32% 21% 28%
Problem 12-18, page 594

Part 5 – Rate of return and residual income (Topic 8.10)
103
Measuring performance ofinvestment centres
RESIDUAL INCOME APPROACH Present New line TotalNet operating income $1,680,000Minimum net operating income 787,500Residual income $ 892,500
Problem 12-18, page 594
Operating assets x minimum rate of return(5,250,000 x 15%)
4. a. Compute the East Division’s residual income for lastyear, also compute the residual income as it will appear ifthe new product line is added
Part 5 – Rate of return and residual income (Topic 8.10)
104
Measuring performance ofinvestment centres
RESIDUAL INCOME APPROACH Present New line TotalNet operating income $1,680,000 $ 630,000Minimum net operating income 787,500 450,000Residual income $ 892,500 $ 180,000
Problem 12-18, page 594
Operating assets x minimum rate of return(3,000,000 x 15%)
4. a. Compute the East Division’s residual income for lastyear, also compute the residual income as it will appear ifthe new product line is added
Part 5 – Rate of return and residual income (Topic 8.10)
105
Measuring performance ofinvestment centres
RESIDUAL INCOME APPROACH Present New line TotalNet operating income $1,680,000 $ 630,000 $2,310,000Minimum net operating income 787,500 450,000 1,237,500Residual income $ 892,500 $ 180,000 $1,072,500
Problem 12-18, page 594
Operating assets x minimum rate of return(8,250,000 x 15%)
4. a. Compute the East Division’s residual income for lastyear, also compute the residual income as it will appear ifthe new product line is added

Part 5 – Rate of return and residual income (Topic 8.10)
106
Measuring performance ofinvestment centres
RESIDUAL INCOME APPROACH Present New line TotalNet operating income $1,680,000 $ 630,000 $2,310,000Minimum net operating income 787,500 450,000 1,237,500Residual income $ 892,500 $ 180,000 $1,072,500
Problem 12-18, page 594
4.b. Using this approach, Fred is inclined to acceptthe project because it will increase the EastDivision’s residual income.
107
Part 6
Review question:Variance analysis – workingbackward from variance data
(download the additional questions handout: ma1_mod8_handout1.pdf)
MA1 – MODULE 8
108
Case 11-27 pages 538-539Handout page 11
1. How many units were produced last period?2. How many metres of direct materials were
purchased and used?3. What was the actual cost per metre of material?4. How many actual direct labour hours were worked?
Part 6 – Review question: Variance analysis – workingbackward from variance data
Stop the audio, read and attempt thequestion in the textbook then come back tolisten to the solution.

109
Case 11-27 pages 538-539Handout page 11
5. What was the actual rate per direct labour hour?6. How much actual variable manufacturing overhead
cost was incurred?7. What is the total fixed manufacturing overhead
cost in the flexible budget?8. What were the denominator hours for last period?
Part 6 – Review question: Variance analysis – workingbackward from variance data
110
Part 7
Review question:Segmented statements;
Product-line analysis
(download the additional questions handout: ma1_mod8_handout1.pdf)
MA1 – MODULE 8
111
Case 12-31 pages 604-605Handout pages 12 and 13
1. Prepare a new income statement segmented byproduct lines
2. Do you agree with Aiken’s decision to cut backproduction of line A?
3. What points would you make for or againstelimination of line C?
Part 7 – Review question: Segmented statements
Stop the audio, read and attempt thequestion in the textbook then come back tolisten to the solution.

112
Case 12-31 pages 604-605Handout pages 12 and 13
4. a. Prepare a segmented income statement showingline C segmented by markets
b. What points revealed by this statement wouldyou want to bring to the attention of management?
Part 7 – Review question: Segmented statements
113
Part 8
Review question:Segmented statement analysis:
ROI and residual income
(download the additional questions handout: ma1_mod8_handout1.pdf)
MA1 – MODULE 8
114
Question 1 March, 1992 examHandout pages 14 thru 15
Q1 By employing as many different measures as youcan, demonstrate which of Divisions A, B, or C hasperformed the best in 1991
Interpret the results
Part 8 – Review question: Segmented statement analysis:ROI and residual income
Stop the audio, read and attempt thequestion in the handout then come back tolisten to the solution.
115
Question 1 March, 1992 examHandout pages 14 thru 15
Q1 By employing as many different measures as youcan, demonstrate which of Divisions A, B, or C hasperformed the best in 1991
Interpret the results
Part 8 – Review question: Segmented statement analysis:ROI and residual income
116
Question 1 March, 1992 examHandout pages 14 thru 15
Q1 By employing as many different measures as youcan, demonstrate which of Divisions A, B, or C hasperformed the best in 1991
Interpret the results
Part 8 – Review question: Segmented statement analysis:ROI and residual income
117
Part 9
Review questions:Multiple Choice Questions
(download the additional questions handout: ma1_mod8_handout1.pdf)
MA1 – MODULE 8

118
Multiple choice questionsHandout pages 16 thru 19Now working on page 16
Q1 Which variances does DEF Manufacturing have?
Q2 What does this mean for the standard direct labourhours allowed for April’s output?
Q3 What was the amount of overhead cost applied towork in process for May?
Part 9 – Review questions: Multiple choice
Stop the audio, read and attempt thequestion in the handout then come back tolisten to the solution.
119
Multiple choice questionsHandout pages 16 thru 19Now working on page 17
Q4 a. What was the variable overhead efficiencyvariance?b. What was the fixed overhead production volumevariance?
Q5 What would be the total flexible budget if total linesprinted increased to 2,600,000?
Part 9 – Review questions: Multiple choice
120
Multiple choice questionsHandout pages 16 thru 19Now working on page 18
Q6 What is the flexible budget for 40,000 and 20,000units, respectively?
Q7 How does the application of JIT principles improvereturn on investment?
Q8 What is the amount of invested capital?Q9 What was Rai’s invested capital in 2002?
Part 9 – Review questions: Multiple choice

121
Multiple choice questionsHandout pages 16 thru 19Now working on page 19
Q10a. Which single note to the financial results would bemost appropriate in a report to management?
b. Which of the following would be the mostappropriate conclusion in the report to management?
Part 9 – Review questions: Multiple choice