managed lanes in texas: a review of the application of ... · managed lanes in texas: a review of...
TRANSCRIPT

Managed Lanes in Texas: A Review of the Application of Congestion Pricing Final Report PRC 15-47-F
2
Managed Lanes in Texas: A Review of the Application of Congestion Pricing
Texas A&M Transportation Institute
PRC 15-47-F
September 2016
Authors
Nick Wood
Trey Baker
Maarit Moran
Gavin Pritchard
Tim Lomax
Max Steadman
Brianne Glover
Brian Dell

3
Table of Contents
List of Figures ................................................................................................................................ 5 List of Tables ................................................................................................................................. 5 Executive Summary ...................................................................................................................... 6
What Is Congestion Pricing? ....................................................................................................... 6 Study Purpose .............................................................................................................................. 7 Use of Congestion Pricing in Texas—1996 to Present ............................................................... 7 Public Reaction to Congestion Pricing ........................................................................................ 9
Introduction ................................................................................................................................. 10 The Concept of Congestion Pricing .......................................................................................... 10 Challenges of Congestion Pricing ............................................................................................. 11 General State of the Practice ..................................................................................................... 12
HOT Lanes ......................................................................................................................................................... 12 Express Lanes ..................................................................................................................................................... 13 Other Facilities.................................................................................................................................................... 13
Congestion Pricing Strategies ................................................................................................... 13 Public Acceptance Issues .......................................................................................................... 14
Comprehension of Pricing Policies ..................................................................................................................... 14 Communication................................................................................................................................................... 15 Equity.................................................................................................................................................................. 15
In This Report ............................................................................................................................ 16 Congestion Pricing in Texas ....................................................................................................... 17
Projects in Texas ....................................................................................................................... 17 Houston ............................................................................................................................................................... 18 Dallas/Fort Worth ............................................................................................................................................... 18 El Paso ................................................................................................................................................................ 18 Future Projects .................................................................................................................................................... 18
Types of Pricing Strategies ....................................................................................................... 19 Goals and Objectives of Pricing in Texas ................................................................................. 19 Texas State Legislation ............................................................................................................. 20
Beginning of Tolls .............................................................................................................................................. 20 Comprehensive Development Agreements ......................................................................................................... 20 Exclusive Lanes .................................................................................................................................................. 20 Toll Revenue ....................................................................................................................................................... 21 Managed Lanes and CDAs ................................................................................................................................. 21 Oversize/Overweight Vehicles ........................................................................................................................... 22 List of Approved Projects ................................................................................................................................... 22 Summary of Legislation...................................................................................................................................... 22
Texas and National Case Studies ............................................................................................... 24 Dallas/Fort Worth Regional Managed Lanes Network ............................................................. 24
System Development .......................................................................................................................................... 25 Pricing Structure ................................................................................................................................................. 28 Public Outreach .................................................................................................................................................. 30
Houston Katy Freeway Managed Lanes and METRO HOT Lanes .......................................... 31

4
System Development .......................................................................................................................................... 32 Pricing Structure ................................................................................................................................................. 34 Public Acceptance .............................................................................................................................................. 36
Minnesota I-394 and I-35 West HOT Lanes ............................................................................. 38 System Development .......................................................................................................................................... 39 Pricing Structure ................................................................................................................................................. 40 Public Outreach .................................................................................................................................................. 40
Puget Sound HOT Lane Network in Seattle, Washington ........................................................ 43 System Development .......................................................................................................................................... 43 Pricing Structure ................................................................................................................................................. 44 Public Outreach .................................................................................................................................................. 46
Los Angeles I-110 and I-10 Metro ExpressLanes ..................................................................... 48 System Development .......................................................................................................................................... 48 Pricing Structure ................................................................................................................................................. 49 Public Outreach .................................................................................................................................................. 49
Conclusions .................................................................................................................................. 51 Appendix A: Implemented Projects Outside of Texas ............................................................ 52 Appendix B: Texas Managed Lane Profiles ............................................................................. 54 Acknowledgments ....................................................................................................................... 62 References .................................................................................................................................... 63
5
List of Figures Figure 1. I-10 Katy Freeway Managed Lanes. ............................................................................. 13 Figure 2. Existing and Expected TEXpress Lane Projects. .......................................................... 25 Figure 3. Houston’s Congestion Pricing HOT Lane Network. ..................................................... 32 Figure 4. Toll Rate Schedule for the I-10 Katy Freeway Managed Lanes at the Eldridge
Plaza. ...................................................................................................................................... 35 Figure 5. MnPASS Lane Network. ............................................................................................... 38 Figure 6. Planned Regional Seattle Express Lane Network. ........................................................ 43 Figure 7. Toll Rate Sign on the I-405 Corridor. ........................................................................... 46 Figure 8. I-110 and I-10 Metro ExpressLanes. ............................................................................. 48
List of Tables Table 1. Public Concerns with Congestion Pricing. ..................................................................... 16 Table 2. Implemented Congestion Pricing Projects in Texas. ...................................................... 17 Table 3. Key Acts of Legislation Passed by the Texas State Legislature. .................................... 22 Table 4. SR 520 Bridge Toll Rates. .............................................................................................. 45

6
Executive Summary Texas’ success at attracting people and jobs, while beneficial from an overall economic perspective, has resulted in great demand on the state’s roadway infrastructure. This is particularly true in the state’s major urban areas, but smaller urban areas and major intercity corridors are also starting to see the adverse effects of not having enough roadway capacity to accommodate demand. This issue manifests itself in the form of traffic congestion and associated speed declines and travel delays. In some cases, congestion may also lead to increases in vehicular incidents.
Congestion is a result of demand (in the form of travel by personal and commercial vehicles) exceeding the supply of the roadway (in the form of available lane miles) and the use of alternatives to driving, such as transit, walking, and telecommuting. In certain locations, capacity can be added to increase the supply of available roadway space. However, many congested roadways consist of some form of pavement across almost all of the right of way and/or are located adjacent to businesses and neighborhoods. Sufficient funding is often not available to meet capacity expansion needs. Transportation agencies are increasingly looking at alternatives to capacity expansion to address congestion.
What Is Congestion Pricing? Congestion pricing is a concept that seeks to address three of the underlying causes of congestion and issues associated with it:
• A lack of economic incentives to alter travel behavior to less congested periods of the day.
• A lack of travel alternatives for those with a high value of time.
• A lack of economic incentives to take alternate modes such as transit or carpooling.
Congestion pricing generally takes the form of a toll or fee that varies based on the level of congestion in order to access transportation infrastructure. Fees for access may be fixed on a schedule or vary dynamically in response to actual volumes, with the result being fees that are higher during periods of the day when demand for those facilities is highest. It is an approach to leveling demand, say economists, much like pricing peak electricity or water usage. Thus, congestion pricing addresses the first cause of congestion by imposing higher travel costs during periods of peak congestion, providing a direct economic incentive to travel when there is less traffic.
Congestion pricing on highways is most often applied in a managed lanes context, meaning it is applied on separate lanes that are adjacent to general-purpose lanes. These priced lanes generally feature access restrictions—only certain types of vehicles (such as carpools, transit vehicles, and those paying the toll) can enter the lanes. Thus, congestion pricing as applied in a managed lanes context also addresses the two other causes of congestion:

7
• By providing a congestion-free alternative, managed lanes allow those with a higher value of time to access a faster travel alternative for a price, removing them from general-purpose traffic.
• By providing preferential access to certain vehicle classes like carpools and transit (modes that increase the person throughput of a corridor without increasing the number of vehicles), managed lanes provide a travel time incentive to choose alternatives to driving in a single-occupant vehicle (SOV).
Study Purpose This report examines congestion pricing as it is applied on managed lanes facilities within Texas as well as the rest of the United States. It presents:
• A general discussion of the state of the practice in congestion pricing and managed lanes.
• An overview of challenges facing the implementation of pricing.
• A description of how the concept has been implemented and evolved in Texas.
This report features five case studies of congestion pricing on managed lanes, two of which are in Texas, with a focus on how those systems were developed, how they are structured from a pricing perspective, and how public acceptance has been addressed.
Use of Congestion Pricing in Texas—1996 to Present Congestion pricing was first applied in Texas in 1996 as a congestion mitigation strategy for high-occupancy vehicle (HOV) lanes in Houston. Since then, it has been used as a tool for managing traffic within 10 corridors across the state, with several more set to open in the coming years.
Currently, congestion pricing applications can be found on six roadways in Houston, one in El Paso, and numerous roadways within the Dallas/Fort Worth region. In fact, within the next few years, the Dallas/Fort Worth region will feature the nation’s largest network of congestion-priced facilities. As of April 2016, construction is ongoing for congestion pricing projects including the Loop 1 MoPac Express Lanes in Austin, I-35E Express between Dallas and Denton, and I-35W North Tarrant Express in Fort Worth. Construction will soon start on the SH 288 Toll Lanes in Houston.
As of the date of this report, all facilities with congestion pricing that operate in Texas (with the exception of the César Chávez Express Toll Lanes in El Paso) offer carpool discounts and free transit access. The only facilities that currently use a dynamic pricing schedule, where tolls are set based on actual traffic, are found in the Dallas/Fort Worth area. All other current Texas facilities operate on fixed, time-of-day-based pricing schedule.

8
The ability of agencies in Texas to apply congestion pricing has been facilitated by the continual development and refinement of state legislation although congestion pricing itself has not been the sole focus of that legislation. For example, while public toll roads have been in existence in Texas since 1957, it was not until 1997 that the Texas Legislature granted the Texas Department of Transportation (TxDOT) the ability to collect tolls on one or more lanes on a state highway including HOV lanes. This essentially provided the opportunity to develop high-occupancy toll (HOT) lanes, the same type of highway facility that congestion pricing is most commonly applied to in the United States. Subsequent legislation enabled comprehensive development agreements (CDAs), which allowed for significant private-sector investment in the design, construction, and operation of toll facilities.
In 2003, the Texas Legislature explicitly defined exclusive lanes as “a lane of a highway or segment of a highway the use of which is restricted to one or more classifications of motor vehicle” (78th Texas State Legislature, HB 1208). That legislation requires at least two general-purpose lanes or another multilane facility be adjacent to the exclusive lane(s) for use by other vehicles, and that the facility must operate with the objectives of enhancing safety, mobility, and/or air quality. In 2007, the Texas Legislature further defined a managed lanes facility, which may include a congestion pricing component, as one that “increases the efficiency of a controlled-access highway through various operational and design actions and that allows lane management operations to be adjusted at any time” (80th Texas State Legislature, SB 792). This definition includes HOV lanes, SOV express lanes, tolled lanes, priced lanes, truck lanes, bypass lanes, dual-use facilities, or any combination of those facilities.
In recent years, legislation has focused on refining and, in some cases, limiting the ability of transportation agencies to develop, operate, and finance priced facilities. In 2011, the legislature implemented a freeze on general CDA authority but opted to authorize CDAs for specific priced facilities on a project-by-project basis. Recently authorized CDA projects with a pricing component include the I-35E managed lanes project, the North Tarrant Express project, the SH 183 managed lanes project, the Northwest Freeway managed lanes project on US 290, and the MoPac improvement project in Austin.
The performance of priced managed lanes in Texas can be measured by the goals each project set out to accomplish. For example, pricing on managed lanes may be implemented with the goals of:
• System management: Agencies may implement pricing to improve the operation of the facility by ensuring higher speeds, greater throughput, and better reliability.
• Environment: Agencies may implement pricing to manage travel demand to achieve regional air quality goals by reducing the time spent idling in congestion and improving traffic flows.
• Revenue generation: Facilities may operate with the objective of generating revenue either for future capital investments or maintenance and operations on existing facilities.
9
From a revenue perspective, priced lanes in the Dallas/Fort Worth region have shown themselves to be successful financing mechanisms as the region continues to expand its existing priced lanes network. When measured against typical traffic performance measures, managed lanes provide more throughput and lower travel times than non-priced lanes, and may actually improve travel time and throughput on adjacent non-priced lanes. Since opening in 2014 and 2015, the North Tarrant Express (NTE) TEXpress and the LBJ TEXpress in the Dallas/Fort Worth region have resulted in improvements in general-purpose traffic on both facilities. Speeds for the adjacent general-purpose lanes near the NTE TEXpress are around 7 percent higher compared to when construction began, and average speed has increased for the general-purpose lanes abutting the LBJ TEXpress Lanes by 10 to 15 percent since opening.
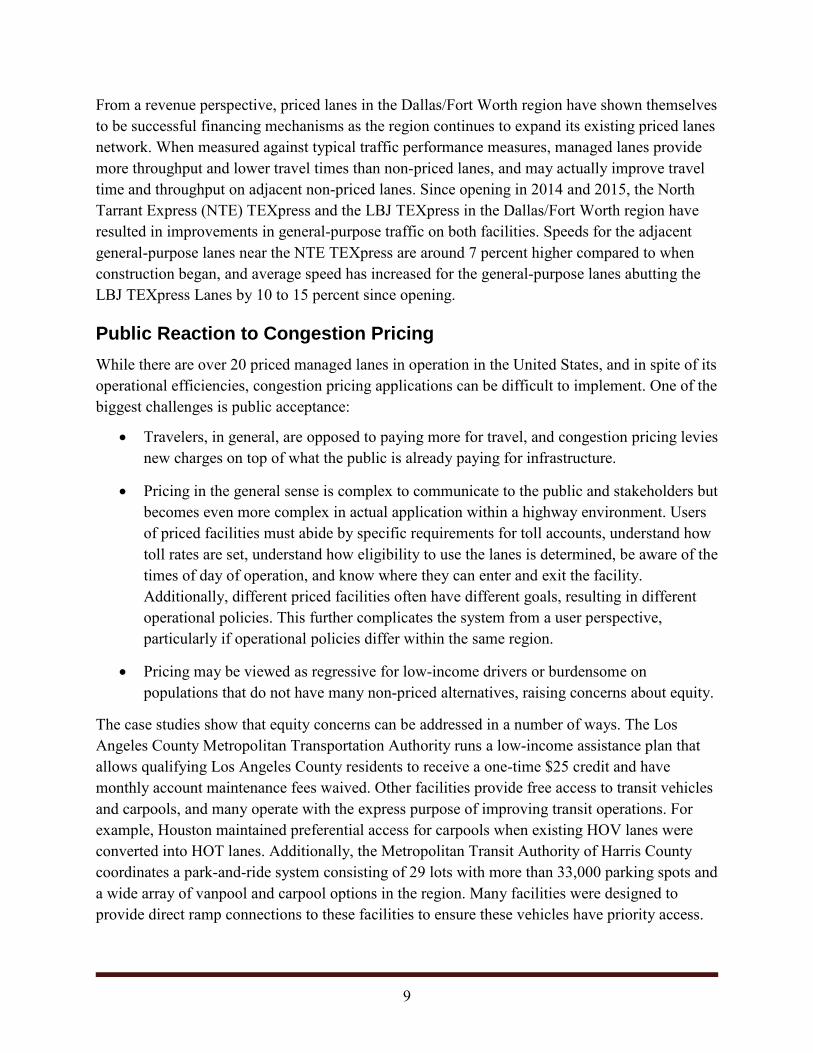
Public Reaction to Congestion Pricing While there are over 20 priced managed lanes in operation in the United States, and in spite of its operational efficiencies, congestion pricing applications can be difficult to implement. One of the biggest challenges is public acceptance:
• Travelers, in general, are opposed to paying more for travel, and congestion pricing levies new charges on top of what the public is already paying for infrastructure.
• Pricing in the general sense is complex to communicate to the public and stakeholders but becomes even more complex in actual application within a highway environment. Users of priced facilities must abide by specific requirements for toll accounts, understand how toll rates are set, understand how eligibility to use the lanes is determined, be aware of the times of day of operation, and know where they can enter and exit the facility. Additionally, different priced facilities often have different goals, resulting in different operational policies. This further complicates the system from a user perspective, particularly if operational policies differ within the same region.
• Pricing may be viewed as regressive for low-income drivers or burdensome on populations that do not have many non-priced alternatives, raising concerns about equity.
The case studies show that equity concerns can be addressed in a number of ways. The Los Angeles County Metropolitan Transportation Authority runs a low-income assistance plan that allows qualifying Los Angeles County residents to receive a one-time $25 credit and have monthly account maintenance fees waived. Other facilities provide free access to transit vehicles and carpools, and many operate with the express purpose of improving transit operations. For example, Houston maintained preferential access for carpools when existing HOV lanes were converted into HOT lanes. Additionally, the Metropolitan Transit Authority of Harris County coordinates a park-and-ride system consisting of 29 lots with more than 33,000 parking spots and a wide array of vanpool and carpool options in the region. Many facilities were designed to provide direct ramp connections to these facilities to ensure these vehicles have priority access.

10
Introduction Traffic congestion is a recurring issue that restricts mobility in many urban areas within Texas and throughout the United States. Congestion leads to increasing delays for travelers, greater fuel consumption, and worsening air quality, and in some cases may contribute to increases in vehicular incidents. Congestion is caused when vehicle demand for roadway space exceeds the available capacity or when transportation systems cannot otherwise accommodate demand. In other words, when there are too many vehicles on the roadway, speeds decrease. Slower speeds reduce the effective capacity because slower-moving traffic moves fewer vehicles than faster-moving traffic. Thus, congestion becomes a self-perpetuating problem as performance continues to spiral down once speeds start dropping.
From a very high level, congestion can be viewed in simple economic terms as demand (in terms of vehicular travel) exceeding supply (in terms of roadway capacity). However, from an economist’s viewpoint, there are additional contributing factors. For example, basic economics assume that the consumers know the cost of the product they are purchasing. However, travelers rarely know the actual cost of a particular trip. They assume the direct, observable cost of travel (e.g., gas prices) is the same for peak-period trips as for off-peak trips. However, what travelers do not fully realize is that each additional vehicle on the roadway increases congestion and travel costs for other drivers in terms of delay and increased fuel consumption due to stop-and-go traffic. Drivers have little monetary incentive to take trips during less congested times of the day. Furthermore, not all drivers have the same value of time (VOT). VOT essentially means that people place a monetary value on their time and that those with a higher VOT are willing to pay more to save time. Most roadways have no mechanism for those with a high VOT to get improved service. A highly congested highway thus represents a mixture of high- and low-value trips, with few monetary incentives for drivers to alter their travel patterns to improve efficiency.
The Concept of Congestion Pricing Congestion pricing is a concept designed to improve the flow of traffic by charging a price (or toll) that varies by congestion level or time of day. The price may be applied on specific/separate lanes within a roadway or may be applied over all lanes on a facility/corridor. The price is most often applied on managed lanes facilities, which are separate from general-purpose lanes and feature restricted access and eligibility requirements.
Under a congestion-pricing-based system, periods of the day with higher levels of congestion have increased tolls, which are meant to discourage low-value trips, thus lowering demand for roadway space and helping keep the flow of traffic moving. So, at a very high level, congestion pricing works much like basic economics would dictate: as demand increases, so does the price. However, congestion pricing also addresses the more detailed economic drivers of congestion. For example, drivers with a very high VOT that need to reach their destination on time have the option, under a congestion pricing regime, to use the priced facility at a higher toll but receive the benefit of a faster and more reliable trip. Drivers with a lower VOT can simply avoid the

11
roadway and elevated price by choosing to travel during a less congested time of day, using less congested routes, sharing rides, taking transit, or telecommuting. Some agencies may seek to actively encourage people to use these alternate modes, and may therefore give discounts for access to priced facilities to carpoolers or provide free access to transit vehicles. This has the effect of removing SOVs from the road while increasing the average number of occupants in the remaining vehicles.
Challenges of Congestion Pricing In theory, congestion pricing can be effective at improving roadway efficiency because the price for travel better accounts for the external costs of that travel. Drivers (and the public at large) have limited to no awareness of the true costs of congestion, so direct pricing based on congestion levels helps send signals to drivers about the cost of their trip, enabling them to make more informed decisions regarding their transportation options.
However, in practice the application of congestion pricing can be problematic. Drivers in general do not support paying more for travel, and congestion pricing levies additional costs on drivers. This means that transportation agencies looking to apply congestion pricing are likely to encounter significant public resistance. This is particularly true if pricing is applied on an existing roadway that the public views as having already been built and paid for using traditional tax-based funding. Furthermore, the public may not readily see the benefits of pricing and may be adversely impacted, particularly if congestion pricing is implemented on a lane previously dedicated to high-occupancy vehicles (HOVs), as is often the case.
There is also the potential for significant equity concerns with congestion pricing, just as with any form of tolling. Tolling and pricing systems do not generally vary the price for access based on the income of the driver. Therefore, depending on travel patterns, tolling systems may be income regressive.
Additionally, the public may have concerns about transparency and the use of revenues from priced facilities. Pricing in general is often promoted on the user-pays principle, meaning that those who use a facility are the ones who shoulder the burden for its funding. This implies that revenues generated will be used to maintain and improve service on those facilities/corridors that generated the revenue. Therefore, agencies implementing a congestion pricing system may find themselves under heightened scrutiny about how revenues are used.
The performance of facilities that have a congestion pricing element depends greatly on the operational policies driving the posted price for access. If price is not properly set, then the priced facilities themselves may get congested, or they may be underused.

12
General State of the Practice Congestion pricing is applied throughout the United States in a number of ways. For example, congestion pricing systems are currently found on:
• HOV lanes, which are typically called HOT lanes after pricing is added.
• Express lanes, which are new priced lanes alongside freeway lanes.
• Paid parking systems.
• Entirely new highway facilities.
Appendix A provides a comprehensive list of congestion pricing projects outside Texas.
HOT Lanes HOT lanes are a type of managed lanes facility that permits SOVs to access lanes or facilities that were previously restricted to HOVs and/or transit vehicles. In general, SOVs are allowed to access the lanes by paying a toll, while transit vehicles and HOVs (carpools) continue to have free access or a reduced toll.
In some areas, the decision to convert an HOV facility to a HOT facility was made because the existing HOV facility was underused. By allowing SOVs to enter the lanes with a congestion priced toll, agencies are able to make the most of their capacity without degrading travel conditions for their HOV and transit users.
Other regions have had the opposite issue and converted from HOV facilities to HOT facilities because their HOV lanes were overused. In these cases, not all HOVs are allowed to use the lanes for free. For example, carpools with only two people may have to pay a toll, while carpools with three or more and transit vehicles are allowed to use the lanes for free. For these types of facilities, carpools are often required to have a tolling transponder, regardless of whether they are using the facility for free or not.
An example of a HOT lane facility is the I-10 Katy Freeway Managed Lanes in Houston, shown in Figure 1. In the figure, a two-lane HOT facility operates to the right of the white pylon line, and the general-purpose lanes are to the left of the pylons.

13
Photo credit: Chuck Fuhs
Figure 1. I-10 Katy Freeway Managed Lanes.
Express Lanes Express lanes are newly constructed one-, two-, or three-lane facilities located alongside freeway lanes that price all (or a great majority) of travelers, including carpools. Express lanes are often constructed as a means of building new capacity quickly because construction of the lanes can be financed upfront with bonds backed by future toll revenues. However, in some cases tolls may only cover a portion of the overall cost of the facility, meaning that other funding and financing mechanisms must be sought, such as loans or lines of credit from federal sources. The tolling component itself and the bonds issued against future toll revenue are generally the central financing mechanism that makes these types of projects feasible. Congestion pricing serves the dual goals of offsetting the construction costs while also managing demand.
Other Facilities Most applications of congestion pricing in the United States take the form of priced lanes on existing highway facilities, but there are other examples. Bridges and entire freeways (all lanes across a highway) have implemented congestion pricing and varied toll rates. A notable example of all-freeway congestion pricing is the SR 520 Bridge in Seattle. Parking systems, such as SF Park in San Francisco, California, and LA Express Park in Los Angeles, California, have integrated concepts of congestion pricing to manage parking demand. In these situations, the price to park varies in response to demand, with periods of higher demand having a higher cost.
Congestion Pricing Strategies Congestion pricing projects typically employ one of two pricing strategies in response to congestion:
• A fixed time-of-day price schedule: A facility with fixed time-of-day pricing varies the toll by a preset, established schedule of times. Tolls are highest during periods of high

14
congestion. Historical traffic conditions and past performance reports help to establish rates for a fixed, time-of-day schedule, not real-time or current-day observations. If revenue generation is a goal for a facility, rates are set to generate desired revenue and adjusted on either a periodic or annual basis. The correlation to actual day-to-day traffic demand can be closely mimicked according to a schedule, and drivers clearly know what they will be charged at a given time.
• Dynamic pricing: In contrast, a dynamically priced facility varies the toll price by considering real-time traffic conditions. An operator, a traffic management center, or an algorithm embedded within the tolling system adjusts the toll rate every 5 to 15 minutes. Toll rate changes consider the volume of vehicles, travel speeds, crash incidents, and weather conditions. Travelers are informed of toll rates through dynamic message signs placed prior to entrances to the facility. This strategy is truly responsive to changing conditions but can be initially confusing to motorists. Dynamically priced facilities typically require a greater investment of personnel and infrastructure to be successful as opposed to those facilities with a fixed time-of-day toll schedule. This is because dynamically priced systems must be monitored continually to adjust price in response to demand, meaning that sensors and video systems have to function optimally to provide operators reliable information for changing real-time toll rates. This requires greater investment in maintenance and personnel (1). Dynamic tolls are also more difficult for the driver to predict but better account for the cost of congestion.
HOT and express lanes use both fixed time-of-day schedules and dynamic pricing. Almost all facilities that implement congestion pricing for parking spaces and for entire roadways use a fixed time-of-day schedule.
Public Acceptance Issues Comprehension of Pricing Policies Public acceptance is a major issue in congestion pricing facilities. Pricing itself can be complex to communicate to the public and system stakeholders, but enabling the broad understanding of pricing within a highway context is even more complicated. For example, users of priced facilities are required to abide by specific requirements for toll accounts, understand whether tolls are on a fixed schedule or dynamic, be aware of hours of operation for facilities and access locations, and know whether they qualify for exemptions and discounts.
The situation is further complicated by the fact that similar facilities can have different goals and operating objectives, such as congestion management versus revenue generation, thus leading to different operating policies. Knowing how different managed lanes operate can be a daunting task for drivers traveling between major urban areas, and if differing operational policies are used within the same urban area, even more complexity is introduced.

15
Communication The ways pricing is communicated (or described) can vary significantly between facilities. Some facilities followed a broad public outreach campaign that presented consistent messaging across wide and diverse audiences. Other facilities targeted specific efforts to select groups and stakeholders, with messages tailored to different interests.
Many successful pricing projects have used a broad engagement process involving planners, public officials, decision makers, affected parties, and stakeholders. The experiences from these projects show that any number of factors can contribute to differences in the specific content and target audience for outreach efforts. The factors influencing agency communication on pricing can include:
• Perceptions of established and successful pricing systems in the area (or lack thereof).
• Perceptions of project performance.
• Perceptions of safety.
• Perceptions of regional congestion.
• Perceptions of equity impacts.
• Perceptions of where excess revenue is spent.
• Perceptions of agency trust, accountability, and transparency.
Equity In spite of the diversity of methods and messages employed by agencies to communicate pricing concepts, one of the most consistent issues that arises and must be addressed is that of equity. As previously noted, equity concerns may arise from a number of issues, including perceptions that tolling is regressive, perceptions of unfair taxation of previously free roads, and use of revenues. HOT lanes are among the most mature of U.S. congestion pricing applications, and agencies implementing HOT lanes have developed a variety of measures and policies to address the concerns of specific groups as well as the public at large. Table 1 provides a summary of frequently mentioned equity concerns and the typically associated approaches agencies have used to address these concerns.

16
Table 1. Public Concerns with Congestion Pricing. Public Concern Operational Approach or Response
Congestion pricing is unfair and regressive to low-income travelers
Travelers have the choice to pay for access to the facility and are provided non-toll alternates Travelers are provided free or discounted access to transit, or free or discounted access to carpools/vanpools Revenues from the facility are used for transit enhancements
Pricing on a previously free highway is unfair; taxes already paid for the highway
The current transportation funding system is unsustainable and unable to meet highway needs Revenues generated by pricing are used exclusively for improvements and development within the priced corridor Non-tolled parallel lanes remain available for travel
Congestion pricing amounts to gouging drivers when they most need to travel
Pricing is a mechanism that improves service for everyone Pricing allows more efficient use of a limited resource
In order to be effective at addressing public concerns, these messages and policies require that agencies show how pricing achieves these promises. Agencies with the most successful pricing applications are generally able to empirically show that pricing has improved the transportation system, revenues are being used appropriately, and other system objectives (such as transit improvement) are being met. Unfortunately, these data are not always available. In this report, system performance data are provided when available. However, a key takeaway from the lack of available performance data is that there is significant room for improvement in how transportation agencies track and report system performance data to system stakeholders and the public.
In This Report This report summarizes recent congestion pricing applications in the United States with a special focus on Texas. This introductory section discusses:
• The benefits and challenges of pricing.
• The state of the practice in congestion pricing and managed lanes.
• An overview of congestion pricing strategies.
• The public acceptable issues facing the implementation of pricing.
The next section describes how congestion pricing was implemented and evolved in Texas.
Additionally, the case studies provide insight on how the congestion pricing concept was communicated to the public based on the specific circumstances of the region or project.
The last section concludes with a summary of key findings.
17
Congestion Pricing in Texas
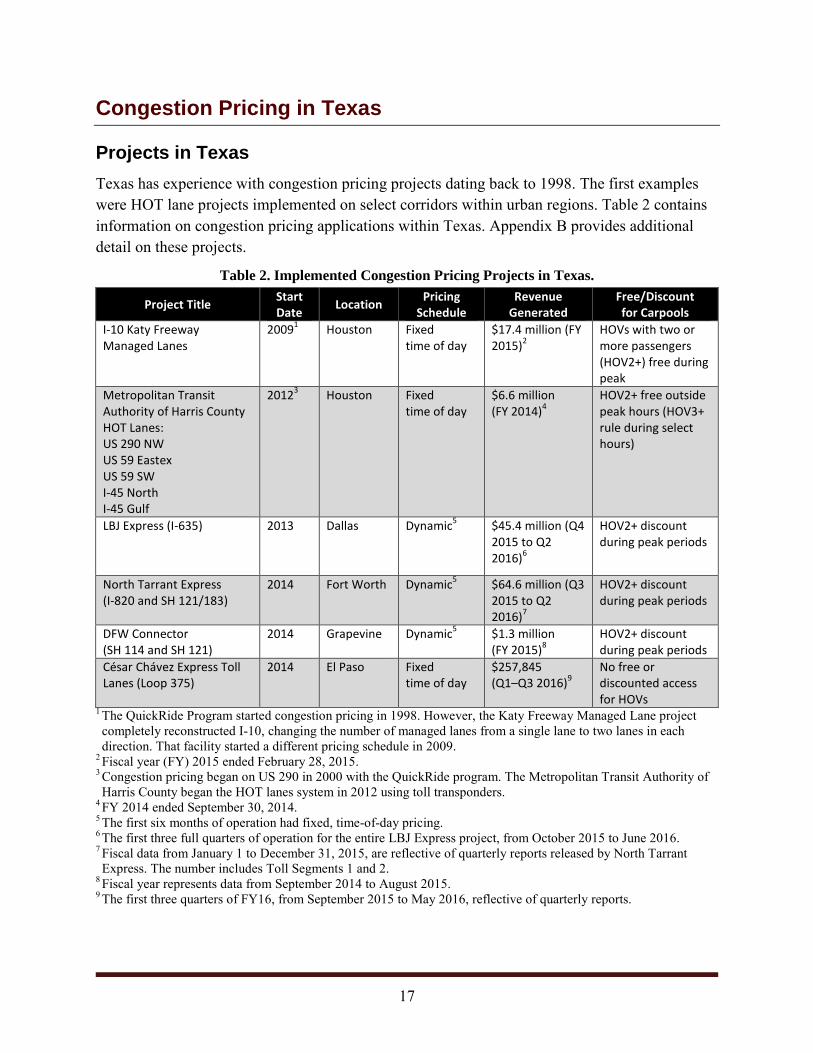
Projects in Texas Texas has experience with congestion pricing projects dating back to 1998. The first examples were HOT lane projects implemented on select corridors within urban regions. Table 2 contains information on congestion pricing applications within Texas. Appendix B provides additional detail on these projects.
Table 2. Implemented Congestion Pricing Projects in Texas.
Project Title Start Date Location Pricing
Schedule Revenue
Generated Free/Discount for Carpools
I-10 Katy Freeway Managed Lanes
20091 Houston Fixed time of day
$17.4 million (FY 2015)2
HOVs with two or more passengers (HOV2+) free during peak
Metropolitan Transit Authority of Harris County HOT Lanes: US 290 NW US 59 Eastex US 59 SW I-45 North I-45 Gulf
20123 Houston Fixed time of day
$6.6 million (FY 2014)4
HOV2+ free outside peak hours (HOV3+ rule during select hours)
LBJ Express (I-635) 2013 Dallas Dynamic5 $45.4 million (Q4 2015 to Q2 2016)6
HOV2+ discount during peak periods
North Tarrant Express (I-820 and SH 121/183)
2014 Fort Worth Dynamic5 $64.6 million (Q3 2015 to Q2 2016)7
HOV2+ discount during peak periods
DFW Connector (SH 114 and SH 121)
2014 Grapevine Dynamic5 $1.3 million (FY 2015)8
HOV2+ discount during peak periods
César Chávez Express Toll Lanes (Loop 375)
2014 El Paso Fixed time of day
$257,845 (Q1–Q3 2016)9
No free or discounted access for HOVs
1 The QuickRide Program started congestion pricing in 1998. However, the Katy Freeway Managed Lane project completely reconstructed I-10, changing the number of managed lanes from a single lane to two lanes in each direction. That facility started a different pricing schedule in 2009.
2 Fiscal year (FY) 2015 ended February 28, 2015. 3 Congestion pricing began on US 290 in 2000 with the QuickRide program. The Metropolitan Transit Authority of Harris County began the HOT lanes system in 2012 using toll transponders.
4 FY 2014 ended September 30, 2014. 5 The first six months of operation had fixed, time-of-day pricing. 6 The first three full quarters of operation for the entire LBJ Express project, from October 2015 to June 2016. 7 Fiscal data from January 1 to December 31, 2015, are reflective of quarterly reports released by North Tarrant Express. The number includes Toll Segments 1 and 2.
8 Fiscal year represents data from September 2014 to August 2015. 9 The first three quarters of FY16, from September 2015 to May 2016, reflective of quarterly reports.

18
Houston The first highway corridor in Texas to have HOT lanes was the I-10 Katy Freeway in Houston, with the introduction of the QuickRide program in 1998. That corridor was completely reconstructed from 2003 to 2008, and the HOV lane now operates as the I-10 Katy Freeway Managed Lanes, providing free access to two-person carpools and motorcycles, and tolled access to SOVs on four lanes (two in each direction).
Other HOV lanes in Houston have converted to HOT lanes within the past five years, including existing HOV lanes on the following freeways:
• US 290 Northwest.
• US 59 Eastex.
• US 59 Southwest.
• I-45 North.
• I-45 Gulf.
Dallas/Fort Worth In the Dallas/Fort Worth region, congestion pricing operates on priced lanes within existing freeways for the:
• SH 114/SH 121 DFW Connector near Grapevine, Texas.
• SH 183/I-820 North Tarrant Express near Fort Worth, Texas.
• I-635 LBJ Express in Dallas, Texas.
El Paso In El Paso, congestion pricing currently operates for the César Chávez Express Toll Lanes on Loop 375.
Future Projects As of August 2016, construction is ongoing for congestion pricing projects including:
• The MoPac Express Lanes in Austin.
• The I-35E Express between Dallas and Denton
• The I-35W North Tarrant Express in Fort Worth (Segment 3A and 3B).
Construction will soon start on the SH 288 Toll Lanes in Houston.
19
Types of Pricing Strategies As Table 2 shows, pricing strategies for projects in Texas vary between fixed time-of-day and dynamic schedules. The variation is distinct by metropolitan region, with facilities in Houston operating with fixed time-of-day schedules and facilities in the Dallas/Fort Worth region operating initially with fixed time-of-day schedules and then transitioning to dynamic pricing.
Statewide, agencies that establish local toll policies and rates for facilities with congestion pricing include:
• The Central Texas Regional Mobility Authority for Travis and Williamson Counties.
• The Harris County Toll Road Authority (HCTRA) and the Metropolitan Transit Authority of Harris County (Houston METRO) in Houston.
• The Camino Real Regional Mobility Authority in El Paso.
• TxDOT in establishing statewide policy and policies for specific facilities.
Goals and Objectives of Pricing in Texas The goals and objectives behind congestion pricing vary for each facility in Texas. Common goals include:
• Providing additional travel choices (e.g., whether travel as single commuter, carpool, bus transit rider, or truck).
• Increasing speed.
• Reducing delay.
• Improving reliability.
• Generating revenue.
The I-10 Katy Freeway Managed Lanes in Houston, I-635 LBJ Express in Dallas, and SH 183/I-820 North Tarrant Express (NTE) are examples of congestion pricing projects that list revenue generation as a goal. Revenue generation enabled the development of these facilities while also helping to manage demand and traffic. Both the I-635 LBJ and NTE were public-private partnerships (P3s) or concessionaire projects. As such, the goal of revenue generation was adopted to elicit interest from private investors.
Many managed lanes facilities in Texas have goals not focused on revenue generation. For example, HOT lane facilities in Houston (officially branded as the METRO HOV/HOT Lane Program) have a goal to increase carpools, vanpools, and bus ridership, which is regularly measured by Houston METRO and presented within budget documents for performance assessment (2). Houston METRO emphasizes moving more people because the agency is the major transit provider for Houston, as opposed to other priced facility operators (such as regional
20
mobility authorities and tolling entities) that do not operate transit services as their primary mission. Houston METRO lists these goals for its HOT lane program (3):
• Provide new options for commuters.
• Increase safety and promote quick response to accidents and issues in the lanes due to additional camera monitoring.
• Improve air quality by reducing traffic congestion.
• Better use existing HOV lanes.
• Offer increased enforcement of the HOV lane system.
Texas State Legislation Beginning of Tolls Legislation passed over the last 20 years has shaped the current application of congestion pricing in Texas. The state’s current pricing environment began to take shape in 1997 when the 75th Legislature passed Senate Bill (SB) 370 that gave TxDOT the ability to charge drivers a toll to use one or more lanes on a state highway, including HOV lanes (4).
In 2001, SB 342 and SB 454 expanded tolling authority in the state and allowed for the use of automated toll enforcement systems.
Comprehensive Development Agreements During 2003, House Bill (HB) 3588 permitted TxDOT to enter into comprehensive development agreements (CDAs) or P3s, under which private entities design, build, operate, and finance toll facilities. This allowed for toll facilities to be used to generate revenue for regional transportation projects, meaning that congestion pricing could be applied as a financing mechanism for additional facility development.
Exclusive Lanes The legislature also passed HB 1208, which authorized the creation of exclusive lanes (referred to in this report as express lanes). Exclusive lanes are defined as “a lane of a highway or segment of a highway the use of which is restricted to one or more classifications of motor vehicle” (5). Several criteria must be met for these lanes to be authorized:
• At least two general-purpose lanes or another multilane facility must be next to the exclusive lane for use by other vehicles.
• In addition, “the use or operation of the exclusive lane is likely to enhance safety, mobility, or air quality” (6).

21
Toll Revenue HB 2702, passed in 2005, required that excess toll revenues beyond the operation and maintenance costs associated with the priced project be spent on transportation or air quality projects where tolls were collected. Article 2, Subchapter E of HB 2702 included a provision that prohibits non-tolled state roads from being converted to tolled ones but makes exceptions for:
• Lanes in which vehicles with one occupant can pay a toll to use the lane and vehicles with more than one occupant can use that lane for free (e.g., a HOT lane).
• Conversion of HOV lanes to HOT lanes when the roadway is reconstructed in a way that keeps the number of pre-existing general-purpose lanes in place or increases them. For example, three general-purpose lanes on a roadway can be converted to a HOT lane, so long as at least three general-purpose lanes are present (in addition to the HOT lanes) following the conversion (7).
Managed Lanes and CDAs During 2007, the 80th Legislative Session adopted legislation specifically addressing managed lanes. SB 792 defined a managed lane facility as:
…a facility that increases the efficiency of a controlled-access highway through various operational and design actions and that allows lane management operations to be adjusted at any time. The term includes high-occupancy vehicle lanes, single-occupant vehicle express lanes, tolled lanes, priced lanes, truck lanes, bypass lanes, dual use facilities, or any combination of those facilities (8).
In addition, the law placed a freeze on CDAs effective August 31, 2009, with a few notable exceptions including managed lane projects.
In 2011, the 82nd Legislative Session increased the ability of agencies to pursue managed lanes projects. SB 1420 was the first bill that authorized the construction of specific managed lanes projects through the use of CDAs. Among others, the legislation authorized the following projects to be completed via CDAs:
• The I-35E Managed Lanes project in Dallas.
• The North Tarrant Express project in Fort Worth.
• The SH 183 Midtown Express project in North Texas.
• The Northwest Freeway managed lanes on US 290 in Houston.
• The MoPac improvement project in Austin.
It stipulated that the ability of those projects to be completed as CDAs would expire on August 31, 2015. In addition, it enacted an across-the-board freeze on CDAs for all other projects effective August 11, 2011.

22
Oversize/Overweight Vehicles An additional piece of pertinent legislation that passed during this session was HB 1201. This law permits the Texas Transportation Commission to let oversize or overweight vehicles operate on exclusive lanes if justification is supported by an engineering and traffic study that includes specified analyses and makes the authorization inapplicable to certain vehicles and roadways (9).
List of Approved Projects SB 1730, passed during the 83rd Legislative Session in 2013, revised the list of approved projects and extended authority to enter into the agreements for those approved projects until August 31, 2017 (10).
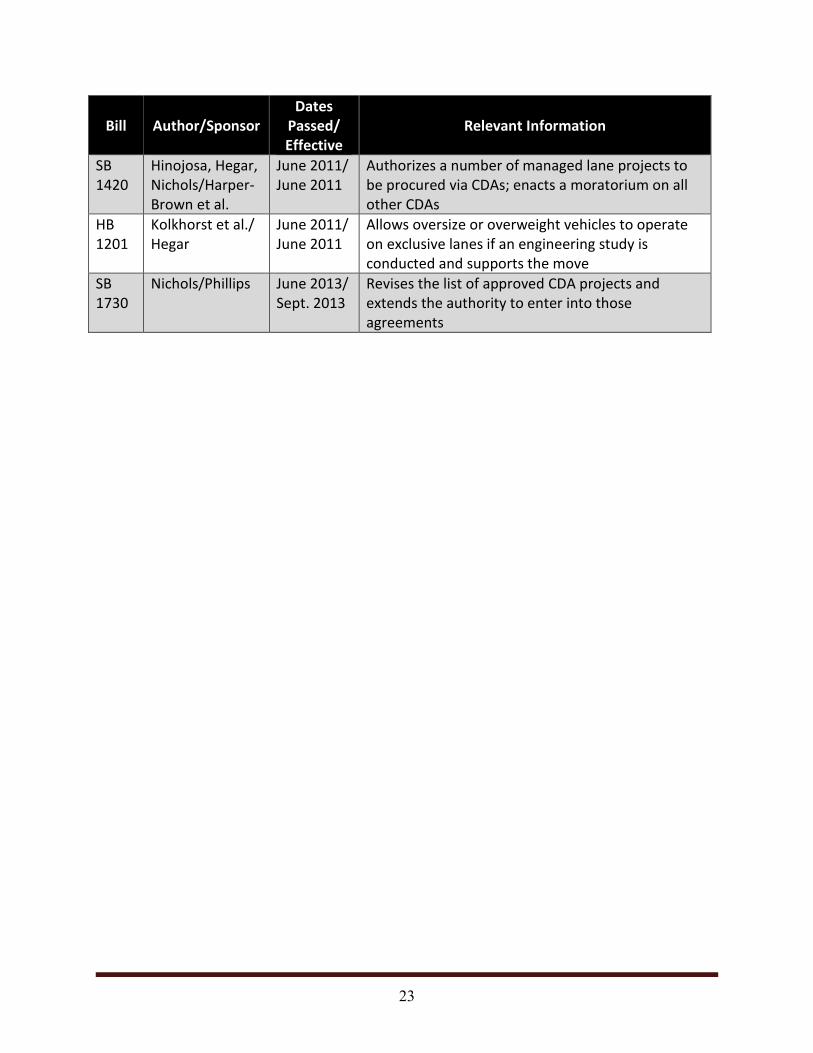
Summary of Legislation Table 3 shows key acts passed by the Texas Legislature related to congestion pricing.
Table 3. Key Acts of Legislation Passed by the Texas State Legislature.
Bill Author/Sponsor Dates
Passed/ Effective
Relevant Information
SB 370
Armbrister, Sibley/ Bosse, Gray, and Alexander
June 1997 Gives TxDOT the authority to impose tolls on one or more lanes on a state highway
SB 342
Shapiro/ Alexander
May 2001 Authorizes TxDOT to spend money on toll facilities from any available revenue source according to terms set by the Texas Transportation Commission
SB 454
Armbrister/ Alexander
Sept. 2001 Authorizes TxDOT to collect and enforce tolls using automated systems
HB 3588
Krusee et al./ Ogden
June 2003 Authorizes TxDOT to enter into CDAs and to pay pass-through tolls to a public or private entity
HB 1208
Lewis/Shapiro June 2003/ June 2003
Authorizes the creation of exclusive lanes
HB 2702
Krusee/Staples June 2005/ June 2005
Prohibits non-tolled state roads from being converted to tolled ones, with an exception for HOT lanes; authorizes the use of CDAs for toll projects and projects containing both tolled and non-tolled lanes
SB 792
Williams/Smith June 2007/ June 2007
Defines managed lanes and enacts a moratorium on CDAs with a few exceptions including those for managed lane projects
23
Bill Author/Sponsor Dates
Passed/ Effective
Relevant Information
SB 1420
Hinojosa, Hegar, Nichols/Harper-Brown et al.
June 2011/ June 2011
Authorizes a number of managed lane projects to be procured via CDAs; enacts a moratorium on all other CDAs
HB 1201
Kolkhorst et al./ Hegar
June 2011/ June 2011
Allows oversize or overweight vehicles to operate on exclusive lanes if an engineering study is conducted and supports the move
SB 1730
Nichols/Phillips June 2013/ Sept. 2013
Revises the list of approved CDA projects and extends the authority to enter into those agreements

24
Texas and National Case Studies For this effort, researchers developed a series of case studies of highway projects in Texas and elsewhere in the United States that feature congestion pricing. In addition to a brief description of the project(s), each case study features a discussion of the following:
• System development—examines how these facilities were developed in terms of policy, legislation, and stakeholder coordination.
• Pricing structure—presents information on how the pricing component of the facility is structured in terms of how rates vary, what vehicles are exempt, etc. Information on performance of these systems, to the extent that such information is available, is presented in this section.
• Public outreach and/or acceptance—highlights how the public has reacted to these pricing systems, how pricing was presented to the public, and how messaging for specific facilities occurred.
This section provides a brief summary of regional case studies performed for congestion pricing projects in:
• Dallas/Fort Worth, Texas.
• Houston, Texas.
• Minneapolis/St. Paul, Minnesota.
• The Puget Sound region in Washington.
• Los Angeles, California.
Dallas/Fort Worth Regional Managed Lanes Network The Dallas/Fort Worth (DFW) region has several priced managed lanes and, within the next few years, will feature the nation’s largest network of congestion-priced facilities (as measured in corridor lane-miles). This region features both priced and non-priced HOV lanes, as shown in Figure 2. I-30E is free to HOVs, while SOVs must pay a toll. In the next few years, the region will see new projects open on I-35E, SH 114, SH 121, SH 183, Loop 12, I-820, and I-35W.

25
Source: (11)
Figure 2. Existing and Expected TEXpress Lane Projects.
System Development
Stakeholders The current network of toll roads and managed lanes in the DFW region evolved over time to include a diverse set of agencies that represent a variety of interests. The involvement of this diverse range of stakeholders is an innovative feature of the region’s congestion pricing program. Major partners include the following:
• North Central Texas Council of Governments (NCTCOG): This agency functions as the metropolitan planning organization for the DFW region. NCTCOG is primarily responsible for leading the development of regional transportation plans and the establishment of toll policy and rates for priced roadways.
• Regional Transportation Committee (RTC): RTC is an independent policy body of NCTCOG that meets on a monthly basis to oversee the regional transportation planning process. RTC is composed of 44 members drawn from elected or appointed officials in the region and representatives from each of the area’s transportation providers. RTC’s activities include determining the allocation of transportations funds, ensuring the region
26
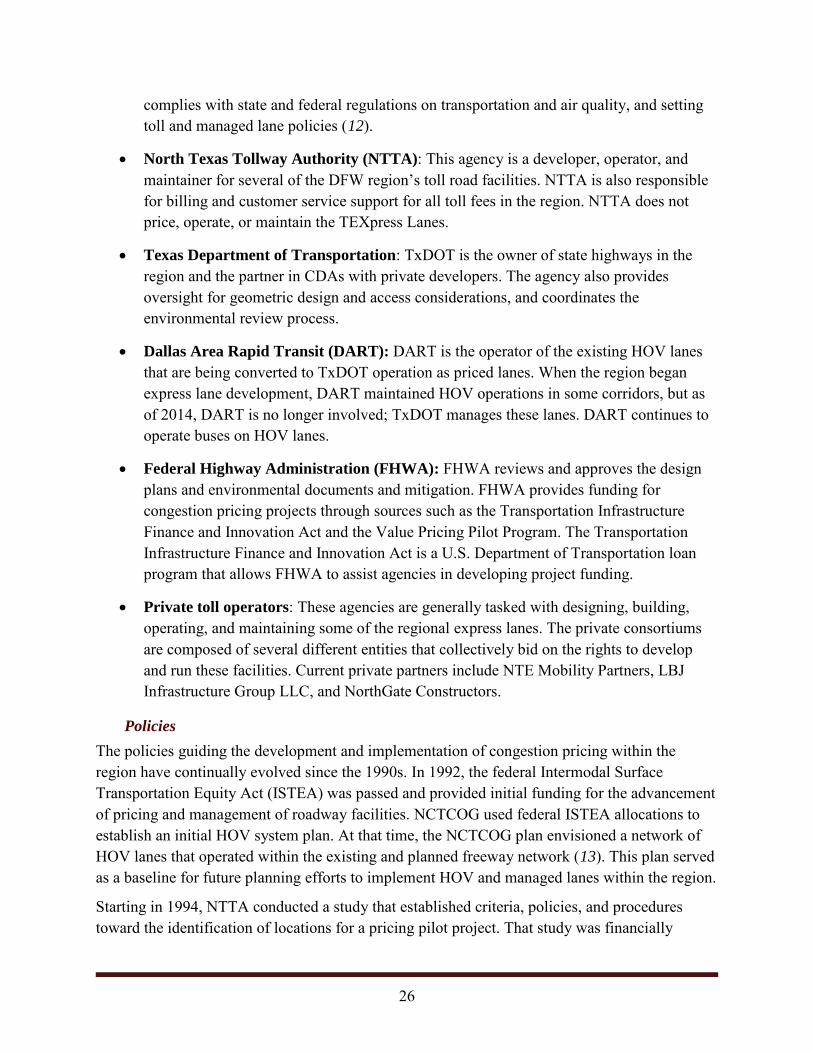
complies with state and federal regulations on transportation and air quality, and setting toll and managed lane policies (12).
• North Texas Tollway Authority (NTTA): This agency is a developer, operator, and maintainer for several of the DFW region’s toll road facilities. NTTA is also responsible for billing and customer service support for all toll fees in the region. NTTA does not price, operate, or maintain the TEXpress Lanes.
• Texas Department of Transportation: TxDOT is the owner of state highways in the region and the partner in CDAs with private developers. The agency also provides oversight for geometric design and access considerations, and coordinates the environmental review process.
• Dallas Area Rapid Transit (DART): DART is the operator of the existing HOV lanes that are being converted to TxDOT operation as priced lanes. When the region began express lane development, DART maintained HOV operations in some corridors, but as of 2014, DART is no longer involved; TxDOT manages these lanes. DART continues to operate buses on HOV lanes.
• Federal Highway Administration (FHWA): FHWA reviews and approves the design plans and environmental documents and mitigation. FHWA provides funding for congestion pricing projects through sources such as the Transportation Infrastructure Finance and Innovation Act and the Value Pricing Pilot Program. The Transportation Infrastructure Finance and Innovation Act is a U.S. Department of Transportation loan program that allows FHWA to assist agencies in developing project funding.
• Private toll operators: These agencies are generally tasked with designing, building, operating, and maintaining some of the regional express lanes. The private consortiums are composed of several different entities that collectively bid on the rights to develop and run these facilities. Current private partners include NTE Mobility Partners, LBJ Infrastructure Group LLC, and NorthGate Constructors.
Policies The policies guiding the development and implementation of congestion pricing within the region have continually evolved since the 1990s. In 1992, the federal Intermodal Surface Transportation Equity Act (ISTEA) was passed and provided initial funding for the advancement of pricing and management of roadway facilities. NCTCOG used federal ISTEA allocations to establish an initial HOV system plan. At that time, the NCTCOG plan envisioned a network of HOV lanes that operated within the existing and planned freeway network (13). This plan served as a baseline for future planning efforts to implement HOV and managed lanes within the region.
Starting in 1994, NTTA conducted a study that established criteria, policies, and procedures toward the identification of locations for a pricing pilot project. That study was financially

27
supported by the Value Pricing Pilot Program, which FHWA administers. The program has provided additional funding for research and implementation of the managed lanes concept throughout the years, including the development of the I-30 Tom Landry Managed Lanes facility. During this initial period of time, the physical impacts of new projects were found to be lessened when combining the features of an express lane (where SOVs are allowed to pay for access) with a traditional HOV lane (with preference offered for HOVs and transit) into a single (managed lane) facility (13).
The original concept for a managed lane was subsequently developed as part of a 1996 Major Investment Study for the I-635 LBJ Freeway. The resulting proposal received considerable public and political support and was adopted into the long-term Mobility 2020 plan (14). Mobility 2020 defined the concept of a managed HOV/integrated toll road that consisted of occupancy-based pricing incentives, or HOV discounts, on congested toll roads as a strategy to manage traffic demand.
In 2000, NCTCOG adopted its Mobility 2025 plan, which further refined the regional managed lanes concept by identifying two different types of managed facilities for the region:
• Warranted HOV lanes, where excess capacity on the HOV lanes could be managed during certain time periods or certain directions throughout the day.
• Toll roads where capacity could be managed with reduced tolls for HOV users.
Traditional freeway corridors were added as potential facilities for future management as part of the 2004 update to the Mobility 2025 plan. Development of managed lanes facilities in the area proceeded for several years based on these new articulations.
In 2009, the Texas Transportation Commission approved the LBJ Express, North Tarrant Express, and DFW Connector projects as the region’s first public-private projects. These facilities were three of the most congested corridors in the region. Studies of these roadways were underway for many years and included efforts to identify innovative sources of funding. At the time, increasing demand was overburdening the available capacity, but the estimated cost to expand these roadways would expend most of the regional transportation budget at the expense of other projects (13). The region pursued P3s, with private partners taking on much of the cost associated with the design, planning, development, construction, operation, and maintenance of the facilities in exchange for the right to collect fees for usage on the priced lanes.
The region rebranded its priced managed lanes as TEXpress Lanes, or “toll lanes with a twist” (15). The priced managed lanes are being added within existing freeways as part of larger construction projects that rebuild main lanes and expand frontage roads. These reconstruction projects were described as offering “choice, flexibility, and convenience” (16).
As of August 2016, TEXpress Lanes operate within four freeways, and plans are to implement the concept on other roadways within the DFW region. One of the major operational differences between TEXpress Lanes and other tolled facilities in the region is that the toll rates will change
28
dynamically in response to actual traffic volumes. As volumes increase, so will the price. As such, the DFW region’s TEXpress Lanes are one of the most comprehensive examples of congestion pricing in Texas. The first three TEXpress Lane facilities—LBJ/I-635 West, North Tarrant Express/I-820, and the DFW Connector/SH 144/SH 121—offer tolled lanes that complement adjacent non-tolled main lanes along some of the region’s most congested freeway corridors.
TEXpress Lanes are open or under construction in seven major corridors within the DFW region and will be open by 2018. These include the following (11):
• LBJ Express (I-635/LBJ Freeway and I-35E).
• North Tarrant Express (Northeast Loop 820 and SH 121/183 Airport Freeway).
• DFW Connector (SH 114).
• North Tarrant Express 35W (I-35W North Freeway).
• I-35E (from I-635/LBJ Freeway to US 380).
• I-30 (Tom Landry Freeway).
• Midtown Express (SH 183 Airport Freeway, SH 114, and Loop 12/Walton Walker Freeway).
Pricing Structure
Adjustment Period RTC adopted a policy that requires an interim six-month period with a fixed time-of-day toll schedule before dynamic pricing is implemented. This policy was adopted because dynamic pricing is a difficult concept to implement operationally, and the public can have a difficult time understanding it. During the six-month period, toll rates incrementally increase or decrease according to a pre-established pattern that allows the public to become accustomed to sign placement, operation, and the choices they have. An evaluation is conducted during this period to assess the performance of pricing in meeting goals and expectations. After the six months are complete, dynamic pricing is implemented if no major problems were found with fixed time-of-day tolling. The current maximum toll rate is $0.83 per mile of travel (this rate began as $0.75 and was adjusted according to the Consumer Price Index) (17).
Price Setting Once dynamic pricing is implemented, toll amounts for new TEXpress Lanes are determined by using real-time traffic information and evaluating demand. Prices are updated every five minutes. The dynamic pricing for the TEXpress system is designed to guarantee that travel speeds in the lanes never fall below 50 mph. Average toll prices can range from $0.10 to $0.15 per mile during lighter traffic, and from $0.45 to $0.75 per mile during peak hours (18).

29
A 50 percent toll discount is offered for vehicles with two or more occupants during peak periods (6:30 a.m. to 9 a.m. and 3 p.m. to 6:30 p.m., Monday through Friday). These vehicles pay the same rate as SOVs at all other times. To obtain this discount, eligible vehicles must have a TollTag or TxTag and activate their HOV status at least 15 minutes prior to entering the TEXpress Lanes. Activation can be done using the TEXpress mobile application or the DriveOnTEXpress.com website (19). Motorcycles are provided a discount, according to federal statute. Trucks are allowed to use the TEXpress Lanes (many HOT lanes prohibit them), but they pay higher prices.
The DFW region has a mix of free and paying users traveling on the managed lanes. Only some of these users respond to adjustable toll rates since others can travel toll free during select times. The varied proportion of toll-paying drivers and free carpools causes difficulties with performance management because both groups respond differently to changes in operational strategies (e.g., increasing the toll rate or changing the occupancy requirement). Additionally, converting the former HOV lanes to HOT lanes can allow a large number of SOVs to use the facility for the first time. However, in some corridors HOV demand is already greater than the available capacity. Increasing the HOV occupancy requirement from two-person to three-person carpools was discussed as a possible mitigation strategy (20), but existing two-person carpools that use facilities with an HOV2+ occupancy rule were found to be very resistant to an increase in vehicle occupancy (21). Thus, NCTCOG established a policy that would incrementally increase the occupancy requirement from two- to three-person carpools for each corridor as conditions warranted (22).
Traffic Thermostat NCTCOG is also testing the application of a traffic thermostat for select corridors that would manage changes in occupancy requirements in the future based on performance thresholds. For example, policy makers can establish a speed goal of 50 mph for any managed lane. If the speed drops below 50 mph, operators implement pre-planned strategies, such as increasing the occupancy requirement (e.g., from two- to three-person carpools). This reaction is similar to how a traditional thermostat heats or cools a home by measuring existing indoor temperature. The underlying premise for the traffic thermostat tool is that it allows the public to see a direct association between goals, performance, and action—ensuring greater transparency and accountability (23).
Dynamic Tolls The NTE TEXpress Lanes and the LBJ TEXpress Lanes opened in October 2014 and September 2015, respectively. Both facilities function as express lanes, with new tolled managed lanes running adjacent to general-purpose lanes. The toll to access these facilities is adjusted dynamically in response to traffic congestion. As of the date of this report, these facilities have led to favorable public perceptions. A recent survey of NTE and LBJ TEXpress customers found that favorable perceptions of the NTE facility went up from 46 percent to 70 percent between
30
2013 and 2015, and favorable perceptions of the LBJ facility went from 46 percent to 76 percent between 2013 and 2016 (24).
Public Outreach
Education about How Congestion Pricing Works Regional entities advanced an express lane system as a reaction to the lack of funding to meet capacity needs (12). In response to anticipated funding shortfalls, RTC adopted a policy in 1993 that an evaluation for potential tolling options must be conducted on all new freeway capacity and all roads on new right of way (25). This approach was augmented with outreach to the public that made the cost of infrastructure and the revenues available more transparent because research identified these items as an existing gap in public understanding (11).
In presenting managed lanes and pricing as options for the public to consider, regional transportation agencies in DFW have focused on three key problems:
• Financial constraints: Taxes and fees collected by public agencies are insufficient to support the transportation funding needs.
• Increasing peak-period congestion: Job and population growth are leading to growing traffic congestion in many corridors.
• Air quality compliance: The growth in travel and the lack of new transportation capacity are leading to problems meeting the emission levels needed to meet air quality standards.
Agencies in the DFW region relied on extensive marketing and outreach to describe how congestion pricing works. During the project development process, transportation officials facilitated monthly calls to ensure that principal decision makers were aware of the project and related goals. Messages to the public were consistent across all stakeholder groups, and NCTCOG encouraged transparency and inclusivity during its public meetings by encouraging broad participation (26).
LBJ Express Public Engagement The public engagement process for the recent LBJ Express (I-635) started by forming a broad-based committee of users who were most likely to be impacted by the facility. The committee consisted of representative homeowners, businesses, environmental groups, commuters, technical experts, governmental entities (city, county, and regional), and transportation agencies (transit, toll, and federal and state agencies). During a three-year period, over 134 project meetings were held. These meetings led to four specific areas of concern for the LBJ project (14):
31
• Compromises to mobility and safety at current and predicted congestion levels.
• The inability to respond to changing traffic conditions, travel patterns, and travel choices in a flexible manner.
• The impacts of the freeway and arterial street network on the community.
• Limited funding for needed and identified transportation improvements.
Local agencies presented pricing as a valuable tool for meeting infrastructure needs in the absence of traditional tax-supported funding, as well as helping to improve mobility and manage congestion. Regional leaders were cognizant that members of the public were generally unaware of costs associated with developing and maintaining transportation infrastructure. Public outreach efforts therefore compared the project costs to the tax revenue that would be collected to illustrate the unsustainability of the current financing arrangement.
Regional outreach efforts have also focused on the amount of time drivers spend in delay, and the potential for pricing to provide reliable travel times. NCTCOG stated that dynamic pricing could help to guarantee an acceptable speed and allow drivers the choice to use the facility in return for paying a toll and realizing travel time savings. Planners credited easily digestible messages within an open and continuous communications program for maintaining support from communities and elected officials (26).
US 75 Express/HOV Lanes Response to the Public Opposition to plans to convert the US 75 Express/HOV Lanes in Collin County to managed toll lanes was raised in 2014, with opponents arguing that the proposed project did not meet resident safety, permit access, or provide the congestion relief demanded by users. Collin County residents felt they were “paying too much for travel” and not enough public input was sought for the project. Opponents suggested the state should consider opening the existing HOV lanes for general-purpose use, which they believed would immediately add 20 percent capacity to the facility (27).
TxDOT issued a response that described the existing proposal as being in accordance with the regional Mobility 2035 plan and that opening the HOV lane for general-purpose use would not allow for effective traffic management and not provide SOV travelers the option of taking a reliable trip for a toll. Additionally, TxDOT cited that converting the HOV to a general-purpose lane would require adding inside shoulders and reconstructing bridges, and would impact regional air quality requirements (28).
Houston Katy Freeway Managed Lanes and METRO HOT Lanes Congestion pricing is currently in use on six major roadways totaling over 100 lane-miles in the Houston region. The following agencies operate these roadways:

32
• HCTRA operates the Katy Freeway Managed Lanes 24 hours a day, seven days a week.
• Houston METRO operates HOT lanes as part of its comprehensive HOV/HOT Lanes Program. These facilities operate during designated morning and evening peak hours.
Figure 3 shows a map of all the HOT lanes in Houston. The HCTRA-operated Katy Freeway Managed Lanes are in green. The METRO HOT Lanes are in blue, except for a short HOV lane operates without tolls to the west of the Katy Freeway Managed Lanes. Portions of US 59 in Fort Bend County operate as either an HOV or HOT lane, depending on the location. HCTRA operates additional toll roads in the area such as the Hardy Toll Road, Tomball Tollway, and the Ship Channel Bridge, but these facilities operate as traditional toll roads in that they do not feature adjacent general-purpose lanes and toll rates are flat.
Source: (29)
Figure 3. Houston’s Congestion Pricing HOT Lane Network.
System Development
Reversible HOV Lane Houston’s first HOV lane was a single lane on I-45 North implemented in 1979 and originally operated only during rush hours. The lane flowed inbound to central Houston in the morning peak period and outbound in the evening. The lane was demarcated by converting an off-peak direction lane to an HOV lane using removable pylons inserted into holes in the pavement. The

33
HOV lane demonstrated that Houston residents were more likely to ride transit and carpool if it saved them time for a reasonable fare.
However, most corridors of the Houston freeway system faced significant congestion in both directions so this borrowed-lane option was not viable everywhere. Instead, an HOV lane system with barriers was designed and implemented over several years to alleviate congestion and provide travelers with a fast, reliable travel option. The primary purpose of the lanes was—and still is—to accommodate transit buses, vanpools, and carpool vehicles.
The initial single-lane barrier-separated HOV lane along the I-10 Katy Freeway corridor reversed direction during the midday to serve morning inbound and evening outbound traffic. This same design was implemented along the I-45 North, I-45 South, US 59 Southwest, US 59 East, and US 290 Northwest Freeway corridors. This created a radial HOV system that runs between Houston’s multiple business and commercial districts and the surrounding areas.
Tools to Manage Demand Pricing is only the most recent tool in a series of efforts to encourage and manage demand for Houston’s existing HOV lane network. Before pricing, the primary tool available was occupancy restrictions. For example, the Katy Freeway HOV lane opened in 1984 exclusively for the use of transit buses and certified and trained vanpool operators. However, the HOV lane was underused, and the occupancy restrictions were relaxed to include two-or-more person carpools to increase the lane’s use. The HOV occupancy requirements were adjusted over time to maintain free-flow speeds for transit and carpools while still making use of the available capacity in the HOV lane. With a three-or-more person carpool requirement in place, there were not enough vehicles for the lane to appear full. But when two-person carpools were allowed in the HOV lane, there were too many vehicles, and stop-and-go traffic developed.
In 1998, Houston’s QuickRide program began as the first use of congestion pricing in Texas. QuickRide was designed to encourage and manage demand by allowing two-person carpools to pay a $2.00 flat toll to use the I-10 Katy HOV lane during peak periods. Transit, vanpools, and three-person carpools were allowed to use the system without a charge. Houston METRO designated the I-10 Katy Freeway as the first corridor to implement the pilot program. QuickRide was expanded to the US 290 HOV lane in 2000 (30). These pilot projects became the foundation for the present congestion pricing system in Houston that offers variable time-of-day prices using electronic tolling technology to keep traffic flowing on the Katy Managed Lanes and the METRO HOT Lanes.
Katy Freeway Express Lane Construction A series of corridor studies and pricing strategies were assessed for the Katy Freeway between 1997 and 2007. A critical goal of the studies was to find solutions that could improve mobility on the entire corridor (including for tolled and non-tolled travelers) in a cost-effective manner. Assessments evaluated alternatives based on estimations of increased carpool use, reduced congestion, and improved travel speeds. Revenue generation was not considered a major goal.

34
Based on past studies, the recommended alternative was to construct four special-use lanes in the median (two in each direction) and additional general-purpose and frontage road lanes (one of each in each direction) (31). In 2008, a $2.8 billion reconstruction and improvement project on the Katy Freeway replaced the single, reversible HOT lane with two express lanes in each direction.
HOV to HOT Conversion Houston METRO subsequently converted the remaining HOV lanes to HOT lanes on the US 290 Northwest, US 59 Eastex, US 59 Southwest, I-45 North, and I-45 Gulf freeways. The conversions were done to better manage periods of overuse during peak hours and underuse during off-peak periods. The HOV lanes were originally intended for buses and vanpools but had operated with carpools since the mid-1980s. Carpoolers were still granted free travel in the HOT lanes. Houston METRO coordinates a park-and-ride system consisting of 29 lots with more than 33,000 parking spots and a wide array of vanpool and carpool options in the region (32). Many of these facilities were designed to provide direct ramp connections to the HOT lanes in order to ensure these vehicles have priority access.
Pricing Structure Pricing along the HCTRA-operated Katy Freeway Managed Lanes is based on a fixed time-of-day pricing schedule with prices that adjust according to predetermined congestion estimates. During most of the day on weekdays, the toll is a flat $0.30 to $0.40 charge. Prices increase during weekday peak travel according to distinct tiers. The highest price occurs when demand is expected to be the highest, with incremental changes before and after the peaks.
Figure 4 shows the toll rate schedule for Eldridge Plaza, for both the eastbound and westbound directions. Carpools and motorcycles can use the managed lanes for free during designated HOV hours. The HOV hours vary slightly depending on the corridor and adjust based on historical performance. Starting in 2013, trucks with three or more axles were a charged $7.00 per tolling plaza (33). A 2013 analysis showed that, for the Katy Managed Lanes, travel time savings were approximately 5 minutes in the morning and 14 minutes in the afternoon, with travel time advantages over the general-purpose lanes increasing as overall volume grows (31).
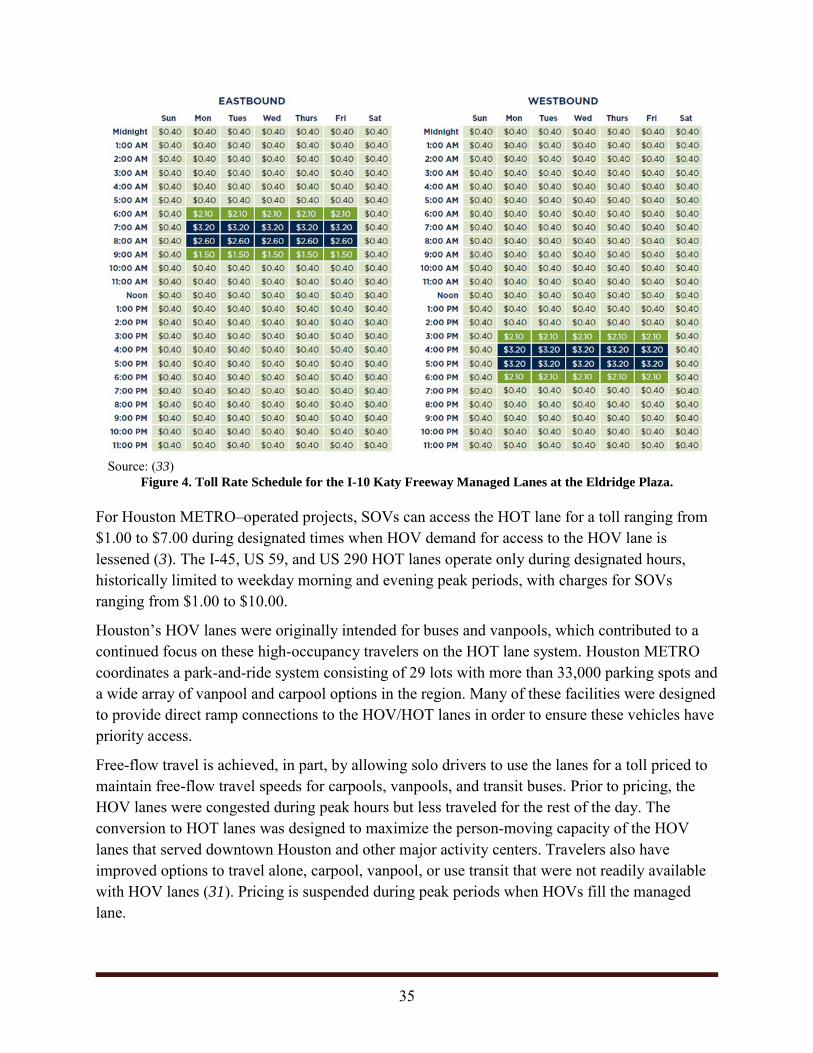
35
Source: (33)
Figure 4. Toll Rate Schedule for the I-10 Katy Freeway Managed Lanes at the Eldridge Plaza.
For Houston METRO–operated projects, SOVs can access the HOT lane for a toll ranging from $1.00 to $7.00 during designated times when HOV demand for access to the HOV lane is lessened (3). The I-45, US 59, and US 290 HOT lanes operate only during designated hours, historically limited to weekday morning and evening peak periods, with charges for SOVs ranging from $1.00 to $10.00.
Houston’s HOV lanes were originally intended for buses and vanpools, which contributed to a continued focus on these high-occupancy travelers on the HOT lane system. Houston METRO coordinates a park-and-ride system consisting of 29 lots with more than 33,000 parking spots and a wide array of vanpool and carpool options in the region. Many of these facilities were designed to provide direct ramp connections to the HOV/HOT lanes in order to ensure these vehicles have priority access.
Free-flow travel is achieved, in part, by allowing solo drivers to use the lanes for a toll priced to maintain free-flow travel speeds for carpools, vanpools, and transit buses. Prior to pricing, the HOV lanes were congested during peak hours but less traveled for the rest of the day. The conversion to HOT lanes was designed to maximize the person-moving capacity of the HOV lanes that served downtown Houston and other major activity centers. Travelers also have improved options to travel alone, carpool, vanpool, or use transit that were not readily available with HOV lanes (31). Pricing is suspended during peak periods when HOVs fill the managed lane.

36
The differences in facility type, congestion level, and traffic demand make it difficult to generalize a single pricing plan for the Houston region, but the overall strategy is consistent—develop a policy that encourages HOV use and uses a toll price that rations the remaining lane capacity to ensure a reliable, high-speed trip for users. Since all the HOV corridors had both free and priority lanes added, conditions are better than they would be no matter which choice a traveler makes.
Public Acceptance
HOV Lanes Throughout Houston, public concerns centered on congestion and the associated constraints on regional mobility. Area agencies proffered HOV and HOT lanes as an alternative choice for drivers if they complied with the entry requirements.
At first, the HOV lanes started operating in the late 1970s and 1980s and experienced incremental growth over time. By 1988, the I-10 Katy Freeway HOV lane adjusted vehicle occupancy during select times from two to three persons per vehicle when the flow rate reached capacity—almost 1,500 vehicles per hour. In 2003, all of the HOV lanes serviced 74,867 carpool occupants, 43,225 bus passengers, 2,500 vanpool riders, and 407 motorcycles per weekday. At the same time, travel time savings compared to the general-purpose lanes ranged from approximately 2 to 22 minutes, depending on the corridor. Public perceptions were mostly positive, with 40 to 81 percent (varied by corridor) of general-purpose lane travelers who believed that HOV facilities were a good investment (34).
Congestion Pricing In the mid-1990s, congestion across all corridors worsened, and agencies sought alternatives to expand and make better use of the existing HOV system. One alternative was to sell the limited amount of excess capacity to SOVs. A fee was an attempt to get HOV lanes operating near capacity and to offer select drivers a choice to bypass congestion.
The early trials of congestion pricing in Houston showed positive public perceptions and minimal impact to transit. A survey conducted on the 1998 QuickRide system, precursor to the Katy Freeway Managed Lanes and METRO HOT Lanes program, found that although toll users had significantly higher incomes and were significantly younger than those using the free alternative lanes, the system did not have negative impacts for any travelers due to the improved overall congestion and free transit access to the managed lanes.
Also in the 1990s, travelers on the I-10 Katy Freeway consistently voiced complaints about congestion. The agency partners (who consisted of HCTRA, TxDOT, and Houston METRO) responded by constructing a major reconstruction project to expand the number of managed lanes, general-purpose lanes, and frontage roads across a 12-mile section that was rapidly growing due to increased economic activity. The I-10 Katy Freeway reconstruction was billed as

37
a project that would provide more options and a balanced system for all travelers, in addition to meeting future demand for land use development (31).
The Katy Freeway Managed Lanes were an improvement upon the former HOV lane and were well received by travelers and the public. Three years after opening, a research study found that travel time savings were 5 minutes in the morning and 14 minutes in the afternoon. In 2011, roughly 1.5 million transponders registered to different vehicles were observed traveling in the managed lane. Over 80 percent of users made a total of 60 or fewer trips in the managed lane, and only 11 percent made more than two trips per week. Based on a user survey, 64 percent of managed lane travelers stated they used the managed lanes because of time savings, 36 percent cited less stress, and 34 percent liked the lanes because they were not congested (31).
After seeing the positive reception of the I-10 Katy Freeway Managed Lanes, Houston METRO converted most of the other HOV lanes in the region to HOT lanes.
Expanded Hours Houston METRO wanted to improve traveler satisfaction by providing new options for commuters, increasing safety, improving air quality, and better using the existing HOV system. A couple years after the HOT lanes opened, travelers wanted to use the HOT lanes during weekday nights and weekends—when these lanes were traditionally closed.
In 2015, Houston METRO conducted a pilot test to expand the hours of operation. The pilot test was originally scheduled for a 90-day period but was expanded after the Houston METRO Board of Directors heard positive opinions. A survey of 1,689 HOT lane users, completed during the pilot, found that 95 percent used it to bypass congestion, 85 percent wanted to save time, and 57 percent wanted safer traveling conditions. Roughly 80 percent of SOVs, HOVs, and bus riders in the sample either agreed or strongly agreed that Houston METRO should continue to extend weekday hours.
In comparison, a smaller sample of 197 surveyed respondents did not use the HOT lanes within the past year. The group cited a number of reasons for not traveling in the HOT lane: 49 percent felt the lanes did not connect to their destination, 25 percent felt it was too expensive, 19 percent found it hard to understand times and direction, 14 percent expected no time savings, and 11 percent could not find either a van or carpool.
Despite the overwhelming public demand for extending the hours of operating the HOT lanes, the Houston METRO Board of Directors ended the pilot and reverted to normal operation, citing a high cost to extend the toll systems integrator contract and fewer drivers using the lanes during those hours (35).

38
Minnesota I-394 and I-35 West HOT Lanes In May 2005, the Minnesota Department of Transportation (MnDOT), in cooperation with regional partners, implemented the I-394 and I-35W HOT lanes in the Minneapolis/St. Paul region. I-394 was among the earliest HOT lane projects in the United States. Both the I-394 and I-35W projects converted and extended existing HOV lanes to HOT operation. Transit vehicles, HOVs, and motorcycles were allowed to use the lanes for free, while SOVs were subject to a dynamic toll that varied based on congestion.
Figure 5 shows a map of the I-394 and I-35W MnPASS Lanes (shown in green), the I-35E MnPASS Lanes that partially opened in November 2015 (shown in yellow), and the planned future managed lane system (shown in purple).
Source: (36)
Figure 5. MnPASS Lane Network.
39
System Development
HOT Lane Legislation Support among legislators and political leaders enabled the implementation of HOT lane projects in Minnesota and provided a framework for their development. In 2000, the state legislature directed MnDOT to examine the perception that the existing HOV lanes were underused while congestion was growing on the general-purpose lanes. A Value Pricing Advisory Task Force, including political, business, environmental, and transportation leaders, was given the task of reviewing this perception and exploring value pricing solutions (37).
Technical consultants and MnDOT studied a range of options that informed the development of HOT lane legislation, which was passed by the Minnesota Legislature in 2003 (38). That legislation authorized MnDOT to convert HOV lanes to HOT lanes and charge user fees to operators of SOVs using designated HOV lanes. The Minnesota Legislature passed this legislation with the explicit goals of improving operating efficiency and providing more options for travelers. In addition, the bill stipulated that revenue collected must be used to repay the costs of installing or operating the system and, if funds remain, to support capital improvements and transit services in the corridor (39).
Legislators were interested in using congestion pricing to address the growth in regional congestion while complying with the state’s fiscal budget. Years of public discourse allowed legislators to become more aware of how congestion pricing can manage congestion—despite their overall wariness about additional taxes, fees, and tolls. The 2003 bill passed with relatively little controversy because the preceding studies and the efforts of the advisory task force addressed these concerns.
Urban Partnership Agreement Following the implementation of the MnPASS Lanes on I-394, MnDOT studied the potential for expanding MnPASS to other regional roadways. In 2006, the U.S. Department of Transportation announced the Urban Partnership Agreement (UPA) program to fund projects evaluating the potential of pricing to reduce congestion, which represented a dramatic increase in federal incentives available for demonstrating congestion pricing projects. This opportunity sparked MnDOT to accelerate its existing efforts and seek funding for HOT lanes on I-35W through the UPA. A swift but comprehensive process involved a broad range of stakeholders to develop a proposal that won a $133 million UPA grant in August 2007 (39).
In 2008, the state legislature amended the 2003 HOV-authorizing statute to allow highway shoulder lanes to be designated as dynamically priced lanes. The amendments also included guidelines for a congestion pricing project on I-35W (40). During the UPA proposal discussions, political leaders made it clear that certain options, such as tolling all lanes of a highway, remained politically infeasible. In addition, legislative debates on the state gas tax and transportation funding overlapped with the UPA process, focusing additional attention on

40
transportation issues, but ultimately did not prevent a $1 million state appropriation and bipartisan agreement to support the UPA process (39).
Pricing Structure Both of the Twin Cities’ projects converted existing HOV lanes to HOT operation, with transit vehicles, HOVs, and motorcycles allowed to use the lanes for free, and SOVs subject to a dynamic toll that varies based on congestion. The dynamically priced tolling system is similar on both roadways, with tolls ranging from $0.25 to $8.00. The fees are collected electronically, requiring vehicles to have a MnDOT transponder that is provided for a monthly lease fee of $1.50. As of 2014, average peak-period tolls range from $1.00 to $4.00 with an average cost of $1.82 (41).
When the I-394 HOT lanes opened in 2005, a challenge to the pricing system emerged. The original pricing algorithm led to dramatic fluctuations in prices that caused unpredictable flows and confused drivers. This was caused by rapid price increases in response to added vehicles in the HOT lane, which in turn led drivers to exit the lane. This led to a price decline, incentivizing drivers back into the lane and starting the cycle again. In January 2006, an adjustment was made to the pricing algorithm that smoothed pricing changes and reduced fluctuations. While the range of possible tolls was not changed, the resulting modified algorithm produced higher average tolls (42).
Transit and carpool advocates were concerned that existing HOV users would be negatively affected by the conversion to MnPASS Lanes. Political leaders were interested in congestion pricing but were wary of negative consequences for transit and carpooling. The 2003 legislation specifically required that the project maintain benefits for transit and carpool users. The MnPASS project, as conceptualized, had provisions to ensure that transit and carpool users were prioritized and would benefit from the project.
A one-year follow-up evaluation of the I-394 MnPASS Lanes found that transit speeds on the corridor did not decrease. When surveyed, 49 percent of transit users and 60 percent of carpoolers supported the idea of allowing solo drivers to use the lane for a fee (43). Transit providers were also survey before-and-after implementation to assess their reactions. One agency, Southwest Metro Transit, reported difficulty merging transit vehicles into the MnPASS Lanes at one northbound corridor of I-394. In general, the response from transit agencies was positive—three out of four providers, who had voiced concerns before the MnPASS Lanes opened, indicated there was a negligible impact on their operations caused by the MnPASS program.
Public Outreach
Education about Congestion Pricing Within the Minneapolis/St. Paul region, the public was concerned with increasing congestion, limited right of way, and a decrease in state funds to reconstruct urban freeways. A number of stakeholders discussed the concept of congestion pricing in earnest and led a public dialogue

41
about the benefits of road pricing. The University of Minnesota was a key stakeholder throughout the public engagement process by studying critical policy issues, traveler behavior, and technologies, and served as a clearinghouse for disseminating best practices in the field. Improved stakeholder understanding of key issues, benefits, and tradeoffs were cited as a primary reason for the successful implementation of the MnPASS program (44).
HOV to HOT Conversion I-394. In 2003, public discussion and continuing research led to the adoption of state legislation that authorized MnDOT to convert the existing HOV lanes to HOT lanes on I-394. Specific provisions in the law ensured that key program goals would be met, specifically for maintaining performance and preference for transit and carpoolers. The authorizing legislation also specified that excess funding would be dedicated to roadway capital improvements and transit expansion on the corridor. The presence of state stature that mandated specific preferences helped to ensure public trust (39).
Five years after the start of congestion pricing in 2005, the I-394 MnPASS observed improvements compared to use of the former HOV lane and how the public perceived the project. Vehicle throughput increased by 48 percent from 2004 (the last year of the HOV lane) to 2010, and person throughput increased 25 percent during the same period. However, carpooling decreased by 17 percent, which was due to enhanced transit service in the corridor. Drivers who traveled in the I-394 MnPASS Lane experienced a travel time savings of two to three minutes on the 11-mile corridor. Based on a traveler survey, 90 percent of users indicated they were satisfied or very satisfied with the program. Roughly 80 percent of MnPASS travelers either agreed or strongly agreed the MnPASS was providing value for their money spent. However, 44 percent of users stated they were concerned about the cost and about drivers cutting into the lane at non-designated entry points (45).
I-35W. In 2009, the success of this first HOT lane on I-394 led to the development of a second, similar HOV-to-HOT lane conversion on I-35W. By this time, key stakeholders and community groups saw the benefits associated with congestion pricing and knew what it entailed by observing how the I-394 MnPASS operated. Three years after opening, vehicle throughput increased by 77 percent, and person throughput increased by 39 percent compared to 2008. Average speeds on the non-tolled general-purpose lanes increased by 3 to 4 mph during the morning peak period and declined by 1 to 2 mph during the afternoon peak period. Overall, roughly 75 percent of MnPASS users had a high level of customer satisfaction by stating the lanes provided value for their money spent. Free-flow travel speeds on the I-35W MnPASS were maintained at least 95 percent of the time (41).
The 2003 HOT-lane-authorizing legislation included a provision that free-flow speeds were to be maintained for transit and carpoolers. In the I-35W project, transit improvements were a central element of the proposal (39).

42
Equity Early attempts to implement congestion pricing in Minnesota had a perception that only high-income users would benefit from the program. According to evaluations of the project, the I-394 MnPASS lanes benefited from a well-publicized discussion that potential time savings and increased reliability were valuable for all income groups.
In the follow-up evaluation of the I-394 project, travelers from all income groups supported and used the MnPASS Lanes. A majority of residents in low (55 percent), medium (70 percent), and high (79 percent) income classes approved of allowing SOV drivers to pay to use the HOT lanes (46). A 2008 study found that both “higher income” and “living closer” to the I-394 corridor were correlated with higher levels of use (46).
Other project evaluations have also shown improved travel conditions on the general-purpose lanes. The evaluation of I-35 project found that benefits were received in all areas and that the reinvestment of revenue between capital improvements and transit improvements benefits all user groups. However, the potential for exposure to air pollution was higher in some neighborhoods than others (47).
Stakeholders Outreach efforts during the development and implementation of these projects were targeted to specific stakeholders and interest groups. For example, the projects themselves were tailored to meet transit rider needs by maintaining a high average travel speed and on-time arrival rates for buses traveling on the corridor. Planners therefore informed transit users that projects would maintain a high average travel speed and increase the on-time arrival for buses traveling on the corridor.
Several advocacy groups comprised of local government officials and business leaders from the I-35W corridor supported the I-35W MnPASS Lanes project. These stakeholders recognized the value that could come from improved traffic and transit service along their corridor and were central in promoting the congestion pricing plans in ways that MnDOT could not or did not feel comfortable in doing itself (39).
MnDOT Response to Public Unexpected congestion in the off-peak direction during the first month of MnPASS operations on I-394 generated a public outcry and negative publicity for the MnPASS Lanes. In response, MnDOT quickly returned the tolling hours to peak periods, similar to the historical HOV hours before tolling (43) and moved ahead with a planned auxiliary lane construction project on the westbound segment of I-394 (48). During project development, the project team and community task force had considered a peak-only tolling schedule but ultimately decided to operate the toll lanes 24 hours a day despite some opposition from task force members.

43
The prompt response of MnDOT to the subsequent congestion increase not only addressed the problem but helped assure the public that MnDOT was willing and prepared to make adjustments and address issues (43).
Puget Sound HOT Lane Network in Seattle, Washington The Puget Sound region, which includes Seattle and outlying communities in Washington, is home to various congestion pricing projects including the SR 520 Toll Bridges, SR 167 HOT Lanes, and I-405 Express Toll Lanes (Figure 6). The region also features the tolled SR 16 Bridge, but it is a fixed-toll facility, and price does not change in response to congestion. The Washington State Department of Transportation (WSDOT) manages the day-to-day operations of facilities with congestion pricing in Washington.
Source: (49)
Figure 6. Planned Regional Seattle Express Lane Network.
System Development
Early Tolling Projects Washington has used tolling in bridge construction since 1937, when its state legislature created the Washington Toll Bridge Authority with a mandate to finance, construct, and operate toll bridges in the state. In the early 1990s, WSDOT attempted to expand tolling operations by establishing six P3s to build new transportation facilities. However, due to strong public
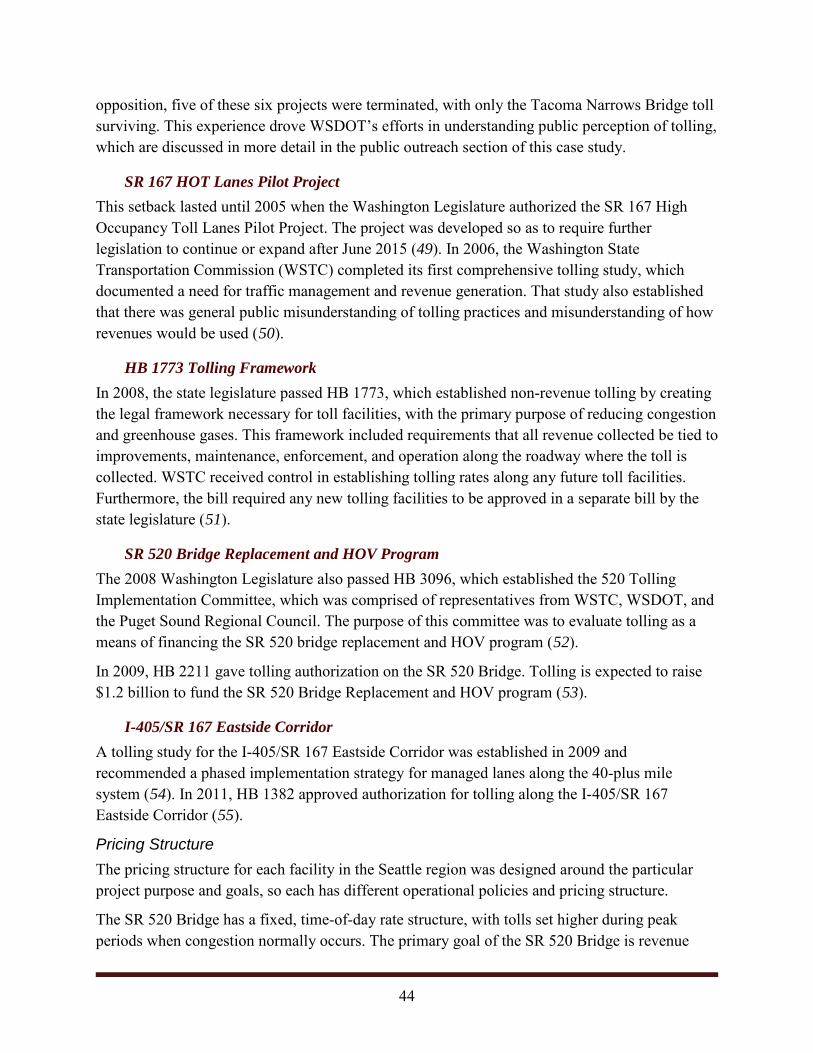
44
opposition, five of these six projects were terminated, with only the Tacoma Narrows Bridge toll surviving. This experience drove WSDOT’s efforts in understanding public perception of tolling, which are discussed in more detail in the public outreach section of this case study.
SR 167 HOT Lanes Pilot Project This setback lasted until 2005 when the Washington Legislature authorized the SR 167 High Occupancy Toll Lanes Pilot Project. The project was developed so as to require further legislation to continue or expand after June 2015 (49). In 2006, the Washington State Transportation Commission (WSTC) completed its first comprehensive tolling study, which documented a need for traffic management and revenue generation. That study also established that there was general public misunderstanding of tolling practices and misunderstanding of how revenues would be used (50).
HB 1773 Tolling Framework In 2008, the state legislature passed HB 1773, which established non-revenue tolling by creating the legal framework necessary for toll facilities, with the primary purpose of reducing congestion and greenhouse gases. This framework included requirements that all revenue collected be tied to improvements, maintenance, enforcement, and operation along the roadway where the toll is collected. WSTC received control in establishing tolling rates along any future toll facilities. Furthermore, the bill required any new tolling facilities to be approved in a separate bill by the state legislature (51).
SR 520 Bridge Replacement and HOV Program The 2008 Washington Legislature also passed HB 3096, which established the 520 Tolling Implementation Committee, which was comprised of representatives from WSTC, WSDOT, and the Puget Sound Regional Council. The purpose of this committee was to evaluate tolling as a means of financing the SR 520 bridge replacement and HOV program (52).
In 2009, HB 2211 gave tolling authorization on the SR 520 Bridge. Tolling is expected to raise $1.2 billion to fund the SR 520 Bridge Replacement and HOV program (53).
I-405/SR 167 Eastside Corridor A tolling study for the I-405/SR 167 Eastside Corridor was established in 2009 and recommended a phased implementation strategy for managed lanes along the 40-plus mile system (54). In 2011, HB 1382 approved authorization for tolling along the I-405/SR 167 Eastside Corridor (55).
Pricing Structure The pricing structure for each facility in the Seattle region was designed around the particular project purpose and goals, so each has different operational policies and pricing structure.
The SR 520 Bridge has a fixed, time-of-day rate structure, with tolls set higher during peak periods when congestion normally occurs. The primary goal of the SR 520 Bridge is revenue

45
generation, with funding going toward the construction of a new bridge over Lake Washington. A fixed, time-of-day toll schedule provides a greater assurance of revenue generation, lessening the financial risk of the project and requiring less funding for bond insurance. In contrast, the primary goal of the SR 167 HOT Lanes and the I-405 Express Toll Lanes is congestion relief and mobility, so dynamic tolls are set to allow operators the capability of adjusting for real-time conditions.
SR 520 Bridge The pricing for the SR 520 Bridge ranges from $0 in the midnight–5 a.m. time segment to $3.80 electronic payment ($5.40 pay by mail) in the peak-hour segments 7 a.m.–9 a.m. and 3 p.m.–6 p.m. Each time segment is adjusted up or down to discourage peak-time usage. Rates increased on July 1, 2015, at the direction of WSTC to reach peak charges of $3.90 for electronic tolling and $5.55 if paid by mail (56). Table 4 shows the toll rates as of July 2016 to cross the SR 520 Bridge.
Table 4. SR 520 Bridge Toll Rates. Monday–Friday Good To Go! Pass Pay By Mail
Midnight to 4:59 a.m. $0 $0 5 a.m. to 5:59 a.m. $1.90 $3.90 6 a.m. to 6:59 a.m. $3.25 $5.25 7 a.m. to 8:59 a.m. $4.10 $6.10 9 a.m. to 9:59 a.m. $3.25 $5.25 10 a.m. to 1:59 p.m. $2.55 $4.55 2 p.m. to 2:59 p.m. $3.25 $5.25 3 p.m. to 5:59 p.m. $4.10 $6.10 6 p.m. to 6:59 p.m. $3.25 $5.25 7 p.m. to 8:59 p.m. $2.55 $4.55 9 p.m. to 10:59 p.m. $1.90 $3.90 11 p.m. to 11:59 p.m. $0 $0
Source: (57)
SR 167 HOT Lanes and I-405 Express Toll Lanes The SR 167 HOT Lanes and I-405 Express Toll Lanes both use dynamic pricing with a set possible range of $0.50 to $9.00 along SR 167 and $0.75 to $10.00 along I-405. WSTC sets the ranges, and price varies according to the number of vehicles currently using the facilities. The I-405 HOT Lanes include three destination zones that allow prices to be linked for specific end locations (57). Destination zones, and their individual charges, are shown on signage along the I-405 corridor displaying whether free HOV access is permitted for HOV2+ or HOV3+. Figure 7 shows a toll rate sign for the I-405 Express Toll Lanes, with prices for three destinations.
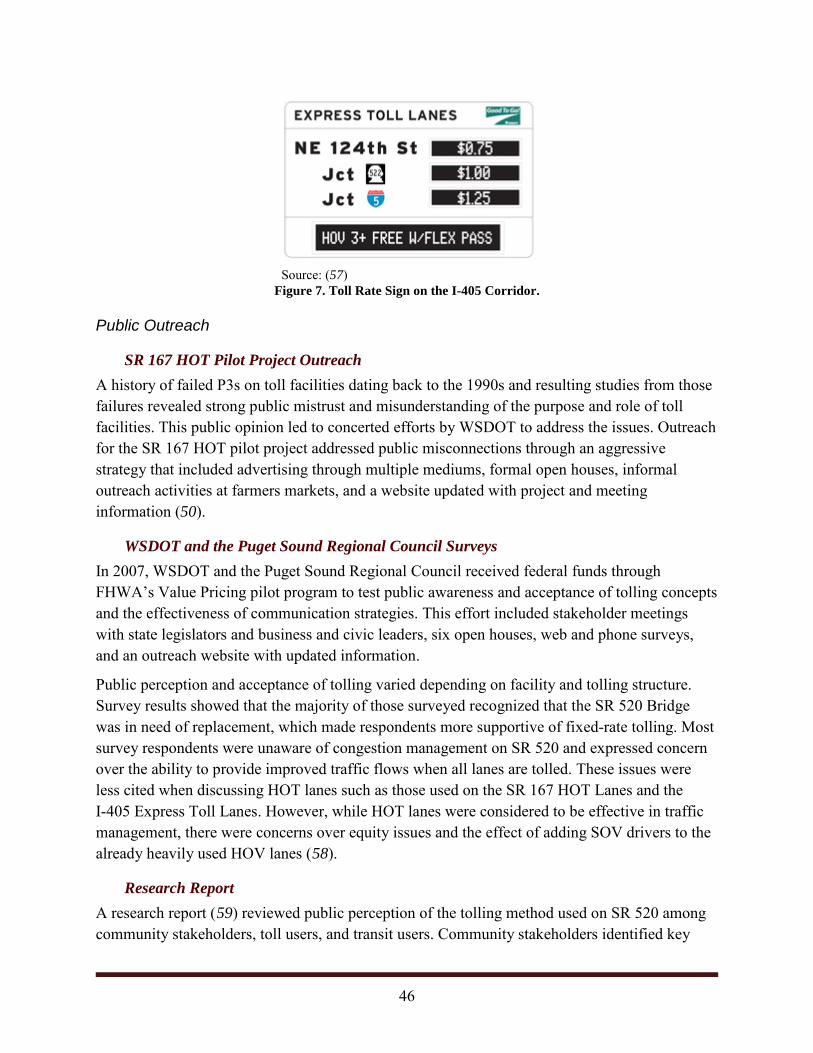
46
Source: (57)
Figure 7. Toll Rate Sign on the I-405 Corridor.
Public Outreach
SR 167 HOT Pilot Project Outreach A history of failed P3s on toll facilities dating back to the 1990s and resulting studies from those failures revealed strong public mistrust and misunderstanding of the purpose and role of toll facilities. This public opinion led to concerted efforts by WSDOT to address the issues. Outreach for the SR 167 HOT pilot project addressed public misconnections through an aggressive strategy that included advertising through multiple mediums, formal open houses, informal outreach activities at farmers markets, and a website updated with project and meeting information (50).
WSDOT and the Puget Sound Regional Council Surveys In 2007, WSDOT and the Puget Sound Regional Council received federal funds through FHWA’s Value Pricing pilot program to test public awareness and acceptance of tolling concepts and the effectiveness of communication strategies. This effort included stakeholder meetings with state legislators and business and civic leaders, six open houses, web and phone surveys, and an outreach website with updated information.
Public perception and acceptance of tolling varied depending on facility and tolling structure. Survey results showed that the majority of those surveyed recognized that the SR 520 Bridge was in need of replacement, which made respondents more supportive of fixed-rate tolling. Most survey respondents were unaware of congestion management on SR 520 and expressed concern over the ability to provide improved traffic flows when all lanes are tolled. These issues were less cited when discussing HOT lanes such as those used on the SR 167 HOT Lanes and the I-405 Express Toll Lanes. However, while HOT lanes were considered to be effective in traffic management, there were concerns over equity issues and the effect of adding SOV drivers to the already heavily used HOV lanes (58).
Research Report A research report (59) reviewed public perception of the tolling method used on SR 520 among community stakeholders, toll users, and transit users. Community stakeholders identified key

47
aspects for acceptance including the need for the government to engage in equity discussions when they arise with tolling. Specific needs that were identified included the need to promote viable alternatives (such as high-quality transit lines) and the need for extensive outreach and marketing to convey the purpose of the toll.
Existing conditions in the region were also found to be integral to acceptance. These include the existence of bridge tolling in the area, Tacoma Narrows Bridge, and the publicly accepted fact that the SR 520 Bridge was in need of replacement (59). The public’s response to tolling in Washington often included concerns about the equity of the distribution of costs, which could place a greater burden on lower-income residents. During implementation of the SR 520 Bridge toll, outreach efforts found an increase in support once those concerned with equity impacts were informed of the 50–70 percent project support across all income groups (58).
Impacts on Transit WSDOT has given transit strong consideration in the implementation of tolling facilities in Washington because transit is considered a key congestion mitigation tool. Transit vehicles are allowed to access both the SR 520 all-lane tolling and the SR 167 HOT Lanes free of charge. Project leaders have demonstrated a commitment to serving transit by altering design along the SR 167 HOT Lanes in response to transit agencies’ concerns. The SR 520 Bridge is a major transit corridor with 24 bus routes and over 13,000 riders a day crossing the bridge. In conjunction with the implementation of tolling on the bridge, additional transit vehicles were added to bridge routes, and two park-and-ride stations were placed on the east side of the bridge.
A 2014 report found that transit ridership had increased by 38 percent between the summer of 2010 and 2012, higher than the average increase of ridership across the competing I-90 bridge. Additionally, the study found that both park-and-ride garages were 99–100 percent occupied by September 2012 (58).
Volpe Survey A Volpe survey of public reaction to the SR 520 Bridge tolling found a statistical increase in driver satisfaction with travel times, speeds, and predictability after the toll was implemented. There were decreases in these measures along the competing I-90 corridor. Overall, the public survey found a generally negative opinion of the SR 520 Bridge toll but an improved opinion of the transit network overall. The survey’s transit user results showed an increased satisfaction with transit travel time, but decreased satisfaction with seat availability and park-and-ride spaces, resulting from an increase in transit ridership (59).
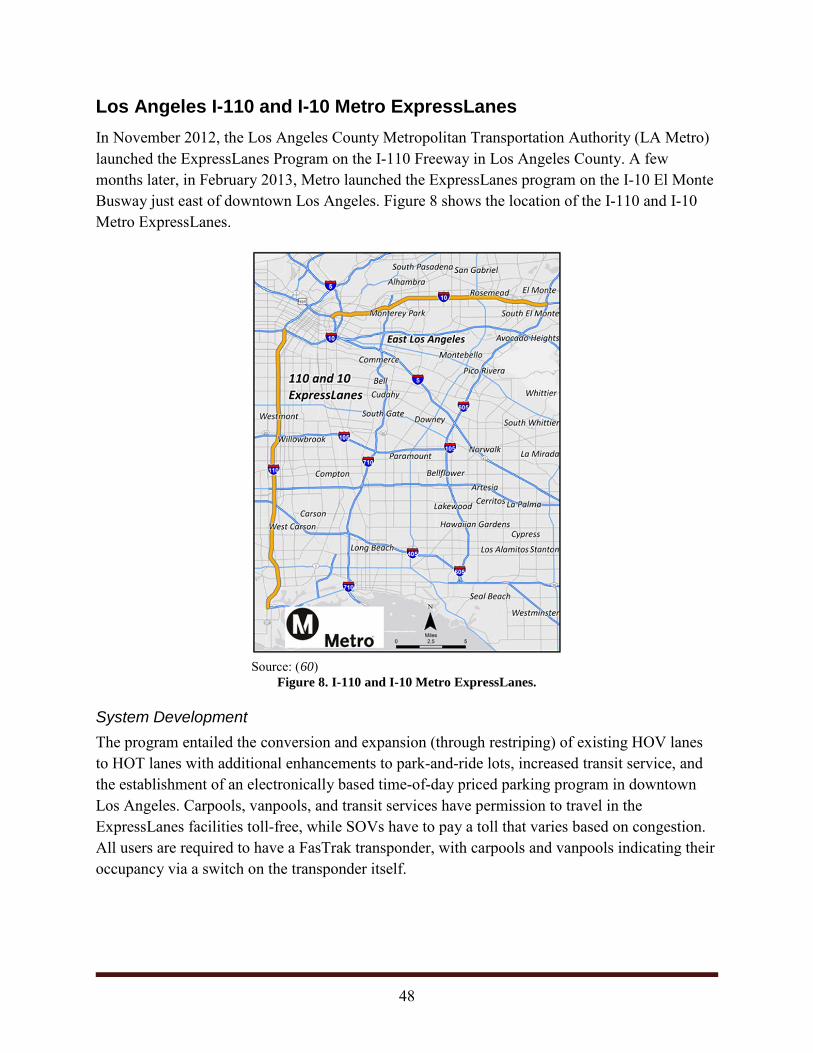
48
Los Angeles I-110 and I-10 Metro ExpressLanes In November 2012, the Los Angeles County Metropolitan Transportation Authority (LA Metro) launched the ExpressLanes Program on the I-110 Freeway in Los Angeles County. A few months later, in February 2013, Metro launched the ExpressLanes program on the I-10 El Monte Busway just east of downtown Los Angeles. Figure 8 shows the location of the I-110 and I-10 Metro ExpressLanes.
Source: (60)
Figure 8. I-110 and I-10 Metro ExpressLanes.
System Development The program entailed the conversion and expansion (through restriping) of existing HOV lanes to HOT lanes with additional enhancements to park-and-ride lots, increased transit service, and the establishment of an electronically based time-of-day priced parking program in downtown Los Angeles. Carpools, vanpools, and transit services have permission to travel in the ExpressLanes facilities toll-free, while SOVs have to pay a toll that varies based on congestion. All users are required to have a FasTrak transponder, with carpools and vanpools indicating their occupancy via a switch on the transponder itself.
49
Compared to the former HOV lanes, the I-10 and I-110 ExpressLanes experienced increases in vehicle throughput:
• Vehicle throughput increased on the I-110 ExpressLanes by 19.9 percent during 2013 and 39.9 percent during 2014 (depending upon location) without additional managed lanes.
• Vehicle throughput increased on the non-tolled adjacent I-110 general-purpose lanes by 3.7 percent during 2013 and 6.9 percent during 2014, as measured at two locations. A third location measured an 8.8 percent decrease in general-purpose lane vehicle throughput on I-110. However, this decrease was attributed to local factors outside the construction of the facility.
• The I-10 ExpressLanes, unlike the I-110 ExpressLanes, constructed a second managed lane as part of the HOV-to-HOT lane conversion, effectively doubling capacity and vehicle throughput (61).
Pricing Structure Pricing for the I-10 and I-110 Metro ExpressLanes is based on a dynamic schedule that changes in real time based on demand. Tolls vary from a minimum of $0.25 per mile to a maximum of $1.40 per mile. If travel speeds fall below 45 mph for a time greater than 10 minutes, the ExpressLanes revert to HOV-only mode, which excludes toll-paying vehicles. Both corridors are priced by individual segments where drivers enter and exit the facility at designated locations—at intermediate points, at both terminals, or through a direct connection to a park-and-ride lot.
The Metro ExpressLanes require all vehicles to pay to use the facility except for verified carpools, public or privately operated transit vehicles, motorcycles, and emergency response vehicles. The carpool requirement to obtain toll-free access is:
• For the I-110 ExpressLanes, two or more people.
• For the I-10 ExpressLanes, three or more people.
Carpools can self-declare their status by using a switchable transponder. This transponder allows the user to move a physical switch on the toll tag to either carpool or non-carpool mode.
Alternatively fueled vehicles with a qualifying white or green California Clean Air Sticker are exempt from paying tolls. Most vehicles that qualify as alternatively fueled vehicles are classified as plug-in electric vehicles.
Public Outreach The Metro ExpressLanes on I-110 and I-10 had the original goals of reducing congestion, increasing person and vehicle throughput, and improving mobility near and throughout downtown Los Angeles. One of the primary goals of the program was to extend the number of users who could travel in the former HOV lanes by selling the limited amount of available capacity.

50
Equity Initially, the Metro ExpressLanes encountered significant public resistance because of concerns about the disproportionate impact on low-income households living in each corridor. To allay fears, the Metro ExpressLanes provided fee discounts for specific households and incorporated enhanced travel options that did not require paying a toll. A low-income assistance plan allowed qualifying Los Angeles County residents to receive a one-time $25 credit and have monthly account maintenance fees waived.
Transit The project improved transit service by increasing the number of buses in the corridor by acquiring 29 buses on the I-110 ExpressLanes and 30 buses for use on the I-10 ExpressLanes. Metro’s Transit Rewards Program incentivized transit riders with the opportunity to earn toll credits. Riders had the opportunity to earn a $5 toll credit by taking 32 one-way trips on qualifying transit lines during peak hours. This type of transit reward was the first to be implemented nationally. A similar carpool loyalty program automatically entered users into a monthly drawing for gift cards (61).
Overall transit ridership increased for both the I-10 and I-110 corridors:
• The Silver Line express bus service on the I-110 corridor experienced a 52 percent increase in morning peak-period ridership and a 41 percent increase in afternoon peak-period ridership.
• The Silver Streak bus service on I-10 had a 59 percent increase in morning peak-period ridership and a 15 percent increase in afternoon peak-period ridership.
An onboard survey showed improved perception of buses and a significant shift in riders from those who formally drove SOVs:
• Sixty-five percent of riders on I-110 and 57 percent of riders on I-10 reported a faster trip since tolling began.
• Between 32 and 33 percent of new riders on both I-110 and I-10 used to drive alone on the corridor (61).
Success of the Pilot The ExpressLanes demonstration was considered a success, and in April 2014 the LA Metro board voted unanimously (11-0) to direct its chief executive officer to lobby for the continuation of the pilot and to ask the California Legislature to grant LA Metro power to expand the program and convert additional HOV lanes in the region, such as I-405, to HOT lanes. An important measure of public acceptance was the number of ExpressLanes transponders issued to users. Before the start of operations, LA Metro anticipated 100,000 commuters would sign up, but FasTrak distributed more than 260,000 transponders after the end of the one-year pilot period (62).
51
Conclusions Congestion pricing is implemented on managed lanes to improve travel times and travel time reliability by managing traffic flows in response to congestion. Rates for access to priced facilities vary such that the price for access is higher during periods of heavier congestion and lower for off-peak periods, thus creating a monetary incentive for drivers to shift to other times of day and providing an expedited and more reliable trip for those who are willing to pay. Furthermore, by providing discounts and/or free access to carpools and transit, managed lanes can help to increase throughput on a given corridor by incentivizing strategies that increase person throughput without adding new vehicles.
Most national applications of congestion pricing are found in HOT lanes and other types of managed lanes applications. HOT lanes levy a toll for SOV access to separate lanes within a freeway while allowing transit, carpools, vanpools, and others free or discounted access. As of August 2016, 9 bridges and tunnels, 8 limited-access highways, and 30 priced lanes in 12 states were operating with congestion pricing.
The development of congestion-priced managed lanes has been driven by policy development at both the local and state level. In Texas, state legislation enabled and refined the ability of local agencies to toll state highways and enter into CDAs for the financing of priced facilities. Local entities, in turn, have undertaken congestion pricing and managed lanes projects as part of broader, regional planning efforts to address congestion and air quality issues. This has resulted in differing operational policies across priced facilities in the state, but these facilities have nonetheless been largely successful in meeting their desired objectives for system management and revenue generation. In other states, tolling and financing authority has also generally started at the state level with local agencies subsequently incorporating the actual application of pricing into their long-range planning efforts. Many successful managed lanes projects that use a congestion pricing component are part of a much broader program that integrates effective freeway management, transit service, and demand management strategies (such as carpooling and vanpooling programs).
Public acceptance of pricing is one of the biggest challenges facing the application of congestion pricing, with the concept of equity being the most common issue. The public and stakeholders tend to view pricing as placing an undue burdens on those that can least afford it or do not have other travel options. Operational policies can be adopted to address some of these concerns. In most cases, priced managed lanes offer free access to transit vehicles, and one agency operates a low-income assistance program. The I-110 and I-10 ExpressLanes in Los Angeles provide a one-time $25 toll credit to qualifying accounts and have the monthly maintenance fees waived. These credit-based programs helped to alleviate some perceptions that congestion pricing was unfairly burdening poorer populations.

52
Appendix A: Implemented Projects Outside of Texas
Project Title Start Date Location Facility Type Pricing Schedule
SeaPark 2010 Seattle, WA Priced parking
Fixed time of day
SF Park 2011 San Francisco, CA Priced parking
Fixed time of day
LA Express Park 2012 Los Angeles, CA Priced parking
Fixed time of day
Cape Coral and Midpoint Memorial Bridges
1998 Lee County, FL Bridge Fixed time of day
New York/New Jersey Bridges and Tunnels
2001 New York and New Jersey
Bridge and tunnel
Fixed time of day
San Francisco-Oakland Bay Bridge
2010 San Francisco, CA Bridge Fixed time of day
SR 520 Bridge 2011 Seattle, WA Bridge Fixed time of day New Jersey Turnpike 2000 New Jersey Highway Fixed time of day The Toll Roads (SR 73, SR 133, SR 241, and SR 261)
2002 Orange County, CA Highway Fixed time of day
Dulles Greenway (SR 267)
2009 Loudon County, VA Highway Fixed time of day
Pocahontas Parkway (SR 895)
2011 Richmond, VA Highway Fixed time of day
Intercounty Connector (MD 200)
2011 Montgomery and Prince George’s County, MD
Highway Fixed time of day
91 Express 1996 Orange County, CA HOT lanes Fixed time of day I-25 HOV Express Lanes 2006 Denver, CO HOT lanes Fixed time of day I-95 Express Toll Lanes 2014 Baltimore, MD HOT lanes Fixed time of day US 36 Express Lanes 2015 Denver, CO HOT lanes Fixed time of day I-70 Mountain Express Lane
2015 Denver, CO HOT lanes Fixed time of day
I-15 Express Lanes 1996 San Diego, CA HOT lanes Dynamic 394 MnPASS 2005 Minneapolis, MN HOT lanes Dynamic I-15 Express Lanes 2006 Salt Lake City, UT HOT lanes Dynamic SR 167 HOT Lanes 2008 Seattle, WA HOT lanes Dynamic 95 Express 2008 Miami, FL HOT lanes Dynamic 35W MnPASS 2010 Minneapolis, MN HOT lanes Dynamic Alameda County Express Lanes (I-680)
2010 Alameda County, CA HOT lanes Dynamic
I-85 Express Lanes 2011 Atlanta, GA HOT lanes Dynamic I-495 Express Lanes 2012 Northern Virginia HOT lanes Dynamic

53
Project Title Start Date Location Facility Type Pricing Schedule
Silicon Valley Express Lanes (SR 237/I-880)
2012 San Jose, CA HOT lanes Dynamic
I-110 Metro ExpressLanes 2012 Los Angeles, CA HOT lanes Dynamic I-10 Metro ExpressLanes 2013 Los Angeles, CA HOT lanes Dynamic 595 Express 2014 Broward County, FL HOT lanes Dynamic I-95 Express Lanes 2014 Northern Virginia HOT lanes Dynamic I-405 Express Toll Lanes 2015 Bellevue, WA HOT lanes Dynamic I-580 Express Lanes 2016 Alameda County, CA HOT lanes Dynamic
54
Appendix B: Texas Managed Lane Profiles As a consolidated and quick reference, this section of the report contains brief profiles of individual managed lane projects in Texas. Each profile includes the following information:
• Location.
• Physical description.
• Governance.
• Project delivery.
• Financing.
• Project timeline.
55
DFW Connector
Location
The DFW Connector runs along the north side of the DFW International Airport and through portions of the cities of Southlake, Irving, and Grapevine. The roadway stretches from the SH 114/SH 121 Merge (near William D. Tate Avenue) to the north entrance of the DFW Airport.
Physical Description
The DFW Connector contains four managed lanes (two in each direction) along the 8.4-mile stretch of SH 114. The managed lanes extend for 4 of the 8.4 miles.
Governance
TxDOT owns and operates the roadway. NTTA collects tolls.
Project Delivery
The DFW Connector was completed through a design-build agreement between TxDOT and NorthGate Constructors.
Financing
The $1.1 billion project was funded exclusively by TxDOT. Funds totaled $261 million from the American Recovery and Reinvestment Act of 2009, $144 million from Proposition 14, $32 million from Proposition 12, and $696 million from TxDOT (fuel tax revenue) (63).
Project Timeline
February 2010: Construction begins.
November 2013: The project reaches substantial completion.
March 2014: Final acceptance is achieved.

56
North Tarrant Express
Location and Physical Description
The North Tarrant Express runs along I-820, SH 121, and SH 183. Segment 1 of the project runs 6.4 miles along I-820 from I-35W to the northeast I-820 interchange. Segment 2 runs 6.9 miles along SH 121/183 from the northeast I-820 interchange to the SH 121/183 split. Segment 1 includes two surface-level managed lanes in the median, while segment 2 includes two additional managed lanes. A third managed lane will be completed by 2030 (64, 65).
Governance
TxDOT owns the roadway, and NTE Mobility Partners (NTEMP) operates and maintains it. NTTA collects tolls.
Project Delivery
The project was completed through a CDA between TxDOT and NTEMP. TxDOT owns and helped finance the project, while NTEMP built, operates, maintains, and helped finance the project.
Financing
The $2.1 billion project was funded by both TxDOT and NTEMP. TxDOT provided $570 million in public funds, while NTEMP acquired the remaining funds. NTEMP provided $428 million in private equity, procured a $650 million Transportation Infrastructure Finance and Innovation Act loan, and procured $400 million in private activity bonds.
Project Timeline
December 2009: Financing is approved, and approval is given to begin detailed work.
November 2010: Construction begins.
October 2014: The project is substantially completed.
January 2015: Project receives final acceptance.
Operational Performance
Year Total Transactions
Total Revenue ($ Millions)
2014 4,400,000 $6.4 2015 20,200,000 $51.8 2016 11,900,000 $34.7
Includes only Q1 and Q2 for 2016 Source: (66,67,68,69,70,71,72)

57
LBJ Express
Location and Physical Description
The LBJ Express runs 10.7 miles along I-635 from east of Luna Road to Greenville Avenue and 5.8 miles on I-35E from south of the Loop 12/I-35E split to south of Valwood Parkway. The project includes 13.3 miles of managed lanes, consisting of 9.7 miles of two to three subsurface lanes in direction along the center of I-635, and 3.6 miles of elevated two-lane roadway above I-35E (64).
Governance
TxDOT owns the roadway, and the LBJ Infrastructure Group (LBJIG) operates and maintains it. NTTA collected tolls.
Project Delivery
The project was completed through a CDA between TxDOT and LBJIG. TxDOT owns and helped finance the project, while LBJIG built, operates, maintains, and helped finance the project.
Financing
Both TxDOT and LBJIG funded the $2.8 billion project. TxDOT provided $496 million in public funds. LBJIG provided $672 million in private equity. LBJIG also secured $615 million in private activity bonds and an $850 million Transportation Infrastructure Finance and Innovation Act loan.
Project Timeline
October 2006: The Texas Transportation Commission authorizes the issuance of a request for proposals.
September 2007: TxDOT issues a request for proposals.
September 2009: The CDA is executed.
Spring 2011: Construction begins.
Fall 2015: The project is substantially completed.
Operational Performance Year Total
Transactions Total Revenue
($ Millions) 2015 7,000,000 $11.5 2016 17,000,000 $33.9
Includes only Q4 for 2015 and Q1 and Q2 for 2016. At the time of this report, only three quarters of revenue data were available for when the LBJ Express was completely open. Source: (73,74,75)

58
Katy Managed Lanes
Location
The Katy Freeway Managed Lanes are located in Houston and run west along I-10 between SH 6 and I-610W.
Physical Description
The managed lanes extend for 12 miles, with two lanes in each direction. The Sam Houston Tollway and SH 6 intersect with this section of road.
Governance
HCTRA owns and operates the managed lanes, while TxDOT controls the general-purpose lanes (76).
Project Delivery
The Katy Freeway Managed Lanes were completed using the design-bid-build method.
Financing
The Katy Managed Lanes project cost $2.8 billion. Of this, $1.42 billion was from federal funds, $1.11 billion from state funds, $238 million from HCTRA that came from previous toll revenues, and $17.7 million from other local funds (77).
Project Timeline
2003: Construction begins.
October 2008: Managed lanes open for carpools of two or more people.
April 2009: SOVs are allowed by paying a toll.
Operational Performance Year Total
Transactions Total Revenue
($ Millions) 2010 9,769,172 $3.84 2011 14,219,063 $6.72 2012 16,071,614 $8.02 2013 19,320,467 $10.33 2014 22,388,942 $13.92 2015 28,243,333 $17.43
Source: (78)

59
Houston METRO HOT Lanes
Location and Physical Description I-45 South/Gulf Freeway
The I-45 South/Gulf Freeway section of the METRO HOT Lanes extends southeast from downtown Houston to Dixie Farm Road. This section of the HOT Lanes runs for 15 miles along I-45 toward Galveston.
US 290/Northwest Freeway
The US 290 HOT Lanes run northwest from Houston at the I-10 Interchange and stop southeast of Duffton Street. This 20-mile-long section of roadway contains a single reversible HOT lane. The major roadway that intersects with it is the Sam Houston Tollway.
I-45 North/North Freeway
The I-45 North/North Freeway section of the HOT lanes runs north from downtown Houston at Washington Avenue and Girard Street to just south of Cypress Station Drive. This section runs for 20 miles and contains a single reversible HOT lane. Major intersections include I-610, Beltway 8, and FM 1960.
US 59 North/Eastex Freeway
The US 59 North/Eastex Freeway section of the HOT lanes extends from downtown Houston at Ruiz Street to Sorters McClellan Road. This section runs for 20 miles and contains a single reversible HOT lane. Major intersections include I-610 and Beltway 8.
US 59 South/Southwest Freeway
The US 59 South/Southwest Freeway section of the METRO HOT Lanes runs southwest from Houston (at Hawthorne Street) to just northeast of West Airport Boulevard. This section runs for 24 miles and contains a single reversible HOT lane. Major intersections include the Sam Houston Tollway and I-610.
Governance
Houston METRO owns and operates the METRO HOT Lanes.
Project Delivery
The HOT lanes were installed through an agreement between Houston METRO and TransCore, a contractor that specializes in electronic tolling systems and other intelligent transportation systems.
Financing
HOT lane conversion was estimated at $50 million. In 2011, $14.5 million in federal grants were allocated to HOT lane conversion. In 2012 and 2013, Phase 1B used $40 million in grant funding and $9 million in local funding (79).

60
Project Timeline
February 2012: I-45 South opens to traffic.
July 2012: US 59 South opens to traffic.
December 2012: I-45 North opens to traffic.
May 2013: US 290 opens to traffic.
July 2013: US 59 North opens to traffic (80, 81).
Operational Performance Year Total
Transactions Total Revenue
($ Millions) 2012 136,278 $0.4 2013 1,138,418 $3.5 2014 2,122,759 $6.6 2015 2,522,311 $7.2** 2016 1,604,124* $6.9**
* Through April 30, 2016 **Estimate Source: (2, 82)

61
Cesar Chavez Express Toll Lanes
Location
The Cesar Chavez Express Toll Lanes are located in El Paso on a section of Loop 375 that runs parallel to the United States-Mexico border from South Zaragosa Road to US 54.
Physical Description
The Cesar Chavez Express Toll Lanes stretch for 8.9 miles. There are now two managed lanes (one in each direction), which increased the total number of lanes from four to six on that section of the roadway.
Governance
The Camino Real Regional Mobility Authority (CRRMA) operates and maintains the Express Lanes.
Project Delivery The project was designed in-house by the TxDOT-El Paso district and construction was put out to bid in April 2011 (83, 84).
Financing
The project was budgeted at $79 million, which included $74 million in Proposition 14 Bonds and $5 million in Category 10 federal funds (85). This included adding two managed lanes and reconstructing the non-tolled adjacent lanes. In 2012, CRRMA and TxDOT entered into an agreement that made up to $9.9 million available to CRRMA to develop and implement the toll systems needed. In 2012, $757,025 was spent on planning, and in 2013, $1.03 million was spent selecting and engaging in a toll system integrator (86).
Project Timeline
FY 2011: TxDOT lets the project.
January 2014: Project is completed and opens to traffic.
Operational Performance
Year Total Transactions
Total Revenue
($ Millions) 2014 234,081 $0.107 2015 475,286 $0.314 2016* 390,385 $0.258
*Through the third quarter of FY2016 Source: (87)

62
Acknowledgments The authors would like to thank the following individuals for their review and guidance during the compilation of this report: Chuck Fuhs, independent consultant; Dan Lamers from the North Central Texas Council of Governments; Rob Benz from the Texas A&M Transportation Institute; Matt MacGregor from Michael Baker International; Tyler Paterson and Eric Knigge from the Washington State Department of Transportation; and Ken Buckeye from the Minnesota Department of Transportation.

63
References 1. Perez, B. G., C. Fuhs, C. Gants, R. Giordano, and D.H. Ungemah. Priced Managed Lane
Guide. Federal Highway Administration, 2013. 2. Metropolitan Transit Authority of Harris County. METRO Business Plan and Budget—
FY 2016. December 17, 2015. Available at https://www.ridemetro.org/MetroPDFs/ FinancialAuditInformation/Budgets/FY2016-Business-Plan_Budgets.pdf. Accessed on November 16, 2015.
3. Metropolitan Transit Authority of Harris County. HOV/HOT Lanes Frequently Asked Questions (FAQs). Available at http://www.ridemetro.org/Pages/ HOVandHOTLanesFAQs.aspx. Accessed on November 16, 2015.
4. Texas State Legislature. SB 370—1997. Available at http://www.legis.state.tx.us/tlodocs/ 75R/billtext/html/SB00370F.htm. Accessed on October 27, 2015.
5. Texas State Legislature. HB 1208—2003. Available at http://www.statutes.legis.state.tx.us/ Docs/TN/htm/TN.224.htm. Accessed on October 27, 2015.
6. Texas State Legislature. HB 1208—2003. Available at http://www.legis.state.tx.us/tlodocs/ 78R/billtext/pdf/HB01208F.pdf. Accessed on October 27, 2015.
7. Texas State Legislature. HB 2702—2005. Available at http://www.legis.state.tx.us/tlodocs/ 79R/billtext/html/HB02702F.HTM. Accessed on October 27, 2015.
8. Texas State Legislature. HB 792—2007. Available at http://www.legis.state.tx.us/tlodocs/ 80R/billtext/pdf/SB00792F.pdf. Accessed on October 27, 2015.
9. Texas State Legislature. HB 1201—2011. Available at http://www.capitol.state.tx.us/tlodocs/82R/billtext/pdf/HB01201F.pdf. Accessed on October 27, 2015.
10. Texas State Legislature. SB 1730—2013. Available at http://www.legis.state.tx.us/tlodocs/83R/billtext/pdf/SB01730F.pdf. Accessed October 27, 2015.
11. TEXpress Lanes. TEXpress Lanes System Map. 2016. Available at http://www.texpresslanes.com/maps/texpress-lanes-map/. Accessed on August 16, 2016.
12. North Central Texas Council of Governments. Regional Transportation Council. Available at http://www.nctcog.org/trans/committees/rtc/description.asp. Accessed on August 24, 2016.
13. MacGregor, M., M. Burris, and G. Goodin. Tackling Congestion in Dallas Using Managed Lanes. ITE Journal, September 2010.
14. MacGregor, M. I.H. 635 (LBJ) Corridor Study. Paper submitted to the Transportation Research Board’s 2004 Annual Meeting.
15. Texas Department of Transportation. TEXpress Frequently Asked Questions (FAQS). Available at http://www.txdot.gov/insidetxdot/projects/studies/dallas/ texpress/faq.html/. Accessed on August 12, 2015.
16. TEXpress Lanes. Homepage. Available at http://www.texpresslanes.com/. Accessed on August 12, 2015.
17. LBJ TEXpress Lanes. LBJ Express FAQs. Available at http://www.lbjtexpress.com/ faq-page#t77n210/. Accessed on August 12, 2015.
18. LBJ TEXpress Lanes. How Pricing Is Determined. Available at http:// www.lbjtexpress.com/pricing/how-pricing-is-determined/. Accessed on August 12, 2015.
64
19. TEXpress Lanes. Frequently Asked Questions. Available at http://
www.texpresslanes.com/faq-page/. Accessed on August 12, 2015. 20. North Central Texas Council of Governments, Regional Transportation Council. Public
Meetings: Proposed Modifications to the Fiscal Year 2012 and Fiscal Year 2013 Unified Planning Work Program (UPWP). September 2012. Available at http://www.nctcog.org/trans/committees/rtc/2012/09Sept/Ref.Itm_3.7.rtc091312.pdf. Accessed on August 16, 2016.
21. Benning, T. North Texas’ Existing HOV Lanes to Remain Free for Vehicles with Two-Plus Occupants. The Dallas Morning News, December 13, 2012. Available at http://transportationblog.dallasnews.com/2012/12/north-texas-existing-hov-lanes-will-remain-free-for-vehicles-with-two-plus-occupants.html. Accessed on August 16, 2016.
22. North Central Texas Council of Governments. Tolled Managed Lane Policies. Approved May 11, 2006, modified March 10, 2016. Available at http://www.nctcog.org/trans/committees/rtc/documents/Revised.RTC.TollManagedLanePolicy_03.10.2016.pdf. Accessed on August 16, 2016.
23. Goodin, G., M. Burris, T. Geiselbrecht, and N. Wood. Application of a Performance Management Framework for Priced Lanes. Report 5-6396-01-1. Texas A&M Transportation Institute, November 2013. Available at http://tti.tamu.edu/documents/5-6396-01-1.pdf. Accessed on December 1, 2015.
24. Gonzalez, A. NTE and Managed Lanes: Key Facts after the First Year of Operations. Presentation made at the 15th International Conference on Managed Lanes, Transportation Research Board, May 6, 2016, Miami, Florida.
25. Lamers, D. Mobility 2040: The Metropolitan Transportation Plan for North Central Texas. Presentation before the Regional Transportation Council, August 13, 2015. Available at http://www.nctcog.org/trans/committees/rtc/documents/Item_11.rtc081315.pdf. Accessed on August 16, 2016.
26. Higgins, T., K. Bhatt, and A. Mahendra. Road Pricing Communication Practices. American Association of State Highway and Transportation Officials, July 22, 2010.
27. Estes, C., K. Paxton, J. Laubenberg, J. Leach, S. Sanford, V. Taylor, S. Turner, K. Self, C. Hill, M. Reid, D. Webb, and C. Williams. Letter to the Texas Department of Transportation. July 9, 2014.
28. Weber, J.F. Letter to Elected Officials. Texas Department of Transportation, July 24, 2014. 29. Texas Department of Transportation. Managed Lanes. Available at
http://www.txdot.gov/driver/travel/managed-lanes.html. Accessed on July 15, 2015. 30. Burris, M., and M. Pannu. Current HOT Lane Usage. Texas A&M Transportation Institute,
September 2009. Available at http://houstonvaluepricing.tamu.edu/reports/documents/ techmemo_1.pdf/. Accessed on August 12, 2015.
31. Goodin, G., R. Benz, M. Burris, M. Brewer, N. Wood, and T. Geiselbrecht. Katy Freeway: An Evaluation of a Second-Generation Managed Lanes Project. Report 0-6688-1, Texas A&M Transportation Institute, April 2013. Available at http://tti.tamu.edu/documents/0-6688-1.pdf. Accessed on August 12, 2015.
32. Nicholson, E. In Houston, Hundreds of People Carpool with Strangers. Why Hasn’t It Happened in Dallas? Dallas Observer, June 21, 2012. Available at http://www.dallasobserver.com/news/in-houston-hundreds-of-people-carpool-with-strangers-why-hasnt-it-happened-in-dallas-7105524. Accessed on August 24, 2016.

65
33. Harris County Roll Road Authority. Toll Rate Schedule—Katy Freeway Managed Lanes.
Available at https://www.hctra.org/katymanagedlanes/media/Katy_Toll_Sched.pdf? CSRT=13479690972733999972/. Accessed on August 12, 2015.
34. Turnbull, K. Houston Managed Lanes Case Study: The Evolution of the Houston HOV System. Contract DTFH61-01-C-00182. Operations Office of Transportation Management, Federal Highway Administration, September 2003.
35. Brooks, J., and R. Benz. HOV/HOT Extended Hours Safety and User Evaluation. Metropolitan Transit Authority of Harris County, November 2015.
36. Buckeye, K. Minnesota’s Urban Partnership Agreement 2012 Update. Presentation slides, Minnesota Department of Transportation. Available at http://managedlanes.org/wp-content/uploads/2012/07/3_Minnesota-UPA-I-35W-HOT-Lanes-Transit-Innovations-and-Telecommuting.pdf. Accessed on July 15, 2015.
37. Minnesota Legislature. 2014 Minnesota Statutes, Chapter 160, Section 160.93, 2014. June 5, 2015. Available at https://www.revisor.mn.gov/statutes/?id=160.93/. Accessed on August 12, 2015.
38. Minnesota Department of Transportation. MnPASS Express Lanes. Available at http://www.mnpass.org/394/. Accessed on August 12, 2015.
39. Munnich, L.W. Minnesota’s Proposal for Urban Partnership Agreement. In Transportation Research Record: Journal of the Transportation Research Board, No. 2079, Transportation Research Board of the National Academies, Washington, D.C., 2008, pp. 15–20.
40. Minnesota Legislature. 2008 Minnesota Session Laws, Chapter 306—S.F. No. 3058 [Amendments to Minnesota Statutes 2006]. 2008.
41. Buckeye, K. Express Lanes Performance Evaluation Interstate 35W in Minnesota. In Transportation Research Record: Journal of the Transportation Research Board, No. 2450, Transportation Research Board of the National Academies, Washington, D.C., 2014, pp. 36–43.
42. Cambridge Systematics, Inc. I-394 MnPASS Technical Evaluation—Final Report. Minnesota Department of Transportation, 2006.
43. Munnich, L.W., and K.R. Buckeye. I-394 MnPASS High-Occupancy Toll Lanes Planning and Operational Issues and Outcomes (Lessons Learned in Year 1). In Transportation Research Record, No. 1996, Transportation Research Board of the National Academies, Washington, D.C., 2007, pp. 49–57.
44. Buckeye, K.R., and L.W. Munnich. Value Pricing Outreach and Education Key Steps in Reaching High-Occupancy Toll Lane Consensus in Minnesota. In Transportation Research Record: Journal of the Transportation Research Board, No. 1864, Transportation Research Board of the National Academies, Washington, D.C., 2004, pp. 16–21.
45. Buckeye, K. Performance Evaluation of the I-394 MnPASS Express Lanes in Minnesota. In Transportation Research Record: Journal of the Transportation Research Board, No. 2278, Transportation Research Board of the National Academies, Washington, D.C., 2012, pp. 153–162.
46. Federal Highway Administration. Income-Based Equity Impacts of Congestion Pricing: A Primer. 2008. Available at http://ops.fhwa.dot.gov/publications/fhwahop08040/ fhwahop08040.pdf. Accessed on August 12, 2015.
47. Turnbull, K., K. Balke, M. Burris, P. Songchitruksa, E. Sug Park, B. Pessaro, J. Samus, E. Saunoi-Sandgren, D. Gopalakrishna, J. Schroeder, C. Zimmerman, E. Schreffler, and B. Joy.
66
Urban Partnership Agreement: Minnesota Evaluation Report. Report FHWA-JPO-13-048. Research and Innovative Technology Administration, U.S. Department of Transportation, January 4, 2013.
48. Cambridge Systematics, Inc. I-394 MnPASS Technical Evaluation—Final Report. Minnesota Department of Transportation, 2006.
49. Washington State Department of Transportation. SR 167 HOT Lanes—Common Questions. Available at http://www.wsdot.wa.gov/Tolling/SR167HotLanes/FAQ.htm/. Accessed on August 12, 2015.
50. Washington State Department of Transportation. Social, Economic, and Environmental Justice Report. August 2008. Available at http://www.wsdot.wa.gov/NR/rdonlyres/ 80352212-F081-4099-A726-9EB932E10146/0/SOCIALECONOMIC ENVIRONMENTALJUSTICE.pdf/. Accessed on August 12, 2015.
51. Washington State Legislature. HB 1773—2015–16. Available at http://app.leg.wa.gov/ billinfo/summary.aspx?bill=1773&year=2015/. Accessed on August 12, 2015.
52. Washington State Legislature. HB 3096—2007–08. Available at http://apps.leg.wa.gov/ billinfo/summary.aspx?bill=3096&year=2007/. Accessed on August 12, 2015.
53. Washington State Legislature. HB 2211—2015–16. Available at http://app.leg.wa.gov/ billinfo/summary.aspx?bill=2211&year=2015/. Accessed on August 12, 2015.
54. Washington State Department of Transportation. I-405/SR 167 Corridor Funding and Phasing Report. January 2014. Available at http://www.wsdot.wa.gov/NR/rdonlyres/C19D2C87-8E8A-4C22-9602-EFBB1D077C16/0/I405_FundingPhasing_Jan2014_Web.pdf/. Accessed on August 12, 2015.
55. Washington State Legislature. House Bill Report EHB 1382. Available at http://apps.leg.wa.gov/documents/billdocs/2011-12/Pdf/Bill%20Reports/House/ 1382.E%20HBR%20SA%2011.pdf/. Accessed on August 12, 2015.
56. Washington State Transportation Commission. SR 520 Toll Rates Effective July 1, 2014. Available at http://www.wstc.wa.gov/HighwayTolling/SR520bridge.htm/. Accessed on August 12, 2015.
57. Washington State Department of Transportation. Toll Rates. Available at http://www.wsdot.wa.gov/Tolling/TollRates.htm/. Accessed on August 12, 2015.
58. Washington State Department of Transportation and Puget Sound Regional Council. Awareness and Acceptance of Pricing Project. May 2011. Available at http://www.wsdot.wa.gov/NR/rdonlyres/FEC5D940-5B5E-4DE2-A3A3-E20B85894BDB/ 0/AAPReport052711.pdf/. Accessed on August 12, 2015.
59. Schroeder, J., T. Smith, K. Turnbull, K. Balke, M. Burris, P. Songchitruksa, B. Pessaro, E. Saunoi-Sandgren, E. Schreffler, and B. Joy. Seattle/Lake Washington Corridor Urban Partnership Agreement: National Evaluation Report. Report No. FHWA-JPO-14-127. U.S. Department of Transportation, December 2014. Available at http://ntl.bts.gov/lib/54000/54400/54470/120214_seattle_upa_final_report.pdf0.pdf. Accessed on August 12, 2015.
60. San Diego Association of Governments. Other California Toll Roads and Bridges. Available at http://fastrak.511sd.com/san-diego-toll-roads/other-california-toll-roads-and-bridges-map. Accessed on July 15, 2015.

67
61. U.S. Department of Transportation. Los Angeles Congestion Reduction Demonstration
ExpressLanes Program: National Evaluation Report. Report No. FHWA-JPO-14-126. August 2015. Available at http://ntl.bts.gov/lib/55000/55600/55669/FHWA-JPO-14-126-1.pdf. Accessed on December 1, 2015.
62. Scauzillo, S. MTA Makes 110, 10 Pay Lanes Permanent; 405 Freeway Might Be Next. San Gabriel Valley Tribune, April 24, 2014.
63. Texas Department of Transportation Dallas and Fort Worth Districts. DFW Connector, TxDOT Project Tracker. Summer 2016. Available at http://ftp.dot.state.tx.us/pub/txdot-info/ftw/connector_tracker.pdf. Accessed on August 24, 2016.
64. Glover, B., M. Steadman, and B. Dell. Summary and Status of Concession Agreements (CDA/DB) in Texas, Final Report. Report PRC 16-54 F. Transportation Policy Research Center, Texas A&M Transportation Institute, June 2016. Available at http://tti.tamu.edu/documents/PRC-16-54-F.pdf. Accessed on August 24, 2016.
65. Texas Department of Transportation Fort Worth District. North Tarrant Express (NTE), TxDOT Project Tracker. Spring 2015. Available at http://ftp.dot.state.tx.us/pub/txdot-info/ftw/nte_tracker.pdf. Accessed on August 24, 2016.
66. North Tarrant Express. Traffic and Revenue Summary for Q4 2014. February 24, 2015. Available at http://www.ntetexpress.com/sites/ntetexpresslanes.com/files/u32/ nte_texpress_lanes_q4_2014_traffic-revenue_results_2_24_15_0.pdf. Accessed on September 19, 2016.
67. North Tarrant Express. Traffic and Revenue Summary for Q1 2015. May 1, 2015. Available at http://www.ntetexpress.com/sites/ntetexpresslanes.com/files/u32/ nte_texpress_lanes_q1_2015_traffic-revenue_results_5_1_15_1.pdf. Accessed on September 19, 2016.
68. North Tarrant Express. Traffic and Revenue Summary for Q2 2015. August 1, 2015. Available at http://www.ntetexpress.com/sites/ntetexpresslanes.com/files/u32/ nte_texpress_lanes_q2_2015_traffic-revenue_results_8_1_15.pdf. Accessed on September 19, 2016.
69. North Tarrant Express. Traffic and Revenue Summary for Q3 2015. November 1, 2015. Available at http://www.ntetexpress.com/sites/ntetexpresslanes.com/files/ nte_texpress_lanes_q3_2015_traffic-revenue_results_11_1_15.pdf. Accessed on September 19, 2016
70. North Tarrant Express. Traffic and Revenue Summary for Q4 2015. February 26, 2016. Available at http://www.ntetexpress.com/sites/ntetexpresslanes.com/files/ nte_texpress_lanes_q4_2015_traffic-revenue_results_2_26_16.pdf. Accessed on September 19, 2016.
71. North Tarrant Express. Traffic and Revenue Summary for Q1 2016. May 5, 2016. Available at http://www.ntetexpress.com/sites/ntetexpresslanes.com/files/ nte_texpress_lanes_q1_2016_traffic-revenue_results_5_5_16.pdf. Accessed on September 19, 2016.
72. North Tarrant Express. Traffic and Revenue Summary for Q2 2016. August 15, 2016. Available at http://www.ntetexpress.com/sites/ntetexpresslanes.com/files/ nte_texpress_lanes_q2_2016_traffic-revenue_results_8_15_16.pdf. Accessed on September 19, 2016.

68
73. LBJ Express. Traffic and Revenue Summary for Q4 2015. February 26, 2016. Available at
http://www.lbjtexpress.com/sites/lbjtexpresslanes.com/files/lbj_texpress_lanes_q4_2015_traffic-revenue_results_2_26_16.pdf. Accessed on September 19, 2016.
74. LBJ Express. Traffic and Revenue Summary for Q1 2016. May 5, 2016. Available at http://www.lbjtexpress.com/sites/lbjtexpresslanes.com/files/lbj_texpress_lanes_q1_2016_traffic-revenue_results_5_5_16.pdf. Accessed on September 19, 2016.
75. LBJ Express. Traffic and Revenue Summary for Q2 2016. August 15, 2016. Available at http://www.lbjtexpress.com/sites/lbjtexpresslanes.com/files/lbj_texpress_lanes_q2_2016_traffic-revenue_results_8_15_16.pdf. Accessed on September 19, 2016.
76. Texas Transportation Commission. Minute Order 114156. December 18, 2014. Available at http://ftp.dot.state.tx.us/pub/txdot/commission/2014/1218/10a.pdf. Accessed on August 24, 2016.
77. AASHTO Center for Excellence in Project Finance. Katy Freeway Reconstruction. Available at http://www.transportation-finance.org/projects/katy_freeway.aspx. Accessed on August 15, 2015.
78. Harris County Toll Road Authority. Harris County Toll Road Authority Enterprise Fund: Basic Financial Statements for the Fiscal Year Ended February 28, 2015. Available at https://www.hctra.org/ Sectional?path=%2Fsitecore%2Fcontent%2FHCTRA%2FAboutHCTRA%2FFinancialReportsPage#OverviewSection. Accessed on August 24, 2016.
79. Metropolitan Transit Authority of Harris County. FY2012 Business Plan and Budget: Positioning the New METRO for the Future. 2011. Available at http://www.ridemetro.org/MetroPDFs/FinancialAuditInformation/ Budgets/FY2012-Business-Plan-Budget-092911.pdf. Accessed on August 24, 2016.
80. KRTK-Houston. METRO Opens NW Freeway Toll Lane on May 20. May 15, 2013. Available at http://abc13.com/archive/9103923/. Accessed on August 24, 2016.
81. Delaughter, G. HOT Lanes Open on the Eastex Freeway. Houston Public Media. Available at http://www.houstonpublicmedia.org/news/1373561398/. Accessed on August 24, 2016.
82. Texas Department of Transportation. Report on the Elimination of Toll Roads. 2016. Available at http://ftp.dot.state.tx.us/pub/txdot-info/sla/090116-hb-2612.pdf. Accessed on September 12, 2016.
83. City of El Paso, Texas. Department Head’s Summary Form. 2011. Available at http://legacy.elpasotexas.gov/muni_clerk/agenda/03-15-11/03151112A.pdf. Accessed on September 13, 2016.
84. Camino Real Regional Mobility Authority. Thinking Regionally 2011 Annual Report. 2011. Available at http://www.crrma.org/_documents/2011CRMA-AR-WEB.pdf#view=fitH. Accessed on September 13, 2016.
85. Camino Real Regional Mobility Authority. Camino Real Regional Mobility Authority Regional Toll Implementation Plan. April 15, 2010.
69
86. Camino Real Regional Mobility Authority. Camino Real Regional Mobility Authority
Financial Statements and Supplementary Information, Years Ended August 31, 2014 and 2013. 2015. Available at http://www.crrma.org/_documents/Fiscal%20Year%202014%20Financial%20Report.pdf#view=fitH. Accessed on August 24, 2016.
87. Camino Real Regional Mobility Authority. César Chávez Express Toll Lanes Performance Report—3rd Quarter of FY16. July 2016. Available at https://dl.dropboxusercontent.com/u/26579627/2016-07-13/2016-07-13-BA-ITEM5B.pdf. Accessed on August 24, 2016.