manag e me nt? the p as s ive p o r tf o lio mo r e …
TRANSCRIPT

UNIVERSIDAD PONTIFICIA DE
COMILLAS
IS ACTIVE PORTFOLIO
MANAGEMENT REALLY
MORE ATTRACTIVE THAN
THE PASSIVE PORTFOLIO
MANAGEMENT?
Autor: Clara Mir Areizaga
Director: Juan Rodriguez Calvo

Clara Mir Areizaga
Postgraduate dissertation:
Is active portfolio management
really more attractive than the
passive portfolio management?
Universidad Pontifica de COMILLAS
Master on Finance Author: Clara Mir Areizaga
Tutor: Juan Rodríguez Calvo
18/06/2019

Clara Mir Areizaga
1
While doing the Master of Finance, I realized that I really like and enjoy the investment world. However, I have also realized that I lack knowledge because I’m not really updated in the investment news that daily happen in our world. As a result, I found an interesting opportunity to talk about active and passive portfolio management, in order to learn and to be updated about the trends that are arising in our financial world. On the one hand, thanks to the analysis I am going to do regarding the investment funds, I firmly believe that I’m going to improve my knowledge and that I will deeply get to know the investment funds market of my country. Therefore, this analysis will no doubt help me in the future, because if I end up working in the investment sector, I will be able to guarantee my knowledge through this paper. Moreover, I personally believe that in the future everybody will invest in order to make money more profitable, so having a deeper knowledge in this sector, will help me in order to carry out my own wealth management. On the other hand, studying the difference between active and passive portfolio management is also really interesting for the future. Bearing in mind that a large number of investors are being deceived due to their lack of knowledge of this sector, I firmly think that doing this paper will help me, so in the future I’m not deceived regarding active and passive management. Last but not least, this task requires the use of online sources, databases and indexes, so the fact of spending time getting familiar with indicators and their methodology or assessment criteria will make me acquire better skills in managing sources after completing this practice. In conclusion, I have two main objectives. One the one hand, take profit of this paper and learn as much as I can and on the other hand, write a good paper so it is easy, interesting and useful to read for the lector.

Clara Mir Areizaga
2
INDEX
Abstract .................................................................................................................. 4
Resumen ................................................................................................................. 5
1. Overview of the problem .................................................................................. 6
2. Basic concepts .................................................................................................10
a) Investment funds................................................................................................... 10 i. Definition investment fund...................................................................................................... 10 ii. Open-end and closed-end fund ............................................................................................... 10 iii. Broad-based or tightly focused ............................................................................................... 11 iv. Investment style ...................................................................................................................... 11 v. Underlying Asset ...................................................................................................................... 11
b) Active and passive portfolio management .............................................................. 14 i. Active portfolio management .................................................................................................. 15 ii. Passive portfolio management ................................................................................................ 16
3. Indicators ........................................................................................................18
a) Active share .......................................................................................................... 18
b) Tracking error ........................................................................................................ 19
c) R2 ......................................................................................................................... 20
d) Alpha .................................................................................................................... 21
e) Beta ...................................................................................................................... 22
f) Sharpe ratio .......................................................................................................... 23
4. Selection of investment funds ..........................................................................26
a) Selection of passive investment funds .................................................................... 26 i. Fondo Naranja Ibex 35 ............................................................................................................. 26 ii. Lyxor Ibex 35 ............................................................................................................................ 26 iii. Bankia Indice Ibex .................................................................................................................... 27 iv. Santander índice España.......................................................................................................... 28 v. Caixabank bolsa índice España ................................................................................................ 28 vi. BBVA bolsa indice FI................................................................................................................. 29 vii. Acción Ibex 35 .......................................................................................................................... 30 viii. Bankinter Futuro Ibex ......................................................................................................... 30 ix. Liberty Spanish stock Market Index ......................................................................................... 31
b) Selection of active investment funds ...................................................................... 32 i. Santander Acciones Españolas ................................................................................................ 32 ii. Catalana Occidente Bolsa Española ......................................................................................... 32 iii. Bankoa Bolsa de Credit Agricole Bankoa ................................................................................. 33 iv. Bankia Banca Privada Renta Variable España.......................................................................... 33 v. Unifond Renta Variable España de Unigest ............................................................................. 34 vi. Ibercaja Bolsa ........................................................................................................................... 34 vii. Rural Renta Variable España .................................................................................................... 35 viii. CaixaBank Bolsa Gestión España ........................................................................................ 35 ix. Credit Suisse Bolsa B ................................................................................................................ 36
5. Results from Excel ...........................................................................................38
a) Active share .......................................................................................................... 38
Clara Mir Areizaga
3
b) Tracking Error ........................................................................................................ 39
c) R2 ......................................................................................................................... 40
d) Alpha .................................................................................................................... 41
e) Beta ...................................................................................................................... 42
f) Sharpe Ratio .......................................................................................................... 43
6. Conclusions .....................................................................................................45
7. References ......................................................................................................47
8. References ......................................................................................................52
LIST OF ILLUSTRATIONS Illustration 1: Radiography of the Spanish investment funds .......................................... 7 Illustration 2: Composition of the Ibex 35 ...................................................................... 17 LIST OF EQUATONS Equation 1:R2 equation .................................................................................................. 20 Equation 2: Alpha equation ............................................................................................ 22 Equation 3: Beta equation .............................................................................................. 22 Equation 4: Sharpe Ratio equation................................................................................. 23 LIST OF TABLES Table 1: Passive investment funds commissions............................................................ 31 Table 2: Active investment funds commissions ............................................................. 37 Table 3: Active share of the active funds ....................................................................... 38 Table 4: Tracking error of the investment funds ............................................................ 40 Table 5: R2 of the investment funds .............................................................................. 41 Table 6:Alpha of the investment funds .......................................................................... 42 Table 7: Beta of the investment funds ............................................................................ 43 Table 8: Sharpe ratio of the investment funds ............................................................... 44 Table 9: Commissions of the investment funds ............................................................. 45 Table 10: Estructure Catalan occ. fund........................................................................... 52 Table 11: Estructure Ibex35 ............................................................................................ 52 Table 12: Estructure Santander Fund ............................................................................. 52 Table 13: Estructure Bankia fund ................................................................................... 53 Table 14: Estructure Bankoa fund .................................................................................. 53 Table 15: Estructure Ibercaja fund ................................................................................. 54 Table 16: Estructure Unifond fund ................................................................................. 54 Table 17: Estructure Caixabank fund .............................................................................. 54 Table 18: Estructure Ruraal fund .................................................................................... 54 Table 19: Estructure Credit fund .................................................................................... 54
Clara Mir Areizaga
4
Abstract The objective of this document is to find out if the active portfolio management is really more attractive than the passive portfolio management but focusing on the Spanish investment funds. Nowadays a problem that is often debated, is the fact of passive and active portfolio management. It is a very controversial issue since a wide number of investors are more interested in the active portfolio management because they firmly believe that they will receive higher returns than in passive portfolio management. As a result, the managers of the active investment fund charge expensive commissions due to their efforts trying to beat the markets, however, they sometimes end up doing passive portfolio management, by replicating the stock market index. Consequently, a large number of investors entrust their managers with active management, thinking that they will obtain higher returns, and then in practice, the manager ensures its management by selling it as active when it is really passive and charging commissions that would not correspond to him. Therefore, I find extremely interesting to study those two-portfolio management, in order to quantify the positions of both. Moreover, taking into account that my paper is specially focused on the Spanish investment funds, I will compare real cases of active and passive portfolio management. I will select eighteen investment funds, nine which are managed passively and another nine which are managed actively, in order to answer the question of this paper. In order to make those analyzes, I will first define what an investment fund is, highlight the main difference between active and passive portfolio management of the portfolio, and I will sum up defining the advantages and disadvantages of each portfolio management. Once I have defined the main keywords of this paper, I will make an analysis of the investment funds in Spain. Investment funds are a very interesting way of investing, since clients have more opportunities, due to the amount of money they raise and because of the spraying of shares they can buy. Consequently, I will select eighteen investment funds, nine of them will be managed actively and the other nine will be managed passively. However, all of them will invest in equities, since they are a variable income, so I can see more accurately the variation in the return between the active and passive funds. After selecting the investment funds and qualitatively highlighting the advantages and disadvantages of each of them, I will define the indicators that will determine which of the two types of investment funds are more attractive. Afterward, I will collect the necessary data and I will calculate the indicators, in order to have the return, commissions and risk of each investment fund. Thanks to this analyze, I hope to end up answering to the question of this paper, which is basically if the active portfolio management is really more attractive than the passive portfolio management. Keywords: Active portfolio management, Passive portfolio management, investment funds, beat the market, beta, alpha, tracking error, active share, R2 and Sharpe ratio.

Clara Mir Areizaga
5
Resumen
El objetivo de este trabajo es averiguar si la gestión activa es realmente más atractiva que la gestión pasiva de la cartera, centrándome en los fondos de inversión españoles. Hoy en día un tema de gran controversia que a menudo se debate, es el hecho de la gestión pasiva y activa de las carteras. Es un tema muy debatido, ya que muchos inversores están más interesados en la gestión activa porque creen firmemente que recibirán mayores rendimientos que en una gestión pasiva. Como resultado, los gestores del fondo de inversión activo cobran comisiones elevadas debido a sus esfuerzos por tratar de superar a los índices de los mercados, sin embargo, a veces terminan haciendo una gestión de cartera pasiva, replicando los índices de la bolsa. En consecuencia, un gran número de inversores confían a sus gestores una gestión activa, pensando que obtendrán mayores rentabilidades, y sin embargo en la practica los gestores aseguran su gestión vendiéndola como activa cuando realmente es pasiva, cobrando por ello comisiones que no les corresponderían. Por lo tanto, me parece extremadamente interesante estudiar esos dos tipos de carteras, para cuantificar las posiciones de una y otra. Además, teniendo en cuenta que mi trabajo se centra especialmente en los fondos de inversión españoles, compararé casos reales de gestión de carteras activa y pasiva. Seleccionaré dieciocho fondos de inversión, nueve que se administran de forma pasiva y otros nueve que se administran activamente, para responder a la pregunta de este trabajo. Para hacer los análisis, primero definiré lo que es un fondo de inversión, resaltaré la diferencia principal entre la gestión activa y pasiva de la cartera, y resumiré definiendo las ventajas y desventajas de cada gestión. Una vez que haya definido los conceptos básicos de este trabajo, haré un análisis de los fondos de inversión en España. Los fondos de inversión son una forma muy interesante de invertir, ya que los clientes tienen más oportunidades debido a la cantidad de dinero que recaudan y debido a la pulverización de acciones que pueden comprar. En consecuencia, seleccionaré los dieciocho fondos de inversión, nueve de ellos se administrarán activamente y los otros nueve se administrarán de forma pasiva. Sin embargo, todos ellos invertirán en acciones, ya que son renta variable por lo que podemos ver con mayor precisión la variación en el rendimiento entre los fondos activos y pasivos. Después de seleccionar los fondos de inversión y destacar cualitativamente las ventajas y desventajas de cada uno de ellos, definiré los indicadores que determinarán cuál de los dos tipos de fondos de inversión son más atractivos. Posteriormente, recopilaré los datos necesarios y calcularé los indicadores, para tener el rendimiento, las comisiones o el riesgo de cada fondo de inversión. Gracias a este análisis, espero terminar respondiendo a la pregunta de este trabajo, que es básicamente si la gestión activa es realmente más atractiva que la gestión pasiva de la cartera.
Puntos claves: Gestión activa, Gestión pasiva, fondos de inversión, superar al índice, beta, alpha, R2, tracking error, active share and ratio de sharpe.

Clara Mir Areizaga
6
1. Overview of the problem
The problem that I have proposed to solve in this paper, is not something new since some years ago, active investment funds have been replicating the market. However, more and more active investment funds have joined this trend and they also charge commissions that do not correspond to them. To support this statement, I want to refer to an article published by the economist in November 2018. I´m going to summarize the article, by highlighting the points that I find interesting. Even though, I am going to attach the link of the article1:
https://www.eleconomista.es/mercados-cotizaciones/noticias/9493047/11/18/El-56-de-
los-fondos-de-bolsa-espanola-no-activos-cobra-como-si-lo-fuera.html
Concerning Cristina Gracias, “The role of commissions in investment funds is key at a time like the current one, in which, according to a JP Morgan report collected by Bloomberg, the percentage of assets that offers positive returns this year is only 20% (the lowest figure since the 70s). And the Spanish stock market is not one of them, hence all the funds that invest in this market are negative this year, those who apply more active management being the ones that resist better. A track of how much of active a fund is, it is if at least 60% of its portfolio is not correlated with the Ibex 35. And according to Morningstar up to May 41% of all those sold in Spain are, and they charge an average management fee of 1.7% is applied. The problem is in investment funds that, without fulfilling this requirement, charge as if they were active funds or even more. According to the same data, 56% of Spanish stock funds with an active share of less than 60% require more than 1.7%, which translates into 29 funds. The fees that these vehicles require for delegating the management to a manager that is not separated in excess of the index ranges from 1.75 to 2.25%. We should bear in mind, however, that many managers include futures in their portfolios that can distort the result and leave with a lower active share for this reason, although they do active management, so I should study the funds one by one. As the first clue, and in that last range, of 2.25%, up to ten funds are moved, the most striking case being the Liberty Spanish Stock Market Index, an indexed fund that applies a management fee of 2.25% and specifies in its brochure that its objective is to replicate the Ibex 35. It pretends, explains the brochure, "to form a portfolio by buying a basket that includes all the Ibex 35 values in the same proportion as they hold in the index", while the not intended to "replicate" the index, is dedicated to buy public debt.
1 Source: El economista webpage (https://www.eleconomista.es/mercados-
cotizaciones/noticias/9493047/11/18/El-56-de-los-fondos-de-bolsa-espanola-no-activos-cobra-como-si-
lo-fuera.html) Article from the 2/11/2018 made by Cristina Garcia

Clara Mir Areizaga
7
2
Cheapest active funds More expensive active funds
Fund Management
commission
Fund Indexed Management
commission Mirabaud equities 1,50 Bankoa Bolsa NO 2,25
Abanca Renta V. 1,35 Catalana occ. NO 2,25
Caja Ingenieros 1,35 DWS acc. NO 2,25
Iberian Value FI 1,35 Eurovalor Bolsa NO 2,25
Renta 4 FI 1,35 Fondmapfre EST. NO 2,25
Okavango Delta A 1,25 Laboral Kutxa
Bol.
NO 2,25
Mediolanum Smal 0,90 Liberty Spanish
St.
NO 2,25
Mediolanum RV 0,80 PBP Bol ESP NO 2,25
Mutuafondo FI 0,50 Radar Inv B NO 2,25
Sigma Inv 0,50 Rural Renta V. NO 2,25 2 Source: Morningstar the 29 of October 2018 (https://www.eleconomista.es/mercados-
cotizaciones/noticias/9493047/11/18/El-56-de-los-fondos-de-bolsa-espanola-no-activos-cobra-como-si-
lo-fuera.html) (Own elaboration)
Illustration 1: Radiography of the Spanish investment funds
ACTIVE PASSIVE
(At least 60% of its portfolio is decorrelated of the
Ibex)
60% of its portfolio is correlated with the Ibex
41%
59%
Average management commission (%)
1,70%
How many apply a management commission greater
or less then 1,7%
GREATER LESS
56% 44%
Average return in 2018 (%)
-8,03 Average return in 2018 (%)
-9,73 Return of the Ibex 35
with dividends (%)
-13,1

Clara Mir Areizaga
8
The rest of the funds that replicate the behavior of the Ibex 35, which are another nine in the Spanish market, in addition to the previous one, do not apply similar tools since they range from 0.11% to 1.35%. The supervisor (the National Securities Market Commission, CNMV) already announced in early October that, like his European partners, he has also carried out a study in Spain on closet indexer cases, which is how it is known in the Financial jargon to investment funds that are presented as active management even though their management is closely linked to their benchmarks and, therefore, their management requires fewer resources compared to those that really apply it. And the result is that he detected "a small number of cases that have proceeded to update their information documents" and considers necessary, in order to increase transparency, that managers apply some criteria to improve the information of their brochures in this regard, as they specify the freedom of the manager regarding the index with parameters such as, for example, tracking error (which measures the volatility of the difference in profitability between a certain portfolio or fund and its benchmark), among others. In addition to active share, it is one of the parameters used by ESMA, the European supervisor, to identify which funds are not active; identifies them when the tracking error is less than 4%. It also uses the R squared (R2): in the non-active, it is higher than 0.95 out of 1. Morningstar explains how this last parameter works with an example: "If we take a fund that follows very close to the Ibex index and we make a regression to that index we will obtain an R2 equal to 1 or, at least, very close to 1. This means that practically all fluctuations in the fund's profitability can be explained by the evolution of the index in question ". If only the active share is taken into account to approach those funds that have more active management behind them, this type of product behaves better than those that are not active this year. In a year in which the Ibex with dividends falls more than 13%, with data until October 29, to be able to compare its return with that of the funds, those more detached from the index yield 8%, compared to 9, 7% who lose the most linked to him (see graphic). Morningstar has evaluated how many funds fall below the thresholds determined by ESMA in R2 and 'tracking error' using data from the last three years with respect to the Ibex 35 and leaving aside the 'active share' due to the distortion of futures. A total of 10 Spanish equity funds would be susceptible to be investigated by the CNMV. These 10 vehicles manage almost 2,000 million euros, 25% of the assets accumulated by the Spanish funds of the local stock exchange. Among these products, there are two with four Morningstar stars, the second highest rating. That is to say, they have proven to be better than 67.5% of the competitors in their category, although they have barely moved away from the Ibex in profitability and volatility in the last three years.

Clara Mir Areizaga
9
Some of those funds are Santander, Catalan occidente Bolsa Esapañola, Bankoa Bolsa de Credit Agricole, Caja Laboral bolsa, Bankia Banca Privada Renta Variable España, Unifond Renta Variable España de Unigest, Ibercaja Bolsa, Rural Renta Variable España, CaixaBank Bolsa Gestión España y la Cartera Variable de Gestifonsa. The FCA has decided to stop these products in the United Kingdom by requiring the managers of 64 funds a compensation of 34 million pounds. After investigating 84 funds, only 20 demonstrated to have active management, according to statements of an executive to 'Reuters'. The investigation started in 2017 with suspicious funds that manage assets worth more than 100,000 million euros. Also last year, the European Federation of Better Finance users raised the alarm by identifying 165 false active management funds, in line with a previous study, in 2016, of ESMA, the European supervisor. As conclusion, I found it extremely interesting to study those false active funds, that is, vehicles that are sold as active management and charge commissions according to it, but that are barely separated from the index. In the jargon they are known with the English appellative of 'closet indexer', and in Spain, there are many suspects to be so. As it is said in the article, I am going to focus my research on indicators like R2 or the tracking error. Even though I am going to examine each case individually, due to the fact that many Spanish funds invest in futures, which distorts the result and leave with a lower active share for this reason, although they do active management, so I should study the funds one by one.

Clara Mir Areizaga
10
2. Basic concepts
a) Investment funds
i. Definition investment fund
An investment fund collects money from various investors in order to create a pool of money. Thanks to the great amount of money that the investors have invested in the investment fund, they can purchase a number of securities, such as equity shares, bonds, treasury bills and, other financial instruments. As a result, every investor has ownership and control of its shares. Thanks to the investment fund, the individual investors have access to a broader number of securities that wouldn´t have access if they were investing alone. Moreover, they are investing in a fund, where there are a number of managers with expertise that individual investors don´t have. The individual investor has the advantage to take out their money easily. In addition, the risk is spread between all the investors of the investment fund, so the risk that is assuming an individual investor in the investment fund is lower than if he would invest out of the investment fund. Finally, individual investors will be charged with lower fees than if they were investing alone because the fees are spread between all the individual investors of the investment fund. However, individual investors don´t have the chance to choose the way the portfolio is going to be invested. Since they can´t choose the securities where they are going to invest, they have to select the investment fund that most cover its needs, with regards to its goal, risk, fees and, other factors. The fund manager is the one who decides which kind of securities they are going to invest in, the weighted percentage of each security and when they are going to buy and sell the portfolio. The main investment funds are mutual funds, exchange-traded funds, money market fund, and hedge funds. However, each kind of investment funds differs depending on several factors such as broad-based or tightly focused, open-end or closed-end funds, the investment strategy, the maturity, underlying assets, etc. Now we are going to see the main differences between them.
ii. Open-end and closed-end fund
There are some main differences between those funds. Firstly, in the case of an open-end fund, the maturity is perpetual while in the closed-end fund there is a fix duration such as 3 years, 5 years, 7 years, etc. To continue, the open-end fund can be bought anytime, while in the closed-end fund investor can only buy in the New Fund Offer, so after this offer is over, and you cannot invest in a closed-end fund. In the case of the open-end fund, there is no restriction regarding the number of shares of bonds or stocks the fund can issue, but in the closed-end fund, there is a limit number of shares. Moreover, in the open-end fund, the shares are bought and sold on demand, so if an investor wants to purchase, new shares are created and if he wants to sell them, those shares will be sold to another investor. Another important difference between those funds is that in the case of open-end funds they have a cash reserve requirement, while

Clara Mir Areizaga
11
in the closed-end funds they do not have that requirement. With regards to risk and return, open-end funds are less risky but have a lower return, while closed-end funds have a higher risk and a bigger return. Finally, the shares of open-end funds are less liquid and priced at the net asset value at the end of the trading day. However, in the case of closed-end funds, the shares are more liquid, and the price is set by the market, so it may be less or more than the fund net asset value.
iii. Broad-based or tightly focused
There are two types of investment funds, on the one hand, the broad-based fund that follows the S&P 500 like the index funds and on the other hand, the tightly focused funds that invest in one kind of securities such as ETF.
iv. Investment style
Another way to differentiate the different investment funds that exist is through the investment style they are using. Choosing investment funds with different investment style may reduce the risk of the investors. There are 4 different strategies:
• Top-down approach starts with the general economic picture, and then goes more deeply into the industries or countries that have a lot of factors, so as to go to do well. As a result, the fund invests in those industries or countries that might have a higher return.
• Bottom-up approach: instead of starting from a general point of view, they go directly to the industries or countries that look that they will have high returns. As a result, the fund invests in those companies, no matter what the prospects are for their industry or the economy.
• A combination of top-down and bottom-up approaches: in this case, the manager of the fund does a mix of the two previous strategies because, on the one hand, it decides in which country to invest based on a top-down analysis but when it comes to doing the asset allocation, the manager does the bottom-up analysis.
• Technical analysis: in this analysis, the manager makes a forecast based on past market data.
v. Underlying Asset
Inside the mutual funds or closed-end funds, depending on the different type of securities that the mutual fund is trading, there are the following investment funds:
Exchange Traded Funds First of all, they are similar to closed-end funds, since they are also traded in the stock exchange. However, they can be sold or buy at any point of the trading day. Moreover, they are passive portfolio management because they are replying an index, so they have low fees. Finally, its main advantage is that is more flexible with the investment fund.

Clara Mir Areizaga
12
Fix income fund It is known as fix income fund, those funds that the majority of the securities of the portfolio are fixed income assets, such as government bonds, investment-grade corporate bonds or high yield corporate bonds. In this fund, the return will depend on maturity. Therefore, the shorter the maturity of the asset, the lower the risk and the lower the return. However, the longer the maturity of the asset the higher the risk and the higher the return. As a result, this type of investment is perfect for a conservative profile of investors, since they can accept the lower risk, but they will receive a lower return. For instance, high yield corporate bond funds are riskier than government or investment grade bonds funds.
Money market fund This fund like the fix-income fund invests in fix income securities but in the short-term such as treasury bills, government bonds, bankers’ acceptances, certificates of deposit or commercial papers. As a result, the fund is a free-risk fund, but the investor will receive a low return too, so the investor won´t worry about losing the money he has invest. This is suitable for very moderate investors.
Variable income fund Unlike the fix income fund, in this case, this type of funds invests the majority in variable income assets, such as stocks. The variable income assets generate higher returns because the investor is assuming a higher risk too. As a result, this type of fund is suitable for moderate-aggressive investors. Inside the variable income funds, we can find a number of different funds too depending on the market, the sector where they are investing or the size of the company.
Mixed income fund In this third type of fund, instead of investing in one type of assets, the fund diversifies the investment by investing part of their capital in fixed-income assets and the rest in variable-income assets. Depending on the weighted percentage for each security, the fund will be riskier or not and will have a higher return or not. Consequently, if the funds decide to invest more in fix income assets than in variable income assets, the risk will be lower and therefore the return will be lower too. However, if the funds decide to invest more in variable income assets than in fix income assets, the risk will be higher and therefore the return will be higher too. As a result, this type of funds can be suitable for any investor profile, since depending on the proportion associate to each security the risk and return will be higher or not.
Index fund
This fund objective is to reply to what an index such as ibex 35 is doing. Depending, on the movements of the index, the index fund will have a lower or higher return. Unlike the active portfolio management, the index fund has lower costs, since the manager

Clara Mir Areizaga
13
doesn´t have any extra effort the only thing he has to do is to reply the index. This will be discussed later is a deeper way.
Fund of funds As it is said in the title, those funds invest in other funds. Consequently, like in the balanced fund they try to diversify the portfolio in order to reduce the risk and in consequence the return.
Specialty fund or tightly focus fund
Those funds are specialized in a type of security such as real estate, commodities or socially responsible investing. For instance, an investor can invest in a socially responsible fund that is focused on supporting the human rights and diversity, the environmental stewardship and may avoid investing in companies involved in tobacco, alcohol, weapons, gambling and the military. The disadvantage is that it can be extremely volatile because it might be highly correlated to another sector.
Global fund
Regarding global funds, they invest in international funds, so they diversify the portfolio and they can reduce the risk of it. For instance, if the return of two different countries is uncorrelated, the fund can make a portfolio with assets of the two countries, so as to make the portfolio more diversified and reduce the risk. The main advantage of this fund is that it does not have policies, so there is a lot of flexibility. For instance, this fund can invest without specifying the proportion of each security, the currency used, or the geographic market reached.
Guaranteed fund In this type of fund, they ensure the investor that he will preserve the initial amount invested up to a specific date. However, they cannot ensure the investor that he will receive returns on its investment. There are two types of guaranteed funds: guaranteed fixed-income funds and guaranteed variable-income funds. While the first one, ensure the return of the initial investment and an extra return on the expiration date, the second one also guarantees the return of the initial investment and an extra return depending on the currency exchange rate, stock market indexes, changes in the stock prices or other investment funds. However, if the conditions of the fund are not met by the investor, he will not obtain any extra return. The objective of the fund is to make the investor keep his money for a period of time in the fund. Since the risk of those funds is low, the return will also be low.
Equity fund
The equity funds generally invest in stock securities and are the largest category of mutual funds. Since we are talking about equities, its objective is long-term capital growth. Nevertheless, there are many different types of equity funds because there are

Clara Mir Areizaga
14
many different types of equities. The advantage of those funds is that the holders of stocks have the right of going to the shareholder meetings and the right to receive dividends. However, as we can see in the following point there are two types of equity funds, the one that distributes the dividends and the ones that reinvest them.
Distribution fund The particularity of this fund is the fact that investors will receive periodically dividends, so they are dealing with stocks. With regards to the amount of the dividends, it will depend on the money generated and the amount they have agreed to distribute. Thanks to this, the investor can have liquidity, but he will also have to pay taxes.
Accumulation fund
While the distribution fund distributes dividends, the accumulation fund does not distribute to his investors. Instead, the manager reinvests in the fund these dividends.
Bond fund As the title says, in this type of funds they trade with different types of bonds. Taking into account that bond funds have a high risk, in mutual funds investors can receive a higher return than in certificates of deposits or in money market investments. Obviously, there are different types of bonds, so depending on the bonds the fund has chosen to trade in, they will be assuming more or less risk. For example, a fund specializing in high-yield junk bonds is much riskier than a fund that invests in government securities.
Real estate The are several mutual funds and ETF that invest in real state, which is basically to buy a commercial or residential property.
Hedge Fund Hedge funds are in the category of alternative investments, despite the fact that they are focused on the ones that can meet the income and net worth requirements of being an accredited investor. Hedge funds may invest almost anywhere and may hold up better than conventional investment vehicles in turbulent markets. Finally, another way to differentiate between investment funds is if they are following an active or passive portfolio management. Bearing in mind that my work is really focused on this aspect, I am going to explain it deeply in another point.
b) Active and passive portfolio management
Every fund when dealing with a portfolio has two possible strategies, in order to generate a return on the investment: the active portfolio management or passive portfolio management.
Clara Mir Areizaga
15
i. Active portfolio management
On the one hand, the active portfolio management, consists on a manager actively selling and buying assets who spends more time and effort, so as to beat and outperform a given benchmark index such as Standard & Poor´s 500 or the Ibex35. In order to beat and outperform the market, the manager uses its own intuition to select the individual securities and decides when to buy and sell them. Taking into account that its aim is to beat the actual benchmark index, the manager or the management team has to know really well the market. By knowing and understanding the market, being updated about the changes on the market, studying the different trends and evaluating possible factors that will affect the market, the manager or management team can anticipate future actions or situations that will affect the market. Thanks to that, the manager or the management team can buy a security when the market is undervalued or can sell the security when the market is overvalued. Moreover, they can also be more precise choosing the right investments and manage the risk in an easier way. As a result, the success will depend on the knowledge of the manager or management team, the quality of the researches they are doing and how real their forecast is. If they are doing a good job anticipating the market, the results can be of greater success than in the passive portfolio management. Active managers strongly believe that if they anticipate the market correctly, the return can be higher than if they simply copy what the index is doing. However, bearing in mind that the active portfolio managers have to spend more time and effort to beat the market, they usually charge high fees and commissions to their customers. A problem that is often debated nowadays is the fact that if those high fees and commissions are compensated with the high return that the investor receives. Since this issue has been debated for years, I found interesting analyzing both portfolio management, so as to come to a conclusion. Once I have defined what active portfolio management is, I´m going to conclude giving some advantages and disadvantages of this portfolio management.
Advantages: -Flexibility: the active manager has huge flexibility since they do not have to follow a specific index like in passive management. So, if they want to change their type of stock, they can do it in an instant. -High return: active managers defend that if they are able to anticipate the market and beat it, the returns are huger than in passive management. This is true because a passive manager will never achieve the huge returns that an active manager achieves when it beats the markets. -Tax: another unbelievable advantage is that some investor doesn´t mind having losses because they can deduct those losses in the corporate income tax. Consequently, they pay fewer taxes.

Clara Mir Areizaga
16
Disadvantages: -Cost: taking into account all the effort and time active managers are spending, in order to beat the market, it is not surprising the fact that they will charge high fees. Most of the active managers charge high fees, no matter if they have achieved to beat the market or not. In conclusion, besides sending to the customer an annual bill, the active manager will also receive a part of the profits, so if a client has 10% of profits after the fees and commissions of the active manager, the client will have a profit of 6%. -High risk: when the active manager makes a decision, the decision is based on quantitative information but at the end, the manager is not 100% sure that he is making the right decision, so he also uses its intuition. As a result, the client must understand that he is facing higher risk, because the manager intuition can fail and he might choose a bad stock, misjudge market movement or sell and buy stock in the wrong moment. Therefore, it is really important to have confidence in the manager and to trust him, because he is dealing with your wealth.
ii. Passive portfolio management On the other hand, the passive portfolio management, consists of a manager who invests for the long haul. Instead of trying to beat the market like in the active portfolio management, in the passive portfolio management, the manager creates a portfolio that tracks a market-weighted index or portfolio. In this case, the manager chooses stocks of an index such as Ibex35 or Standard & Poor´s 500 and he replies the same weights. As a result, its objective is not to beat the market but to generate a return equal to the chosen market. Taking into account that the investor is investing in a portfolio that is replying an index, there is a lot of information transparency regarding the stocks of the portfolio. Therefore, all investors have access to the information they require and it´s difficult to obtain an extra gain over the rest of investors. Moreover, in the passive portfolio management there isn´t a management team which has to be updated about the changes in the market, study the different trends or evaluate possible factors that will affect the market, because since they are trying to beat the market, the only thing they have to do is to reply what the index is doing. Consequently, instead of management teams, it can be organized as exchange-traded funds, a mutual fund or unit investment trust. Then, the fees and commission that are charged in the passive portfolio management are much lower than the ones charged in the active portfolio management. Finally, while in the active portfolio management the trading is more proactive, since they buy and sell assets continuously, in the passive portfolio management the trading is not as usual, due to the fact that they only buy and sell when the index is changing. For instance, in the following table, we can see the companies that compose the Ibex 35 and the weighting percentage of each one of them. As a result, in the passive portfolio management, the fund has to reply to the market, so it has to have the same weighting percentage than the Ibex 35. However, when the index switches up its constituents because an enterprise has left the index, the fund will have to change its asset allocation by making adjustments in order to reply to the market.

Clara Mir Areizaga
17
Illustration 2: Composition of the Ibex 35
3 Once I have defined what passive portfolio management is, I´m going to conclude giving some advantages and disadvantages of this portfolio management.
Advantages: -Cost: bearing in mind that the investor is investing on a portfolio which is replying an index, there is no need to be updated about the changes on the market, study the different trends or evaluate possible factors that will affect the market. Therefore, the fees and commission are lower. -Transparency: since the passive portfolio management is replying the index, there is more information and transparency about the company where you are investing, where your money is and what is doing. -Long-term result: if you are an investor that is looking for a return in the long term, passive portfolio management gives high returns.
Disadvantages: -Low return: taking into account that the passive portfolio management doesn´t try to beat the market, the passive portfolio management will never generate the results that the active portfolio management does. -Limitations: since the investor is investing in a portfolio that is replying the market, he has not freedom in order to choose the stocks where he wants to invest, and he is limited to a specific index. -Volatility: the passive portfolio management is an investment on the long term because it is a very volatile market, so investors shouldn´t panic when values drop and shouldn’t be tempted to take their money out.
3 Source: Bolsa y Mercados Españoles (Own elaboration)
STOCK % STOCK %
Santander 14,34 RED.ELE.CORP 2,43
Iberdrola 10,08 ACS CONST 2,3
Inditex 9,56 Grifols 2,17
Telefonica 8,74 Endesa 2,01
BBVA 6,92 Bankinter 1,41
Amadeus 5,9 Enagas 1,28
Repsol 4,93 B.Sabadell 1,26
Caixabank 4,26 Cellnex 1,16
INT.AIRL.GRP 3,06 Merlin 1,14
Naturgy 3,02 Bankia 1,06
Ferrovial 2,92 Siemens 1
AENA 2,75 Mapfhre 0,97
IBEX 35
Clara Mir Areizaga
18
3. Indicators Once I have made an overview of the problem and I have explained the basic concepts, I am going to start with my research. But first, I will expose and explain the indicators that I will use. Firstly, I will select the ones that best reflect the portfolio that I consider most attractive and interesting, then I will define and explain each indicator, after that I will explain how I will work with them, that is, their way to calculate and finally, I will set preferences based on the importance of each of them. There are a number of indicators that can be used, in order to conclude which type of portfolio management is the most attractive. However, I have selected the main ones and the ones that are intended to help in order to know the risk-return profile of an investment. The indicators selected have been:
• Active share
• Tracking Error
• R2
• Alpha
• Beta
• Sharpe ratio
Now, I am going to go through each one of them.
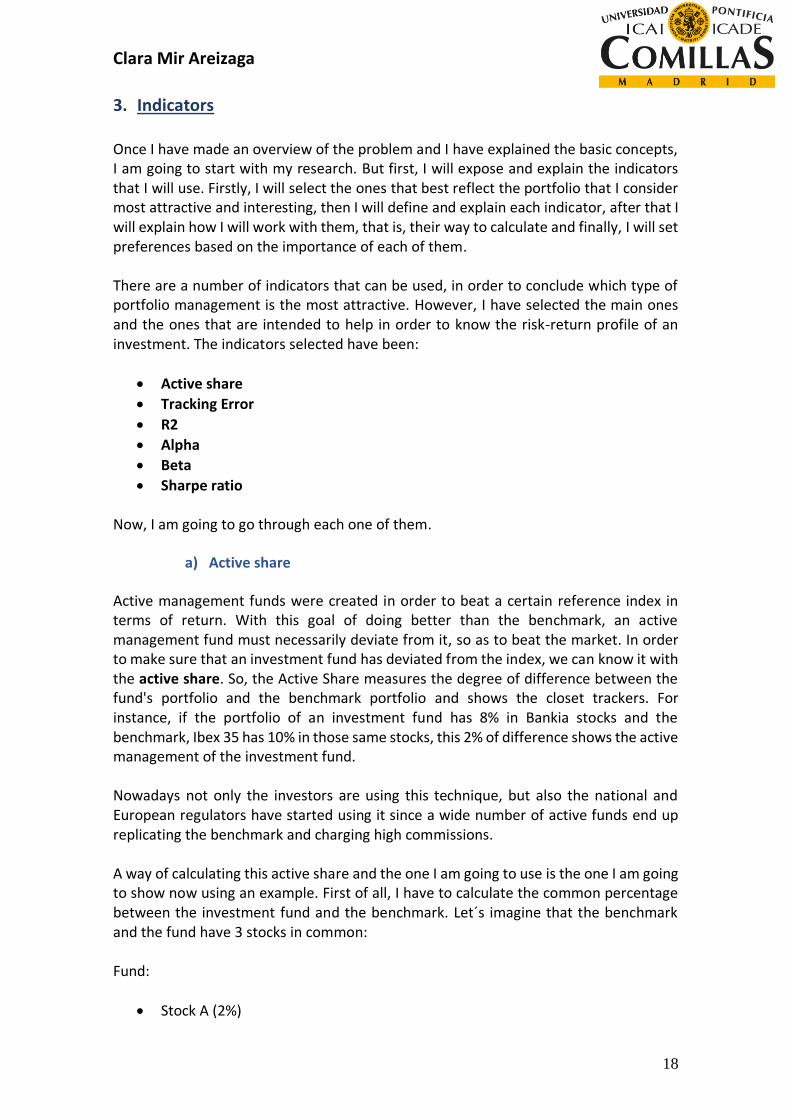
a) Active share
Active management funds were created in order to beat a certain reference index in terms of return. With this goal of doing better than the benchmark, an active management fund must necessarily deviate from it, so as to beat the market. In order to make sure that an investment fund has deviated from the index, we can know it with the active share. So, the Active Share measures the degree of difference between the fund's portfolio and the benchmark portfolio and shows the closet trackers. For instance, if the portfolio of an investment fund has 8% in Bankia stocks and the benchmark, Ibex 35 has 10% in those same stocks, this 2% of difference shows the active management of the investment fund. Nowadays not only the investors are using this technique, but also the national and European regulators have started using it since a wide number of active funds end up replicating the benchmark and charging high commissions. A way of calculating this active share and the one I am going to use is the one I am going to show now using an example. First of all, I have to calculate the common percentage between the investment fund and the benchmark. Let´s imagine that the benchmark and the fund have 3 stocks in common: Fund:
• Stock A (2%)

Clara Mir Areizaga
19
• Stock B (3%)
• Stock C (5%) Benchmark:
• Stock A (3%)
• Stock B (4%)
• Stock C (1%) If we sum all the percentages of the fund, we have a total percentage in common of 6%. In order to calculate the active share, we have to subtract that 6% to 100%, which is 94%. So, the active share is 94%, which is a good percentage because it is considered that an active share below 60% is a management too close to the benchmark, while a management over 60% is a portfolio different from the benchmark. The higher the active share, the more different the portfolio will be from the benchmark and the more active the fund will be. Even if the active share is a good indicator in order to measure the level of active risk in a portfolio, many Spanish funds include futures in their portfolios that can distort the result and come out with a lower active share for this reason. As a result, there are other indicators that can also measure the level of active risk in a portfolio, such as tracking error or R2, so the active share should not be used in isolation, I am also going to consider other indicators.
b) Tracking error
The tracking error measures the volatility of the difference in terms of returns between the fund and its benchmark in a certain period of time. Is a standard deviation, which quantify the difference between the return of the fund and the one of the benchmark. A high tracking error shows that in order to achieve the return of the fund, it has assumed greater risk than the benchmark. In the case of a passive investment fund, they are not interested in a high tracking error because they are searching to replicate the benchmark, so they do not want to assume greater risk than the benchmark. However, in the case of an active investment fund, having a high tracking error is a positive thing, since it means that the fund has assume a higher risk than the benchmark, so they should receive a greater return than the benchmark, but they can also underperform the benchmark. As a result, the higher the tracking error, the lower the possibility that the fund has replicated the benchmark and vice versa. The tracking error as every measure of volatility, can´t be negative. It is said that a tracking error between 0% and 2% is passive management, a tracking error between 2% and 5% is management with some kind of risk but controlled and a tracking error over 5% is active management. The way of calculating this indicator is the following:
Tracking error= (Rfund-Rbenchmark)

Clara Mir Areizaga
20
Where:
is the standard deviation Rfund is the return of the fund Rbenchmark is the return of the benchmark For instance, lets imagine that we have the following returns regarding an investment fund and the benchmark: Benchmark: 12%, 5%, 13%, 9% and 7% Fund: 11%, 3%, 12%, 14% and 8%. As a result, the tracking error, will be calculated by subtracting each return of the fund by the return of the benchmark and doing the standard deviation of each one, as follow.
Tracking error= (11%-12%) + (3%-5%) + (12%-13%) + (14%-9%) + (8%-7%) = 2,79% So, a tracking error of 2,79%, means that the investment fund has assume some kind of risk by not replicating the market and thanks to that they might have a return within 2,79%, plus or minus, of the benchmark. Taking into account the number of variables that are included in the calculation, it should be only another way of evaluating a fund. There are also other important indicators such as the R2.
c) R2
The R2 or the coefficient of determination, analyze how differences in one variable are explained by a difference in a second variable. In investing, the R2 is the percentage of a fund movements that can be explained by movement in a benchmark index. So, it is used in order to determine an investment correlation with the benchmark. As a result, it is given a value of 100 to the benchmark, so if a certain fund has an R2 of 97%, this means that 97% of the fund movements are explained by the benchmark movements, so the fund in replicating the market. It is stablished that an R2 between 85% and 100%, the fund moves in the same way than the benchmark. The funds with a R2 lower than 70%, are considered that they are not doing the same movements as the index. The formula of the R2 is the following: Equation 1:R2 equation
4
4 Source: Investopedia

Clara Mir Areizaga
21
Explained variation, is the sum of squares due to regression, which measures how well the regression model represents the data that were used for modelling. Total variation is he total sum of squares, which measures the variation in the observed data. In order to measure R2, I will have to make some steps before. First of all, I have to collect the data of the dependent variable (fund) and the data of the independent variable (benchmark) and to draw the line of best fit. After that, I have to calculate the predicted values, subtract the actual values and square the results and sum them. This yields a list of errors squared, which is then summed and equals the explained variance. In order to calculate the total variance, I will subtract the average actual value from the predicted value and square the results and sum them. From that point, I have to divide the first sum of errors by the second sum of errors. Finally, to the previous result I subtract one and I have the R2. Other two important indicators are beta and alpha, I am going to explain them in the next point. Both of them, have some kind of relation with R2, since R2 can be used to ascertain the significance of a particular beta and alpha, but they may not always be accurate depending on the R2.
d) Alpha
Alpha is the excess of return achieved by a fund comparing to the market, because there is no need to always earn the same returns as the market, we can outperform it. Consequently, the investment alpha is the return that a fund has reached which is over the return of the benchmark. So, the alpha is the result of an active portfolio management. The alpha can be negative or positive percentage, depending if the fund has underperformed or outperformed the benchmark and it is also used in order to rank an investment fund. Since in the active portfolio management, the manager doesn´t reply the market, the alpha should be different from 0 because an alpha of zero will mean that the fund is replicating the market. A way of generating alpha is by diversifying the portfolio to eliminate the unsystematic risk. For instance, suppose that Maria is an active manager that charges a fee of 1% because she is doing an extra effort in order to beat the market. However, Maria after 1 year has managed to attend an alpha of 0,75 for the portfolio of her client Clara. As a result, even if Maria has achieved to obtain an alpha different form zero, the fees are too expensive of the alpha she has manage to generate. So, Clara´s portfolio has suffered a net loss. Moreover, if the return of an investment fund is 8% and the one of the benchmark is 4%, the client of the portfolio might be satisfy with the return. However, if the return of an investment fund is 8% and the one of the benchmarks is 14%, the client of the portfolio would not be happy. As a result, active investors prefer a high beta.

Clara Mir Areizaga
22
Formula of alpha: Equation 2: Alpha equation
5 Even if it is important to measure the alpha, I am considering other indicators because alpha might not be accurate when the R2 is low. This is because the underlying benchmark used in the alpha calculation does not have significant relevance to the stock or portfolio's movement to begin with.
e) Beta
Beta measures the systemic risk, which is the fact of the entire market declining, or the volatility of the portfolio of a fund comparing to the market. We can avoid the systemic risk by diversifying. Formula: Equation 3: Beta equation
6 Re: return of an individual stock Rm: return of the overall market Covariance: how a change in the return of a stock is related to the change in the return of the market. Variance: how far the market´s data points spread out from their average value. As a result, the beta is calculated by dividing the product of the covariance of the stock return and the market return by the variance of the return of the overall market in specific period of time. Thanks to this calculation, the investor can know if its stock moves in the same direction as the market and how volatile or risky is the stock comparing with the market (benchmark). We should bear in mind that the benchmark we are using should be related to our stock, because we are trying to measure how much risk a stock is adding to a portfolio. If a stock doesn´t deviated a lot form the benchmark, this will mean that he is not adding too much risk to the portfolio but is not increasing the return neither. For instance, lets imagine with have the following beta for three popular stocks:
5 Source: Investopedia 6 Source: Investopedia

Clara Mir Areizaga
23
• Acciona – beta 1.26
• Repsol – beta 0,37
• Telefonica -beta 0,99 Consequently, Acciona stock is 26% more volatile than the market, Repsol is 37% as volatile as the market and Telefonica 1% less volatile than the market. If a stock has a beta of 1, that means he is highlight correlated with the benchmark. Including a stock with a beta of 1 to a portfolio, doesn´t add any risk and doesn´t increase the excess of return neither. A correlation of 0, will mean that the stock in not correlated with the benchmark. And a beta of -1 means that the stock in inversely corelated with the benchmark. If the correlation is above 1, it also means that is more volatile than the market, so riskier. For instance, a beta of 1,3% will mean that the stock is 30% more volatile than the market. So, those stock that are added to the portfolio, they increase the risk of the portfolio but also the return. However, beta is not the most accurate indicator for multiple reasons. First of all, beta assumes that the returns are normally distributed, and this is not true, so beta might make some predictions that are not entirely true. To continue, taking into account that beta uses historical data, it not useful when investors want to make future predictions of a stock movement. Finally, beta is not useful for long-term investments, due to the fact that the volatility can change from one year to another. Last but not least the relation between beta and R2, is something that I have to talk about. In order to make sure that I am comparing the stock with the right benchmark, I can calculate the R2. If it has a high R2, it would mean that it is being compared with the right benchmark and it will indicate a more useful beat figure. However, if R2 is low beta may not provide an accurate reading and is less relevant to the fund performance.
f) Sharpe ratio
Sharpe ratio makes a relation between the return and the risk. Thanks to the Sharpe ratio, the investor can know and understand the risk he is assuming for an extra return. The higher the sharper ratio, the more attractive the risk-adjusted return. If the Sharpe ratio is negative, it means that the risk-free rate is greater that the portfolio return or that the portfolio return is expected to be negative. Formula: Equation 4: Sharpe Ratio equation
7 Rp: return of portfolio Rf: risk-free rate
: standard deviation of the portfolio´s excess return (volatility)
7 Source: Investopedia

Clara Mir Areizaga
24
Now I am going to use an example in order to understand how the Sharpe ratio works. Let’s imagine that we have a portfolio with a return of 15% but the investor is planning on adding a new asset, such as Inditex equities. The risk-free rate is 3,5% and the volatility is 12%, so the Sharpe ratio is 95,8%. The investor is convinced that if we add the Inditex equities, the return will drop to 11%, the volatility to 7% but the risk-free will remain the same. Using the formula, we have a Sharpe ratio of 107%. As a result, we can see that if we add Inditex equities the return of the portfolio drops but it performs the risk-adjusted basis. In conclusion, if adding an asset reduces the Sharpe ratio, we shouldn´t added to the portfolio. Although, if adding an asset performs the Sharpe ratio, it should be included to the portfolio. As we already know when we add assets on a portfolio that are not correlated or have a low correlation, it decreases the risk of the portfolio. Since the assets are not correlated this means that if one asset has not returns, the other asset will have returns, so we are reducing the risk by adding not correlated assets. Moreover, by diversifying the portfolio, we are increasing the Sharpe ratio. The Sharpe ratio can be calculated for past performance or to make a forecast. When the Sharpe ratio, is used to calculate past performance we use actual return. Although, when we want to make a forecast, we will use expected portfolio performance and the expected risk free. Thanks to Sharpe ratio, we can know if the excess on return of a portfolio is due to smart investment decision or as a result for assuming more risk. Even if a portfolio has a high return, an investment is good when if those higher returns do not come with excess of additional risk. However, the Sharpe ratio also has some limitations, since it assumes that returns are normally distributed and that price movements are equally risky. Once I have explained all the indicators that I am going to use and their way of calculating, I would like to highlight the importance that I am going to dedicate to each indicator. As we have seen, some indicators are more accurate than others, so it would not be logical to give to all the indicators the same importance. Therefore, as it is explained in the news attached at the beginning of the paper to resolve how active a fund is, it is necessary to focus primarily on the tracking error and the R2. However, we have seen that indicators such as Sharpe ratio, alpha and beta are not accurate indicators since they assume that returns are normally distributed, and they depend on other indicators. Finally, the active share indicator can be distorted due to the futures included in a portfolio. Even if tracking error, R2 and active share are the main indicators in order to measure the level of active risk in a portfolio, since active share can be distorted due to the futures included in a portfolio, I am going to give a greater importance to tracking error and R2 indicators. Then to the active share. However, to make sure of my conclusions and to ratify my research I will take into account the rest of indicators.

Clara Mir Areizaga
25
Last but not least, I would like to highlight that taking into account that we are focused in Spanish investment funds; our benchmark or market will be the IBEX 35.

Clara Mir Areizaga
26
4. Selection of investment funds
After having selected and defined the indicators that I am going to use, I will choose the investment funds. As I have previously mentioned, I am going to select 9 active management investment funds and 9 passive management investment funds, in order to have a greater number of examples and not just based on a few that do not really represent the type of management. In order to make it simple, I will focus on Spanish investment funds, because if I start comparing funds from different countries, I would have to make foreign exchange and take into account external factors that have affected my results and therefore vary in each country. Finally, all them will invest in equities, since they are a variable income so we can see more accurately the variation in the return between the active and passive funds.
a) Selection of passive investment funds
i. Fondo Naranja Ibex 35
This investment fund is provided by the ING bank, which is a Dutch multinational bank that has its headquarters in Amsterdam. This bank was founded in 1991 and is one the biggest banks in the world. Its principal services are retail banking, direct banking, commercial banking, investment banking, asset management and insurances services. Moreover, it has a total asset of US$ 1.1 trillion. With regards to the fund, taking into account that is a passive fund, they are focused on replicating the Ibex 35, which contains the 35 best perform companies of Spain, such as Acciona, Inditex, Iberdrola etc. Taking into account that the Ibex 35, includes companies of different sectors, they are diversifying their portfolio, because if one sector undeforms, the other stocks or sectors can compensate those losses. The ING Direct Fondo Naranja Ibex 35 fund has a management fee of 0.99%, and 0.1% of depositary commission. As a result, the ratio PER is 1,10%. This fund was established on 02/08/2002. In order to know the return of the portfolio, the investor only has to search in the media what has been the return of the ibex 35. As any financial product, the investor has to assume some kind of risk. In this investment fund the risk is 6 out of 7 and the associated risks are market risk, investment risk of derivatives and risk of geographical concentration.
ii. Lyxor Ibex 35
As it is explained in their web page, this investment fund is carried out by Societe Generale bank8, a French bank which is categorized as a multinational investment bank. This investment bank has it headquarter in Paris, France. This bank offered a large
8 Source: https://www.societegenerale.es/es/

Clara Mir Areizaga
27
number of services such as Financial Services, Corporate and Investment Banking, Private Banking, Asset Management, Securities Services etc.
Comparing with the competence, we can say that Société Générale is the third largest bank by total assets in France and with regard to Europe it is the sixth largest.
This investment fund was created the 19 of January of 2006 and the manager is Sebastien Foy and Raphael Dieterlen. The investment objective of the fund is to replicate the upward and downward evolution of the IBEX 35, representative of the 35 most liquid securities listed in the interconnection system of the four Spanish stock exchanges. The tracking error calculated over a period of 52 weeks should be kept below 1% and, if higher, below 5% of the volatility of the Reference Index.
The minimum investment of the portfolio is 100.000€. As any financial product, the investor has to assume some kind of risk. In this investment fund the risk is 6 out of 7. The investors will have to assume some commissions but taking into account that is a passive management fund the fees won´t be as high as in the active one. This investment fund has a 0,30% of management fees and 0,0% of depository commission, so the TER is 0,30%.
iii. Bankia Indice Ibex
This investment fund is provided by Bankia bank, which is a Spanish bank founded in 2010 with headquarter in Madrid and Valencia. Bankia total assets are around 205.223 million of euros, being the fifth Spanish financial institution by asset volume. With regards to date of creation of the fund, it was made up the 23 of February of 2005 and the minimum investment is 100 euros. As they announce in their webpage, “the objective is to replicate the IBEX-35 index, made up of the 35 most liquid and most capitalized securities of the Spanish Stock Exchanges, thus being able to overcome the general limits of diversification. The portfolio will be structured according to the composition of the IBEX-35 index to try to achieve a similar profitability, investing 100% of the total exposure in index values, and derivatives on the index, being able to invest up to 10% of the equity in financial IICs, which replicate or take as a reference the index. The part not intended to replicate the index will be invested in public debt of issuers and EU markets, or in temporary acquisitions”. In order to know the return of the portfolio, the investor only has to search in the media what has been the return of the ibex 35. Even if in this investment fund there isn´t currency risk, the investor has to assume some kind of risk. There are three classes inside this fund depending on the minimum investment and the wealth. The universal class has a minimum investment of 100€ and a wealth of 52,95 M€, the interna class has a minimum investment of 1€ and a wealth of 39,36 M€ and the cartera class has a minimum investment of 1€ and a wealth of 0,40 M€. The investor will also have to pay some fees, depending of the class. He will be charged with 0,36% of management commissions, and a TER of 0,46% in the cartera class, 0,90% of management commissions, 0,10% of depository commissions and a TER of 1,0% in the universal class and no fees in the interna class. There is also a 2%

Clara Mir Areizaga
28
reimbursement commission for participations less than 7 days old. In this investment fund the risk is 6 out of 7.
iv. Santander índice España
This investment fund is provided by Banco Santander, one of largest financial entities of the world and its main markets are Spain, Portugal, United Kingdom, Poland, Brazil, Mexico, USA, Uruguay, Argentina and Chile. Its operational headquarter is in Madrid. Santander's assets amounted to 1,459,271 million euros, being the first Spanish financial institution. The main objective of this investment fund is to replicate the IBEX-35 index, made up of the 35 most liquid and most capitalized securities of the Spanish Stock Exchanges, being able to overcome the general limits of diversification. The Fund may exceed the general limits of diversification. The portfolio will be structured according to the composition of the IBEX-35 index to try to achieve a similar profitability, investing 100% of the total exposure in index values. The profitability of the fund and that of the index may not be similar because, on the negative side, the fund supports commission expenses and additional expenses, and on the positive side, it can pass on additional income for the distribution of dividends. The investment fund, which was created in the 12 of April 2013, formerly called "OPENBANK IBEX 35, FI". It is marketed under three different classes: Institutional (minimum investment of 50 million euros), Class B (minimum investment of 300,000 euros) and OpenBank and cartera Class (investment minimum of 1€). As any financial product, the investor has to assume some kind of risk. In this investment fund the risk is 6 out of 7. The commission are different for each type of classes. The institutional class has a 0,10% of management fees and 0,03% of depository commission, so the TER is 0,13%. The class B has a 0,90% of management fees and 0,1% of depository commission, so the TER is 1,0%. The Openbank class has a 1,0% of management fees and 0,10% of depository commission, so the TER is 1,10%. Finally, the cartera class, has a 0,15% of management fees, so the TER is 0,25%.
v. Caixabank bolsa índice España
This investment fund is provided by Caixa bank, which is a Spanish bank with operational headquarters in Barcelona and head office in Valencia. It was founded in Barcelona in 2011 and in 2018, Caixa bank assets were around 386,622 million euros, being the third financial entity in Spain in terms of asset volume. This investment fund was constituted the 12 of April 2013 and is divided into two classes. The standard class, which its wealth is 29 038 105€ and institutional class which wealth is 205 646 121€. The main objective of this investment fund is to replicate the IBEX-35 index, made up of the 35 most liquid and most capitalized securities of the Spanish Stock Exchanges, being able to overcome the general limits of diversification. The portfolio

Clara Mir Areizaga
29
will be structured according to the composition of the IBEX-35 index to try to achieve a similar profitability, investing 100% of the total exposure in index values. Although it will be affected by the fees and expenses applicable to the Fund. The maximum deviation with respect to the index may not exceed 2.5%, calculated according to the applicable legal regulations. As any financial product, the investor has to assume some kind of risk. In this investment fund the risk is 6 out of 7. This risk is due to the percentage of exposure to equities as well as geographical or sectorial concentration. There are different classes inside the fund depending on the minimum investment. The minimum initial investment of the Standard class is 600 euros and it has a 1,00% of management fees and 0,02% of depository commission, so the TER is 1,02%. The institutional class has a minimum investment of 50M€ and 0,11% of management fees and 0,02% of depository commission, so the TER is 0,13%. The extra class has a minimum investment of 150.000€ and 0,75% of management fees, so the TER is 0,77%. The platinum class hasn´t a minimum investment but it has a 0,26% of management fees, so the TER is 0,28%. Finally, the cartera class hasn´t a minimum investment but it has a 0,11% of management fees, so the TER is 0,13%.
vi. BBVA bolsa indice FI
As we can see in the name of the fund, the BBVA bank has created this investment fund. BBVA is a multinational Spanish banking group based in Madrid and Bilbao. It is one of the largest financial institutions in the world, and is present mainly in Spain, North America, South America and Turkey. As of December 31, 2018, BBVA's assets amounted to 676,689 million euros, making it the second Spanish financial institution by volume of assets.
The investment fund is managed by Nerea Alarcon Cabezas and Javier Martinez Uriarte and was created the 29 of august 1996. The management objective is to replicate the IBEX 35 index, being able to overcome the general limits of diversification. The fund may exceed the general limits of diversification. The limit of 20% exposure to a single issuer may be exceeded up to 35%, if the weighting of said issuer in the index exceeds 20%. The profitability of the fund and the index may not be similar because, on the negative side, the fund supports commissions and additional expenses, and on the positive side, it may pass on additional income for the distribution of dividends.
As any financial product, the investor has to assume some kind of risk. In this investment fund the risk is 6 out of 7. The investors will have to assume some commissions but taking into account that is a passive management fund the fees won´t be as high as in the active one. This investment fund has a 1,10% of management fees and 0,2% of depository commission, so the TER is 1,30%.

Clara Mir Areizaga
30
vii. Acción Ibex 35
This investment fund is provided by BBVA bank, which is a Spanish bank with headquarters in Bilbao, chaired by Carlos Torres Vila. It is one of the largest financial institutions in the world and is present mainly in Spain, Mexico, South America, the United States and Turkey. The bank was founded in 1857 in Bilbao, Vizcaya, where it has been headquartered since then. As of December 31, 2018, BBVA's assets amounted to 676,689 million euros, making it the second Spanish financial institution by volume of assets. This investment fund was founded the 27 of April of 1998 and the manager of the fun is Cristina Lastra. The main objective of the fund is to achieve a profitability similar to the IBEX 35 index for which it will have around 100% of its total exposure in equities (RV), investing mainly in futures and, in shares of companies belonging to the index or in ETFs, with the aim of seeking the highest correlation to the index. It is conceived as a passive management fund. In order to know the return of the portfolio, the investor only has to search in the medio what has been the return of the ibex 35. As any financial product, the investor has to assume some kind of risk. In this investment fund the risk is 6 out of 7. With regards of the fees that the investor has to pay, the management fee is 0.33% and the depository commission is 0.05%, so the TER is 0,38%. The ETF distributes dividends to its participants (approximately 2 times a year), so it is perfect for savers who intend to keep their capital invested and obtain an income periodically. viii. Bankinter Futuro Ibex As we can see in the name of the fund, the fund in managed by Bankinter bank, is a Spanish bank with headquarters in Madrid. The Bank has been listed on the Bolsa de Madrid(Madrid stock exchange) since 1972, and is part of the Ibex35 Index.
This investment fund was founded the 14 of July of 2006. The main objective of this investment fund is to reproduce the evolution of the Ibex 35. As a result, the investment fund will be made of stocks of the company’s that take part in the Ibex 35, in derivative instruments on the index and even on the investment in other UCIs referenced to said index. In order to know the return of the portfolio, the investor only has to search in the medio what has been the return of the ibex 35. Inside the investment fund there are different classes, depending on the wealth of the fund. On the one hand, we have the class R with a wealth of 119,63M€ and on the other side, we have the class C with no wealth. As any financial product, the investor has to assume some kind of risk. In this investment fund the risk is 6 out of 7. The commission are different for each type of classes. The
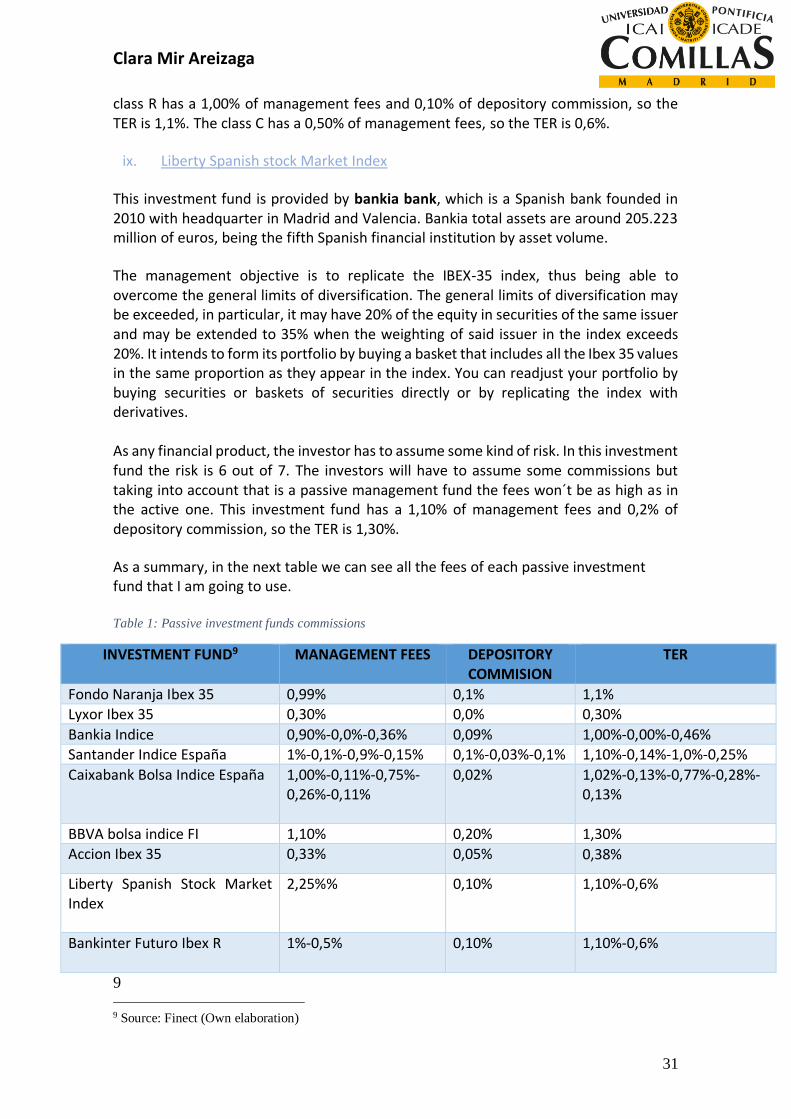
Clara Mir Areizaga
31
class R has a 1,00% of management fees and 0,10% of depository commission, so the TER is 1,1%. The class C has a 0,50% of management fees, so the TER is 0,6%.
ix. Liberty Spanish stock Market Index
This investment fund is provided by bankia bank, which is a Spanish bank founded in 2010 with headquarter in Madrid and Valencia. Bankia total assets are around 205.223 million of euros, being the fifth Spanish financial institution by asset volume.
The management objective is to replicate the IBEX-35 index, thus being able to overcome the general limits of diversification. The general limits of diversification may be exceeded, in particular, it may have 20% of the equity in securities of the same issuer and may be extended to 35% when the weighting of said issuer in the index exceeds 20%. It intends to form its portfolio by buying a basket that includes all the Ibex 35 values in the same proportion as they appear in the index. You can readjust your portfolio by buying securities or baskets of securities directly or by replicating the index with derivatives. As any financial product, the investor has to assume some kind of risk. In this investment fund the risk is 6 out of 7. The investors will have to assume some commissions but taking into account that is a passive management fund the fees won´t be as high as in the active one. This investment fund has a 1,10% of management fees and 0,2% of depository commission, so the TER is 1,30%.
As a summary, in the next table we can see all the fees of each passive investment fund that I am going to use. Table 1: Passive investment funds commissions
INVESTMENT FUND9 MANAGEMENT FEES DEPOSITORY COMMISION
TER
Fondo Naranja Ibex 35 0,99% 0,1% 1,1% Lyxor Ibex 35 0,30% 0,0% 0,30%
Bankia Indice 0,90%-0,0%-0,36% 0,09% 1,00%-0,00%-0,46% Santander Indice España 1%-0,1%-0,9%-0,15% 0,1%-0,03%-0,1% 1,10%-0,14%-1,0%-0,25%
Caixabank Bolsa Indice España 1,00%-0,11%-0,75%-0,26%-0,11%
0,02% 1,02%-0,13%-0,77%-0,28%-0,13%
BBVA bolsa indice FI 1,10% 0,20% 1,30%
Accion Ibex 35 0,33% 0,05% 0,38%
Liberty Spanish Stock Market Index
2,25%%
0,10%
1,10%-0,6%
Bankinter Futuro Ibex R 1%-0,5%
0,10%
1,10%-0,6%
9
9 Source: Finect (Own elaboration)

Clara Mir Areizaga
32
b) Selection of active investment funds
Taking into account an article of “El confidencial” published the 13 of March 2018, there is a total of 10 Spanish funds that would be susceptible to be investigated by the CNMV, since there are several indicators that show that they could be closet indexer. Some of those investment funds are the following:
i. Santander Acciones Españolas
This investment fund is provided by Banco Santander, one of largest financial entities of the world and its main markets are Spain, Portugal, United Kingdom, Poland, Brazil, Mexico, USA, Uruguay, Argentina and Chile. Its operational headquarter is in Madrid. Santander's assets amount to 1,459,271 million euros, being the first Spanish financial institution. This investment fund was created the first of April 1991 and the manager is Jose Antonio Montero de Espinosa. This investment fund takes as reference the Ibex 35 index, which includes the 35 highest capitalization shares traded on the Spanish continuous market. It takes this index as reference, since they will try to beat that index in terms of return. At least 75% of the total exposure will be invested in equities of Spanish issuers and at least 60% will be invested in equities issued by entities in the euro area. In this particular investment fund, inside the fund there are different classes depending on the net worth that each investor prefers. As a result, we can find class A with a net worth of 281.019.584€, class B with a net worth of 407.441.054€, class C with a net worth of 356.230.624€, class D with a net worth of 20.914.514€ and class cartera with a net worth of 294.854.516€. With regards to the risk that investors have to assume, the risk of this investment fund is 6 out of 7. Moreover, depending on the class of investment fund they choose they will be charged with some fees. The class A has a 2,15% of management fees and 0,15% of depository commission, so the TER is 2,3%. The class B has a 1,8% of management fees and 0,15% of depository commission, so the TER is 1,95%. The class C has a 1,45% of management fees and 0,15% of depository commission, so the TER is 1,60%. The class D has a 1,8% of management fees and 0,15% of depository commission, so the TER is 1,95%. Finally, the class cartera has a 0,4% of management fees and 0,02% of depository commission, so the TER is 0,42%.
ii. Catalana Occidente Bolsa Española
This investment fund is provided by Grupo Catalana Occidente, which is one of the leaders in the Spanish insurance sector and credit insurance in the world. It has 7300 employees, has a presence in more than 50 countries and serves more than 4,000,000 clients. This investment fund is in the market since the 10 of February of 2003 and its manager is Jordi Viladot Pou. As the previous investment fund, this one is also going to take as reference the profitability of the Ibex 35, in order to try to beat the index and to earn
Clara Mir Areizaga
33
more profitability for its investors. The fund will maintain an exposure to Spanish equities of a minimum of 85%, although it will usually be the total assets of the fund, in companies with large capitalization, mainly of the Ibex35. The rest of the exposure will be invested in fixed income.
With regards to the risk that investors have to assume, the risk of this investment fund is 6 out of 7. Moreover, the investor will have to pay high commissions since the manager is making an extra effort to overcome and beat the market. As a result, the investment fund has a 2,25% of management fees and 0,08% of depository commission, so the TER is 2,33%.
iii. Bankoa Bolsa de Credit Agricole Bankoa This investment fund is created by the Credit Agricole Bank, is a French network of cooperative banks that have been providing services since 1994. It is the largest retail banking group in France, the second largest in Europe and the eighth largest in the world according to the Banker magazine. This investment fund was constituted the 23 of May of 1997. The Fund will invest, directly or indirectly, more than 75% of the total exposure in equities. At least 60% of the total exposure will be invested in equities of Spanish issuers, mainly in IBEX 35 securities and the rest in other OECD issuers. There is a currency risk exposure of 0% - 30%. The rest of the total exposure will be invested, directly or indirectly, in income assets fixed public / private. The average duration of the fixed income portfolio will be less than 3.5 years.
With regards to the risk that investors have to assume, the risk of this investment fund is 6 out of 7. Moreover, the investor will have to pay high commissions since the manager is making an extra effort to overcome and beat the market. As a result, the investment fund has a 2,25% of management fees and 0,10% of depository commission, so the TER is 2,35%.
iv. Bankia Banca Privada Renta Variable España
This investment fund is provided by Bankia bank, which is a Spanish bank founded in 2010 with headquarter in Madrid and Valencia. Bankia total assets are around 205.223 million of euros, being the fifth Spanish financial institution by asset volume.
This investment fund was created the 22 of October of 1997, the minimum investment is 100€ for the universal class and 1€ for the cartera class, there are 113 participants and it might not be suitable for investor that want they money back in less than 3 years. The management takes as a reference the performance of the IBEX 35 index due to the exposure to equities. It will invest more than 75% of the total exposure of the portfolio in equity assets. At least 90% will be Spanish issuers listed on the Spanish or OECD market and the rest will be invested in equities of issuers / markets outside the OECD. Equity securities will be mainly of medium and high capitalization, mainly belonging to

Clara Mir Areizaga
34
the IBEX 35 index. The rest of the exposure of the portfolio will be in fixed income, both public and private from OECD issuers.
With regards to the risk that investors have to assume, the risk of this investment fund is 6 out of 7. Moreover, the investor will have to pay high commissions since the manager is making an extra effort to overcome and beat the market, but the commissions will be different for each class. As a result, the universal class has a 2% of management fees and 0,15% of depository commission, so the TER is 2,15%. And the cartera class has a 0,80% of management fees, so the TER is 0,95%.
v. Unifond Renta Variable España de Unigest
In this case, the investment fund is provided by Unicaja Bank, which was the commercial name of Monte de Piedad and Caja de Ahorros de Ronda, Cádiz, Almería, Málaga, Antequera and Jaén, a Spanish savings bank based in Málaga. In 2011, it transferred its financial activity to Unicaja Banco.
This investment fund was founded the 27 of July 2004 and its manager is Raul Urizar. The management takes as a reference the performance of the IBEX 35 index. The fund will have at least 75% of the total exposure to equities, and at least 90% of the exposure to equities will be carried out in securities of issuers Spanish, with no preference for any specific sector. Within the variable income, the investments will materialize fundamentally in high and medium capitalization values, without ruling out low capitalization values.
With regards to the risk that investors have to assume, the risk of this investment fund is 6 out of 7. Moreover, the investor will have to pay high commissions since the manager is making an extra effort to overcome and beat the market. However, since there are two different classes depending on the minimum investment, the fees will vary. As a result, the class A has a minimum investment of 1€ and has a 1,75% of management fees and 0,13% of depository commission, so the TER is 1,88%. On the other hand, the class C hasn´t a minimum investment but it has a 0,65%, so the TER is 0,72%.
vi. Ibercaja Bolsa
This investment fund is managed by the Ibercaja bank, which is a Spanish bank with headquarter in Zaragoza. It was created by the Caja de Ahorros and Monte de Piedad of Zaragoza, Aragón and Rioja in 2011, to develop its financial activity, being initially the shareholder of 100% of the bank. This investment fund was founded the 24 of September 2010 and the manager is Ana Isabel Lain. We can find two classes in this investment fund, depending on the minimum investment and the wealth of the fund. On the one hand, we have the class A with a minimum investment of 300€ and a wealth of 66,75M€. On the other hand, we have the class B with a minimum investment of 6€ and a wealth of 0,18M€.

Clara Mir Areizaga
35
As every active investment fund, this one objective is to beat an index. Every active fund that I am selecting they take as reference the profitability of the IBEX 35 index, being able to overcome the general limits of diversification. The fund will present a correlation with the Ibex 35 index of at least 75%. The exposure will be at least 75% in equities and, at least, 80% in Spanish issuers. With regards to the risk that investors have to assume, the risk of this investment fund is 6 out of 7. Moreover, the investor will have to pay high commissions since the manager is making an extra effort to overcome and beat the market. However, since there are two different classes depending on the minimum investment, the fees will vary. In the case of the class A, the management fees are 1,5% and the TER is 1,70% and the class C, has a management fee of 0,74%, a depository commission of 0,20% and a TER of 0,94%.
vii. Rural Renta Variable España
This investment fund is managed by Caja Rural, which is a credit cooperative, one of the largest Rural Savings Banks of Spain and is present in Castilla-La Mancha, Madrid, Avila and Valencian Community. It was founded in 1965.2 in Toledo where its Central Services are located. This investment fund is investing since the 20 of April 1998 and the managers are Carlos Camacho and Beatriz Gutierrez. The management takes as a reference the profitability of the IBEX 35 index. The fund will invest, directly or indirectly through IIC more than 75% of its total exposure in equities and of it, at least 90% will be from issuers and companies listed on the Spanish continuous market and the rest of the other OECD countries, especially in the euro area. We can find two classes in this investment fund, depending on the minimum investment and the wealth of the fund. On the one hand, we have the standard class with a minimum investment of 6€ and a wealth of 66,49M€. On the other hand, we have the cartera class which hasn´t a minimum investment and a wealth of 55,32M€. With regards to the risk that investors have to assume, the risk of this investment fund is 7 out of 7. Moreover, the investor will have to pay high commissions since the manager is making an extra effort to overcome and beat the market. However, since there are two different classes depending on the minimum investment, the fees will vary. On the one hand, the standard class, has a 2,25% of management fees and 0,15% of depository commission, so the TER is 2,40%. On the other hand, the cartera class has a 0,45% of management fees, so the TER is 0,60%.
viii. CaixaBank Bolsa Gestión España
In this case this investment fund is provided by Caixa bank, which is a Spanish bank with operational headquarters in Barcelona and head office in Valencia. It was founded in Barcelona in 2011 and in 2018, Caixa bank assets were around 386,622 million euros, being the third financial entity in Spain in terms of asset volume.

Clara Mir Areizaga
36
It was created the 23 of September 2011 and the manager is Ana Besada Estevez. We can find 4 different classes inside this investment fund, depending on the wealth and the minimum investment. Firstly, we can find the standard class which has a minimum investment of 600€ and a wealth of 51,68M€. Then, we can also find the plus class which has a minimum investment of 50.000€ and a wealth of 49,52M€. To continue, we can also find the cartera class which has a minimum investment of 1€ and a wealth of 33,03M€. Finally, we can also find the premium class which has a minimum investment of 300.000€ and a wealth of 13,80M€. The main objective of the investment fund is to beat the index, Ibex35. As a result, it takes as a reference the behavior of the Ibex 35 index, being able to overcome the general limits of diversification. The exposure to equities will be at least 75% and at least 60% will be issued by entities in the euro area. Usually the exposure to equities will be 100% but may vary depending on the estimates regarding the evolution of the market. With regards to the risk that investors have to assume, the risk of this investment fund is 6 out of 7. Moreover, the investor will have to pay high commissions since the manager is making an extra effort to overcome and beat the market. However, since there are two different classes depending on the minimum investment, the fees will vary. On the one hand, the standard class, has a 2,20% of management fees and 0,13% of depository commission, so the TER is 2,33%. On the other hand, the cartera class has a 0,60% of management fees and 0,02% of depositary commission, so the TER is 0,62%. To continue, the plus class, has a 1,5% of management fees and 0,13% of depository commission, so the TER is 1,63%. Finally, the premium class, has a 1,10% of management fees and 0,10% of depository commission, so the TER is 1,20%.
ix. Credit Suisse Bolsa B
This investment fund is provided by the bank Credit Suisse, with headquarters is in the city of Zurich, Switzerland. It offers services to private clients, as well as to small and medium companies. In the areas of investment banking, as well as financial intermediary, it is at the service of global institutions and companies, government agencies and the private clientele. The investment fund was created the 12 of December 1997 and the manager is Javier Alonso. Taking into account that is an active management, the investment fund is trying to beat a market. The management takes as reference the profitability of the IBEX35 index, being able to overcome the general limits of diversification. Find a minimum correlation of 75% with the IBEX 35. You can raise the limit of 20% exposure to a single issuer up to 35% if you weight in the Index more than 20%. Inside this investment fund, there are two classes depending on the minimum investment and the wealth of the fund. On the one hand, we can find class A which has a minimum investment of 300.000€ and a wealth of 22,19M€. On the other hand, we have the class B which has a minimum investment of 1€ and a wealth of 15,61M€.

Clara Mir Areizaga
37
With regards to the risk that investors have to assume, the risk of this investment fund is 6 out of 7. Moreover, the investor will have to pay high commissions since the manager is making an extra effort to overcome and beat the market. However, since there are two different classes depending on the minimum investment, the fees will vary. On the one hand, the class A, has a 0,75% of management fees, so the TER is 0,85%. On the other hand, the class B has a 1,75% of management fees and 0,1% of depositary commission, so the TER is 1,85%. As a summary, in the next table we can see all the fees of each passive investment fund that I am going to use. Table 2: Active investment funds commissions
INVESTMENT FUND MANAGEMENT FEES DEPOSITORY COMMISION
TER
Santander Acciones Españolas 2,15%-1,8%-1,45%1,8%-0,4%
0,15%-0,15%-0,15%-0,15%-0,2%
2,3%-1,95%-1,6%-1,95%-0,42
Catalana Occidente Bolsa Española 2,25% 0,08% 2,33%
Bankoa Bolsa de Credit Agricole Bankoa 2,25% 0,10% 2,35%
BankiaBanca Privada Renta Variable España 2%-0,80% 0,15% 2,15%-0,95% Unifond Renta Variable España de Unigest 1,75%-0,65% 0,13% 1,88%-0,72%
Ibercaja Bolsa 1,5%-0,74% 0,20% 1,70%-0,94% Rural Renta Variable España 2,25%-0,45% 0,15% 2,40%-0,60%
Caixabank Bolsa Gestion España 2,20%-1,5%-0,6%-1,1%
0,13%-0,13%-0,02%-0,10%
2,33%-1,63%-0,62%-1,20%
Credit Suisse Bolsa B 0,75%-1,75% 0,10% 0,85%-1,85% 10
10 Source: Finect (Own elaboration)
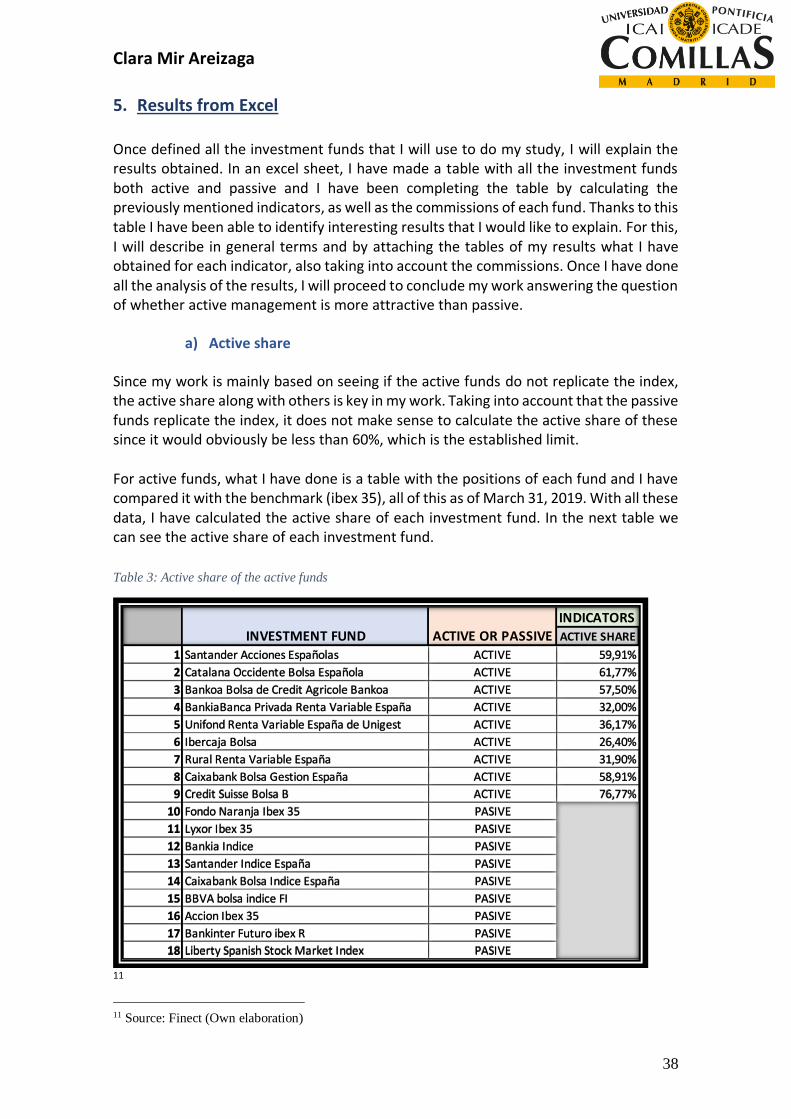
Clara Mir Areizaga
38
5. Results from Excel Once defined all the investment funds that I will use to do my study, I will explain the results obtained. In an excel sheet, I have made a table with all the investment funds both active and passive and I have been completing the table by calculating the previously mentioned indicators, as well as the commissions of each fund. Thanks to this table I have been able to identify interesting results that I would like to explain. For this, I will describe in general terms and by attaching the tables of my results what I have obtained for each indicator, also taking into account the commissions. Once I have done all the analysis of the results, I will proceed to conclude my work answering the question of whether active management is more attractive than passive.
a) Active share
Since my work is mainly based on seeing if the active funds do not replicate the index, the active share along with others is key in my work. Taking into account that the passive funds replicate the index, it does not make sense to calculate the active share of these since it would obviously be less than 60%, which is the established limit. For active funds, what I have done is a table with the positions of each fund and I have compared it with the benchmark (ibex 35), all of this as of March 31, 2019. With all these data, I have calculated the active share of each investment fund. In the next table we can see the active share of each investment fund.
Table 3: Active share of the active funds
11
11 Source: Finect (Own elaboration)
INDICATORS
ACTIVE SHARE
1 Santander Acciones Españolas ACTIVE 59,91%
2 Catalana Occidente Bolsa Española ACTIVE 61,77%
3 Bankoa Bolsa de Credit Agricole Bankoa ACTIVE 57,50%
4 BankiaBanca Privada Renta Variable España ACTIVE 32,00%
5 Unifond Renta Variable España de Unigest ACTIVE 36,17%
6 Ibercaja Bolsa ACTIVE 26,40%
7 Rural Renta Variable España ACTIVE 31,90%
8 Caixabank Bolsa Gestion España ACTIVE 58,91%
9 Credit Suisse Bolsa B ACTIVE 76,77%
10 Fondo Naranja Ibex 35 PASIVE
11 Lyxor Ibex 35 PASIVE
12 Bankia Indice PASIVE
13 Santander Indice España PASIVE
14 Caixabank Bolsa Indice España PASIVE
15 BBVA bolsa indice FI PASIVE
16 Accion Ibex 35 PASIVE
17 Bankinter Futuro ibex R PASIVE
18 Liberty Spanish Stock Market Index PASIVE
INVESTMENT FUND ACTIVE OR PASSIVE
Clara Mir Areizaga
39
As we have previously mentioned, it is considered that an active share below 60% is a management too close to the benchmark, while management over 60% is a portfolio different from the benchmark. The higher the active share, the more different the portfolio will be from the benchmark and the more active the fund will be. As a result, from the active investment funds, although they are theoretically aiming to beat the benchmark and not replicating the benchmark, we can see that of the 9 selected investment funds only two are above 60%. Therefore, only Credit Suisse and Catalana Occidente have a different portfolio than the benchmark and it is worth to pay high fees because they are doing an extra effort. However, the rest of the investment funds are charging high fees for being active investment funds and as we can see they ended up kind of replicating the benchmark. In the excel attached in the annexes, we can see each active investment fund in which positions they have replicated the benchmark and in what percentage. The companies highlighted in yellow are those that belong to the benchmark also and under each fund the active share is calculated.
b) Tracking Error
Another way to measure the management of a fund is through the tracking error. As I highlight previously, a high tracking error shows that in order to achieve the return of the fund, it has assumed greater risk than the benchmark. As a result, the higher the tracking error, the lower the possibility that the fund has replicated the benchmark and vice versa. It is said that a tracking error between 0% and 2% is passive management, a tracking error between 2% and 5% is a management with some kind of risk but controlled and a tracking error over 5% is active management. After calculating the tracking error with the formula, we can see in the following table that none of the active investment funds has a tracking error over 5%, which is the limit set for active investment fund. However, I will also want to highlight that none of them is under 2%, which means that they aren´t passive investment funds neither. As a result, those investment funds are assuming some kind of risk but controlled.

Clara Mir Areizaga
40
Table 4: Tracking error of the investment funds
12
Consequently, the active investment funds that I have selected are assuming some kind of risk, but the risk is controlled and not too high. Since they are assuming some kind of risk, they are not replicating the benchmark, like in the passive fund, but they are not assuming a very high risk, like in the active fund, because the tracking error isn´t above 5%. So, the investment funds selected might have in its portfolio some companies that are part of the ibex 35, in order to avoid assuming a higher risk.
c) R2
Continuing with the indicators that can help me to answer to the question of this paper, we have the R2. The R2 is the percentage of a fund movements that can be explained by movement in a benchmark index. So, it is used in order to determine an investment correlation with the benchmark. It is stablished that an R2 between 85% and 100%, the fund moves in the same way than the benchmark. The fund with a R2 lower than 70%, are considered that they are not doing the same movements as the index. If we look in the following table, we have the R2 of the investment funds selected. As we can see, the passive investment funds selected have a R2 over 85%, due to the fact that they are replicating the benchmark, so they are going to have a high correlation with the benchmark because the fund movements are explained by the benchmark movements. The active investment funds since they are not replicating the benchmark, should have a R2 lower than 70%. However, in the active investment funds selected, none of them have a R2 lower than 70%. As a result, even if those investment funds sell their funds
12 Source: Finect (Own elaboration)
INDICATORS
TRACKING ERROR
1 Santander Acciones Españolas ACTIVE 2,9
2 Catalana Occidente Bolsa Española ACTIVE 2,54
3 Bankoa Bolsa de Credit Agricole Bankoa ACTIVE 3,37
4 BankiaBanca Privada Renta Variable España ACTIVE 2,74
5 Unifond Renta Variable España de Unigest ACTIVE 2,73
6 Ibercaja Bolsa ACTIVE 3,27
7 Rural Renta Variable España ACTIVE 3,66
8 Caixabank Bolsa Gestion España ACTIVE 4,35
9 Credit Suisse Bolsa B ACTIVE 3,63
10 Fondo Naranja Ibex 35 PASIVE 3,3
11 Lyxor Ibex 35 PASIVE 3,41
12 Bankia Indice PASIVE 3,37
13 Santander Indice España PASIVE 3,14
14 Caixabank Bolsa Indice España PASIVE 3,36
15 BBVA bolsa indice FI PASIVE 3,26
16 Accion Ibex 35 PASIVE 3,08
17 Bankinter Futuro ibex R PASIVE 3,25
18 Liberty Spanish Stock Market Index PASIVE 3,49
INVESTMENT FUND ACTIVE OR PASSIVE

Clara Mir Areizaga
41
as if they were not replicating the market, they actually are replicating in some way the market because the fund moves in the same way than the benchmark, so the investment funds are correlated with the benchmark. Table 5: R2 of the investment funds
13
d) Alpha
With this indicator we are going to focus on the return of the active investment funds. The investment alpha is the return that a fund has reached which is over the return of the benchmark. The alpha can be negative or positive percentage, depending if the fund has underperformed or outperformed the benchmark. If we look in to the table attached, we can see that the majority of the passive investment funds selected are close to 0, while the active investment funds selected are not that close to 0. This is because since in the active portfolio management, the manager doesn´t reply the market, the alpha should be different from 0 because an alpha of zero will mean that the fund is replicating the market. As a result, I would like to highlight that the active investment funds selected have an alpha different from zero but some of them are still close to zero. Even if the passive funds alpha is closer to zero than the one of the active, the active funds alpha is still near to zero. So, unlike the Santander acciones Españolas fund and Catalana Occidente bolsa Española, the rest of the active funds haven´t exactly replicate the market but their return is not that far from the benchmark. Moreover, we can see that unlike Santander
13 Source: Finect (Own elaboration)
INDICATORS
R2
1 Santander Acciones Españolas ACTIVE 94
2 Catalana Occidente Bolsa Española ACTIVE 95,03
3 Bankoa Bolsa de Credit Agricole Bankoa ACTIVE 91,2
4 BankiaBanca Privada Renta Variable España ACTIVE 94,65
5 Unifond Renta Variable España de Unigest ACTIVE 96,1
6 Ibercaja Bolsa ACTIVE 92,17
7 Rural Renta Variable España ACTIVE 94,52
8 Caixabank Bolsa Gestion España ACTIVE 92,88
9 Credit Suisse Bolsa B ACTIVE 91,35
10 Fondo Naranja Ibex 35 PASIVE 93,76
11 Lyxor Ibex 35 PASIVE 93,34
12 Bankia Indice PASIVE 93,59
13 Santander Indice España PASIVE 94,3
14 Caixabank Bolsa Indice España PASIVE 93,56
15 BBVA bolsa indice FI PASIVE 93,6
16 Accion Ibex 35 PASIVE 93,49
17 Bankinter Futuro ibex R PASIVE 93,82
18 Liberty Spanish Stock Market Index PASIVE 92,78
INVESTMENT FUND ACTIVE OR PASSIVE

Clara Mir Areizaga
42
acciones Españolas and Catalana Occidente bolsa Española, the rest of the active funds have underperformed the benchmark. Consequently, those funds are charging high commissions to their clients in order to achieve a greater return than the benchmark and they end up replicating some positions of the benchmark and the rest of the positions have underperformed the benchmark. As a result, those client’s portfolio has suffered a net loss. Even if, in the case of Santander acciones Españolas they have achieved to obtain an alpha different from zero, the fees are too expensive for the alpha they have manage to generate. Table 6:Alpha of the investment funds
14
e) Beta
Thanks to this indicator, we can measure the volatility of the portfolio of a fund comparing to the market. If a stock has a beta of 1, that means he is highlight correlated with the benchmark. A correlation of 0, will mean that the stock in not correlated with the benchmark. And a beta of -1 means that the stock in inversely corelated with the benchmark. If the correlation is above 1, it also means that is more volatile than the market, so riskier. Since the passive funds are replicating the market, they have a beta very close to 1 because they are highlight correlated to the benchmark. However, in the case of the active funds they should have a beta which is not close to 1, since they are not supposed to be replicating the market. If we focus on the active funds that I have selected, we can see that either above or below, but they are closer to 1 than to 0. As a result, some more than others but all of
14 Source: Finect (Own elaboration)
INDICATORS
ALPHA
1 Santander Acciones Españolas ACTIVE 0,48
2 Catalana Occidente Bolsa Española ACTIVE 1,06
3 Bankoa Bolsa de Credit Agricole Bankoa ACTIVE -1,87
4 BankiaBanca Privada Renta Variable España ACTIVE -1,34
5 Unifond Renta Variable España de Unigest ACTIVE -1,82
6 Ibercaja Bolsa ACTIVE -2,02
7 Rural Renta Variable España ACTIVE -2,96
8 Caixabank Bolsa Gestion España ACTIVE -1,62
9 Credit Suisse Bolsa B ACTIVE -1,89
10 Fondo Naranja Ibex 35 PASIVE -0,37
11 Lyxor Ibex 35 PASIVE -2,95
12 Bankia Indice PASIVE -0,16
13 Santander Indice España PASIVE 0,7
14 Caixabank Bolsa Indice España PASIVE 0,89
15 BBVA bolsa indice FI PASIVE -0,45
16 Accion Ibex 35 PASIVE -2,92
17 Bankinter Futuro ibex R PASIVE -0,13
18 Liberty Spanish Stock Market Index PASIVE -4,06
INVESTMENT FUND ACTIVE OR PASSIVE
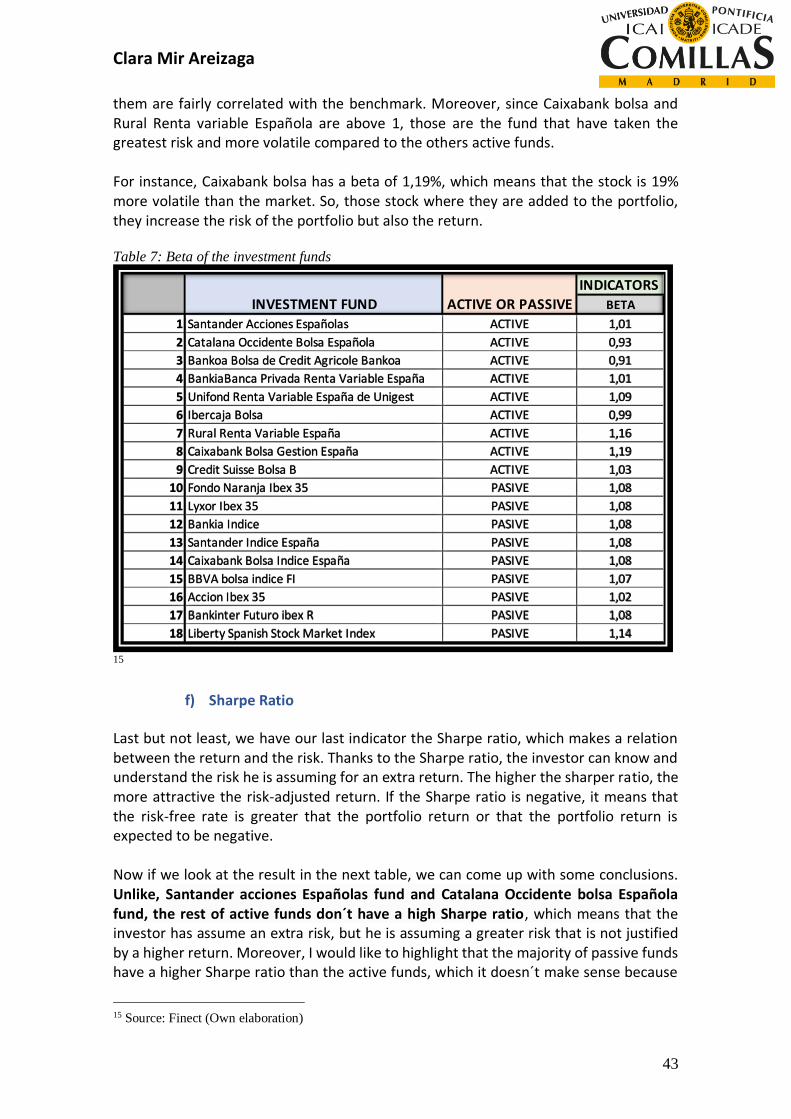
Clara Mir Areizaga
43
them are fairly correlated with the benchmark. Moreover, since Caixabank bolsa and Rural Renta variable Española are above 1, those are the fund that have taken the greatest risk and more volatile compared to the others active funds. For instance, Caixabank bolsa has a beta of 1,19%, which means that the stock is 19% more volatile than the market. So, those stock where they are added to the portfolio, they increase the risk of the portfolio but also the return.
Table 7: Beta of the investment funds
15
f) Sharpe Ratio
Last but not least, we have our last indicator the Sharpe ratio, which makes a relation between the return and the risk. Thanks to the Sharpe ratio, the investor can know and understand the risk he is assuming for an extra return. The higher the sharper ratio, the more attractive the risk-adjusted return. If the Sharpe ratio is negative, it means that the risk-free rate is greater that the portfolio return or that the portfolio return is expected to be negative. Now if we look at the result in the next table, we can come up with some conclusions. Unlike, Santander acciones Españolas fund and Catalana Occidente bolsa Española fund, the rest of active funds don´t have a high Sharpe ratio, which means that the investor has assume an extra risk, but he is assuming a greater risk that is not justified by a higher return. Moreover, I would like to highlight that the majority of passive funds have a higher Sharpe ratio than the active funds, which it doesn´t make sense because
15 Source: Finect (Own elaboration)
INDICATORS
BETA
1 Santander Acciones Españolas ACTIVE 1,01
2 Catalana Occidente Bolsa Española ACTIVE 0,93
3 Bankoa Bolsa de Credit Agricole Bankoa ACTIVE 0,91
4 BankiaBanca Privada Renta Variable España ACTIVE 1,01
5 Unifond Renta Variable España de Unigest ACTIVE 1,09
6 Ibercaja Bolsa ACTIVE 0,99
7 Rural Renta Variable España ACTIVE 1,16
8 Caixabank Bolsa Gestion España ACTIVE 1,19
9 Credit Suisse Bolsa B ACTIVE 1,03
10 Fondo Naranja Ibex 35 PASIVE 1,08
11 Lyxor Ibex 35 PASIVE 1,08
12 Bankia Indice PASIVE 1,08
13 Santander Indice España PASIVE 1,08
14 Caixabank Bolsa Indice España PASIVE 1,08
15 BBVA bolsa indice FI PASIVE 1,07
16 Accion Ibex 35 PASIVE 1,02
17 Bankinter Futuro ibex R PASIVE 1,08
18 Liberty Spanish Stock Market Index PASIVE 1,14
INVESTMENT FUND ACTIVE OR PASSIVE

Clara Mir Areizaga
44
the active funds are supposed to be assuming a higher risk and have higher returns, for the extra efforts they are supposed to be doing. Table 8: Sharpe ratio of the investment funds
16
16 Source: Finect (Own elaboration)
INDICATORS
SHARPE RATIO
1 Santander Acciones Españolas ACTIVE 0,53
2 Catalana Occidente Bolsa Española ACTIVE 0,59
3 Bankoa Bolsa de Credit Agricole Bankoa ACTIVE 0,3
4 BankiaBanca Privada Renta Variable España ACTIVE 0,37
5 Unifond Renta Variable España de Unigest ACTIVE 0,34
6 Ibercaja Bolsa ACTIVE 0,3
7 Rural Renta Variable España ACTIVE 0,26
8 Caixabank Bolsa Gestion España ACTIVE 0,36
9 Credit Suisse Bolsa B ACTIVE 0,32
10 Fondo Naranja Ibex 35 PASIVE 0,45
11 Lyxor Ibex 35 PASIVE 0,24
12 Bankia Indice PASIVE 0,47
13 Santander Indice España PASIVE 0,54
14 Caixabank Bolsa Indice España PASIVE 0,56
15 BBVA bolsa indice FI PASIVE 0,45
16 Accion Ibex 35 PASIVE 0,23
17 Bankinter Futuro ibex R PASIVE 0,47
18 Liberty Spanish Stock Market Index PASIVE 0,16
INVESTMENT FUND ACTIVE OR PASSIVE

Clara Mir Areizaga
45
6. Conclusions Once I have done the observations to the analysis that I have done in excel, I wanted to conclude the work focusing on the most important indicators and relating them to the commissions that they charge to their clients. As I have previously mentioned, even if tracking error, R2 and active share are the main indicators in order to measure the level of active risk in a portfolio, since active share can be distorted due to the futures included in a portfolio, I am going to give a greater importance to tracking error and R2 indicators. With regards to the tracking error and R2, I have realized that the active investment funds that I have selected are assuming some kind of risk, but the risk is controlled and not too high, because the tracking error isn´t above 5%. So, the investment funds selected might have in its portfolio some companies that are part of the ibex 35, in order to avoid assuming a higher risk. On the other hand, in the active investment funds selected, none of them have a R2 lower than 70%. As a result, even if those investment funds sell their funds as if they were not replicating the market, they actually are replicating in some way the market because the fund moves in the same way than the benchmark, so the investment funds are correlated with the benchmark. Consequently, I would like to emphasize that of the 9 active funds that I have selected, all replicate the benchmark to some extent, since they are correlated with the benchmark and assume controlled risks. Therefore, these funds are charging high commissions because they say they have to make a greater effort not to replicate the market and achieve higher returns, but then the reality is different. Finally, the clients of these funds have paid high commissions, so that the managers copy the benchmark in some positions. In addition, if in the positions where they have invested differently from the benchmark, they had generated high returns it could compensate the clients to invest in those funds, but as we see with the results of the alpha, those funds have also underperformed the benchmark. As a result, those client’s portfolios have suffered a net loss. In the following table we can see the differences in terms of commissions between the active and passive funds, as we can see the commissions of the active funds are higher than those of the passive funds. 17
17 Source: Finect (Own elaboration)
Table 9: Commissions of the investment funds

Clara Mir Areizaga
46
Finally, after the analysis and the conclusions reached, I think we should study the active fund before investing in it and ask ourselves if it is really worth the difference in terms of commissions we are paying for a passive fund. If after having studied the fund and seen its past history, we see that it is a fund that does not replicate the index and that also achieves higher returns than the benchmark, I think it would be a good idea to invest in it. However, if on the contrary it is a fund that charges high commissions and finally ends up replicating the index in a certain way and does not surpass the benchmark profitability, I think we should continue looking for other active funds that really make an extra effort. If we only take into account my analysis, I would say that active funds are not more attractive than passive funds, because from a sample of 9 active funds, at least 7 have shown to be replicating the benchmark in some way. I do not want to end this work without mentioning a fact that has called my attention and that could be the object of study for a future work. While looking at the portfolio positions of the passive funds, I have noticed that these do not exactly replicate the index, since each one invested a different percentage in each stock. It is true that the difference was minimal but there was some difference. Moreover, if we look at the tracking error, we see that neither one has a tracking error below 2%, which is the limit established for passive funds. As a result, I find interesting to continue with this analysis by focusing next time on the passive funds.
Clara Mir Areizaga
47
7. References • Overview of the problem
EL ECONOMISTA (2/11/2018). Available: https://www.eleconomista.es/mercados-
cotizaciones/noticias/9493047/11/18/El-56-de-los-fondos-de-bolsa-espanola-no-activos-
cobra-como-si-lo-fuera.html [accessed: February 15, 2019]
EL CONFIDENCIAL (13/03/2018) Available:
https://www.elconfidencial.com/mercados/2018-03-13/falsos-fondos-activos-bolsa-
espanola-fca-cnmv_1531661/ [accessed: February 29, 2019]
• Basic concepts
INVESTOPEDIA (7/05/2019) Available:
https://www.investopedia.com/terms/i/investment-fund.asp [accessed: May 20, 2019]
SANTANDER. Available: https://santandertfi.pl/en/faq/what-are-investment-
funds.html [accessed: March 10, 2019]
WHAT INVESTMENT (23/04/2013) Available:
https://www.whatinvestment.co.uk/what-is-an-investment-fund-2347543/ [accessed:
March 10, 2019]
BBVA. Available: https://www.bbva.es/eng/general/finanzas-vistazo/fondos-
inversion/tipos-de-fondos-de-inversion/index.jsp [accessed: March 10, 2019]
GET SMART ABOUT MONEY. Available:
https://www.getsmarteraboutmoney.ca/invest/investment-products/mutual-funds-
segregated-funds/7-common-types-of-mutual-funds/ [accessed: March 10, 2019]
INVESTOPEDIA (9/06/2019) Available:
https://www.investopedia.com/terms/m/mutualfund.asp [accessed: June 10, 2019]
INVESTOPEDIA (8/06/2019) Available:
https://www.investopedia.com/articles/basics/11/3-s-simple-investing.asp [accessed:
June 10, 2019]
FINRA Available: https://mandiri-investasi.co.id/en/investment-learning/information-
centre/types-of-mutual-funds/ [accessed: March 15, 2019]
MONEY CRASHERS. Available: https://www.moneycrashers.com/types-investment-
funds-companies/ [accessed: March 25, 2019]
RATHBONE. Available:
https://www.rathbones.com/sites/default/files/literature/pdfs/rathbones_active_vs_passi
ve_investing_james_pettit_investment_report_full_website.pdf [accessed: March 25,
2019]

Clara Mir Areizaga
48
INVESTOPEDIA (24/04/2019) Available:
https://www.investopedia.com/ask/answers/040315/what-difference-between-passive-
and-active-portfolio-management.asp [accessed: April 26, 2019]
INVESTOPEDIA (15/04/2019) Available: https://www.investopedia.com/news/active-
vs-passive-investing/ [accessed: April 26, 2019]
CNCB (12/12/2016) Available: https://www.cnbc.com/2016/12/12/weighing-the-pros-
and-cons-of-active-portfolio-management.html [accessed: April 28, 2019]
QUORA (30/12/2016) Available: https://www.quora.com/What-are-the-advantages-
and-disadvantages-of-active-fund-management-and-passive-fund-management
[accessed: April 28, 2019]
• Indicators
INVESTOPEDIA (19/05/2019) Available:
https://www.investopedia.com/terms/b/beta.asp [accessed: May 28, 2019]
INVESTOPEDIA (17/05/2019) Available:
https://www.investopedia.com/terms/s/sharperatio.asp [accessed: May 28, 2019]
INVESTOPEDIA (8/05/2019) Available: https://www.investopedia.com/terms/r/r-
squared.asp [accessed: May 20, 2019]
INVESTOPEDIA (21/02/2019) Available:
https://www.investopedia.com/terms/t/trackingerror.asp [accessed: May 5, 2019]
INVESTOPEDIA (3/05/2019) Available:
https://www.investopedia.com/terms/a/alpha.asp [accessed: May 10, 2019]
INVESTOPEDIA (19/03/2019) Available:
https://www.investopedia.com/articles/mutualfund/07/active-share.asp [accessed: May
28, 2019]
MORNINGSTAR (24/02/2015) Available:
http://www.morningstar.es/es/news/134822/¿qué-es-y-cómo-se-calcula-el-active-
share.aspx [accessed: May 28, 2019]
• Selection of investment funds
FINECT (13/06/2019) Available: https://www.finect.com/fondos-
inversion/ES0138823036-Santander_acciones_espanolas_a_fi [accessed: June 08, 2019]
FINECT (14/06/2019) Available: https://www.finect.com/fondos-
inversion/ES0116901036-Catalana_occidente_bolsa_espanola_fi [accessed: June 08,
2019]

Clara Mir Areizaga
49
FINECT (14/06/2019) Available: https://www.finect.com/fondos-
inversion/ES0108846033-Bankia_banca_privada_rv_espana_univ_fi [accessed: June
08, 2019]
FINECT (14/06/2019) Available: https://www.finect.com/fondos-
inversion/ES0138628039-Unifond_renta_variable_espana_a_fi [accessed: June 08,
2019]
FINECT (14/06/2019) Available: https://www.finect.com/fondos-
inversion/ES0147186003-Ibercaja_bolsa_b_fi [accessed: June 10, 2019]
FINECT (14/06/2019) Available: https://www.finect.com/fondos-
inversion/ES0175734039-Rural_renta_variable_espana_estandar_fi [accessed: June 10,
2019]
FINECT (14/06/2019) Available: https://www.finect.com/fondos-
inversion/ES0105182036-Caixabank_bolsa_gestion_espana_estand_fi [accessed: June
10, 2019]
FINECT (14/06/2019) Available: https://www.finect.com/fondos-
inversion/ES0113286035-Credit_suisse_bolsa_b_fi [accessed: June 10, 2019]
FINECT (14/06/2019) Available: https://www.finect.com/fondos-
inversion/ES0152741031-Ing_direct_fn_ibex_35_fi [accessed: June 10, 2019]
FINECT (14/06/2019) Available: https://www.finect.com/fondos-
inversion/FR0010251744-Lyxor_ibex_35_dr_etf_dist_ai [accessed: June 10, 2019]
FINECT (14/06/2019) Available: https://www.finect.com/fondos-
inversion/ES0158967036-Bankia_indice_ibex_universal_fi [accessed: June 10, 2019]
FINECT (14/06/2019) Available: https://www.finect.com/fondos-
inversion/ES0119203018-Santander_indice_espana_b_fi [accessed: June 10, 2019]
FINECT (14/06/2019) Available: https://www.finect.com/fondos-
inversion/ES0138392032-Caixabank_bolsa_indice_esp_estand_fi [accessed: June 10,
2019]
FINECT (14/06/2019) Available: https://www.finect.com/fondos-
inversion/ES0114794037-Bankinter_futuro_ibex_r_fi [accessed: June 10, 2019]
FINECT (14/06/2019) Available: https://www.finect.com/fondos-
inversion/ES0137999035-Liberty_spanish_stock_market_index_fi [accessed: June 10,
2019]
• PAPERS
http://uvadoc.uva.es/bitstream/handle/10324/27351/TFM-E-
72.pdf;jsessionid=1A2A7978C9557F9B61884D2C67E867EC?sequence=1

Clara Mir Areizaga
50
https://www.uv.es/bfc/TFM2016/Josu%20Iturrizaga%20TFM.pdf
http://www.ci.com/orderform/pdf/general_marketing/how_investors_benefit_active_ma
nagement_e.pdf

Clara Mir Areizaga
52
8. References 18
18(17-18-19-20) Source: Finect (Own elaboration)
INVESTMENT FUND %
1 Telefonica 9,84%
2 Endesa 9,29%
3 Banco Santander 8,51%
4 Inditex 8,39%
5 Repsol 6,44%
6 Banco Sabadell 5,46%
7 ACS 5,29%
8 Grifols 5,04%
9 Bankia 3,69%
10 NOS SGPS 2,91%
11 CIA 2,61%
12 Grupo catalana occidente 2,42%
13 Unicaja 2,36%
14 Corp financiera 2,20%
15 EDP 2,17%
16 Gestamp 2,09%
17 Global dominion 1,66%
18 Arcelormittal 1,59%
19 Melia hotel 1,50%
20 Caixabank 1,43%
21 Acerinox 1,26%
22 SEMAPA 1,10%
23 Coca-cola 1,07%
24 Parques reunidos 1,02%
25 CIE 0,80%
26 BBVA 0,65%
27 Miquel y Costas 0,64%
28 Obras con huarte 0,37%
29 Gamesa 0,31%
30 Repsol 0,18%
92,29%
Telefonica 8,33%
Endesa 1,86%
Banco Santander 8,51%
Inditex 8,39%
Repsol 4,70%
Banco Sabadell 1,23%
ACS 2,33%
Grifols 0,12%
Bankia 1,04%
Arcelormittal 0,09%
Melia hotel 0,33%
Caixabank 1,43%
Acerinox 0,42%
CIE 0,48%
BBVA 0,65%
Repsol 0,18%
Total % in common 40,09%
Active share 59,91%
SANTANDER ACCIONES ESPAÑOLAS
INVESTMENT FUND %
1 Acciona 0,74%
2 Acerinox 0,42%
3 ACS 2,33%
4 AENA 2,67%
5 Amadeus 5,84%
6 Arcelor Mittal 0,09%
7 Banco sabadell 1,23%
8 Bankia 1,04%
9 Bankinter 1,38%
10 BBVA 6,76%
11 Caixabank 4,14%
12 Cellnex 1,13%
13 CIE automotive 0,48%
14 Enagas 1,23%
15 Ence 0,30%
16 Endesa 1,86%
17 Ferrovial 2,86%
18 Grifols 0,12%
19 IAG 1,87%
20 Iberdrola 9,82%
21 Inditex 9,14%
22 INDRA 0,32%
23 Inm colonial 0,72%
24 Mapfre 0,94%
25 Mediaset 0,31%
26 Melia Hotels 0,33%
27 Merlin prop 1,11%
28 Naturgy 2,86%
29 REC 2,68%
30 Repsol 4,70%
31 Banco Santander 14,02%
32 SIEMENS 0,89%
33 TEC REUNIDAS 0,26%
34 TELEFONICA 8,33%
35 VISCOFAN 0,49%
93,41%
BENCHMARK IBEX35
Table 11: Estructure Ibex35
Table 12: Estructure Santander Fund Table 10: Estructure Catalana occ. fund
INVESTMENT FUND %
1 BBVA 7,55%
2 AENA 5,47%
3 BNP 5,17%
4 Bankia 4,69%
5 Iberdrola 4,60%
6 CIA 4,57%
7 Acerinox 3,97%
8 Telefonica 3,36%
9 Ferrovial 3,32%
10 Ebro foods 3,12%
11 FCC 2,86%
12 Grifols 2,80%
13 Mapfre 2,48%
14 Banco Santander 2,43%
15 Caixabank 2,42%
16 Naturgy 2,04%
17 Inditex 1,91%
18 Catalana occidente 1,77%
19 Cellnex 1,71%
20 Amadeus 1,67%
21 Enagas 1,44%
22 Elecnor 1,29%
23 Melia hotel 1,25%
24 Prosegur 1,23%
25 Cementos molins 1,19%
26 Applus services 0,89%
27 Redesa 0,86%
28 Miquel y costas 0,83%
29 Bolsa y MDO Español 0,74%
30 Endesa 0,74%
31 Euskaltel 0,73%
32 Alba 0,66%
33 Global Dominion 0,59%
34 Prosegur 0,59%
35 Repsol 0,58%
36 Zardoya OTIS 0,57%
37 Ence energia 0,39%
38 Banco Sabadell 0,36%
39 Gestamp 0,30%
40 Indra 0,30%
41 Naturhouse 0,29%
42 Edreams 0,25%
43 LAR 0,08%
44 Repsol 0,02%
84,08%
CATALANA OCCIDENTE BOLSA ESPAÑOLA BBVA 6,76%
AENA 2,67%
Bankia 1,04%
Iberdrola 4,60%
Acerinox 0,42%
Telefonica 3,36%
Ferrovial 2,86%
Grifols 0,12%
Mapfre 0,94%
Banco Santander 2,43%
Caixabank 2,42%
Naturgy 2,04%
Inditex 1,91%
Cellnex 1,13%
Amadeus 1,67%
Enagas 1,23%
Melia hotel 0,33%
Endesa 0,74%
Repsol 0,58%
Ence energia 0,30%
Banco Sabadell 0,36%
Indra 0,30%
Repsol 0,02%
Total % in common 38,23%
Active share 61,77%

Clara Mir Areizaga
53
Table 14: Estructure Bankoa fund
19
19 (21-22-23) Source: Finect (Own elaboration)
Banco Santander 8,81%
Iberdrola 7,43%
Telefonica 7,39%
Grupo Inditex 7,00%
BBVA 5,44%
Repsol 4,66%
Caixabank 3,79%
Amadeus 3,32%
ferrovial 2,86%
AENA 2,67%
ACS 2,33%
Grifols 0,12%
Endesa 1,86%
Bankinter 1,38%
Bankia 1,04%
Merlin prop 1,11%
Banco Sabadell 1,18%
Tecnicas Reunidas 0,26%
Enagas 1,05%
Cellnex 0,92%
Mapfre 0,86%
Acerinox 0,42%
Viscofan 0,45%
Grupo acciona 0,44%
CIE 0,39%
Melia hotel 0,33%
Mediaset 0,25%
Repsol 0,13%
Indra 0,11%
Total % in common 68,00%
Active share 32,00%
INVESTMENT FUND %
1 Lyxor 8,82%
2 Banco Santander 8,81%
3 Iberdrola 7,43%
4 Telefonica 7,39%
5 Grupo Inditex 7,00%
6 BBVA 5,44%
7 Repsol 4,66%
8 Caixabank 3,79%
9 Amadeus 3,32%
10 ferrovial 2,97%
11 AENA 2,78%
12 Redesa 2,40%
13 ACS 2,40%
14 Grifols 2,09%
15 Endesa 2,00%
16 Gas Natural 1,80%
17 Airlines 1,45%
18 Bankinter 1,44%
19 Bankia 1,34%
20 Merlin prop 1,23%
21 Banco Sabadell 1,18%
22 Tecnicas Reunidas 1,16%
23 Enagas 1,05%
24 Gamesa 1,03%
25 Cellnex 0,92%
26 Mapfre 0,86%
27 Acerinox 0,46%
28 Viscofan 0,45%
29 Grupo acciona 0,44%
30 CIE 0,39%
31 Melia hotel 0,34%
32 Mediaset 0,25%
33 Repsol 0,13%
34 Indra 0,11%
87,33%
BankiaBanca Privada Renta Variable España
Table 13: Estructure Bankia fund
INVESTMENT FUND %
1 Inditex 8,88%
2 Telefonica 8,01%
3 Red electrica 6,41%
4 Iberdrola 5,93%
5 SCH 5,81%
6 Naturgy 5,80%
7 Euskaltel 4,96%
8 Mapfre 4,66%
9 Repsol 4,37%
10 Lyxor 4,19%
11 UBS 4,18%
12 BBVA 4,15%
13 BME 2,58%
14 Amadeus 2,22%
15 Interna 2,09%
16 Merlin prop 1,97%
17 Sol Melia 1,84%
18 Ferrovial 1,62%
19 GRLS 1,59%
20 Criteria Caixa 1,45%
21 Acerinox 0,95%
22 Zardoya OTIS 0,94%
23 ISHARES EURO 0,86%
24 Mediaset 0,80%
25 Bankinter 0,77%
26 Indra 0,60%
27 Constr y aux 0,33%
28 Tecnicas Reunidas 0,29%
29 DIA 0,15%
30 Vallehermoso 0,10%
88,50%
Inditex 8,88%
Telefonica 8,01%
Iberdrola 5,93%
Naturgy 2,86%
Mapfre 0,94%
Repsol 4,37%
BBVA 4,15%
Amadeus 2,22%
Merlin prop 1,11%
Sol Melia 0,33%
Ferrovial 1,62%
Acerinox 0,42%
Mediaset 0,31%
Bankinter 0,77%
Indra 0,32%
Tecnicas Reunidas 0,26%
Total % in common 42,50%
Active share 57,50%
BANKOA BOLSA DE CREDIT AGRICOLE

Clara Mir Areizaga
54
20
20 (24-25-26) Source: Finect (Own elaboration)
INVESTMENT FUND %
1 Banco Santander 9,09%
2 Grupo Inditex 8,16%
3 Iberdrola 7,25%
4 Telefonica 5,36%
5 Repsol 5,35%
6 Caixabank 4,43%
7 Amadeus 4,21%
8 BBVA 4,05%
9 INT CONSOLIDATED 3,75%
10 EMPR.NAL 3,28%
11 Ferrovial 3,07%
12 ACS 2,82%
13 AENA 2,66%
14 Bankinter 1,98%
15 Gas Natural 1,96%
16 Abertis 1,83%
17 Grifols 1,55%
18 Sol melia 1,54%
19 Mapfre 1,46%
20 Gamesa 1,37%
21 ARCELOR 1,34%
22 Banco Sabadell 1,23%
23 ACERINOX 1,22%
24 CONST Y AUX 1,18%
25 Red electrica 1,17%
26 Liberbank 1,09%
27 Masmovil 1,01%
28 Bankia 0,91%
29 Applus services 0,85%
30 Acciona 0,70%
31 Gestamp 0,69%
32 Inm colonial 0,62%
33 Merlin prop 0,62%
34 Distrib int logista 0,57%
35 Viscofan 0,54%
36 Puleva 0,52%
37 Enagas 0,50%
38 Bolsa y mercados 0,46%
39 CIE 0,41%
40 Global dominion 0,36%
41 Indra 0,26%
91,42%
Unifond Renta Variable España de UnigestBanco Santander 9,09%
Grupo Inditex 8,16%
Iberdrola 7,25%
Telefonica 5,36%
Repsol 4,70%
Caixabank 4,14%
Amadeus 4,21%
BBVA 4,05%
Ferrovial 2,86%
ACS 2,33%
AENA 2,66%
Bankinter 1,38%
Grifols 0,12%
Sol melia 0,33%
Mapfre 0,94%
ARCELOR 0,09%
Banco Sabadell 1,23%
ACERINOX 0,42%
Bankia 0,91%
Acciona 0,70%
Inm colonial 0,62%
Merlin prop 0,62%
Viscofan 0,49%
Enagas 0,50%
CIE 0,41%
Indra 0,26%
Total % in common 63,83%
Active share 36,17%
INVESTMENT FUND %
1 Banco Santander 14,78%
2 Grupo Inditex 9,92%
3 Iberdrola 9,75%
4 Telefonica 9,01%
5 BBVA 7,76%
6 Repsoll 4,64%
7 Caixabank 4,43%
8 Miquel y costas 4,19%
9 Ferrovial 3,56%
10 Red electrica 2,50%
11 Amadeus 1,99%
12 Neinor homes 1,70%
13 Endesa 1,67%
14 Bolsa y mercados 1,65%
15 Intern consol 1,59%
16 Catalana occidente 1,50%
17 Naturgy 1,40%
18 ACS 1,33%
19 Gestamp 1,21%
20 Bankinter 1,20%
21 Cellnex 1,09%
22 Enagas 1,08%
23 Mapfre 1,08%
24 Banco Sabadell 1,07%
25 Metrovacesa 1,02%
26 Bankia 0,92%
27 SIEMENS 0,85%
28 Acerinox 0,79%
29 Aedas 0,69%
30 VOCENTO 0,43%
31 ATRESMEDIA 0,29%
95,09%
Banco Santander 14,02%
Grupo Inditex 9,14%
Iberdrola 9,75%
Telefonica 8,33%
BBVA 6,76%
Repsoll 4,64%
Caixabank 4,14%
Ferrovial 2,86%
Amadeus 1,99%
Endesa 1,67%
Naturgy 1,40%
ACS 1,33%
Bankinter 1,20%
Cellnex 1,09%
Enagas 1,08%
Mapfre 0,94%
Banco Sabadell 1,07%
Bankia 0,92%
SIEMENS 0,85%
Acerinox 0,42%
Total % in common 73,60%
Active share 26,40%
Ibercaja Bolsa
Table 16: Estructure Unifond fund Table 15: Estructure Ibercaja fund

Clara Mir Areizaga
55
21
21 (27-28-29) Source: Finect (Own elaboration)
INVESTMENT FUND %
1 Telefonica 9,79%
2 Iberdrola 8,25%
3 Banco Santander 8,14%
4 BBVA 7,26%
5 Inditex 6,93%
6 Repsoll 4,41%
7 Caixabank 4,02%
8 Amadeus 3,34%
9 Ferrovial 2,95%
10 Actv construcc 2,65%
11 Naturgy 2,62%
12 International conso 2,17%
13 AENA 2,13%
14 Grifols 1,77%
15 Quabit 1,77%
16 Bankia 1,76%
17 Siemens 1,67%
18 Endesa 1,58%
19 Neinor 1,46%
20 Banco Sabadell 1,44%
21 Metrovacesa 1,30%
22 Mapfre 1,27%
23 Acciona 1,24%
24 Acerinox 1,16%
25 Merlin prop 1,14%
26 Arcelor 1,04%
27 Liberbank 0,97%
28 Aedas 0,95%
29 Red electrica 0,92%
30 Realia 0,91%
31 Cellnex 0,88%
32 Obrascon 0,83%
33 Bankinter 0,82%
34 Solapark 0,82%
35 Dia 0,72%
36 Laboratorios 0,64%
37 Oryzon 0,62%
38 Sacyr 0,53%
39 Duro felguera 0,51%
40 Atresmedia 0,47%
41 Tubacex 0,39%
42 Indra 0,39%
43 Clinica baviera 0,38%
44 ADL 0,36%
45 renta corp 0,35%
46 Tecnicas Reuinidas 0,34%
47 Promotora 0,31%
48 Euskaltel 0,27%
49 Realia 0,25%
50 Catenon 0,18%
51 Repsoll 0,13%
52 Indo 0,00%
88,72%
Rural Renta Variable España Telefonica 8,33%
Iberdrola 8,25%
Banco Santander 8,14%
BBVA 6,76%
Inditex 6,93%
Repsoll 4,41%
Caixabank 4,02%
Amadeus 3,34%
Ferrovial 2,86%
Naturgy 2,62%
AENA 2,13%
Grifols 0,12%
Bankia 1,04%
Siemens 0,89%
Endesa 1,58%
Banco Sabadell 1,23%
Mapfre 0,94%
Acciona 0,74%
Acerinox 0,42%
Merlin prop 1,11%
Arcelor 0,09%
Cellnex 0,88%
Bankinter 0,82%
Indra 0,32%
Repsoll 0,13%
Total % in common 68,10%
Active share 31,90%
INVESTMENT FUND %
1 Inditex 13,01%
2 Iberdrola 10,34%
3 BSAN 9,10%
4 Telefonica 7,97%
5 Ferrovial 6,97%
6 Grifols 5,26%
7 Merlin prop 4,01%
8 BBVA 3,58%
9 Bankinter 2,89%
10 BANKIA 2,40%
11 Logista 2,33%
12 Applus serv 2,31%
13 NOS SGPS 2,25%
14 Caixabank 2,22%
15 Peugeot 1,96%
16 Unicaja 1,49%
17 ACS 1,08%
18 Mapfre 0,76%
19 Vidrala 0,74%
20 Inm metron 0,72%
21 LAR 0,51%
22 laboratorios 0,30%
23 Navigator 0,23%
24 Repsol 0,01%
82,44%
Inditex 9,14%
Iberdrola 9,82%
Telefonica 7,97%
Ferrovial 2,86%
Grifols 0,12%
Merlin prop 1,11%
BBVA 3,58%
Bankinter 1,38%
BANKIA 1,04%
Caixabank 2,22%
ACS 1,08%
Mapfre 0,76%
Repsol 0,01%
Total % in common 41,09%
Caixabank Bolsa Gestion España
Table 17: Estructure Rural fund Table 18: Estructure Caixabank fund

Clara Mir Areizaga
56
22
22 (30) Source: Finect (Own elaboration)
INVESTMENT FUND %
1 BNP 23,32%
2 Banco Santander 4,17%
3 Credit suisse 3,05%
4 Assicurazioni 2,51%
5 Volkswagen 2,47%
6 Bayer 2,45%
7 BNP 2,32%
8 Caixabank 2,28%
9 Mex bonos 2,22%
10 Ebro foods 2,13%
11 BBVA 2,03%
12 Telefonica 2,89%
13 Repsol 2,88%
14 Melia hotel 2,67%
15 Lyxor 1,53%
16 Acerinox 1,34%
17 Applus serv 1,27%
18 Industria diseño 1,27%
19 Zardoya OTIS 1,06%
20 Corp financiera 1,04%
21 Total 1,02%
22 Merlin prop 1,01%
23 mapfre 1,00%
24 Galp energia 0,99%
25 Viscofan 0,99%
26 Ence energia 0,99%
27 Arcelormittal 0,93%
28 Prosegur 0,82%
29 Almirall 0,78%
30 Telecom 0,77%
31 Ryanair 0,43%
32 Miquel y costas 0,24%
33 Bayer 0,22%
34 BNP 0,20%
35 Dia 0,14%
36 Repsol 0,05%
68,92%
Banco Santander 4,17%
Caixabank 2,28%
BBVA 2,03%
Telefonica 2,89%
Repsol 2,88%
Melia hotel 2,67%
Acerinox 1,34%
Merlin prop 1,01%
mapfre 1,00%
Viscofan 0,99%
Ence energia 0,99%
Arcelormittal 0,93%
Repsol 0,05%
Total % in common 23,23%
Active share 76,77%
Credit Suisse Bolsa B
Table 19: Estructure Credit fund