man made fibers review - canaintex
TRANSCRIPT

Man Made Fibers Review
CANAINTEX Sept 2016
Alasdair Carmichael
Trusted commercial intelligencewww.woodmac.com

Trusted commercial intelligencewww.woodmac.com
2
Agenda
1. Introduction
2. The Fibers Big Picture
3. Polyester Continued Growth
4. Nylon, Spandex & Rayon Markets
5. Current China Developments
6. NAFTA Markets
7. Drivers of Price

Trusted commercial intelligencewww.woodmac.com
3
Product Coverage
Oil Refinery / Gas Field Petrochemical Complex Downstream Products
Fertilisers
Explosives
Resins
Plastics and Films
EOD’s/Detergents
Antifreeze
Polyester Fibers
Plastics
Acrylic Fibers
Plastic Coatings
Synth Rubbers
Tyres
Plastics & Foams
Nylons
Nylons, PC Resins
Plasticizers/Resins
Polyester Fibers &
Resins
Urethane Foams
Petroleum
Refining
Crude Oil
Reformate
Naptha
Gas Oil
Natural Gas
Processing
Natural Gas
Ethane
LPG
Methane
FeedstocksEnd Products
Intermediate
Petrochemicals
Basic
Petrochemicals
Gasoline
Kerosene Fuel OilDiesel
Jet
FuelLube
Oils
Asphalt
Reforming
Olefins
Plant
Aromatics
Separation
p-Xylene
Toluene
o-Xylene
Benzene
Crude C4s
Syngas
Ethylene
Propylene
g
Olefa
nt
Ar
Oma
tics
Processing Methanol
Ammonia
Urea
Polyethylenes
EDC/VCM/PVC
Ethylene
Oxide
Ethylene Glycol
Polypropylene
Acrylonitrile
Oxo-alcohols
Butadiene
Styrene
Cyclohexane
Cumene/Phenol/
Acetone
Phthalic Anhydride
DMT/PTA
TDI
Benzene / MDI
PCI Research Wood Mackenzie Future Research
3
Trusted commercial intelligencewww.woodmac.com
4
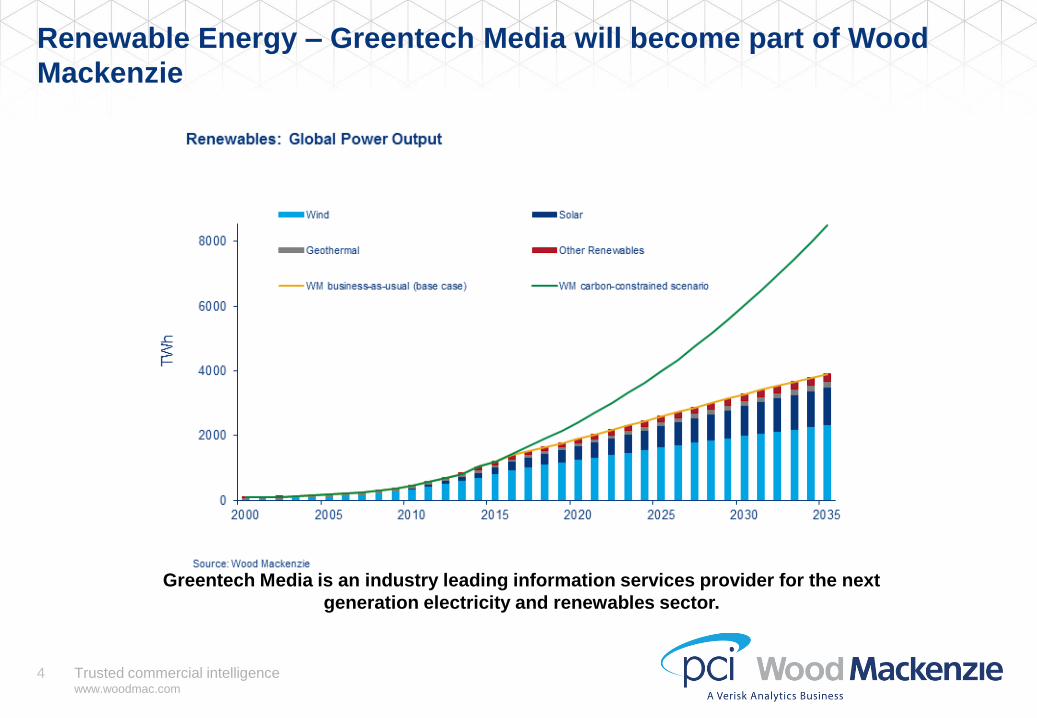
Renewable Energy – Greentech Media will become part of Wood
Mackenzie
Greentech Media is an industry leading information services provider for the next
generation electricity and renewables sector.

Trusted commercial intelligencewww.woodmac.com
5
Textile Mill Consumption (million tonnes)
0
20
40
60
80
100
120
19
91
19
94
19
97
20
00
20
03
20
06
20
09
20
12
20
15
20
18
20
21
20
24
20
27
20
30
Polypropylene
Cellulosics
Polyester
Nylon
Acrylic
Cotton
Wool

Trusted commercial intelligencewww.woodmac.com
6
Fibres in context 2015 (ktes)
1,705
3,532
4,098
5,325
24,055
48,030
Polyester
Cellulosics
Acrylic
Cotton
PP
Nylon
An Astronomers View

Trusted commercial intelligencewww.woodmac.com
7
Global Mill Consumption - 1980
Wool
Cotton 47%
Acrylic
Nylon
Polyester 17%
Cellulosics
Polypropylene
1980 = 30.3 million tons

Trusted commercial intelligencewww.woodmac.com
8
Global Mill Consumption - 2000
Wool
Cotton 38%
Acrylic
Nylon
Polyester 37%
Cellulosics
Polypropylene
2000 = 52.5 million tons

Trusted commercial intelligencewww.woodmac.com
9
Global Mill Consumption - 2015
Wool
Cotton 27%
Acrylic
Nylon
Polyester 55%
Cellulosics
Polypropylene
2015 = 87.8 million tons

Trusted commercial intelligencewww.woodmac.com
10
Global Mill Consumption - 2030
Wool
Cotton 24%
Acrylic
Nylon
Polyester 59%
Cellulosics
Polypropylene
2030 = 114.2 million tons

Trusted commercial intelligencewww.woodmac.com
11
All Fibers excluding Polyester grow 47% from 1991 – 2025 (million
tons)
0
20
40
60
80
100
120
Wool Cotton Acrylic Nylon Cellulosics Polyprop

Trusted commercial intelligencewww.woodmac.com
12
All Fibers including Polyester grow 173% from 1991 – 2025 (million
tons)
0
20
40
60
80
100
120
Wool Cotton Acrylic Nylon Cellulosics Polyprop Polyester

Trusted commercial intelligencewww.woodmac.com
13
China’s Dominance of Polyester Production (million tons)
-
10
20
30
40
50
60
70J,K,T
China
India
S.Asia
Turk/Afr/ME
Europe
Americas
China share of production: 1990 = 13%; 2000 = 26%; 2010 = 65%; 2015 = 69%
WTO
membership

Trusted commercial intelligencewww.woodmac.com
14
China’s Dominance of Polyester Production (million tons)
-
5
10
15
20
25
30
35
1990 1995 2000 2005 2010 2015
Rest China

Trusted commercial intelligencewww.woodmac.com
15
China Competitiveness (1)
• China starts with no basic advantage in oil prices, so why is polyester
(and other fibers) cheaper than in the West?
• Scale: Of the 12 largest polyester producers in the world 9 of them are
Chinese
0
500
1000
1500
2000
2500
3000
• Of the 3 non Chinese companies, 2 have operations in China
Polyester Plant
Capacities (000 tons)

Trusted commercial intelligencewww.woodmac.com
16
China Competitiveness (2)
• Polyester plants are highly integrated to raw materials.
• Plants financial structures are generally based on one profit center, not
multi centers.
• Plants have received significant state government benefits to provide
jobs. Land, loans, repayment terms, export subsidies.
• But can this last?
• 5 Year plan starting 2016 made it clear that Central government is
turning away from the policy of overbuild in established industries. It
takes time to work its way to the regional levels.
• Employment is not the driver that it was – demographics.
• Anti dumping and Countervailing duties are a greater factor in trade

Trusted commercial intelligencewww.woodmac.com
17
China Competitiveness (3)
• Banking Issues:
• Report from Bank for International Settlements (BIS) – Bankers Bank
• China facing full blown banking crisis, one of the measures BIS uses is
“credit to GDP gap” – a score of 10 signals a crisis “occurs in any of the
three years ahead”. In the Quarterly report BIS measures China current
score at 30.1
• Outstanding loans in China have reached $28 trillion – more than the
commercial banking systems of US & Japan combined. Corporate debt is
171% of GDP
• Peoples Daily states a very authoritative person warned that debt has
been “growing like a tree in the air” and called for an assault on “zombie
companies” saying that China cannot “continue to “force economic
growth by levering up” and the country must take its punishment.

Trusted commercial intelligencewww.woodmac.com
18
Polyester is Constantly Looking for Opportunities to Gain Share
All Fibers have to be aware of Polyester as it aims to take market
share – and it has been very successful at doing it!
Nylon developed in the late 1930s by DuPont. First commercial
Synthetic fiber – WW2, parachutes, ropes etc
Nylon applications in hosiery & intimate apparel: 1940s
Nylon into textured yarn – swimwear, and into Tirecord: 1950s
Nylon into carpets – 1960s
Nylon into Engineered Plastics 1970s
Nylon into Films 1980
Since then no new “segment” growth – applications like airbags, and
demographics etc have increased volume, but polyester has
effectively slowed growth by taking share of hosiery, intimate apparel,
tires, carpets, performance apparel, sports uniforms etc. from nylon.

Trusted commercial intelligencewww.woodmac.com
19
Demand for PA6+PA66 by Application
0
1000
2000
3000
4000
5000
6000
7000
8000
3819(84%)
1990 1995 20152005 20102000
4181(57%)
ktes/yr
+1.9%
3117(43%)
702(16%)
Non-Fibre Fibre

Trusted commercial intelligencewww.woodmac.com
20
Nylon Fiber Production 1990 – 2030 (000 tons)
-
500
1000
1500
2000
2500
3000
3500
4000
4500
1990
1992
1994
1996
1998
2000
2002
2004
2006
2008
2010
2012
2014
2016
2018
2020
2022
2024
2026
2028
2030
Tex Fil Ind Fil Carpet Fil Staple
-
500
1000
1500
2000
2500
3000
3500
4000
4500
1990
1992
1994
1996
1998
2000
2002
2004
2006
2008
2010
2012
2014
2016
2018
2020
2022
2024
2026
2028
2030
Tex Fil Ind Fil Carpet Fil Staple
Nylon 6
Fiber increases +71%
Nylon 66
Fiber decreases -8.5%

Trusted commercial intelligencewww.woodmac.com
21
Regional Spandex Capacities (000 tons)
0 100 200 300 400 500 600
NAM
SAM
EU + Turk
China
Korea
Taiwan
Japan
Rest Asia2015
2010
2000
0 20 40 60 80
NAM
SAM
EU + Turk
Korea
Taiwan
Japan
Rest Asia2015
2010
2000

Trusted commercial intelligencewww.woodmac.com
22
Global Spandex Consumption by End Use
Circular Knit28%
Warp Knit20%Hosiery
13%Woven
9%
Narrow8%
Seamless4%
Others18%
2015: 652,000 tons

Trusted commercial intelligencewww.woodmac.com
23
Rayon Staple Production (000 tonnes)
0
1000
2000
3000
4000
5000
6000
7000
JKT
China
India
South Asia
Turk/Afr/ME
Europe
Americas

Trusted commercial intelligencewww.woodmac.com
24
Viscose rayon staple output has grown rapidly
Even though viscose staple remains a small volume fibre.
Demand has grown strongly between 2000 and 2015:
» Rising incomes
» Demand for comfortable clothing
» Demand for nonwovens, including wipes
Fiber CAGR 2000-2015
Cotton 1.2%
Cellulosic Staple 7.0%
Cellulosic Filament -1.7%
Wool -1.8%
Acrylic Staple -2.9%
Nylon Staple -8.2%
Polyester Staple 4.4%
Polypropylene/other Staple -0.4%
Nylon Filament 0.8%
Polyester Filament 7.5%
Polypropylene/other Filament 1.9%
Total Fiber 3.6%

Trusted commercial intelligencewww.woodmac.com
25
Global Production of Viscose Staple Fiber (million tons)
0
1
2
3
4
5
N America S America W Europe E Europe Turkey
China India Asean Taiwan Japan

Trusted commercial intelligencewww.woodmac.com
26
Major Capacities of Viscose Staple Fiber (Rayon) 2016 (000 tons)
Lenzing & Birla account for 34% of global VSF capacity
The next 6 producers (all Chinese) share of global capacity is 41%
Global Capacity is 5.7 million tons and these 8 companies have 75% share
0
200
400
600
800
1,000
1,200

Trusted commercial intelligencewww.woodmac.com
27
Major Announced Expansions of VSF (Rayon) (000 tons)
0
200
400
600
800
1,000
1,200
1,400
1,600
Birla Lenzing Sateri Fulida
Planned NewCapacity
Lyocell Capacity
VSF Capacity

Trusted commercial intelligencewww.woodmac.com
28
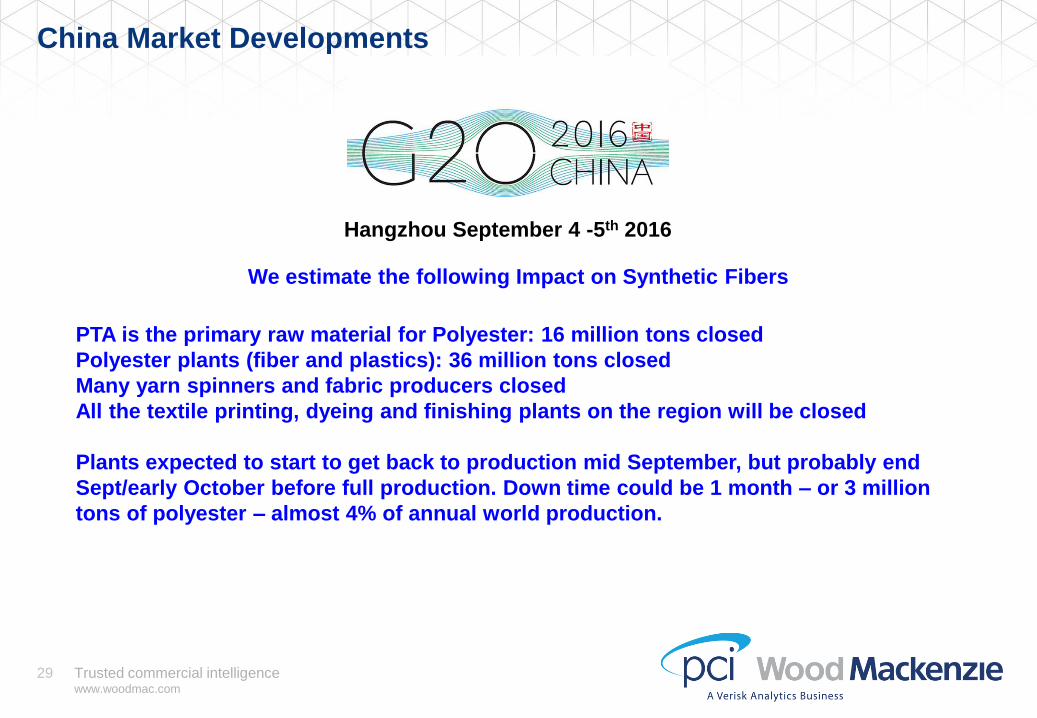
China Market Developments
Hangzhou September 4 -5th 2016
Why is this relevant to a Synthetic Fibers paper?
Hangzhou is in Zhejiang province and is the center of a major industrial zone, with
Jiangsu Province and Shanghai as neighbors. It is the greatest concentration of the
polyester industry in the world. Also many of the downstream fiber and fabric producers
are in the area.
In order to make the G20 guests as welcome as possible the government “asked” most
industry to close for a period of at least 2 weeks to reduce pollution while the guests are
in town!
For 2 weeks container trucks and cargo delivery trucks in Hangzhou will be stopped
with a penalty od $14,000 and 15 days detention! – Serious stuff.
Trusted commercial intelligencewww.woodmac.com
29
China Market Developments
Hangzhou September 4 -5th 2016
We estimate the following Impact on Synthetic Fibers
PTA is the primary raw material for Polyester: 16 million tons closed
Polyester plants (fiber and plastics): 36 million tons closed
Many yarn spinners and fabric producers closed
All the textile printing, dyeing and finishing plants on the region will be closed
Plants expected to start to get back to production mid September, but probably end
Sept/early October before full production. Down time could be 1 month – or 3 million
tons of polyester – almost 4% of annual world production.

Trusted commercial intelligencewww.woodmac.com
30
NAFTA – Major Synthetic Fiber Capacities (000 tons)
0
200
400
600
800
1000
PTF PIF PCF P St NTF NIF NCF N St Acr
Mexico
USA
Canada

Trusted commercial intelligencewww.woodmac.com
31
NAFTA – Automotive Market, Light Vehicle Build (millions)
0
2
4
6
8
10
12
14
16
18
20
198
0
198
2
198
4
198
6
198
8
199
0
199
2
199
4
199
6
199
8
200
0
200
2
200
4
200
6
200
8
201
0
201
2
201
4
Trucks
Cars
Trusted commercial intelligencewww.woodmac.com
32
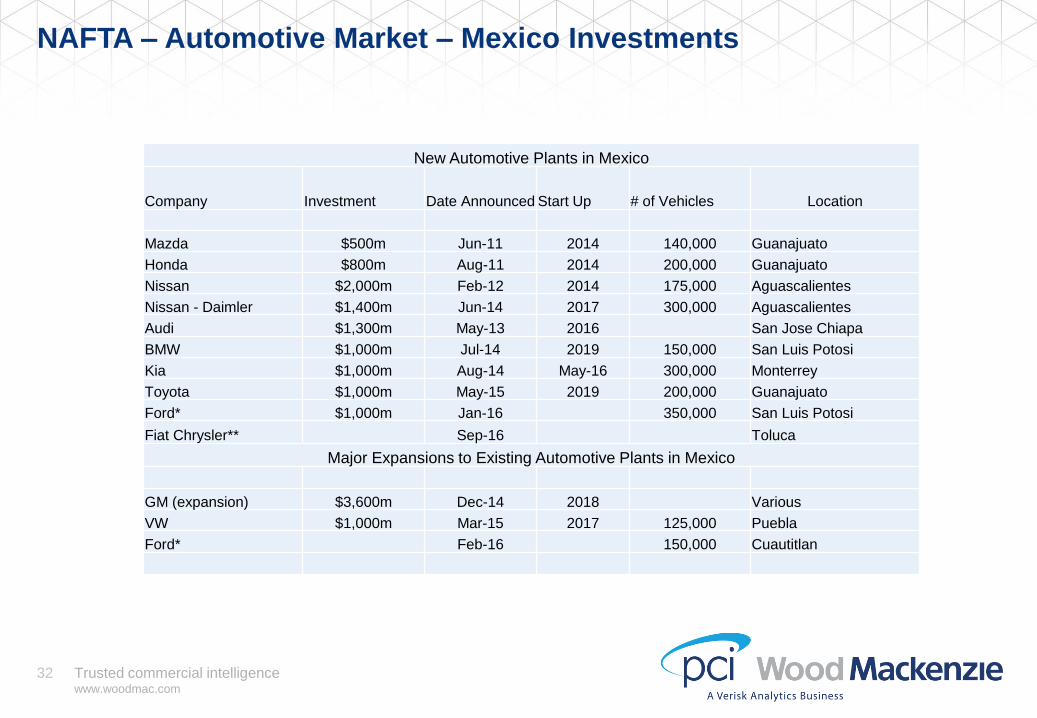
NAFTA – Automotive Market – Mexico Investments
New Automotive Plants in Mexico
Company Investment Date Announced Start Up # of Vehicles Location
Mazda $500m Jun-11 2014 140,000 Guanajuato
Honda $800m Aug-11 2014 200,000 Guanajuato
Nissan $2,000m Feb-12 2014 175,000 Aguascalientes
Nissan - Daimler $1,400m Jun-14 2017 300,000 Aguascalientes
Audi $1,300m May-13 2016 San Jose Chiapa
BMW $1,000m Jul-14 2019 150,000 San Luis Potosi
Kia $1,000m Aug-14 May-16 300,000 Monterrey
Toyota $1,000m May-15 2019 200,000 Guanajuato
Ford* $1,000m Jan-16 350,000 San Luis Potosi
Fiat Chrysler** Sep-16 Toluca
Major Expansions to Existing Automotive Plants in Mexico
GM (expansion) $3,600m Dec-14 2018 Various
VW $1,000m Mar-15 2017 125,000 Puebla
Ford* Feb-16 150,000 Cuautitlan

Trusted commercial intelligencewww.woodmac.com
33
NAFTA – Automotive Market – Synthetic Fibers Impact
Source: LMC Automotive
Recent Supply Chain Investments
• Goodyear investing $500m - Tires
• Michelin investing $500m - Tires
• Pirelli investing $200m – Tires
• Boxmark $100m – Seating
• Toray $100m – Airbags (10k tons of
N66)
Impact on Synthetic Fibers
• Estimated that an average new
vehicle uses:
• 15.4kgs of Polyester fiber
• 4.2kgs of Nylon
19 million vehicle build
• Polyester = 292,000 tons
• Nylon = 79,000 tons

Trusted commercial intelligencewww.woodmac.com
34
Oil Prices Monthly 1990 – Aug 2016, WTI $/barrel
0
20
40
60
80
100
120
140
160
1990 1995 2000 2005 2010 2015
26.66 yr
Average
$46.63
Sept 7th
Price
$46.27!

Trusted commercial intelligencewww.woodmac.com
35
Oil as a Driver of Polyester Fiber Prices, China Daily Spot Market
($/ton)
200
400
600
800
1000
1200
1400
Paraxylene
Oil
Sept 2014 Sept 2016

Trusted commercial intelligencewww.woodmac.com
36
Oil as a Driver of Polyester Fiber Prices, China Daily Spot Market –
indexed to Sept 2014
30
40
50
60
70
80
90
100
110
120
Oil
PX
PTA
MEG
Sept 2014 Sept 2016

Trusted commercial intelligencewww.woodmac.com
37
Nylon 6 & 66 cf Polyester Polymer Prices N. America ($/ton)
Nylon 6 prices fall as China builds too much fiber and raw materials capacity in 2015
-300
200
700
1200
1700
2200
0
500
1000
1500
2000
2500
3000
3500
4000
4500
2010 2011 2012 2013 2014 2015 2016
6:66 delta(RHS) Nylon 66 Nylon 6 Polyester

Trusted commercial intelligencewww.woodmac.com
38
Cotton (Far East A index) vs Polyester Staple (Asia) c/kg
-100
0
100
200
300
400
500
198
9 Q
1
Q2
Q3
Q4
199
4 Q
1
Q2
Q3
Q4
199
9 Q
1
Q2
Q3
Q4
200
4 Q
1
Q2
Q3
Q4
200
9 Q
1
Q2
Q3
Q4
201
4 Q
1
Q2
delta Cotlook A* PES Staple Asia

Trusted commercial intelligencewww.woodmac.com
39
Cotton (A index) : Polyester Staple: Rayon (Asia) c/kg
50
70
90
110
130
150
170
190
210
230
2013 Jan 2014 Jan 2015 Jan 2016 Jan
Cotton A index PET St Asia Rayon
Trusted commercial intelligencewww.woodmac.com
40
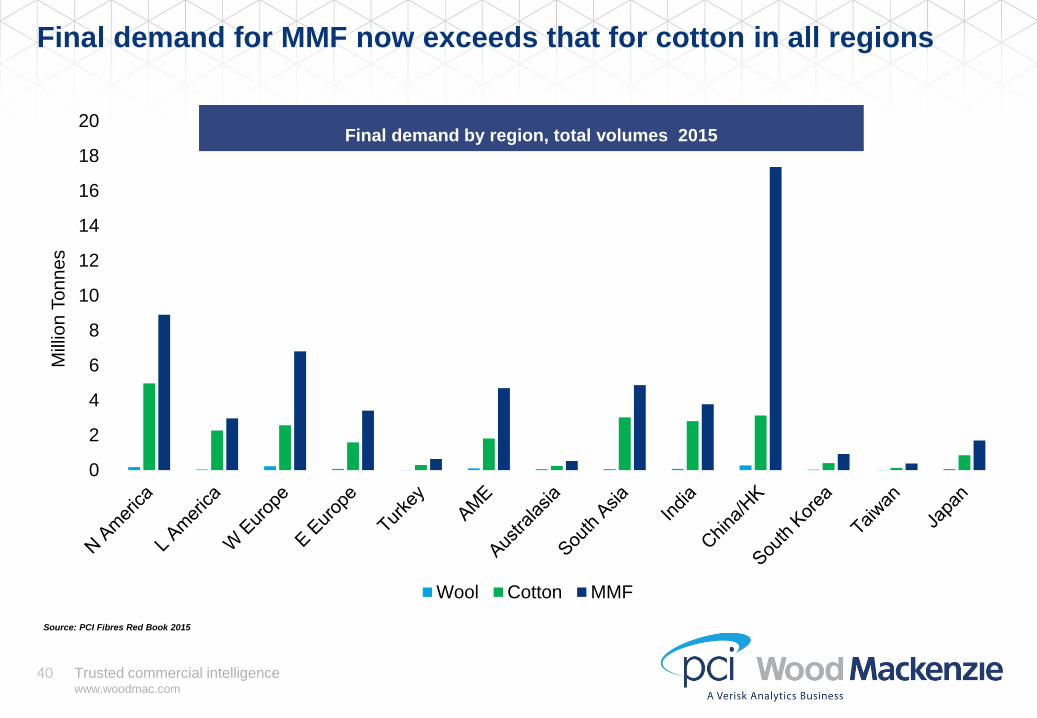
Final demand for MMF now exceeds that for cotton in all regions
Source: PCI Fibres Red Book 2015
0
2
4
6
8
10
12
14
16
18
20
Mill
ion
To
nn
es
Wool Cotton MMF
Final demand by region, total volumes 2015

Trusted commercial intelligencewww.woodmac.com
41
Thoughts
• Man Made Fiber growth continues with Polyester & Rayon leading.
• Global Business generally slow, but pricing is stable.
• Trade: Are we in a period of Free Trade or Greater Protectionism? TPP or
anti dumping??
• Will oil prices remain reasonably low? Our forecast is $XX/ barrel end of
2016.
• Overcapacity in Polyester and Nylon continues, large expansion in
Rayon.
• Do current Shipping Industry problems encourage local manufacture?
Muchas Gracias

Trusted commercial intelligencewww.woodmac.com
42
Disclaimer
This presentation has been prepared for Participants of the CANAINTEX Conference
on 23 – 24 September 2016 by Wood Mackenzie Limited. The presentation is intended
solely for the benefit of attendees and its contents and conclusions are confidential and
may not be disclosed to any other persons or companies without Wood Mackenzie’s
prior written permission.
The information upon which this presentation comes from our own experience,
knowledge and databases. The opinions expressed in this presentation are those of
Wood Mackenzie. They have been arrived at following careful consideration and
enquiry but we do not guarantee their fairness, completeness or accuracy. The
opinions, as of this date, are subject to change. We do not accept any liability for your
reliance upon them.
Strictly Private & Confidential

Europe +44 131 243 4400
Americas +1 713 470 1600
Asia Pacific +65 6518 0800
Email [email protected]
Website www.woodmac.com
Wood Mackenzie™, a Verisk Analytics business, is a trusted source of commercial intelligence for the world's
natural resources sector. We empower clients to make better strategic decisions, providing objective analysis
and advice on assets, companies and markets. For more information visit: www.woodmac.com
WOOD MACKENZIE is a trade mark of Wood Mackenzie Limited and is the subject of trade mark registrations and/or applications in
the European Community, the USA and other countries around the world.