malnutrition among ultra poor women - brac research...
TRANSCRIPT

I
Malnutrition among Bangladeshi women in ultra poor
households: prevalence and determinants
Farhana Haseen
Master Program in International Health
International Maternal and Child Health
Department of Women’s and Children’s Health
Uppsala University
II
Table of Contents List of tables and figure ............................................................................................................III
List of acronyms ...................................................................................................................... IV
Acknowledgements....................................................................................................................V
Abstract .................................................................................................................................... VI
Background .................................................................................................................................1
Objectives ...................................................................................................................................3
Introduction.................................................................................................................................4
1. Poverty scenario - Bangladesh............................................................................................4 2. Poverty and malnutrition ....................................................................................................5 3. Malnutrition in women .......................................................................................................5 4. Consequence of malnutrition among women .....................................................................6 5. Causes associated with malnutrition...................................................................................8 6. BRAC and Ultra poor: CFPR/TUP Program....................................................................11
Study population and method ...................................................................................................14
1. Study population and data collection................................................................................14 2. Methods ............................................................................................................................15 3. Sample size .......................................................................................................................17 4. Sampling technique...........................................................................................................17 5. Data quality and statistical analysis ..................................................................................18
Ethical consideration.................................................................................................................19
Results.......................................................................................................................................20
1. Background characteristics ..............................................................................................20 2. Food and nutritional status................................................................................................22 3. Health status......................................................................................................................24 4. Determinants associated with malnutrition.......................................................................25
Discussion .................................................................................................................................28
Summery findings.................................................................................................................28 Limitation..............................................................................................................................28 Nutritional status...................................................................................................................29 Food and nutrient intake .......................................................................................................29 Health status..........................................................................................................................30 Prevalence of underlying determinants of malnutrition .......................................................31 Determinants associated with malnutrition...........................................................................31
Conclusion ................................................................................................................................33
Future research plan..................................................................................................................33
References.................................................................................................................................34
III
List of tables and figure
Table 1. Targeting indicators used in CFPR/TUP and their rationale
Table 2. Number of households and women assessed for different indicators
Table 3. Comparison of background characteristics considered as underlying cause of
malnutrition among surveyed and not surveyed women in ultra poor households.
Table 4: Distribution of nutritional status among women
Table 5: Distribution of nutritional status among women by age
Table 6: Association of age and parity with BMI and hemoglobin concentration by linear
regression analysis
Table 7: Food intake per day among women
Table 8: Intake of calorie and other essential nutrients against the requirement
Table 9: Description of health status of women
Table 10: Prevalence (%) of parasites infestation among women
Table 11: Important determinants associated with CED and BMI
Table 12: Important determinant associated with anemia and hemoglobin concentration
Fig 1: Causes associated with malnutrition among women in poor households

IV
List of acronyms
BBS Bangladesh Bureau of Statistics
BMI Body Mass Index
BMRC Bangladesh Medical Research Council
CED Chronic Energy Deficiency
CFPR/TUP Challenging the Frontiers of Poverty Reduction/Targeting the Ultra Poor
DALYs Disability-adjusted life years
Epg Eggs per gram
GoB Government of Bangladesh
HKI Helen Keller International
ICDDR,B International Center for Diarrhoeal Disease Research, Bangladesh
INFS Institute of Nutrition and Food Science
IPHN Institute of Public Health Nutrition
LBW Low Birth Weight
MDG Millennium Development Goals
NGO Non-governmental Organization
PEM Protein-energy Malnutrition
PRA Participatory Rural Appraisal
PWR Participatory Wealth Ranking
RDA Recommended Dietary Allowance
RED Research and Evaluation Division
UNICEF United Nation Children Fund
VGD Vulnerable Group Development
WHO World Health Organization

V
Acknowledgements
I owe special depth of gratitude to my supervisor Dr. Eva-Charlotte Ekström for her tireless
support, encouragement, enthusiasm, countless hours of beneficial discussion and scientific
concern in this paper.
My thanks go to Professor Lars-Äke Persson for helping me to enter the world of
Epidemiology.
I wish to thank Dr. Martha Garrett for her constant guidance and support in seeking the
information.
My sincere thanks to all the staff of IMCH for contributing in such friendly and pleasant
atmosphere, especially thanks to Christina Niska Bachelet and Ann-Christin W Lindqvist with
whom I can share all my feelings.
I am grateful to all my classmates and Dr. Anisur Rahman of IMCH for continuous
encouragement and support. I will never forget the good time we spent.
I wish to express thanks to all my friends in the dormitory for friendly help and
encouragement.
I gratefully acknowledge the help and cooperation of my BRAC colleagues; Dr. SM Ziauddin
Hyder, Dr. Imran Matin, Dr. CSB Jalal, Dr. Iftekhar Quasem and Farid Ahmed in designing,
developing questionnaire, training and conducting the study. Special thanks to members of the
field staff who conducted the survey.
I thank the Swedish Institute for financial support throughout my study period in Uppsala
University.
I am grateful to my mother, sisters and brother-in-laws who gave me moral support, endless
love, encouragement and confidence to stay alone here, far from my home, Bangladesh.
Last but not the least, I am grateful to the women of the ultra poor households for their
cooperation. Without their support this study would have been impossible.
VI
Abstract
Background: Malnutrition is widespread and has been recognized as a public health problem in Bangladesh. People living in absolute poverty are more susceptible to infection, disease and malnutrition. Nearly one-quarter to one-third population of Bangladesh live under extreme poverty – they are called the ultra poor. These ultra poor are often excluded from government and even from the non-governmental poverty reduction programs like microcredit/microfinance. To reach these ultra poor, BRAC has undertaken a comprehensive program in 2001 as ‘Challenging the Frontiers of Poverty Reduction/Targeting the Ultra Poor’ (CFPR/TUP) with the aim of poverty reduction and establish a sustainable livelihood. As poverty and malnutrition are interrelated, information on important dimension of nutrition was required to see the impact of program and modify health intervention. Objective: the objective was to describe the prevalence of malnutrition and identify the associated factors among the women of ultra poor households targeted by BRAC in Bangladesh. Design: It was a cross-sectional survey. A total of 978 households were covered in the survey. Adult female aged 15-49 years who were selected for program intervention in households were covered for anthropometric measurements (896), anemia (889) and parasitic infestation (473). Pregnant women were excluded. A sub-sample of 200 women was surveyed for food consumption. Data were collected between July and September 2003. Nutritional status was assessed by measurement of body mass index (BMI) and hemoglobin concentration. Anthropometric measurements included weight and height. Anemia was assessed by hemoglobin measurements with HemoCue photometer. Stool samples were examined for worm infestation by ‘Direct Microscopic Wet Mounts’ method. A dietary survey was conducted using the 24-h dietary recall method. Results: Chronic energy deficiency was highly prevalent among women, 56% had BMI <18.5 kg/m2. Mean body weight was 40.3 kg. Even though the mean body height was 148.3 cm, about one third (29%) were less than 145cm. Prevalence of anemia was detected in 48% of the women. The average per capita total energy intake in women was calculated as 1609 kcal/day. Almost 90% calorie came from cereals. Overall parasites infestation prevalence was 66%. The most common parasite was Ascaris with prevalence of 52%, hookworm and Trichuris trichiura were 23% and 14% respectively. Less than 3% had any formal schooling. Only 15% women used sanitary latrine and 19% women took iron tablet during last pregnancy. Significant association was found between BMI and reported illness, perceived health status and signature capability (p<0.05). Anemia prevalence was found to be associated with signature capability, iron tablet intake and total number of pregnancy (p<0.05). Conclusion: The extent of malnutrition was high among the women in ultra poor households. The nutritional situation showed a disadvantaged position of the women living in ultra poor households compared to the average rural women in Bangladesh.

1
Background
Bangladesh is one of the poorest countries in the world with nearly 20% to 34% population
under extreme poverty – they are called the ultra poor [1]. Poverty and malnutrition is
interrelated. There is a two-way link between poverty and malnutrition. Poverty is one of the
most influential risk factors of malnutrition and malnutrition can lead to poverty. Poverty
affects nutrition throughout the whole life-span in a broad spectrum of manifestations, such as
an increased propensity to infectious and non-communicable diseases, a reduced physical
work capacity, a lower learning capacity, an increased vulnerability to lifestyle-related and
environmental risks, a reduced participation in social decisions, and a negligible capacity to
face environmental challenges [2]. The consequences of malnutrition are severe and long
lasting. Sometimes it moves from generation to generation.
In poor households, women are highly vulnerable to nutritional insufficiencies because of
their increased need for food and nutrients during pregnancy and lactation. In Bangladesh,
like other developing countries, poverty, ignorance and social taboos play strong negative
effects on food intake of women; they eat last and the least. Most of the poor women suffer
the consequence of a long history of poor nutrition, frequent illness and little or no access to
health facilities. Moreover, they have to keep working; particularly households work for the
family. Malnutrition reduces their work capacity and makes them susceptible to infection.
Burdened with repeated pregnancies from early adolescence and the household chores they
have to perform as wives and mothers, they suffer most from the serious consequences of
nutritional insufficiency. Pregnancy in adolescence and protein energy malnutrition are
common in poor countries and particularly in low-income groups [2]. Malnutrition is
especially critical for women because inadequate nutrition causes not only havoc to her own
health but also that of their children. Maternal malnutrition during pregnancy increases the
risk of mortality, as well as it affects fetal growth, resulting in low birth weight (LBW),
risking the survival of the child. The prevalence of low birth weight (around 36%) in
Bangladesh is one of the highest in the world [3]. The LBW girl infants likely grow into
stunted and undernourished adolescent girls and finally to undernourished and stunted
mothers giving birth to LBW babies [4]. Malnutrition in poor communities is thus perpetuated
through generations.

2
Bangladesh has enjoyed considerable success in poverty reduction since independence with
the head count ratio coming down from over 70% in 1973-74 to 44% in 2000 [1]. But in real
situation most of the poverty reduction programs of government and non government
organization (NGO) do not focus on the extreme poor population. Even NGO microfinance
programs do not reach the extreme poor and may actively exclude them [5-7]. This poorest of
the poor group with lack of adequate food, education, and basic health care are suffering
grave consequences. To reduce the poverty and build a sustainable livelihood for the extreme
poor, since January 2002, BRAC, one of private developmental organization in Bangladesh,
has started a new program called Challenging the Frontiers of Poverty Reduction/Targeting
the Ultra Poor (CFPR/TUP).
In designing the CFPR/TUP program, a number of goals, objectives and indicators have been
set which include, in addition to economic and social development, poverty reduction through
establishing some innovative livelihood models and improvement in health-related knowledge
and caring practices. And it is believed that over time, this new poverty reduction instrument
will have a positive impact on nutritional status and sustainable livelihood improvement. The
CFPR/TUP program proposed involves substantial resource transfer to the ultra poor women.
One adult, active woman from the selected household is capable of getting involved in an
income generating activity. She has received program intervention like asset, training to
continue the enterprise, knowledge, and education for social development. Her involvement
can lead to form of sustainable livelihood and improvement of nutritional situation in poor
households. Nutritional status of the women is very important to make all the intervention
successful. Therefore, a study was required to have the information on important dimensions
of nutrition and livelihood of the women of these households. Selected nutritional indicators
including anthopomery, anemia prevalence, food consumption pattern, and intestinal parasite
of the women from rural ultra poor households were assessed. Determinants associated with
malnutrition were also identified. This is the first study that describes determinants and
nutritional status among the women in ultra poor households in Bangladesh. As no data on
nutrition and health profile of women in poorest households are available, this study also
provides baseline information for future evaluation to see the impact of program and modify
the public health intervention.

3
Objectives
The overall objective was to describe the prevalence of malnutrition and identify the
associated determinants among the women of ultra poor households targeted by BRAC
in Bangladesh.
Specific objectives:
1. Assess the prevalence of chronic energy deficiency among women living in
ultra poor households.
2. Assess the prevalence of anemia in women from ultra poor households.
3. Assess the intake and pattern of food consumption of women of ultra poor
households.
4. Calculate calorie and other nutrient consumption of women from ultra poor
households
5. Assess the intensity and prevalence of intestinal parasites (Ascaris,
hookworm and Trichuris trichiuria) infestation among women of ultra poor
households
6. Describe the underlying determinants of malnutrition among the women
from ultra poor households.
7. Describe the determinants associated with malnutrition among the women
in ultra poor households.
4
Introduction
1. Poverty scenario - Bangladesh
According to an estimate, more than one billion people in the world are living in poverty
despite enormous economic development during the past decades [8]. The burden of poverty is
spread unevenly creating inequalities in all basic needs like, food, education, access to health
care, and so on.
With a population of over 140 million people in only 55,100 square miles of land, Bangladesh
is one of the poorest and most densely populated countries in the world, with 36% of the
population living below US$1 a day, and occupies 139th position in UNDP’s Human
Development Index [9]. At present, at least 56 million people (44% of the population) live in
absolute poverty, of whom more than 25 million constitute the extreme poor (20%, of the
population, variously described as ‘hardcore poor’, ‘ultra poor’, or ‘poorest of the poor’) [1].
There are numerous poverty-reduction programs in Bangladesh. Unfortunately even well-
respected programs generally fail to reach the extremely and the persistently poor. This is
documented in detail by Rahman and Hossain [10] and has been a common finding about
government and NGO activities throughout the 1990s. A national survey found that 41 percent
of eligible, poor households did not have any contact with the NGOs operating in their
localities [11]. Rahman and Razzaque [12] have found that almost three quarters of the
hardcore poor have never received social development services from NGOs.
It is well known that the mainstream development approaches, especially the microfinance, the
mainstay of most NGO programs in Bangladesh, though an effective poverty-alleviating
instrument, is not suitable for all categories of the poor, and largely bypasses the extreme poor.
The moderately poor households who are the principal users of microfinance have been able to
overcome poverty and reduce vulnerability [13, 14]. There are several reasons why poorer
households are less likely to join or, once joining, less able to make effective use of loans.
Perhaps the most common factor is that the households need an existing source of regular
income with which to service loans. Very often, NGO staff or other borrowers discourage such
poor households joining the program. Thus, policies and programs that work for the moderate
poor may not work for the extreme poor. This significant number of poor people require
immediate and special attention if Bangladesh is to fulfill its commitment towards attaining the
5
Millennium Development Goals (MDG) which promise, among other thing is, to halve the
proportion of people living on less than one US dollar a day by 2015 [15].
2. Poverty and malnutrition
Poverty and nutrition are closely related; poverty leads to hunger, ill health and malnutrition.
Nutritional status depends on food and non food items such as education, hygiene, caring
practice [2]. And all the factors related to malnutrition like; inadequate food intakes or food
insecurity, little or no assess to health service, poor environmental sanitation and safe water,
illiteracy or low education, lack of proper caring practices for pregnant women and distorted
perception of rights and needs, are common in poor households. The poor are caught in a
vicious cycle of: poverty breeds ill-health, and ill-health keeps poor people poor [16] and that
leads to malnutrition. Nutrition is a key component of one of the most fundamental assets-
human capital [17]. Malnutrition dis-empowers individuals by causing or aggravating
infection, illness, lowering educational attainment and diminishing livelihood skills [18] and
drains family savings [2]. Poor people are more exposed to risk of malnutrition and less
prepared to cope with them, less informed about the benefit of healthy life style and access to
quality health care, so they suffer from more illness, disability and malnutrition [19]. Family
welfare is significantly dependent on the health and nutritional status and the physical and
intellectual capacity of the adults. As a result, deteriorating nutritional status of adult in poor
household undermines the capacity of families to survive and ensure basic nutritional and
health needs [2].
3. Malnutrition in women
Women are more likely to suffer from malnutrition than men are, for some potential reasons,
which involve women’s reproductive biology, low social status, poverty and lack of
knowledge. Moreover, socio-cultural tradition and disparities of household work pattern can
also make the women more susceptible to malnutrition [20]. Additionally menstruation,
pregnancy and lactation can lead to nutritional deficiency, which is the most widespread and
disabling health related problem among women [21]. Lipton and Ravallion [22] show that
women work longer hours to attain the same level of welfare as men do, and that poverty is
more likely to be chronic in women, thus they are more prone to poor health, malnutrition,
and lack of education.
6
Globally at least 120 million women in less developed countries are underweight [23]. An
estimated 450 million adult women in developing countries are stunted as a result of
childhood malnutrition [24]. In Bangladesh nearly half of women are suffering from chronic
malnutrition, BMI less than <18.5 kg/m2 [25]. Micronutrient deficiency – especially
deficiencies in iron, iodine and vitamin A – are even more widespread worldwide than that of
protein energy malnutrition (PEM) [21]. Besides being important causes of disability,
micronutrient deficiencies often underlie other types of morbidity. Worldwide about 40
percent of non pregnant and 50 percent of all pregnant women are anemic [21]. Latest anemia
survey conducted in 2003 in Bangladesh shows that anemia prevalence is 33% and 45%
among the non pregnant non lactating women and pregnant women respectively [1]. Around
250 million women suffer the effects of iodine deficiency worldwide [24]. About 6% women
are blind due to vitamin A deficiency globally and 13% in Bangladesh [18].
4. Consequence of malnutrition among women
Malnutrition poses a variety of threats to women. It weakens women's ability to survive
childbirth, makes them more susceptible to infections, and leaves them with fewer reserves to
recover from illness. Poor women are likely to be poorly nourished and this has serious
implications for the nutrition status of their yet-to-be-born children [26]. Every year, more
than 500,000 women worldwide die from complications arising from pregnancy and
childbirth [27]. Maternal undernutrition is directly associated with ill health through the
malnutrition infection complex, and places both the mother and her fetus at risk [28]. The
relationship between low birth weight and intrauterine growth retardation to maternal
undernutrition is documented [29].
Maternal stunting is a known risk factor of small birth canal and obstructed labour, leading to
injury or mortality for mothers and their newborns. It is also associated with reduced work
capacity [30], illness and mortality. Obstructive blood loss is another factor that contribute
significantly to anemia in women with low iron reserve [21].
Micronutrient deficiencies are also associated with pregnancy complications and maternal
mortality. Iron deficiency anemia among pregnant women has been suggested to cause about
an estimated 111,000 maternal deaths each year [31]. Though anemia is not specific for iron
deficiency [32], it is recognized as most common and important causes of nutritional anemia
worldwide [33, 34], especially in developing countries like Bangladesh. A report on the

7
economic consequences of iron deficiency anemia reveals that the annual per capita
productivity loss due to iron deficiency is 4.19 US dollar or 1.9% of the gross domestic
product for Bangladesh [35]. Severe anemia places women at higher risk of death during
delivery and the period following childbirth [36]. Recent research suggests that even mild
anemia puts women at greater risk of death [37]. Anemia is responsible for about 35 percent
of preventable low birth weight [38] and this intrauterine iron deficiency, caused by iron
deficiency in the mother, is know to cause irreversible alterations in brain development [39].
Iron deficiency anemia is also known to be associated with reduced reproductive capacity
[40]. Maternal anemia aggravates the effects of hemorrhage and sepsis during childbirth and
is a major contributing cause of maternal mortality. In almost one-fifth of maternal deaths
(19.3%) in rural India, anemia is reported to be an indirect cause [41]. Iron deficiency and
anemia cause fatigue, reduce work capacity, impairs immune function and make people more
susceptible to infection [42]. At age 15-44 years, the burden on iron deficiency anemia in
developing countries in terms of DALYs per year is 7135 for women as against 4898 for men
[43].
Malnutrition in women leads to economic losses for families and countries because
malnutrition reduces women's ability to work and can create worse effects that extend through
generations. Countries where malnutrition is common must deal with its immediate costs,
including reduced income from malnourished population, and face long-term problems that
may be related to low birth weight, including high rates of cardiac disease and diabetes in
adults [44]. Reduced productivity associated with illness of women due to malnutrition may
be difficult to determine exactly, but recent research indicates that 60 percent of deaths of
children under-five age are associated with malnutrition — and children's malnutrition is
strongly correlated with mothers' poor nutritional status [45]. Problems related to anemia, for
example, including cognitive impairment in children and low productivity in adults, cost 5
billion US dollar a year in South Asia alone [35]. A report from Asia reveals that malnutrition
reduces human productivity by 10% to 15% and gross domestic product by 5% to 10% [46].
Therefore, by improving the nutritional status of women, nations can reduce health care costs,
increase intellectual capacity, improve adult productivity and as a whole overall development.

8
5. Causes associated with malnutrition
Malnutrition is a complex condition that can be influenced by multiple causes. Women
become malnourished because of illness combined with inadequate dietary intake.
Households food insecurity, inadequate knowledge due to lack of education, lack of safe
water and sanitation and poor health service can be considered as potential underlying causes
that that can lead to malnutrition. Since there are some common causes associated with the
malnutrition of both women and children living in poor households, the conceptual
framework of UNICEF [47] for child malnutrition can be applicable for the malnutrition of
women with some modifications. This frame recognizes and integrates the biomedical
consequences, as well as underlying socioeconomic, determinant and consequences of
malnutrition. It also indicates the potential basic cause of malnutrition that influences the
immediate and underlying causes. The relation between malnutrition in women and causes at
different level is illustrated in the conceptual model shown in Figure 1.
Fig 1: Causes associated with malnutrition among women in poor households
Out
com
e
Imm
edia
te
caus
es
Und
erly
ing
caus
es
Bas
ic c
ause
Malnutrition
Poor economic condition
Poverty
Poor sanitation Limited access of health service
No education Food insecurity in households
Maternal depletion
Illness Inadequate dietary intake

9
Food insecurity and dietary intake
Nutritional status of a person depends much on food consumption. Poverty is often defined in
terms of whether or not people get enough to eat [48]. Low food security and food intake is
one of the direct consequences of poverty. Intrahousehold allocation is the final step in the
chain of events that determines food availability to individuals; ultimately influencing the
health and nutritional status of the individual because systematic gender bias may influence
the food an individual receives [49]. The outcomes of poverty with other factors like cultural
norms regarding food taboos, food allocation within households, are often unfavorable to
women’s nutritional status [21]. Even women sometime sacrifice their food in family crisis. In
South India females eat less than males when food is scare [50]. Women with children in poor
society deprive themselves of food to feed their children [51]. As a consequence, 20-45%
women of childbearing age in developing countries do not eat WHO recommended 2250
Kcal/day [52]. Earlier studies in Bangladesh conclude that men receive more calories than
women [53], and girls receive proportionately fewer calories than others in the household
[54, 55]. Therefore, poor women cannot afford their regular daily requirement as a whole so it
is difficult for them to get additional calorie and other nutrient needed during special time like
pregnancy and lactation. This inadequate and insecure food and essential nutrients leads to
undernutrition, deterioration of physical growth and activities in women.
Sanitation and illness
Water and sanitation is very unsafe in areas where the poor live. The impact of inadequate
water and sanitation services falls primarily on the poor. Sanitation coverage in rural areas is
less than one third than in urban areas [1], and the condition is worse in poor rural areas. For
this reason water born diseases and parasites infestation is extremely prevalent among the
poor. Diarrhea spreads most readily in environments of poor sanitation where safe water and
latrine are unavailable. Poor socio-economic condition, deficiency in sanitary facilities,
improper disposal of human feaces, insufficient supplies of potable water, poor personal
hygiene, substandard housing, and lack of health education enhance parasites infestation.
These factors closely related with poverty and underdevelopment, and parasites infestation
can be labeled as ‘disease of poverty’ [56]. Though men and women from poor socio
economic status are both vulnerable to worm infection, adult women are found more infected
than adult men [57, 58]. Repeated infection and parasites in intestine render the host deprived
10
of the nutrients she ingests leading to general malnutrition and anemia [59, 60] and reduce
productivity [61, 62].
Access of health service
The poor, especially women are reluctant or unable to use the health services or facilities that
are available [63]. Cost, distance from home, lack of time from earning hour, lack of
permission and motivation are some reason behind this [21]. Most of the time illness of
women is under reported or despite being sick women often keep on working, particularly
households activities [64]. When a sick woman can no longer carry out her daily household
work efficiently, she is allowed for treatment. Also poor level of knowledge and less access to
information by poor women reduce access to health services and possibility of engaging in
health activities like family planning and antenatal care [21].
Education
Education influences access to knowledge, increases opportunities of income, development of
nutritional status, and access to benefits and resources [21]. Female education is considered as
an important life skill of benefit, to the health and well being of women and their offspring
[65, 66]. Female education can facilitate the development of women’s autonomy and
perceived self-efficacy, thereby strengthen their ability to take appropriate action to prevent or
solve health problem [67] and also promote taking of nutritious food to maintain healthy
status. It contributes to an increase in confidence, exposure to the outside world, and
decision making power within the household, among others [21, 68]. Women's education is
also directly associated with increased age of marriage [21, 68] and would prevent early
initiation of sexual activity and early childbearing. Women would also be able to make
choices regarding reproduction. All, these capabilities would have significant impact on
women's health status and nutrition, by affording better access to resources and information to
avoid health risks, recognize when she needs health care, and seek health services when
necessary [21].
Poor women are more at risk of malnutrition due to their illiteracy and low level of education
and knowledge. Although there are many activities have been undertaken by government and
international communities to educate people free of charge, a large number of poor women
never stepped into any educational institution and girl’s dropout is more than boys in poor
11
segment [64]. Family poverty may be the most important reason for holding girls back from
school or withdrawing them earlier. Social risk for girls is an underlying factor also [69].
Children without school enrollment and adult illiteracy is more common in poor segment
compare to non poor in Bangladesh [1].
6. BRAC and Ultra poor: CFPR/TUP Program
BRAC is a large private organization in Bangladesh concerned with development programs for
the extreme poor since its beginning in 1972. It has been working to build sustainable
livelihoods for the poor with a particular focus on women through a wide range of
development programs in the areas of microfinance, income and employment generating
programs, education, health, nutrition, and social development. The major targeted poverty
reduction activity is provision of microfinance, which through BRAC, now reaches more than
80% of the villages and has over 4 million loanees, mainly women. However, BRAC realized
that microfinance on its own is not as suitable an entry point and intervention for the extreme
poor, as it is working for the moderate poor. Since January 2002, BRAC has started a new
program for the extreme poor called Challenging the Frontiers of Poverty Reduction/Targeting
the Ultra Poor (CFPR/TUP) program. To target this extreme poor CFPR/TUP program is made
more systematic, intensive, and comprehensive covering economic, social, and health aspects.
This program seeks to challenge the frontiers of poverty reduction by addressing limitations of
most poverty reduction interventions to date.
CFPR/TUP program aims to build a more sustainable livelihood for the extreme poor, i.e. a
solid economic, social and human foundation in the lives of the extreme poor which would
allow them to overcome extreme poverty in a sustainable manner. This aim will be meet using
new program instruments- the asset transfer and stipend, and the dedicated training and social
development inputs, which are designed specially for the ultra poor. Participating in
microfinance programs is considered an important route that the TUP members may choose to
take to attain better livelihoods. It is also considered that TUP members can choose to invest
their accumulated savings into further enterprise expansion, or they can choose to maintain
their existing level of business operation and simply accrue savings with BRAC.
Targeting process

12
Since CFPR/TUP is mainly an asset transfer program, good targeting becomes extremely
important. Therefore, the program uses an integrated targeting approach, combines with a
range of targeting methodologies. Based on previous poverty literature, and BRAC’s own
programmatic experiences, a composite indicator list has been developed to identify the
eligible group of ultra poor. These are below:
Table 1. Targeting indicators used in CFPR/TUP and their rationale Targeting indicators Rationale
Exclusion indicators (needs to dissatisfy all)
If any member of the household has current NGO participation
Targeting those extreme poor who do not/can not participate in existing NGO programs
If any member of the household receives benefit from GoB programs (e.g. VGD)
Targeting those extreme poor who do not/can not participate in existing GoB programs
No physically able adult woman in household
This is a women-targeted enterprise program
Inclusion indicators (needs to satisfy any two)
Owned land of household including homestead less than 10 decimals
Landlessness and extreme poverty highly correlated, though not all landless are extreme poor
No adult working man in household Absence of able bodied male labor power is an important characteristic of extreme poor households
School-going aged children working Child labor is predominant in extreme poor households
Adult woman selling labor Adult woman selling labor is more prevalent in extreme poor households. This also signals the desperation and motivation of the household
No productive assets Extreme poor households tend not to own any productive assets
Source: BRAC Ultra poor program
On the process of targeting the ultra poor by CFPR/TUP program, districts are selected based
on various poverty maps and BRAC’s own programmatic experiences and knowledge. The
upzilas and the villages are then selected based on BRAC’s local knowledge of the areas.
Once villages are selected, the next step was to conduct participatory wealth raking (PWR)
exercises in these selected spots to cover all possible locations of a village where the extreme
poor live. These sub-village level locations are known as ‘spots’ and typically constitute of
100-120 households. In most cases these spots corresponded with a para within a village-

13
these are socio-physical partitioning of typical villages in Bangladesh. The community ranked
the 100-120 households by wealth, during a PRA (Participatory Rural Appraisal) meeting.
The households ranked in the bottom two wealth categories in spots are then surveyed using
simple questionnaire that basically collects information on the various targeting indicators
discussed above. Then a preliminary selection list is prepared, which is verified carefully for
final selection of ultra poor households. Thus the number of ultra poor households in spots
are not fixed; varied from 1 to 12 or more households, based on the density of poverty in
specific part of villages where PRA are conducted.
The program aims to cover 70,000 ultra-poor households during the period of 2002-2006.
14
Study population and method
1. Study population and data collection
The study was conducted in 4 districts, namely Netrokona, Kishoreganj, Madaripur and
Gopalganj. These districts have been covered by poverty reduction intervention of BRAC – “
Challenging the frontiers of Poverty Reduction- Targeting the Ultra Poor”.
Data were collected from women of ultra poor households who were selected for
intervention. CFPR/TUP program involved one adult woman from each selected households
in income generating activities like asset transfer, training, financial and technical support for
enterprise operation and so on. She received education on health and nutrition, human rights
and justice.
The survey was carried out on a cross-section of the target households. BRAC has selected
around 3,000 households from four districts with all characteristics of being ultra poor on the
basis of wealth ranking and some other criteria included in the development interventions
mentioned before. This study was conducted on a sample of these households.
Data were collected on broad issues related to malnutrition, like anthropometric
measurements, hemoglobin concentration, food and nutrient consumption, number of eggs of
hookworm, roundworm and Trichuris trichiuria in stool sample. Background socio-
economic and demographic information of the household were also collected through
structured questionnaire. Data were collected between July and September 2003.
One supervisor and twelve data collectors were responsible for three different types of data
collection. For anemia survey one supervisor and eight data collectors were given extensive
seven days training on survey technique, use of the questionnaire and specific measurements
such as anthropometry and hemoglobin concentration. In addition, three female data
collectors were given a seven-day training in the administration of the 24-hour recall method
for dietary survey. The person responsible for stool collection was trained at ICDDR,B,
Dhaka for collection and preservation technique. Intra- and inter-examination variations were
minimized through intensive repeated training.

15
2. Methods
Anthropometric measurements: Height and weight of the women were measured. Height
was taken in cm using a wooden board fixed with a plastic tape to the nearest 0.1cm
developed by BBS and Helen Keller International (HKI). Weight was taken using electronic
bathroom scale (UNISCALE) to the nearest 100 gm. BMI was calculated as the weight in kg
divided by the square of the height in meter and cutoff point of 18.5 was used to distinguish
chronic energy deficiency (CED) from the normal. The international criterion for
classification of CED, was followed: BMI <16.0, severe energy deficiency; BMI between
16.0-16.9, moderate CED; and BMI between 17.0-18.4, mild CED [70].
Anemia: Hemoglobin concentration was assessed by HemoCue photometer using disposable
microcuvettes and lancets. The assessment was done on a drop of capillary blood by finger
pricking through home visits. Each lancet and microcuvette was used to take blood from one
person only. HemoCue was checked everyday of the data collection period before start of the
field work for accuracy, using a standard microcuvette supplied by the manufacturer with
each machine. HemoCue Hemoglobin Photometer is considered as a reliable and highly
accurate device for measurement of hemoglobin concentration in field setting [71, 72].
According to WHO the cutoff value of hemoglobin concentration for anemia is 120g/l for non
pregnant women [73].
Intestinal parasites: Morning stool samples were collected from women of the sampled
households. The stool samples were tested at the Department of Microbiology and
Immunology, Bangabandhu Sheikh Mujib Medical University in Dhaka. The sample was
preserved within 6 hours after defecation because the study area was far from Dhaka. For
permanent fixation of the stool sample formaline-saline preservation method was applied
[74]. Samples were kept in room temperature and shady places.
The samples were analyzed to determine the number of ova/egg of Ascaris, hookworm and
Trichuris trichiura present per high power microscopic field using ‘Direct Microscopic Wet
Mounts’ method. The preparation of direct wet mount is a simple, efficient and widely used
procedure for examination of fresh and preserved stool [74]. The count the eggs of Ascaris,
hookworm and Trichuris trichiura, expressed as eggs per gram of stool. For the estimation of

16
the intensity, women were categorized as having light, moderate and high infection based on
the criteria set by the WHO Expert Committee [75]. For Ascaris infection the presence of 1-
4999 epg was regarded as light infection, between 5000-49999 as moderate infection and
50000 and more as a heavy infection. Mild hookworm infection was considered with the
presence of 1-1999 epg, moderate was between 2000-3999 and 4000 and more was heavy
infection, for Trichuris trichiura 1-999, 1000-19999 and >10000 were regarded as mild,
moderate and heavy infection respectively.
Food consumption: The 24-hour dietary recall method was used to collect data on food and
nutrients consumption. The data collectors used kitchen scales, standard utensils, such as
measuring spoons, cups, glasses and food models to help women for quantification of food
portions. Interviewers probed for information on food preparation procedures, cooking
method and recipe ingredients. A suitable questionnaire was prepared for recording of food
intake data.
Nutrient analysis: The collected data were edited and the open ended responses were coded.
Nutrient intakes were calculated for calorie, protein, fat, carbohydrate, calcium, iron, vitamin
A and vitamin C. The serving weight of different food items was calculated. Equivalent raw
food weight was calculated by using a conversion table for Bangladeshi foods formulated at
the INFS, Dhaka University [76]. The food quantities in gram were multiplied by the food
values of each food item and these were added together to estimate calorie, protein, fat,
calcium, iron, vitamin A and vitamin C based on the “Tables of nutrient composition of
Bangladeshi foods” [77]. Food intake was distributed according to group obtained from the
1995-96 Bangladesh National Nutrition Survey to assess the intake of different kinds of foods
for balanced diet [78].
Socioeconomic, demographic and health data
Data were collected using a structured pre-tested questionnaire. Socioeconomic, demographic
and health information included food security, land ownership, overall state of household
economy, education, age, marital status, water and sanitation, reproductive history, health
facilities and morbidity. To determine the household food security, a single question was asked
whether member of the households regularly had at least two meals per day or not. Formal
schooling was considered as indicator of education, if women were found with no formal
schooling they were asked about their signature capability. Environmental sanitation was
assessed by the place of disposal of household’s waste, latrine used by household members and

17
under-5 children. Reported morbidity of the women for last one month was taken into
consideration.
3. Sample size
Sample size calculation was based on expected change in anemia prevalence. The total
number of required individual was calculated on the basis of the prevalence of anemia in non-
pregnant women as estimated by the 1999 national anemia survey of IPHN/HKI (that is
45%). The following criteria were considered in calculating the total number of required
households:
Present level of anemia prevalence : 45%
Expected level of reduction : 25%
Level of confidence (α) : 95%
Statistical power : 80%
Approximate cluster design effect : 1.5
Allowance for dropout : 10%
After considering the above criteria a total number of 436~450 households from one region
(Netrokona and Kishoregong) and another 450 households from other region (Madaripur and
Gopalgang) identified as ultra poor households were considered adequate for assessing the
nutritional status of ultra poor women with the expectation of getting one women per
household. Therefore, the total number of households to be surveyed was 900. However, 978
households were included in the survey.
4. Sampling technique
A cluster sampling method was used to identify the target households. Equal number of
households from BRAC program (225+225+225+225) were initially selected from the four
BRAC regional offices in the districts; Netrokona, Kishoreganj, Madaripur, and Gopalganj.
Thus, a total of 900 households were selected from four regions. Area offices were selected
from each region at random, based on the household size of area offices. For ease of
operationalization a list of area offices with more than 120 households was prepared. Out of

18
26 area offices of four region/districts, 14 area offices were found with 120 households and
more. Eight area offices, two from each region were then selected randomly. Second
randomization was done at area office level by selecting the spot. This was aimed to find out
the selected households for data collection.
In case the required number of households was not found in an area office, the remaining
households were selected from the next area office.
All selected women from these ultra poor households were included for anemia and
anthropomtric survey. The pregnant women were excluded. For food consumption survey, a
sub sample of 50 households was included randomly from each district. Thus, food
consumption of women was assessed in a total of 200 households.
The number of women examined for different indicators is shown in Table 2.
Table 2. Number of households and women assessed for different indicators Sample size Issues Total Socioeconomic and demographic 978 Anthropometry 896 Anemia 889 Parasites infestation 473 Food and nutrient consumption 200
5. Data quality and statistical analysis
Supervisor traveled around during the entire data collection period and monitor (improve, if
necessary) the quality of the activities carried out by the three types of data collection teams.
The quality of data was ensured by checking the filled-out questionnaire everyday after field
work by the supervisor and field manager. Food data editing and calculation were done by
interviewers. All food identification, coding and nutrient conversions were checked for
accuracy by the researcher at head office. Field Manager and researcher visited the field
locations frequently to monitor the data collection and for any troubleshooting.
All completed questionnaires were checked for inconsistency and other errors at field level by
the supervisor before sending to the BRAC/RED Dhaka office for computerization. A coding
manual and data entry layout were prepared by a trained data entry clerk at RED under a
close supervision of the researcher. Questionnaire was coded and thereafter data were entered
using SPSS WIN 10.0 software. The same software was used for data cleaning and analysis.

19
Chi-square test was used to test associations between categorical variables and t tests were
used to compare means between subgroups of continuous variables. Linear regression model
was used for multivariate analysis. A p values less than 0.05 were considered as statistically
significant for all tests of association.
Ethical consideration
The study protocol was reviewed and approved by the ethical review committee of
Bangladesh Medical Research Council (BMRC). Verbal consent was obtained from
household heads to be included in the survey. However, written consent was taken from all
women for blood testing and stool collection. Any woman found to have a hemoglobin
concentration indicative of anemia was advised to take iron-rich food and seek medical care.

20
Results 1. Background characteristics
A total of 978 households were visited. Anthopometric and hemoglobin measurement were
available from 896 and 889 women respectively from these surveyed households.
Comparison of some background characteristics, which were considered as underlying
determinants of malnutrition, was presented between surveyed and non-surveyed women. The
two groups were comparable, except in education (Table 3). Non-surveyed women had
significantly lower signature capability compare to surveyed women (p<0.01).
Underlying determinants were found prevalent in the surveyed population. More than one
fifth of women could not afford two meals per day. Three percent had any formal schooling,
though around sixty percent could sign. Sanitation coverage was found low in the household
of the poor women and only 15% of had access to sanitary latrine. Despite, the fact that they
were the poorest of the poor one fourth perceived that their household economic condition
improved in the last one year. About half of the currently lactating women received antenatal
care and 19% reported that they took iron tablet during their last pregnancy (Table 3).

21
Table 3. Comparison of background characteristics considered as underlying cause of malnutrition among surveyed and not surveyed women in ultra poor households.
Characteristics Prevalence (%) Surveyed
n=896 Non surveyed
n=82 p1
Households food security Had two meals/day
Yes No
78.2 21.8
85.4 14.6
0.13
Education
Can sign Can’t sign Year of schooling 1-5
>5
61.2 35.8
1.3 1.4
39.0 61.0
- -
<0.01
Sanitation Disposal of household’s waste in specific hole Use of sanitary latrine Use of sanitary latrine to dispose of excreta of u- 5 child
52.5 14.3 14.5
52.4 17.0 19.0
0.99 0.49 0.44
Economic condition Land ownership Landless
48.9
42.7
0.28 Perceived economic condition last one year
Improved No change
Deteriorate
24.9 60.3 14.8
30.5 56.1 13.4
0.54
Health service Had health service within the village
50.4
Attended ANC 48.8 Iron intake during pregnancy 18.8 Reproductive history Total number of pregnancy
0 1-2
>3
4.6 32.0 63.4
1 Chi-square Multiple determinants related to food security, household demography, economic status,
education, health, sanitation are known to be associated with malnutrition. All the
determinants were prevalent among the surveyed women.

22
2. Food and nutritional status
2.1. Nutritional status
The nutritional status of women was assessed by anthropometrics and hematological indices.
These women were found to be short and underweight. The mean height and weight was
148cm and 40kg respectively. About one third of women were found chronically
malnourished (height <145cm). According to BMI (<18.5 kg/m2) more than half of women
were chronic energy deficient. Among these energy deficient women, 14% were severely
energy deficient (<16.0 kg/m2). Anemia was found in about half of the women of study
population (Table 4).
Table 4: Distribution of nutritional status among women Anthopometric index (n=896) Height (cm)1 Categories of height (%)
- <140.0 cm - 140.0-144.9 cm - >145.0 cm
Weight (kg) 1 BMI (kg/m2)1
148.3+5.9 (122.2-169.1)2
6.1
22.7 71.2
40.3+5.8
(26.2-63.1)2
18.4+2.3 (12.9-31.1)2
CED prevalence % Severity of CED %
- BMI 17.0-18.4 kg/m2 - BMI 16.0-16.9 kg/m2 - BMI <16.0 kg/m2
56.3
30.0 12.8 13.5
Hematological index (n=889) Hemoglobin (g/l)1 Anemia prevalence %
119.5±16.5
47.6 1 Mean±SD; 2 Range Thus women of the ultra poor household were found to have high prevalence of malnutrition.
23
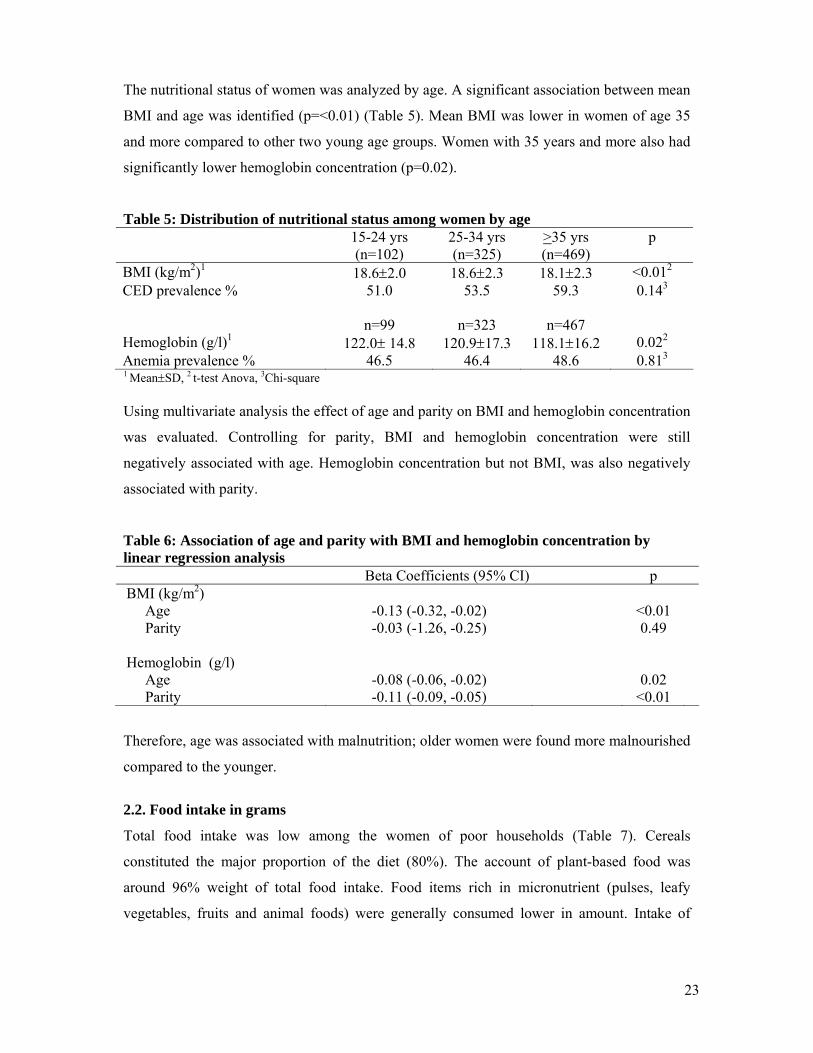
The nutritional status of women was analyzed by age. A significant association between mean
BMI and age was identified (p=<0.01) (Table 5). Mean BMI was lower in women of age 35
and more compared to other two young age groups. Women with 35 years and more also had
significantly lower hemoglobin concentration (p=0.02).
Table 5: Distribution of nutritional status among women by age 15-24 yrs
(n=102) 25-34 yrs (n=325)
>35 yrs (n=469)
p
BMI (kg/m2)1 18.6±2.0 18.6±2.3 18.1±2.3 <0.012 CED prevalence % 51.0 53.5 59.3 0.143
n=99 n=323 n=467 Hemoglobin (g/l)1 122.0± 14.8 120.9±17.3 118.1±16.2 0.022 Anemia prevalence % 46.5 46.4 48.6 0.813 1 Mean±SD, 2 t-test Anova, 3Chi-square Using multivariate analysis the effect of age and parity on BMI and hemoglobin concentration
was evaluated. Controlling for parity, BMI and hemoglobin concentration were still
negatively associated with age. Hemoglobin concentration but not BMI, was also negatively
associated with parity.
Table 6: Association of age and parity with BMI and hemoglobin concentration by linear regression analysis Beta Coefficients (95% CI) p BMI (kg/m2) Age Parity
-0.13 (-0.32, -0.02) -0.03 (-1.26, -0.25)
<0.01 0.49
Hemoglobin (g/l) Age Parity
-0.08 (-0.06, -0.02) -0.11 (-0.09, -0.05)
0.02
<0.01
Therefore, age was associated with malnutrition; older women were found more malnourished
compared to the younger.
2.2. Food intake in grams
Total food intake was low among the women of poor households (Table 7). Cereals
constituted the major proportion of the diet (80%). The account of plant-based food was
around 96% weight of total food intake. Food items rich in micronutrient (pulses, leafy
vegetables, fruits and animal foods) were generally consumed lower in amount. Intake of
24
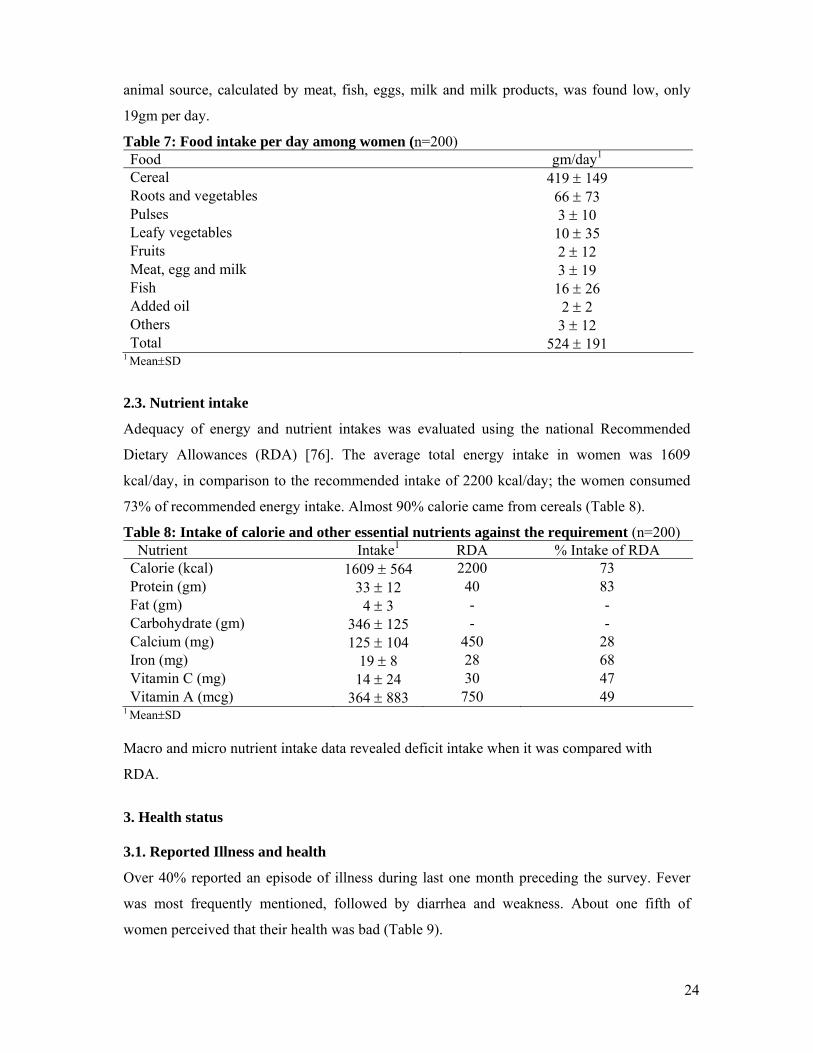
animal source, calculated by meat, fish, eggs, milk and milk products, was found low, only
19gm per day.
Table 7: Food intake per day among women (n=200) Food gm/day1
Cereal 419 ± 149 Roots and vegetables 66 ± 73 Pulses 3 ± 10 Leafy vegetables 10 ± 35 Fruits 2 ± 12 Meat, egg and milk 3 ± 19 Fish 16 ± 26 Added oil 2 ± 2 Others 3 ± 12 Total 524 ± 191
1 Mean±SD
2.3. Nutrient intake
Adequacy of energy and nutrient intakes was evaluated using the national Recommended
Dietary Allowances (RDA) [76]. The average total energy intake in women was 1609
kcal/day, in comparison to the recommended intake of 2200 kcal/day; the women consumed
73% of recommended energy intake. Almost 90% calorie came from cereals (Table 8).
Table 8: Intake of calorie and other essential nutrients against the requirement (n=200) Nutrient Intake1 RDA % Intake of RDA Calorie (kcal) 1609 ± 564 2200 73 Protein (gm) 33 ± 12 40 83 Fat (gm) 4 ± 3 - - Carbohydrate (gm) 346 ± 125 - - Calcium (mg) 125 ± 104 450 28 Iron (mg) 19 ± 8 28 68 Vitamin C (mg) 14 ± 24 30 47 Vitamin A (mcg) 364 ± 883 750 49
1 Mean±SD Macro and micro nutrient intake data revealed deficit intake when it was compared with
RDA.
3. Health status
3.1. Reported Illness and health
Over 40% reported an episode of illness during last one month preceding the survey. Fever
was most frequently mentioned, followed by diarrhea and weakness. About one fifth of
women perceived that their health was bad (Table 9).

25
Table 9: Description of health status of women Prevalence % Reported episode of illness last one month (n=896) Common reported illness/condition (n=389)
Fever Diarrhea
Weakness
43.4
60.2 8.5 7.7
Perception regarding health status (n=896)
Good Average Bad
47.6 30.3 22.1
3.2. Parasites infestation
Over all sixty six percent women were suffering from any kind of parasites infection. The
prevalence and intensity of Ascaris was more common compare to other two parasites;
hookworm and T. trichiura. Around quarter of women had infestation with hookworm (Table
10).
Table 10: Prevalence (%) of parasites infestation among women (n=473) Prevalence (%) Any parasites 65.5 Ascaris
57.9
Intensity Light Moderate
High
51.1 44.9 4.0
Hook worm
23.0
Intensity Light Moderate
High
71.6 26.6 1.8
T. trichiura
13.7
Intensity Light Moderate
High
89.2 10.8
- 4. Determinants associated with malnutrition
4.1. Determinant associated with CED and BMI
We examined all the available associated determinants with CED prevalence and BMI, and
reported illness, perceived health status, signature capability and sanitation were found

26
significant (Table 11). Women with any type of reported illness during last month preceding
the survey, suffered from more CED compared to those who did no report illness (p<0.01).
Higher mean BMI was observed in women who reported good or average health status
compared to those, whose health status was rated bad (p<0.01). Women from households who
used sanitary latrine were found to have a higher mean BMI than those from households using
open place for defecation, but association was approached to be significant (p=0.06). A
greater proportion of women who cannot sign had BMI under 18.5 kg/m2 compared to those
who can sign (p<0.01). Since percentage of schooling was very low, they were included in the
group of ‘can sign only’ during analysis. Parasites infestation, calorie consumption per day,
reported household food insecurity and perceived economic condition were not found
significantly associated with energy deficiency.
Table 11: Important determinants associated with CED and BMI Determinants CED BMI Prevalence% p1 Mean ± SD p2 Reporting episode of illness
Yes No
64.2 50.2
<0.01
18.0 ± 2.1 18.6 ± 2.3
<0.01
Perceived health status Good Average
Bad
49.9 59.9 65.0
<0.01
18.8 ± 2.4 18.1 ± 1.8 17.8 ± 2.3
<0.01
Education Cannot sign Can sign only
63.9 52.0
<0.01
18.0 ± 2.3
18.6 ± 2.2
<0.01
Use of latrine Sanitary
Open /no fixed place
50.8 57.2
0.18
18.7 ± 2.3 18.3 ± 2.3
0.06
1 Chi-square; 2 t-test, Anova
4.2. Determinants associated with anemia and hemoglobin concentration
Among all the determinants; education, sanitation, perceived economic condition and iron
tablet intake were found to be associated with anemia prevalence (Table 12). Anemia
prevalence was significantly more common in the women without signature capability
compared with the group of women who could sign (p<0.01). The type of latrine was
approached to be significant with hemoglobin concentration (p=0.06). Hemoglobin
concentration was higher among women who used sanitary latrine at home. But anemia
prevalence was found significantly lower among women who used latrine to dispose their
under 5 children’s excreta (p=0.04). Anemia prevalence was lower in women who perceived

27
improved economic condition (p=0.06). Women who reported that they had taken iron tablet
had higher hemoglobin concentration (p=0.05). Reported illness, perceived health status,
prevalence of intestinal parasites and household food security were not significantly related
with either concentration of hemoglobin or presence of anemia.
Table 12: Important determinant associated with anemia and hemoglobin concentration Determinants Anemia Hemoglobin (g/l) Prevalence% p1 Mean ± SD p2 Education Cannot sign Can sign only
53.1 44.5
0.01
117.6 ± 16.8 120.6 ± 16.2
<0.01
Use of latrine Sanitary
Open /no fixed place
42.9 48.4
0.25
122.0 ± 16.5 119.1 ± 16.5
0.06
Disposal of excreta under 5 children Latrine
Not latrine
36.4 51.5
0.04
120.2 ± 19.7 118.7 ± 15.3
0.52
Perceived economic condition Improved No change
Deteriorate
43.0 47.5 55.7
0.06
121.1 ± 15.7 119.3 ± 17.1 117.9 ± 15.4
0.19
Iron tablet intake Yes
No
36.7 48.3
0.08
123.5 ± 15.4 119.2 ± 16.6
0.05
1 Chi-square; 2 t-test Anova Thus, signature capability was found to be associated with nutritional status, both with
chronic energy deficiency and anemia. The type of latrine was also associated with BMI and
hemoglobin concentration; however, parasites infestation was not found significantly
associated with hemoglobin concentration and BMI. No significant association was observed
between food intake and nutritional status.
28
Discussion
Summery findings
Malnutrition was prevalent among the women in the ultra poor households. A high proportion
of the women were chronic energy deficient as well as anemic. The diet of the ultra poor
women is not only less in quantity but also poor in quality; cereals alone contribute 90% of
calorie. Infection of Ascrais, hookworm and Trichuris were found to be prevalent among
these women. Almost none of them had any formal education, and they had limited access to
health services. Sanitation coverage was also found to be very low. Some factors were
identified as important determinants for the prevalence of anemia and chronic energy
deficiency.
Limitation
To select women a cluster sampling procedure were used. This procedure was applied to
ensure the collection of sufficient amount of sample in each area office. This study was not
based on random sampling due to some programmatic and ethical issues, because program
intervention, which was held until our data collection was over in selected area offices.
Program did not have to wait to start work in all other area offices (18 out of 26) for the
completion of our data collection. Sample was randomized by spot rather than individual
households at area office level, representing a compromise for logistic needs. Data were
collected during rainy season (July-August) when movement in rural Bangladeshi village is
difficult. Availability of women at households and their consent to participate determined
their inclusion in study. In ultra poor households, many women were engaged in work outside
for survival. Consequently, we missed some women for anthropometrical and hemoglobin
assessment. All the background characteristics were comparable between surveyed and lost to
follow up group except education. Women who we missed had significantly less signature
capability than surveyed women (p<0.01). As signature capability was associated with
nutritional status, our results might underestimate prevalence of malnutrition.
Though same indicators were used to select all ultra poor households, it is difficult to claim
wide generalizability of our results in different settings where cultural and traditional
practices vary widely in a country like Bangladesh.
29
Nutritional status
The results of this study showed that women were shorter and more chronic energy deficient
compare to nationally representative sample of Bangladesh. The average height (148.3cm)
and BMI (18.4 kg/m2) of the women in present study was lower than the national average of
150.4cm and 19.3kg/m2 [25] and also another study in rural Bangladesh even when they
categorized the women by socioeconomic condition [79]. The percentage of CED prevalence
was found higher (56%) than the national average of 45% [25]. Present study reported a
higher percentage of chronic malnutrition (29%) indicating height less than <145cm,
compared with 24% find in study among rural Bangladeshi women [80].
The prevalence of anemia was found to be 48%. This figure was substantially higher than
national and rural average values find among the Bangladeshi women (33%) [81, 82]. Our
hemoglobin measurement procedure by HemoCue photometer was similar to national
surveys.
Nutritional status by age
A significant deterioration of women’s nutritional status was observed in relation to age,
women aged 35 years and above were more malnourished compared with younger women.
Our findings were similar to other study in Bangladesh [79]. Mean hemoglobin concentration
showed similar picture, which was consistent with the findings of previous studies in
Bangladesh [60, 83]. One explanation, the association between age and nutritional status can
be the cumulative impact of gender inequalities in intra house food distribution and work load
over the life cycle [84, 85]. Another explanation for this age relation is the hypothesis of
maternal depletion, where repeated reproductive cycle in thought to be the reason of
deterioration of nutritional status [86, 87]. Number of pregnancies considered as an indicator
of maternal depletion. The associations between hemoglobin concentration and parity and age
have been observed in some studies in other low-income societies [88, 89], and was also
shown in our study.
Food and nutrient intake
Women reported low average energy intakes at only 1609kcal/d, which was even lower than
that in average intake of national rural bottom 20% reported by Bangladesh Bureau of

30
Statistics (1798 kcal/day) [1]. This amount of energy is required for basal metabolism, just for
survival [90]. The cereal sources supplied more than 90% of the energy and this was higher
than previous surveys in Bangladesh [78, 91]. This percentage confirmed high imbalance in
food intake, whereas it should be 56% for balanced diet [92]. Consequently, average calorie,
protein, vitamin A, vitamin C, calcium and iron all fell below the RDA. Although low food
and nutrient intake may be a true reflection of insufficiency of food among the women, the
possibility of underreporting during the single 24h recall should be considered. Twenty four
hours recall can overcome many of the problems of recall: lapse of memory, uncertainty about
the types or amounts of foods eaten, poor motivation, and unawareness of food intake [93,
94]. The actual weighing method seems to be more reliable to assess dietary intake among the
ultra poor households.
Health status
Around 40% of women were found to have any type of reported illness since last one month.
A major proportion of women reported that they were feeling good or average with their
health. The poor may have high rates of infection due to poor sanitation or high rates of
reproductive tract infections, gynecological morbidity, or sexual transmitted disease [64, 95].
Female illness is frequently underreported due to negligence and stigma [21, 96]. This may be
the reason fever was reported as most common illness (60%) rather than any specific illness,
since fever is a symptom of any infection in body.
A. lumbricoides, hookworm and T.Trichuiris were highly prevalent in the women studied.
This gross prevalence were higher than other previous study in rural Bangladesh (35.8%)
[60]. Ascaris (60%) and hookworm infestation (23%) was more prevalent compared to 39%
and 1.5% respectively among rural women in Bangladesh [60]. The level of infestation in our
study may be indicative of major problem in basic sanitation. In places where sanitation is
extremely poor a high prevalence of parasitic infection is suspected [57, 97]. A recent study in
rural Bangladesh on selected female handicrafts worker show the prevalence of any parasites
24%, Ascrais, hookworm and T. Trichuiris is 21%, 8% and 1.3 respectively, which is
remarkably lower than our study [98]. It is possibly due to the use of latrine. Used of sanitary
latrine is reported 79% by Khan et al while our result was only 15%.
31
Prevalence of underlying determinants of malnutrition
This study shows women in ultra poor households were in very disadvantaged position in
food insecurity, low literacy level, poor sanitation and low access of health service. One-
quarter households did not feel secure that they could mange two meals per day. To determine
the state of household food security, we did not use special tool; only members of the
households were assed to take into consideration whether they can afford at least two meals
per day or not. Use of standard food insecurity measurement tool might be helped to show a
different scenario of food insecurity in ultra poor households.
Almost all women had no formal schooling. They were assessed for education by their
signature capability. Result showed that 60% women could do signature though they did not
get any formal education. The reason might be being the household head and only member
earning money in the family, they had to work outside and required signature to draw wage.
The sanitation situation was also very poor in the ultra poor households. Though the national
sanitary latrine coverage for rural area of Bangladesh is low (41%), still ultra poor households
are far behind the national coverage [99]. Deficient sanitation and hygiene are responsible for
7% of all deaths and 8% of all disability-adjusted life years (DALYs) lost in developing
countries [100]. Specifically poor sanitation increases the risk of oral-fecal transmission of
diarrheal pathogens and intestinal parasites [101-103]. In our study we found diarrhea as
second common reported illness (9%) among the women of ultra poor households, which may
be due to poor hygiene and inadequate sanitation.
Our study result showed limited health care facilities among the poor women, while ANC
coverage and iron tablet intake was lower compared to national average of 77% [104] and
33% [25] respectively. Generally access to health care facilities was limited for women in
poor households due to lack of transport, women’s lack access of family money, less
autonomy of decision-making [63].
Determinants associated with malnutrition
Malnutrition is a complex situation. The causes or determinants of malnutrition are numerous.
We postulate that there are certain determinants associated with malnutrition, which are
common in ultra poor households. Some factors such as illness, non-signature capability,
32
unsanitary latrine use were found as important determinants for the difference in prevalence
of malnutrition.
Reported episode of illness and perceived health status was found to be associated with
chronic energy deficiency as expected. Since BMI is considered as an indicator of good
health, it is more likely that malnourished women would suffer from frequent illness compare
to nourished women. Other researchers also claim that individual with low BMI suffer greater
illness [70, 105, 106]. It should be mentioned that the direction of causality between BMI and
illness is difficult to determine. While low BMI may increase the risk of morbidity, chronic
illness is frequently considered as a cause of low BMI.
The positive association between education and nutritional status of women in Bangladesh
has been well documented [60, 79, 80, 83]. Our results indicated that prevalence of
malnutrition was significantly higher among the women who could not sign. This observation
cannot be compared with other results because previous studies compare between years of
schooling. As mentioned earlier that almost all of our study population had no schooling.
Signature capability of ultra poor women can be indicators of their involvement in income
generating activities outside home that are generally associated with food security and
nutritional status.
Use of sanitary latrine was associated with anemia and energy deficiency and similar findings
are reported in other studies conducted in different places [107-109]. It may be explained by
the well-established relationship between poor sanitation and malnutrition. Poor sanitation has
been associated with increased risk of infection [110] and increased malnutrition; improved
sanitation was related to lower risk of malnutrition [111].
We did not find significant association between parasites infestation and anemia. Some earlier
studies in Bangladesh [83], Tanzania [112] and Vietnam [57], show no association between
parasites and anemia prevalence. The low prevalence of hookworm in these studies is
described as the possible reason for the lack of association though in our study we found quite
high prevalence of hookworm infestation (23%). Whilst there exist an association between
parasites and anemia, the causes of anemia are known to be complex and multi-factorial
[113]. Anemia can be result of one or a combination of some major factors like: nutrient

33
deficiency including iron, folic acid, vitamin C, copper, vitamin B2 and vitamin B12 [90];
chronic iron losses during menstruation or due to ulcer and parasitic infestation [90, 114];
chronic and repeated infections and vitamin A deficiency [115, 116]. Therefore, probably in
our study only parasites infestation may not explain anemia.
The diet may play an important role on malnutrition but we were unable to assess its role with
the current data. A single 24-hours dietary recall may be poor estimate of long term effect of
dietary intake on malnutrition and it decreases the strength of association. This can also be
explained by the high prevalence of calorie deficiency among the women, while 86% women
were deficient in calorie intake, no statistical difference was found between deficient and non-
deficient group in terms of malnutrition. Several studies have documented association
between food security and, nutrition and health [117-119]. Our research linked the status of
household’s food security to women’s nutritional status but we did not get any strong
association, may be due to use of less reliable measuring tool.
Conclusion
In conclusion, it should be emphasized that a large proportion of women in the studied ultra
poor households in rural Bangladesh suffered from chronic energy deficiency and anemia.
The direct effects of poverty that results in low income, limited education, poor sanitation and
illness have been associated with poor nutritional outcome in ultra poor households. Though
malnutrition is a complex social and public health problem, knowledge of these factors may
help to facilitate implementation of health interventions along with other poverty reduction
activities designed to reduce malnutrition in BRAC ultra poor program.
Future research plan
We will conduct repeat survey in same households and same subject after pilot phase of
program to assess the nutritional change, present study result will be used as baseline
information and the nutritional change will be considered as an impact of BRAC CFPR/TUP
program. The schedule time of survey is July 2005.

34
References
1. BBS. Report of household income and expenditure survey, 2000. 2003, BBS: Dhaka. 2. Pe˜na, M. and J. Bacallao. Malnutrition and poverty. Annu Rev Nutr, 2002; 22:241-
53. 3. BBS/UNICEF, Report of the national low birth weight survey-2003 (Unpublished).
2005. 4. ACC/SCN. Low Birth Weight: Report of a meeting in Dhaka, Bangladesh on 14-17
June 1999. In Nutrition policy paper #18, ed. J. Pojda and L. Kelly. 2000. ACC/SCN in collaboration with ICDDR’B: Geneva.
5. Hashemi, S., Those left behind: a note on targeting the hardcore poor. Who Needs Credit? Poverty and Finance in Development, ed. G. Wood and I. Sharif. 1997, Dhaka: UPL.
6. Hulme, D. and P. Mosley. Finance against poverty. Vol. 2. 1996, London: Routledge. 7. Rahman, A.. On reaching the hard core poor: redefining the NGO strategy, In
Bangladesh Institute of Development Studies. 1998, BIDS: Dhaka. 8. World Bank. World development report 1990: poverty. 1990. Washington DC:
Oxford University Press. 9. UNDP. Human development report 2003 www.hdr.undp.org/report/global/2003/
indicatory/cty_f_BGD.html (accessed on 7th December 2004). 2003. 10. Rahman, H. and M. Hossain. Rethinking rural poverty. Bangladesh as a case study.
1995. Dhaka: University Press Limited. 11. Husain, A.. Poverty alleviation and empowerment: the second impact assessment
study of BRAC’s rural development program. 1998, BRAC: Dhaka. 12. Rahman, A. and A. Razzaque. On reaching the hard core poor: some evidence on
social exclusion in NGO programs. The Bangladesh Development Studies, 2000; XXVI(1): 1-36.
13. Khandker, S. Fighting poverty with microcredit: experience in Bangladesh. 1998. New York: Oxford University Press for the World Bank.
14. Morduch, J. Does microfinance really help the poor? New evidence from flagship programs in Bangladesh (Unpublished). 1998. BRAC.
15. Wagstaff, A. and M. Claeson. The Millennium Development Goals for health: rising to the challenges. 2004. World Bank: Washington, DC.
16. Wagstaff, A.. Poverty and health sector inequalities. Bull WHO 2000; 80(2): 97-105. 17. WHO/CMH. Improving health outcomes of the poor: the report of working group 5 of
the commission on macroeconomics and health. Online: http://www3.who.int/whosis/cmh/cmh_papers/e/pdf/wg5_summary.pdf. 2002.
18. ACC/SCN. Fifth Report on the World Nutrition Situation. Nutrition for improved development outcomes. 2004. United Nations System Standing Committee on Nutrition: Geneva.
19. World Health Organization. Obesity: preventing and managing the global epidemic. Report of WHO consultation on obesity. In Technical Report Series. 894. 2000, WHO: Geneva.
20. Ransom, E. and L. Elder. Nutrition of women and adolescent girls: why it matters. 2003. Population Research Bureau. www.prb.org/Print Template.cfm?Section=PRB&template=/ContentManagement/ContentDisplay.cfm&ContentID=8975#box1. Access on Feb 2, 2005.
21. WHO/SEARO. Women of South-East Asia. A health profile. 2000. World Health Organization. Regional Office for South-East Asia: New Delhi.

35
22. Lipton, M. and M. Ravallion. Poverty and policy. Handbook of development economics, ed. J. Behrman and T. Srinivasan. Vol. III. 1995. Elsevier Science.
23. ACC/SCN. Fourth report on the world nutrition situation. UN Standing Committee on Nutrition, Geneva. 2000. In collaboration with the International Food Policy Research Institute: Washington.
24. Tinker, A.., P. Daly, and C. Green. Women’s health and nutrition: making a difference, in World Bank discussion paper 256. 1994, The World Bank: Washington, DC.
25. NIPORT. Bangladesh demographic and health survey 1999-2000. 2001, National Institute of Population Research and Training: Dhaka and Calverton.
26. Haddad, L., et al., Food security and nutrition implications of intrahousehold bias: a review of literature. In FCND Discussion Paper No. 19. 1996, IFPRI: Washington, D.C.
27. WHO/UNICEF/UNFPA. Maternal mortality in 2000: estimates developed by WHO, UNICEF and UNFPA. Online: http://www.who.int/reproductive-health/publications/maternal_mortality_2000. 2000.
28. King, J. The risk of maternal nutritional depletion and poor outcomes increases in early or closely spaced pregnancies. J Nutr, 2003; 133:1732S-1736S.
29. Fishman, S., L. Caulfield, and M. de Onis. Comparative risk assessment: Underweight status. Comparative Quantification of Health Risks: Global and Regional Burden of Disease Attributable to Selected Major Risk Factors, ed. M. Ezzati, et al. 2004, Geneva: World Health Organization.
30. Konje, J. and O. Ladipo. Nutrition and obstructed labour. Am J Clin Nutr, 2000; 72: 291S-7S.
31. Stoltzfus, R., L. Mullany, and R. Black. Iron deficiency anaemia. In Comparative quantification of health risks: the global burden of disease due to 25 selected major risk factors. 2003. Cambridge: Harvard University Press.
32. UNICEF/UNU/WHO/MI. Preventing iron deficiency in women and children: background and consensus on key technical issues and resource for advocacy, planning and implementing national programmes. International Nutrition Foundation. 1999: Boston, MA.
33. Ahmed, F. Anaemia in Bangladesh: a review of prevalence and aetiology. Public Health Nutrition. 2000; 3(4): 385-393.
34. Skikne, B. Current concepts in iron deficiency anemia. Food Rev Int. 1988; 4:137-173.
35. Ross, J. and S. Horton. Economic consequences of iron deficiency. 1998. Micronutrient Initiative: Ottawa, Canada.
36. Fernando, E.V. The consequences of iron deficiency and anemia in pregnancy. Nutrient regulation during pregnancy, lactation, and infant growth, ed. A.. Lindsay, et al. 1994. New York: Plenum Press. 127-40.
37. Majid, E. Selected major risk factors and global and regional disease. The Lancet, 2002; 360(9343):1347-60.
38. Nokes, C. The effects of iron deficiency and anemia on mental and motor performance, educational achievement, and behavior in children. 1998. Washington DC: ILSI Press.
39. Tiwari, B. Country report on India. In Regional consultation on nutritional status of adolescent girls and women of reproductive age. 1997 November 26-28. New Delhi, India: WHO Regional Office for South-East Asia, 1998.
40. World Health Organization. Global database on child growth and malnutrition. 1997. World Health Organization programme of nutrition: Geneva.
36
41. WHO/SEARO. Report of the third evaluation of implementation of the health for all strategies - South-East Asia Region. 1997. WHO Regional Office for South-East Asia: New Delhi.
42. World Health Organization. The world health report 1997:conquering suffering, enriching humanity. 1997. World Health Organization: Geneva.
43. WHO/SEARO. Regional health report 1998: focus on women. 1998. WHO Regional Office for South-East Asia: New Delhi.
44. Osmani, S. and A. Sen. The hidden penalties of gender inequality: fetal origins of ill-health. Economics and Human Biology. 2003; 1(1):105-21.
45. Pelletier, D. and E. Frongillo. Changes in child survival are strongly associated with changes in malnutrition in developing countries. J Nutr, 2003; 133(1):107-19.
46. Gillespie, S. and L. Haddad. Attacking the double burden of malnutrition in Asia and the Pacific. 2001. Asian Development Bank: Manila.
47. UNICEF. The state of the world's children. 1998. Geneva: Oxford University Press. 48. Lampietti, J. and L. Stalker. Consumption expenditure and female poverty: A review
of the evidence. In Policy research report on gender and development. Working Paper Series No. 11. 2000. The World Bank.
49. Van Esterik, P. Intra-family food distribution: its relevance for maternal and child nutrition. In Prepared for the maternal and child health amendment to the Cornell Nutritional Surveillance Program, No. 18. 1984.
50. Behrman. JR and Deolalikar. AB. The intrahousehold demand for nutrients in rural South India. J Human Resources, 1990; 25(4):665-696.
51. McIntyre, L. Do low-income lone mothers compromise their nutrition to feed their children? JAMC, 18 MARS 2003; 168 (6): 686-691.
52. Smyke, P. Women and health. 1991. London: Zed Books Ltd. 53. Carloni, A.. Sex disparities in the distribution of food within rural households. Food
Nutr Bull, 1981; 7:3-12. 54. Pitt, M., M. Rosenzweig, and N. Hassan. Productivity, health and inequality in the
intrahousehold distribution of food in low-income countries. Am Econ Rev, 1990; 80(5):1139-1156.
55. Brown, K., et al. Consumption of foods and nutrients by weanlings in rural Bangladesh. Am J Clin Nutr, 1982; 36:878-889.
56. Cooper, E. Intestinal parasitoses and the modern description of diseases of poverty. Trans R Soc Trop Med, 1991; 85:168-170.
57. Verle, P., et al. Prevalence of intestinal parasitic infections in northern Vietnam. Trop Med Int Health, 2003; 8(10):961-965.
58. Traub, R., et al. The prevalence, intensities and risk factors associated with geohelminth infection in tea-growing communities of Assam, India. Trop Med Int Health, 2004; 9(6): 688-701.
59. Santiso, R. Effects of chronic parasitosis on women's health. Int J Gynaecol Obstet, 1997; 58(1):129-36.
60. Hyder, S. M. Z., S. Chowdhury, and A. Chowdhury. Prevalence of intestinal parasites in healthy adult and adolescent population of a rural community. Research Monograph Series 12. 1998, BRAC: Dhaka.
61. Gilgen, D., C. Mascie-Taylor, and L. Rosetta. Intestinal helminth infections, anaemia and labour productivity of female tea pluckers in Bangladesh. Trop Med Int Health, 2001; 6(6):449-457.
62. Latham, M. Dietary and health interventions to improve worker productivity in Kenya. Tropical Doctor, 1983; 13:34-38.

37
63. Berhane, Y., et al. Women's health in a rural setting in societal transition in Ethiopia. Soc Sci Med, 2001; 53:1525-1539.
64. Jorgensen, V. Poor women and health in Bangladesh. Pregnancy and health. 1983.Uppsala: Offsetcenter AB.
65. Hurt, L., C. Ronsmans, and S. Saha. Effects of education and other socioeconomic factors on middle age mortality in rural Bangladesh. J Epidemiol Community Health, 2004; 58:315-320.
66. Chowdhury, A.. Education and infant survival in rural Bangladesh. Health Policy Education, 1982; 2(3-4):369-74.
67. Schwarzer, R. Preface. Self-efficacy: Thought Control of Action, ed. Schwarzer. 1992.Washington: Hemisphere Publishing Company.
68. LeVine, R. Women’s schooling and child care in demographic transition: a Mexican case study. Popul Dev Rev, 1991; 17(3):459-96.
69. Saith, R. and B. Harriss-White. Gender Sensitivity of Well-Being. In Discussion Paper 58. 1998. UNRISD: Geneva.
70. Shetty, P. and W. James. Body Mass Index - A Measure of Chronic Energy Deficiency in Adults. In FAO, Food and Nutrition Paper No 56. 1994, United Nations Food and Agricultural Organisation: Rome.
71. Nishiyama, T. and K. Hanaoka. A simple, lightweight device for measurement of hemoglobin; the HemoCue Blood Hemoglobin Test. Masui, 1997; 46(2):284-5.
72. Cohen, A. and J. Seidl-Friedman. HemoCue system for hemoglobin measurement. Evaluation in anemic and nonanemic children. Am J Clin Nutr, 1988; 90(3): 302-5.
73. WHO/UNICEF/UNU. Iron Deficiency: indicators for assessment and strategies for its prevention. 1998. World Health Organization: Geneva.
74. Ash, L. and T. Orihel. Parasites: a guide to laboratory procedures and identification. 1987. Chicago: ASCP press.
75. Montresor, A., et al. Guidelines for the evaluation of soil-transmitted helminthiasis and schistosomiasis at community level. In WHO/CTD/SIP/98.1. 1998. WHO: Geneva.
76. Ali, M. and M. Pramanik. Conversion factors and dietary calculation. 1991. Dhaka: Institute of Nutrition and Food Sciences.
77. Darntun-Hill, I., et al. Tables of nutrient composition of Bangladeshi foods. 1988. Dhaka: Helen Keller International.
78. Jahan, K. and M. Hossain. Nature and extent of malnutrition in Bangladesh. Nutrition survey of Bangladesh 1995 - 1996. 1998. Institute of Nutrition and Food Science, University of Dhaka, Bangladesh.
79. Ahmed, S., et al. Chronic energy deficiency in women from rural Bangladesh: some socioeconomic determinants. J Biosoc Sci, 1998; 30:349-358.
80. Bhuiya, A. and G. Mostofa. Levels and differentials in weight, height and body mass index among mothers in a rural area of Bangladesh. J Biosoc Sci, 1993; 25:31-38.
81. BBS/UNICEF. Report of the national anaemia survey in urban Bangladesh and rural Chittagong Hill Tracts-2003. 2004. BBS: Dhaka.
82. HKI/IPHN, Nutritional Surveillance Project (NSP). Anaemia survey dataset October-November 2001. 2001.
83. Hyder, S., et al. Anaemia among non-pregnant women in rural Bangladesh. Public Health Nutrition, 2000; 4(1): 70-83.
84. Chen, L., E. Huq, and S. D'Souza. Sex bias in the family allocation of food and health care in rural Bangladesh. Popul Dev Rev, 1981; 71(1):55-70.
85. Dasgupta, M. Selective discrimination against female children in rural Punjab, India. Popul Dev Rev, 1987; 13:77-100.

38
86. Chowdhury, A. Changes in maternal nutritional status in a chronically malnourished population in rural Bangladesh. Ecology Food Nutr, 1987; 19:201–211.
87. Miller, J., G. Rodriquez, and A. Pebley. Lactation and mother’s postpartum weight change: an analysis of maternal depletion in Bangladesh, in Manuscript of the office of population research. 1992. Princeton University.
88. Desalegn, S. Prevalence of anaemia in pregnancy in Jima towm, South Eastern Ethiopia. Ethiop Med J, 1993; 31(4):251-8.
89. Johnson, A., M. Latham, and D. Reo. The prevalence and the aetiology of the nutrutional anemia in Guyana. Am J Clin Nutr, 1982; 35(2):309-18.
90. Garrow, J. and W. James. Human nutrition and dietetics (9th edition). 1993. Edinburgh: Churchill-Livingstone.
91. Ahmed, K. and N. Hassan. Nutrition survey of rural Bangladesh 1981 - 1982. 1983. Institute of Nutrition and Food Science, University of Dhaka, Bangladesh.
92. Yusuf, H. Food and development in Bangladesh-keynote paper presented at the seminar on World Food Day, 16 October 1996 (unpublished). 1996.
93. Karvetti, R. and L. Knuts. Validity of the 24-hour dietary recall. J Am Diet Assoc, 1985; 85(11):1437-42.
94. Witschi, J. Short term dietary recall and recording methods. Nutritional Epidemiology, ed. W. Willett. 1980. New York: Oxford University Press. 52-68.
95. Bhatia, J. and J. Cleland. Self-reported symptoms of gynecological morbidity and their treatment in South India. Stud. Family Planning, 1995; 26:203 – 216.
96. Chatterjee, M. and J. Lambert. Women and nutrition: reflection from India and Pakistan. Food and Nutrition Bulletin, 1989; 4:13-28.
97. Smith, H., et al. Prevalence and intensity of infections of ascaris lumbricoides and trichuris and associated socio-demographic variables in four rural Honduran communities. Mem Inst Oswaldo Cruz, Rio de Janeiro, April 2001; 96(3):303-314.
98. Khan, M., et al. The effect of anthelminthic treatment on the helminth infection and anaemia among the female workers of the Ayesha Abed Foundation in Bangladesh. 2005. BRAC research report (unpublished): Dhaka.
99. BBS/UNICEF. Pragatir Pathey. 1999. Bangladesh Bureau of Statistics: Dhaka. 100. Mara, D. Water, sanitation and hygiene for the health of developing nations. Public
Health, 2003; 117: 452-456. 101. Hoque, B., et al. Sustainability of a water, sanitation and hygiene education project in
rural Bangladesh. Bull WHO, 1996; 74:431-437. 102. Pegelow, K., et al. Parasitological and nutritional situation of school children in the
Sukaraja district, West Java, Indonesia. Southeast Asian J Trop Med Public Health, 1997; 28:173-190.
103. Stephenson, L., M. Latham, and E. Ottesen. Malnutrition and parasitic helminth infections. Parasitology, 2000; 121:S23-38.
104. BBS. Report of health and demographic survey-2000. 2001. BBS: Dhaka. 105. Gracia, M. and E. Kennedy. Assessing the linkages between low body mass index and
morbidity in adults: evidence from four developing countries. Eur J Clin Nutr, 1994; 48(Suppl. 3):S90-97.
106. Pryer, J. Body mass index and work-disabling morbidity: results from a Bangladeshi case study. Eur J Clin Nutr, 1993; 47(9):653-7.
107. Sikosana, P., S. Bhebhe, and S. Katuli. A prevalence survey of iron deficiency and iron deficiency anemia in pregnant and lactating women, adult males and pre-school children in Zimbabwe. Cent Afr J Med, 1998; 44(12): 297-305.
108. Khosla, A., P. Dahiya, and K. Dahiya. Burden of chronic severe anemia in obstetric patients in rural north India. Indian J Med Sci, 2002; 56(5):222-4.
39
109. Khongsdier, R. Body mass index and morbidity in adult males of the War Khasi in Northeast India. Eur J Clin Nutr, 2002; 56(6):489-9.
110. Daniels, D., et al. A case-control study of the impact of improved sanitation on diarrhoea morbidity in Lesotho. Bull World Health Org, 1990; 68:455-463.
111. Huttly, S., et al. The Imo State (Nigeria) Drinking Water Supply and Sanitation Project, 2. Impact on dracunculiasis, diarrhoea and nutritional status. Tran R Soc Trop Med Hyg, 1990; 84:316-321.
112. Tatala, S., U. Svanberg, and B. Mduma. Low dietary iron availability is a major cause of anemia: a nutrition survey in the Lindi District of Tanzania. Am J Clin Nutr, 1998; 68:171-78.
113. Newton, C., et al. Severe anemia in children living in malaria endemic area of Kenya. Trop Med Int Health, 1997; 2:165-178.
114. Stoltzfus, R., et al. Epidemiology of iron deficiency anaemia in Zanzabari schoolchildren: the importance of hookworms. Am J Clin Nutr, 1997; 65:153-9.
115. Hershko, C., T. Peto, and D. Weatheral. Regular review. Iron and Infection. BMJ, 1988; 296:660-4.
116. Mejia, L., Role of vitamin A in iron deficiency anemia. Nutritional Anemias. Nestle Nutrition Workshop Series, ed. S. Fomon and S. Zlotkin. Vol. 30. 1992, Vevey, Switzerland: Nestle Ltd/New York: Raven Press. 93-101.
117. Valerie, S., Household food insecurity with hunger is associated with women's food intakes, health and household circumstances. J Nutr, 2001. 131: p. 2670-76.
118. Cristofar, S. and P. Basiotis, Dietary intakes and selected characteristics of women ages 19-50 years and their children ages 1-5 years by reported perception of food sufficiency. J Nutr Educ, 1992. 24: p. 53-58.
119. Kendall, A., C. Olsen, and E. Frongillo, Relationship of hunger and food insecurity to food availability and consumption. J Am Diet Assoc, 1996. 96: p. 1019-24.