maldi mass spectral imaging of bile acids observed as
TRANSCRIPT

B The Author(s), 2018. This article is an open access publication J. Am. Soc. Mass Spectrom. (2018) 29:711Y722DOI: 10.1007/s13361-017-1886-6
RESEARCH ARTICLE
MALDI Mass Spectral Imaging of Bile Acids Observedas Deprotonated Molecules and Proton-Bound Dimersfrom Mouse Liver Sections
Ignacy Rzagalinski,1 Nadine Hainz,2 Carola Meier,2 Thomas Tschernig,2
Dietrich A. Volmer1,3
1Institute of Bioanalytical Chemistry, Saarland University, 66123, Saarbrücken, Germany2Institute of Anatomy and Cell Biology, Saarland University, 66421, Homburg, Germany3Department of Chemistry, Humboldt University of Berlin, 12489, Berlin, Germany
Abstract.Bile acids (BAs) play two vital roles in living organisms, as they are involvedin (1) the secretion of cholesterol from liver, and (2) the lipid digestion/absorption inthe intestine. Abnormal bile acid synthesis or secretion can lead to severe liverdisorders. Even though there is extensive literature on the mass spectrometricdetermination of BAs in biofluids and tissue homogenates, there are no reports onthe spatial distribution in the biliary network of the liver. Here, we demonstrate theapplication of high mass resolution/mass accuracy matrix-assisted laser desorption/ionization (MALDI)-Fourier-transform ion cyclotron resonance (FTICR) to MS imag-ing (MSI) of BAs at high spatial resolutions (pixel size, 25 μm). The results showchemical heterogeneity of the mouse liver sections with a number of branching biliary
and blood ducts. In addition to ion signals from deprotonation of the BAmolecules, MALDI-MSI generated severalfurther intense signals at largerm/z for the BAs. These signals were spatially co-localized with the deprotonatedmolecules and easily misinterpreted as additional products of BA biotransformations. In-depth analysis ofaccurate mass shifts and additional electrospray ionization and MALDI-FTICR experiments, however, confirmedthem as proton-bound dimers. Interestingly, dimers of bile acids, but also unusual mixed dimers of differenttaurine-conjugated bile acids and free taurine, were identified. Since formation of these complexes will negativelyinfluence signal intensities of the desired [M –H]- ions and significantly complicate mass spectral interpretations,two simple broadband techniques were proposed for non-selective dissociation of dimers that lead to increasedsignals for the deprotonated BAs.Keywords: Mass spectrometry imaging, MALDI, FTICR, Bile acids, Taurocholic acid, Taurine, Proton-bounddimers, Adducts
Received: 17 November 2017/Revised: 24 December 2017/Accepted: 24 December 2017/Published Online: 7 February 2018
Introduction
Bile acids (BAs) are an integral part of the digestive systemof living organisms, where they play two essential roles:
firstly, they are synthesized from cholesterol in the liver hepa-tocytes and this process maintains cholesterol homeostasis.Secondly, bile acids in their conjugated forms (Bbile salts^)
participate in digestion and absorption of lipids and lipid solu-ble compounds (e.g., vitamins) in the intestine [1].Interestingly, difference of bile acids composition exist be-tween vertebrates, which makes this an interesting biochemicaltrait not only from an evolutionary biology point of view, butalso from a biomedical perspective [2]. For example, recentreports have shown a link between characteristic BA compo-sition in mice and their resistance to high fat diet-inducedobesity and diabetes [3–5]. In contrast to these beneficialeffects, some bile acids (e.g., litocholic acid) are consideredtoxic endobiotics [6]. Moreover, abnormalities in BA synthesis(which is tightly controlled by 17 different enzymes) as well assecretion processes can lead to development of serious
Electronic supplementary material The online version of this article (https://doi.org/10.1007/s13361-017-1886-6) contains supplementary material, whichis available to authorized users.
Correspondence to: Dietrich Volmer; e-mail: dietrich.volmer@hu–berlin.de

diseases, including bile acid (inborn) synthesis disorder andprimary biliary cholangitis [7–9]. Furthermore, accumulationof BAs in undesirable organs/tissues causes oxidative/nitrosative stress, damages of DNA and cell apoptosis [10–12].
The complex biosyntheses of primary bile acids in liverhepatocytes results in large structural diversity of endogenousmetabolites. In addition, secondary bile acids are formed in thecolon as a result of bacterial action, and some of them re-enterhepatic circulation (enterohepatic recirculation) [13]. In mam-mals, bile composition is almost exclusively limited to com-pounds consisting of 24 carbon atoms; that is, acidic steroidswith typical four-ring steroid core and C-5 side chain(Figure 1a). They differ in the number and position of hydroxylgroups attached to the rings and also include epimers, forexample, muricholic acid (characteristic for mice) with four
different combinations of two hydroxyl groups attached to C-6and C-7 positions. In addition, unconjugated BAs undergofurther biotransformation routes, from which the most importantis N-acyl amidation with taurine or glycine at C-24. Moreover,conjugations at C-3, C-6, or C-7 include sulfation,glucuronidation, glucosidation, and N-acetylglucosaminidation[14, 15]. The nomenclature of bile acids was developed byHoffman et al. [16] (Figure 1 summarizes structures andabbreviations of the most common human and mouse bileacids). There is a large group of intermediate products of 24carbon bile acids containing a keto group at C-3 (oxo-BAs) and/or unsaturated double bonds at C-4 or C-6. The latter were usedas potential biomarkers of pathological change in severe liverdiseases [7, 10].
All these processes combined with recent findings present-ing bile acids as pleiotropic signaling molecules [17, 18] re-quire powerful analytical assays to fully decipher the completemolecular signatures of BAs in different biological matricesand link them to the pathology of the corresponding disease. Asa result, MS-based techniques have been the primary analyticaltools for bile acid characterization over the last few decades.Initially, fast-atom bombardment (FAB) was often implement-ed, delivering mostly deprotonated molecules for BAs in neg-ative ion mode. FABwas frequently used with double focusingmagnetic sector instruments, which allowed high-energy colli-sions (>1 keV) and subsequent dissociation of the steroidbackbone via charge-remote fragmentation (CRF) [19, 20].Of note, conjugation through N-acyl amidation of the sidechain has two practical implications for BAs. Firstly, it in-creases acidity (e.g., pKa of TCA ~1.5 versus CA ~4.5) andthus improves ionization efficiency. Secondly, it enlargescross-sections for CRF, resulting in intense and informativeMS/MS spectra. This phenomenon was used to improve FAB-MS of bile acids after derivatization with taurine or otheraminosulphonates [21, 22]. Other ionization techniques werealso used, including thermospray [23, 24], atmospheric pres-sure chemical ionization [25–28] – both coupled to liquidchromatography – and electron ionization after derivatization/separation by gas chromatography [29, 30]. Today, matrix-assisted laser desorption/ionization (MALDI) and electrosprayionization (ESI) dominate analysis of BAs [31]. ParticularlyLC-ESI-MS/MS is the method of choice for analysis fromdifferent biological samples such as biofluids (urine, bile, plas-ma/serum) [32–34] and liver tissue homogenates [35, 36].Efficient LC separation is vital, as LC-MS/MS instrumentsusually only provide low energy collision induced dissociation(CID) (0–100 eV), with less structure-informative spectra ashigh-energy CID [19]. In contrast to ESI, MALDI has not beenextensively applied to analysis of BAs, except for the quanti-fication of bile acids in urine and plasma [37, 38] and forMALDI imaging of taurocholic acid in a murine model ofpolycystic kidney disease [39]. Mass spectrometry imaging(MSI), however, which combines detailed molecular charac-terization with spatial distribution measurements, has not yetbeen applied for determining spatial distribution of BAs inmouse liver biliary networks, which is the main purpose of
Figure 1. (a) Typical four-ring steroid structures of 24-carbonbile acids, including differences in number and positions ofhydroxyl groups (R1-R3) as well as N-amide conjugation (R4).(b)Most common non-conjugated bile acids present in humansand rodents, with the different positions of hydroxyl groups aswell as two major conjugation types
712 I. Rzagalinski et al.: Mass Spectral Imaging of Bile Acids in Mouse Liver

the present work. In addition, we were concerned with unusualadducts observed during MALDI-MSI analysis of bile acids.
Adduct formation is common in mass spectrometry andadducts often seriously complicate mass spectral interpretation[40]; sometimes they enhance detection when deliberatelyformed (e.g., lithium adducts of phospholipids [41] or silveradducts of cholesterol [42]). Interestingly, gas-phase ESI orMALDI adducts are often stable in positive ion mode. Anionadducts, however, often do not survive the MALDI process,which is attributed to the larger amount of energy transferred tothe desorbed molecules upon ionization [43, 44]. A particulartype of ionic cluster is the proton-bound dimer (PBD), whichconsists of the same (=homodimer) or different (=heterodimer)species (ions or neutrals). Their weak hydrogen bonding wasused as principle of the kinetic method, which was developedby Cook and coworkers [45–47] and later refined, e.g., by theFenselau group [48, 49]. In this method, ESI combined withCID of m/z-selected PBD is used to determine relative protonaffinities (PA) of ions contributing to the isolated cluster. Bileacids were investigated by this method and exhibited differentMS/MS spectra, depending on the PA of the contributing ions[50, 51].
The present work reports on proton-bound dimers formedduring MALDI and the extensive presence of these clustersfrom endogenous tissue metabolites in MSI. Specifically, wedescribe application of high resolution FTICR-MS at highMALDI-MSI spatial resolving powers (25 μm) for bile acidsin the biliary network of mouse liver sections and demonstrateidentification of taurine-conjugated bile acids directly fromtissue sections and formation of proton-bound dimers of dif-ferent bile acids and taurine.
ExperimentalMaterials and Reagents
Taurine (99%), 9-aminoacridine (9-AA, 99.5%), ethanol(HPLC grade) and standard microscopic glass slides werepurchased from Sigma-Aldrich (Steinheim, Germany).Taurocholic acid (sodium salt, 95%) was from BiomolGmbH (Hamburg, Germany), and potassium chloride(99.5%) from Gruessing GmbH (Filsum, Germany). Purifiedwater was generated by a Millipore (Bedford, MA, USA)purification system.
Animals and Tissue Preparation
All animal experiments were performed in accordance withinternational regulations and permission from the local researchethics committee (Saarland Government TVV 27/2014).Female C57BL/6 mice (12-wk) were purchased (CharlesRiver, Sulzbach, Germany). The animals were anesthetizedwith xylazine/ketamine and organs were dissected immediatelyafter sacrifice, snap-frozen in liquid N2, and stored at –80 °Cuntil the sample preparation process. The longitudinal mouseliver sections were prepared at 12 μm thicknesses using a
Reichert Jung 2800 Frigocut cryostat microtome (LeicaMicrosystems, Wetzlar, Germany), thaw-mounted onto theplain microscope glass slides, and dried for 30min in a vacuumdesiccator. The tissues were then stored at –80 °C prior to massspectrometry imaging experiment.
MALDI Matrix Deposition and Evaluation of itsQuality
The MALDI matrix 9-aminoacridine was chosen in this studybecause of its ability to efficiently ionize acidic compounds innegative ion mode, including bile acids [37–39]. A solution of9-AA (5 mg/mL) was freshly prepared in ethanol/water (70/30[v/v]) prior to deposition. Matrix was applied on top of thetissue sections using a home-built automatic sprayer, based onthe Probot micro fraction collector (Thermo Scientific,Germering, Germany) and MicroIonSpray nebulizing nozzle(Sciex, Concord, ON, Canada). Fused silica spray capillaries(Molex Polymicro Technologies, USA) of several differentinternal diameters were tested with respect to homogeneity ofmatrix layers, crystal sizes, and resistance to clogging duringthe longer spraying process. Eventually, the capillaries of200 μm internal diameter were chosen as they provided opti-mum performance. The nozzle height was 44 mm, distancebetween the lines was 3 mm, and the movement speed was199.25 mm/min along the y-axis in a meandering pattern. Forfinal imaging experiments, seven layers of 9-AA were sprayedwith increasing flow rate in the following pattern: two layers at20 μL/min and five layers at 40 μL/min. From these experi-ments, the estimated amount of matrix added to the tissue(=matrix density) was calculated at 0.0201 mg/mm2.Eventually, in-depth visual inspection of the obtained 9-AAlayers was carried out using optical and scanning electron(SEM) microscope images, which revealed high homogeneityand reproducibility as well as crystal sizes down to 1 μm(Figure S1, Supplementary Material).
Mass Spectrometry and Data Analysis
MALDI imaging, MALDI and ESI experiments were per-formed in negative ion mode on a Bruker (Bremen,Germany) 7 Tesla Solarix FTICRmass spectrometer, equippedwith a dual ESI/MALDI ion source and Smartbeam II Nd:YAG(355 nm) laser. MALDI imaging data were collected from m/z50 to 2000with a transient length of ~0.5 s and resolving power(FWHM) of ~90,000 at m/z 400. Internal mass calibration wasperformed using a series of peaks originating from MALDImatrix and endogenous compounds. Two different MSI pixelsize settings were used: 70 μm for low spatial resolutionimaging of the whole liver section and 25 μm for the highspatial resolution imaging of selected sub-regions of the adja-cent tissue section. This particular approach was chosen be-cause of analysis time considerations. The run time for thewhole liver section at the larger raster step size of 70 μm wasca. 8 h (approximately 22,000 single points). The same wholesection imaged at 25 μmwould have required ~189,000 points,with an estimated total run time exceeding 63 h. Selecting the
I. Rzagalinski et al.: Mass Spectral Imaging of Bile Acids in Mouse Liver 713

smaller regions of interest for imaging at high spatial resolu-tion, however, allowed us to keep the single experiment anal-ysis within a few hours. For low resolution experiments, thelaser was set to the Bsmall^ spot size, laser power to 20%,number of laser shots/pixel to 100, and frequency to 1 kHz. Forhigh spatial resolution experiments, different laser settingswere tested with respect to signal intensities as well as toablated area, assuring dense pixel deposition and avoidingoverlap between neighboring laser spots (Figure S2,Supplementary Material). As a result of these optimizationexperiments, the optimal laser settings were set to Bminimum^spot size, laser power to 10%, number of laser shots/pixel to200, and frequency to 1 kHz. MALDI experiments with stan-dards were carried out by using dried-droplet sample prepara-tion and spotting onto steel MALDI target plates (Bruker). ESIwas performed using direct infusion using the instrument’ssyringe pump at 2 μL/min. All MS/MS experiments wereperformed by isolation of precursor ions in the external quad-rupole (isolation window: 3–5 u) and accumulation in thehexapole for collision-induced dissociation (CID) at varyingcollision energies (5–55 V). Data were processed and analyzedusing the Bruker Data Analysis and FlexImaging software forsingle mass spectra and imaging data sets, respectively. Massspectral interpretations were conducted using the METLIN andLIPID MAPS databases to match the accurate masses of theprecursor ions, and by manually interpreting MS/MS fragmen-tation patterns and comparing with standards. MS images werenormalized to the deprotonated 9-AA signal, which was previ-ously described as an efficient normalization routine whenisotope labeled internal standards are not available [52–55].This approach was chosen here over the more common TICand RMS routines because both TIC and RMS caused unreal-istic enhancements of ion yields in our MSI data sets (data notshown). Such artifacts, in particular for signals of high intensityin certain regions, which comply well with the histologicalstructures of heterogeneous tissues, have previously been de-scribed by Deininger et al. [56].
Histological Staining and Optical Microscopy
After MALDI-MSI measurements, the glass slides were gentlywashed with 70% ethanol to remove the matrix. The tissuesections were stained with hematoxylin and eosin (H&E) asfollows: glass slides were dipped in 100% ethanol at –20 °C for5 min, followed by distilled water for 2 min. The slides werethen immersed in Ehrlich’s hematoxylin (Carl Roth, Karlsruhe,Germany) for 5 min, washedwith deionized water, followed bybluing in running tap water for 10 min. Staining by eosin (CarlRoth) for 10 s was followed by a wash with deionized water.Slides were then dipped in 80% ethanol for 3 min, 90% ethanolfor 6 min, and 100% ethanol for 2 × 5 min, followed by placingthem in three different xylene (VWR, Darmstadt, Germany)baths for 5 min each. Finally, slides were cover slipped usingmountingmediumRoti-Histokitt (Carl Roth GmbH, Karlsruhe,Germany). The stained tissue sections were scanned using an
Olympus dotslide optical microscope with an UPLANSAPO40x/0.90 objective (Olympus, Tokyo, Japan).
Results and DiscussionOn-Tissue Identification of Taurine Conjugated BileAcids
Because of the chemical complexity of the bile acid lipid class,high resolution/high accuracy MALDI-FTICR was employedto identify the molecules directly from mouse liver sections. Inthe first step, interpretation of the average as well as single pixelmass spectra from the MSI experiment was performed andannotated m/z values (mass uncertainty, ±3 ppm) within thebile duct and gall bladder regions were interrogated using theMETLIN (http://metlin.scripps.edu) and LIPID MAPS (http://www.lipidmaps.org) databases. Tentative identifications werecompared with an existing study of LC-MS/MS analysis ofmouse bile, plasma, and liver tissue homogenates [32–34]. Inthe second step, CID experiments were performed directly on-tissue (bile duct and/or gall bladder regions) and MS/MSspectra manually interpreted.
A representative MALDI mass spectrum extracted from asingle pixel (bile duct region) of the MSI experiment is shownin Figure 2a. The measured accuratem/z of the base peak atm/z514.2836 (center panel) matched that of the [M – H]- ion of acompound with molecular formula C26H45NO7S (exact mass,m/z 514.2844), which in turn was assigned to taurocholic acid(TCA) or one of the epimers of tauromuricholic acid (α-, β-, γ-,orω-TMCA, Figure 1). In addition, two other important signalswere found. Firstly, m/z 498.2904 (top panel) was assigned amolecular formula of C26H45NO6S and tentatively identified astaurochenodeoxycholic acid (TCDCA); secondly, m/z530.2789 (bottom panel) was assigned the formulaC 2 6 H 4 5 NO 8 S a n d t e n t a t i v e l y i d e n t i f i e d a staurotetrahydroxycholic acid (TTHBA). The molecular formu-lae differed by 16 u (one oxygen), thus representing the taurineconjugates of primary bile acids containing two, three, and fourhydroxyl groups at the steroid cores. CID experiments of eachspecies (Figure 2b and c) revealed characteristic fragment ionsat m/z 124 (C2H6NO3S
-) and m/z 107 (C2H3O3S-), resulting
from cleavages from the taurine conjugated side chain. Inaddition, two further meaningful fragment ions were observed,originating from neutral losses of taurine and a single watermolecule (m/z 355.2648) or taurine and two water molecules(m/z 353.2486), which are characteristic diagnostic ions fordihydroxy and trihydroxy BAs [31, 57]. Of note, MS/MS-based distinction between the two individual isomers of trihy-droxy bile acids (TCA and TMCA) was not possible with theimplemented instrument, as only low-energy CID was avail-able, which does not provide isomer-specific ions for the twospecies. However, based on quantitative data for the isomersshown in previous LC-MS/MS studies of bile acids in mousegall bladder and liver, we assume that both isomers contributeto the ion abundance at m/z 514.3 [5, 33]. Potential isomer
714 I. Rzagalinski et al.: Mass Spectral Imaging of Bile Acids in Mouse Liver

contributions will be investigated in the future by utilizing ionmobility separation after MALDI.
High Spatial Resolution MALDI-FTICR Imagingof BAs in Mouse Liver Sections
Even though liver is often considered to be a homogenoustissue in MSI studies, it is in fact a highly vascularized organ[58]. The relatively homogenous parenchymal tissue consistingof the hepatocytes is highly permeated by branching biliary andblood vessels. Bile acids are synthesized in the hepatic lobulesof liver parenchyma and, following conjugation with taurine(mice) or taurine and glycine (humans), they are secreted to thegall bladder through a branching network of bile canaliculi,canals of Hering, and different size bile ducts, which togethercreate the characteristic biliary tree [58–60]. Here, we usedMALDI-MSI to investigate molecular profiles and branchingpatterns of the mouse intrahepatic biliary tree at high lateralresolutions (pixel size, 25 μm). In addition to the single ionimages of different bile acids, we also provide molecular dif-ferentiation between bile ducts, blood vessels and hepatic pa-renchymal tissue from a single tissue section, based on the
RGB ion images of three different compounds serving as themolecular surrogate markers of the three regions.
The spatial distributions of the three taurine-conjugated bileacids discussed above are shown in Figure 3. All ion images arecreated based on the signals from the deprotonated molecules:TCDCA atm/z 498.2904 ± 0.05, TCA/TMCA atm/z 514.2836± 0.05, and TTHBA at m/z 530.2789 ± 0.05. The raster widthwas 70 μm for whole tissue sections (Figure 3a) and 25 μm forselected smaller sub-regions of adjacent sections (Figure 3b–d).All three bile acids were clearly co-localized, correlating wellwith the anatomical features of bile ducts revealed by the H&E-stained images, and clearly showing the branching network ofthe biliary tree in the high spatial resolution images (Figure 3b).From a comparison of the relative signal intensities (normal-ized to 9-AAmatrix signal), we determined TCA/TMCA as themost abundant investigated component of bile, and TTHBA aslowest abundant molecule. In addition, the highest intensity ofall three BAs was found in the gall bladder (green arrow on theH&E image, Figure 3), which serves as storage reservoir for aconcentrated bile [59, 61]. These findings are in good agree-ment with previously published quantitative LC-MS/MS re-ports [35, 36].
Figure 2. (a)MSI single pixel mass spectrum for them/z range 450–700 (center), with two smaller expandedm/z range:m/z 492–508 (top) andm/z 522–540 (bottom), showing signals from deprotonated molecules of trihydroxy, dihydroxy, and tetrahydroxy bileacids, respectively. (b)CID mass spectra of three identified BAs, confirming taurine-conjugated side chains, obtained after isolationin the quadrupole and dissociation in the hexapole collision cell at energies of 50, 55, and 50 eV for dihydroxy, trihydroxy, andtetrahydroxyBAs, respectively. (c)Structures of the three identified BAs (TCA and TMCA isomers are both shown, as distinction wasnot possible with the present method)
I. Rzagalinski et al.: Mass Spectral Imaging of Bile Acids in Mouse Liver 715

In addition to determining spatial distribution of selectedbile acids in liver sections, the MALDI-MSI method alsoenabled us to perform molecular fingerprinting of mouse livermicrostructures. As seen in Figure 4a, three different regionscan be distinguished based on the mass spectra collected fromthese areas: bile ducts, blood vessels, and liver parenchymaltissue. Furthermore, distinct molecular histology images can bereadily obtained by selecting three different deprotonated mol-ecules: m/z 514.2836 ± 0.05 (TCA/TMCA), 615.1703 ± 0.05(heme B), and 885.5492 ± 0.05 (PI (18:0/20:4)), serving assurrogate molecular markers of the above-mentioned regions.Using these marker ions, Figure 4b, c illustrate RGB ionimages of the whole section and the expanded regions (atspatial resolution of 70 μm) that reveal excellent correlationwith the anatomical features of H&E-stained tissue images.Moreover, to emphasize the importance of imaging at higherspatial resolutions (at pixel size of 25 μm), the smaller bileducts located in the proximity of larger blood vessels arepresented in Figure 4d, e. In these experiments, the bile acidswere detected even in the ducts of small diameters such as 50–
100 μm, which demonstrates the great potential of the methodfor studying human liver samples, including the molecularvisualization of interlobular and, with further improvement oflateral resolution, the intralobular bile ducts. Of note, ourexperiments and results showed a minor tendency to delocali-zation of bile, during cryosectioning, thaw-mounting, and/ormatrix spraying, even though a tightly controlled sample prep-aration protocol was used (see Experimental). While complete-ly eliminating delocalization from the first two processes canbe difficult (if not impossible), solvent-free matrix depositionsuch as dry-coating or sublimation can avoid delocalizationfrom matrix spraying. Such an approach will be crucial in thenext stage of our work, where we investigate images of smallerfeatures of the biliary network.
Proton-Bound Dimers of Bile Acids and Taurine
Several recent LC-MS/MS studies have reported the identifi-cation of a wide range of bile acids in liver and bile samples[33, 34, 62]. We interrogated our MSI data sets for these and
Figure 3. MS ion images representing spatial distributions of the identified taurine-conjugated bile acids at m/z 498.2904 ± 0.05(TCDCA), m/z 514.2836 ± 0.05 (TCA/TMCA), and m/z 530.2789 ± 0.05 (TTHBA) for the whole section of mouse liver at low spatialresolution (pixel size, 70 μm) (a), and in smaller sub-regions of an adjacent tissue section at high spatial resolution (pixel size, 25 μm)(b–d). All ion images were normalized to the 9-AA matrix signal. The green arrows indicate gall bladder (a) or bile vessels (b–d),whereas the red arrows show blood vessels. Scale bars: 5 mm (a), 1000 μm (b, c), and 500 μm (d)
716 I. Rzagalinski et al.: Mass Spectral Imaging of Bile Acids in Mouse Liver

additional molecules, which are associated with the gall blad-der and bile ducts regions. In addition to the manual investiga-tion of selected regions of interest (ROI), we also applied massdefect filtering (MDF) based on average mass spectra from theMSI experiments, to identify further potential metabolites ofbile acids. For this purpose, we chose an unconjugatedmonohydroxylated bile acid, litocholic acid (LCA), as coresubstructure and set a mass defect filter window of ±50 mDaaround the exact mass of LCA (to include the most commonbile acids conjugations) over a broader mass region from m/z400 to 700. This combined approach of data processing re-vealed >20 promising monoisotopic m/z value candidates.Most notably, two interesting groups of signals with the highestrelative signal intensities were found in the ranges between m/z620 and 680 and from m/z 1,020 to 1080, which are shown as
single MSI pixel mass spectrum in Figure 5. Surprisingly,searching common databases (LIPID MAPS and METLIN)did not give any positive identifications. Moreover, the mea-sured accurate mass shifts from the chosen core structure didnot match any known or previously observed biotransforma-tions. As bile acids have been reported to form proton-bound(mixed) dimers during electrospray ionization [50, 51] as wellas solvent adducts in positive ion mode and carboxylic acidadducts in negative ion mode [63], we also investigated theobserved mass shifts for potential formations of these clusterions.
As a result, we were able to identify two species of proton-bound dimers formed during the MALDI-MSI experiments(Figure 5). Firstly, cluster ions of the general structure [BA-H]-···H+···[BA-H]-, which are dimers of TCA/TMCA (m/z
Figure 4. MALDI-MSI single pixel mass spectra from three regions of liver tissue section with different microstructures andchemical compositions: biliary tree (bile duct), blood vessel, and liver parenchyma. The m/z values used for RGB MS images arehighlighted in the spectra (a). RGB ion images representing three different compounds, showing clear distinction betweenanatomical features (as shown by the H&E stained images) across the whole tissue section (pixel size, 70 μm) (b). Expansion ofthe smaller sub-region (c) as well as smaller sub-regions from an adjacent section (pixel size, 25 μm) (d, e). Scale bars: 5 mm (b),1000 μm (c, d), and 500 μm (e)
I. Rzagalinski et al.: Mass Spectral Imaging of Bile Acids in Mouse Liver 717

1051.56 and 1067.53), and a mixed dimer of TCDCA andTCA/TMCA (m/z 1035.57). Secondly, [BA-H]-··· H+···[Ta-H]- adducts, which were, in fact, mixed dimers of TCA/TMCA and taurine (m/z 639.30, 661.28 and 677.26) orTCDCA and taurine (m/z 623.30, 645.29 and 661.26).Importantly, the high abundance of taurine across the examinedliver sections is readily seen in the ion image ofm/z 124.0073 ±0.01 (from the same tissue section), which corresponds todeprotonated taurine, providing additional corroboration ofour findings on the identified bile acids and the taurine dimerformation. Of note, all identified dimers showed the samelocalization and spatial distributions as the deprotonated BAs(Figure S3, Supplementary Information).
To unambiguously confirm the results on the PBD, weexamined an equimolar mixture of standard solutions ofTCA, taurine, and potassium chloride by MALDI-FTICR (via9-AAmatrix and dried-droplet sample preparation). The results(Figure S4, Supplementary Information) confirmed the previ-ous data on the proton-bound dimers of TCA and taurine. Wealso performed on-tissue CID experiments of the mass selectedcluster ions, by co-adding 16 individual scans of each enhancesignal-to-noise ratios, and comparison with CID experimentsof standard mixtures. The CID spectra illustrated in Figure S5(Supplementary Information) showed a single product at m/z498.3 for clusters containing TCDCA (m/z 623.3 and 645.3); orat m/z 514.3 for dimers containing TCA/TMCA (m/z 639.3,661.3, 677.3 and 1051.6). Interestingly, MS/MS spectra ofmixed dimers of bile acid and taurine did not show the product
ions related to taurine, which can readily be explained by highgas-phase acidity of taurine-conjugated bile acids [51].
Implications of PBD for MALDI-MSI: Impact on [M– H]- Intensities
In addition to considerably complicating mass spectral inter-pretation, the formation of proton-bound dimers also dimin-ishes signal intensities of the desired [M – H]- peaks. Thiseffect becomes even more detrimental in MALDI-MSI exper-iments, in particular at high lateral resolutions, where theamount of analyte in a single pixel tissue area is very limitedand often requires operating at or close to the detection limits ofthe method. Interestingly, the intensity ratio of PBD todeprotonated BA (PBD/BA) measured in our imaging experi-ments varied across the regions of the tissue section (averagemass spectra and PBD/BA values for four regions are shown inTable S1 and Figure S6, Supplementary Information). Of note,the heterodimers of TCA/TMCA and taurine contributed mostsignificantly to the overall sum intensity of all PBDs, and thehighest total PBD/BA ratios were observed for large and smallbile ducts (0.64 and 0.78, respectively). This suggests a depen-dence of PBD formation on the tissue concentration of thecontributing molecules and the ion density after MALDI, re-spectively, which will vary across the tissue.
Here, we introduce a simple technique for use on massspectrometry platforms with a quadrupole collision cell orability for efficient in-source CID prior to FTICR mass
Figure 5. SingleMSI pixel mass spectrum from the bile duct region in the rangem/z 490–1100, showing signals from proton-bounddimers formed between bile acids (homo- and heterodimers) as well as between bile acids and taurine. The 2D ion image on theupper left illustrates the distribution of taurine in the liver section
718 I. Rzagalinski et al.: Mass Spectral Imaging of Bile Acids in Mouse Liver
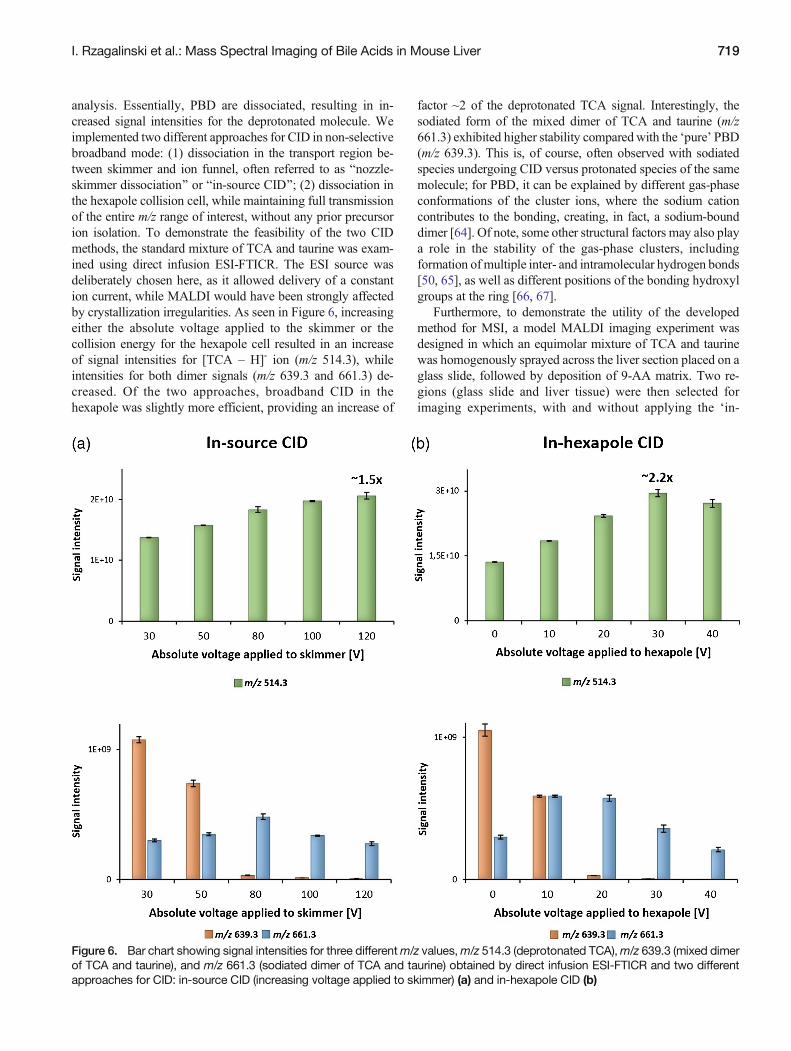
analysis. Essentially, PBD are dissociated, resulting in in-creased signal intensities for the deprotonated molecule. Weimplemented two different approaches for CID in non-selectivebroadband mode: (1) dissociation in the transport region be-tween skimmer and ion funnel, often referred to as Bnozzle-skimmer dissociation^ or Bin-source CID^; (2) dissociation inthe hexapole collision cell, while maintaining full transmissionof the entire m/z range of interest, without any prior precursorion isolation. To demonstrate the feasibility of the two CIDmethods, the standard mixture of TCA and taurine was exam-ined using direct infusion ESI-FTICR. The ESI source wasdeliberately chosen here, as it allowed delivery of a constantion current, while MALDI would have been strongly affectedby crystallization irregularities. As seen in Figure 6, increasingeither the absolute voltage applied to the skimmer or thecollision energy for the hexapole cell resulted in an increaseof signal intensities for [TCA – H]- ion (m/z 514.3), whileintensities for both dimer signals (m/z 639.3 and 661.3) de-creased. Of the two approaches, broadband CID in thehexapole was slightly more efficient, providing an increase of
factor ~2 of the deprotonated TCA signal. Interestingly, thesodiated form of the mixed dimer of TCA and taurine (m/z661.3) exhibited higher stability compared with the ‘pure’ PBD(m/z 639.3). This is, of course, often observed with sodiatedspecies undergoing CID versus protonated species of the samemolecule; for PBD, it can be explained by different gas-phaseconformations of the cluster ions, where the sodium cationcontributes to the bonding, creating, in fact, a sodium-bounddimer [64]. Of note, some other structural factors may also playa role in the stability of the gas-phase clusters, includingformation ofmultiple inter- and intramolecular hydrogen bonds[50, 65], as well as different positions of the bonding hydroxylgroups at the ring [66, 67].
Furthermore, to demonstrate the utility of the developedmethod for MSI, a model MALDI imaging experiment wasdesigned in which an equimolar mixture of TCA and taurinewas homogenously sprayed across the liver section placed on aglass slide, followed by deposition of 9-AA matrix. Two re-gions (glass slide and liver tissue) were then selected forimaging experiments, with and without applying the ‘in-
Figure 6. Bar chart showing signal intensities for three differentm/z values,m/z 514.3 (deprotonated TCA),m/z 639.3 (mixed dimerof TCA and taurine), and m/z 661.3 (sodiated dimer of TCA and taurine) obtained by direct infusion ESI-FTICR and two differentapproaches for CID: in-source CID (increasing voltage applied to skimmer) (a) and in-hexapole CID (b)
I. Rzagalinski et al.: Mass Spectral Imaging of Bile Acids in Mouse Liver 719
hexapole’ dissociation method (each region was composed ofat least 200 single pixels at 70 μm spatial resolution, fromwhich the average mass spectra and PBD/BA values are shownin Figures S7a, b, and 7d, e, Supplementary Material).Applying collision energy (30 V) resulted in an increase ofthe average signal intensity for [TCA – H]- (m/z 514.3) byfactors of 2.7 and 1.6 for glass and tissue regions, respectively,while the sum of averaged intensities from three heterodimersignals (m/z 639.3, 661.3 and 667.3) decreased. Increasing thelaser energy might also be considered to be a potentially usefulalternative for dimer dissociation. As shown by Dreisewerdand coworkers, however, optimal MALDI-MS performance(=maximum analyte signal intensity at the lowest thresholdlaser fluence) can be achieved by utilizing a laser energyapproximately 2–3 times higher than the ion detection thresh-old [68], which was also used in the present study. Increasingthe laser energy above this value can result in strong ablationfrom the tissue surface and may lead to increased thermaldegradation of the analytes, leading to overall analyte signaldeterioration. This was confirmed in our experiments, as shownin Figure S7c, f (Supplementary Material). Therefore, we con-sider the ‘in-hexapole’ broadband dissociation approach devel-oped here as a superior and gentler means of increasing signalintensities from deprotonated bile acids during MALDI-MSI.
ConclusionsThe primary goal of this study was the visualization of bile aciddistributions across mouse livers sections on a molecular level.To our knowledge, this is the first report on the detection andidentification of taurine-conjugated bile acids directly frommouse liver sections. The acquired MALDI-MSI datacorresponded well with the micro-anatomical features of themouse liver biliary tract obtained from histological examina-tions. Furthermore, we have demonstrated the potential of themethod for high spatial resolution MALDI imaging at pixelsize of 25 μm, which even allows the differentiation of smallbiliary ducts from blood vessels and liver parenchymal tissue.In addition to MALDI-MSI, our research revealed extensiveproton-bound dimer formation between endogenous taurineand taurine-conjugated bile acids. Since formation of thesedimers negatively influenced signal intensities of the desired[M – H]- species, a simple method of broadband dissociationwas proposed that provided increased signals of thedeprotonated species. This deliberate PBD dissociation willbe implemented in our future MALDI-MSI studies, in particu-lar in applications where the sensitivity of the method will bethe limiting factor; for example, when even higher spatialresolutions than presented here are required (e.g., molecularmapping of small interlobular bile ducts of diameter of ~10 μmfor studying cholestasis models [69]), or for bile acid distribu-tions in the brain at much lower concentration levels than in theliver, where they play important signaling roles in neurologicaldisease [70–72]. Other work currently in progress includes adetailed experimental investigation of the exact structural
factors stabilizing the different proton/cation-bound dimers ofbile acids and amino acids.
AcknowledgmentsD.A.V. acknowledges support by the German ResearchFoundation (FTICR-MS Facility, INST 256/356-1) andAlfried Krupp von Bohlen und Halbach-Stiftung. The authorsthank Sylvia Kuhn for SEM and Alexander Grißmer for stain-ing and light microscopy experiments.
Open AccessThis article is distributed under the terms of the CreativeCommons Attribution 4.0 International License (http://creativecommons.org/licenses/by/4.0/), which permits unre-stricted use, distribution, and reproduction in any medium,provided you give appropriate credit to the original author(s)and the source, provide a link to the Creative Commonslicense, and indicate if changes were made.
References
1. Russell, D.W.: The enzymes, regulation, and genetics of bile acid syn-thesis. Annu. Rev. Biochem. 72, 137–174 (2003)
2. Hofmann, A.F., Hagey, L.R., Krasowski, M.D.: Bile salts of vertebrates:structural variation and possible evolutionary significance. J. Lipid Res.51, 226–246 (2010)
3. Rudling, M.: Understanding mouse bile acid formation: Is it time tounwind why mice and rats make unique bile acids? J. Lipid Res. 57,2097–2098 (2016)
4. Bonde, Y., Eggertsen, G., Rudling, M.: Mice abundant in muricholic bileacids show resistance to dietary induced steatosis, weight gain, and toimpaired glucose metabolism. PLoS One. 11, (2016)
5. Qi, Y., Jiang, C., Cheng, J., Krausz, K.W., Li, T., Ferrell, J.M., Gonzalez,F.J., Chiang, J.Y.L.: Bile acid signaling in lipid metabolism:Metabolomicand lipidomic analysis of lipid and bile acid markers linked to anti-obesityand anti-diabetes in mice. Biochim. Biophys. Acta – Mol. Cell Biol.Lipids. 1851, 19–29 (2015)
6. Hofmann, A.F.: Detoxification of lithocholic acid, a toxic bile acid:relevance to drug hepatotoxicity. Drug Metab. Rev. 36, 703–722 (2004)
7. Heubi, J.E., Setchell, K.D.R., Bove, K.E.: Inborn errors of bile acidmetabolism. Semin. Liver Dis. 27, 282–294 (2007)
8. Milkiewicz, M., Klak, M., Kempinska-Podhorodecka, A., Wiechowska-Kozlowska, A., Urasinska, E., Blatkiewicz, M., Wunsch, E., Elias, E.,Milkiewicz, P.: Impaired hepatic adaptation to chronic cholestasis in-duced by primary sclerosing cholangitis. Sci. Rep. 6, 39573 (2016)
9. Li, T., Chiang, J.Y.L.: Bile acid signaling in metabolic disease and drugtherapy. 948–983 (2014)
10. Hofmann, A.F.: The continuing importance of bile acids in liver andintestinal disease. Arch. Intern. Med. 159, 2647–2658 (2015)
11. Payne, C.M., Bernstein, C., Dvorak, K., Bernstein, H.: Hydrophobic bileacids, genomic instability, Darwinian selection, and colon carcinogenesis.Clin. Exp. Gastroenterol. 1, 19–47 (2008)
12. Hofmann, A.F., Hagey, L.R.: Bile acids: chemistry, pathochemistry,biology, pathobiology, and therapeutics. Cell. Mol. Life Sci. 65, 2461–2483 (2008)
13. Ridlon, J.M.: Bile salt biotransformations by human intestinal bacteria. J.Lipid Res. 47, 241–259 (2005)
14. Iida, T., Nishida, S., Yamaguchi, Y., Kodake, M.: 3-Glucosides ofnonamidated and glycine- and taurine-amidated bile acids. 36, (1995)
15. Alnouti, Y.: Bile acid sulfation: a pathway of bile acid elimination anddetoxification. Toxicol. Sci. 108, 225–246 (2009)
16. Hofmann, A.F., Sjövall, J., Kurz, G., Radominska, A., Schteingart, C.D.,Tint, G.S., Vlahcevic, Z.R., Setchell, K.D.: A proposed nomenclature forbile acids. J. Lipid Res. 33, 599–604 (1992)
720 I. Rzagalinski et al.: Mass Spectral Imaging of Bile Acids in Mouse Liver

17. Hylemon, P.B., Zhou, H., Pandak, W.M., Ren, S., Gil, G., Dent, P.: Bileacids as regulatory molecules. J. Lipid Res. 50, 1509–1520 (2009)
18. De Aguiar Vallim, T.Q., Tarling, E.J., Edwards, P.A.: Pleiotropic roles ofbile acids in metabolism. Cell Metab. 17, 657–669 (2013)
19. Griffiths, W.J.: Tandemmass spectrometry in the study of fatty acids, bileacids, and steroids. Mass Spectrom. Rev. 22, 81–152 (2003)
20. Cheng, C., Gross, M.L.: Applications and mechanisms of charge-remotefragmentation. Mass Spectrom. Rev. 19, 398–420 (2000)
21. Griffiths, W.J., Zhang, J., Sjovall, J.: Charge-remote fragmentation of bileacids derivatized with amino-sulphonic acids. Rapid Commun. MassSpectrom. 7, 235–240 (1993)
22. Zhang, J., Griffiths, W.J., Bergman, T., Sjovall, J.: Derivatization of bileacids with taurine for analysis by fast atom bombardment mass spectrom-etry with collision-induced fragmentation. J. Lipid Res. 34, 1895–1900(1993)
23. Setchell, K.D.R., Vestal, C.H.: Thermospray ionization liquidchromatography-mass spectrometry: a new and highly specific techniquefor the analysis of bile acids. J. Lipid Res. 30, 1459–1469 (1989)
24. Eckers, C., East, P.B., Haskins, N.J.: The use of negative ion thermosprayliquid chromatography / tandem mass spectrometry for the determinationof bile acids and their glycine conjugates. J. Mass Spectrom. 20, 731–739(1991)
25. Goto, J., Murao, N., Nakada, C., Motoyama, T., Oohashi, J., Yanagihara,T., Niwa, T., Ikegawa, S.: Separation and characterization of carboxyl-linked glucuronides of bile acids in incubation mixture of rat liver micro-somes. Steroids. 63, 186–192 (1998)
26. You, J., Shi, Y., Ming, Y., Yu, Z., Yi, Y., Liu, J.: Development of asensitive reagent, 1,2-benzo-3,4-dihydrocarbazole-9-ethyl-p-toluenesulfonate, for determination of bile acids in serum by HPLC withfluorescence detection, and identification by mass spectrometry with anAPCI source. Chromatographia. 60, 527–535 (2004)
27. You, J., Fu, Y., Sun, Z., Suo, Y.: 2-(5-Benzoacridine)ethyl-p-toluenesulfonate as sensitive reagent for the determination of bile acidsby HPLC with fluorescence detection and online atmospheric chemicalionization-mass spectrometric identification. Anal. Bioanal. Chem. 396,2657–2666 (2010)
28. Goto, T., Shibata, A., Iida, T., Mano, N., Goto, J.: Sensitive massspectrometric detection of neutral bile acid metabolites. Formation ofadduct ions with an organic anion in atmospheric pressure chemicalionization [4]. Rapid Commun. Mass Spectrom. 18, 2360–2364 (2004)
29. Eneroth, P., Gordon, B., Ryhage, R., Sjövall, J.: Identification of mono-and dihydroxy bile acids in human feces by gas-liquid chromatographyand mass spectrometry. J. Lipid Res. 7, 511–523 (1966)
30. Suzuki, M., Murai, T., Yoshimura, T., Kimura, A., Kurosawa, T., Tohma,M.: Determination of 3-oxo-delta4- and 3-oxo-delta4,6-bile acids andrelated compounds in biological fluids of infants with cholestasis by gaschromatography-mass spectrometry. J. Chromatogr. B Biomed. Sci.Appl. 693, 11–21 (1997)
31. Griffiths, W.J., Sjovall, J.: Bile acids: analysis in biological fluids andtissues. J. Lipid Res. 51, 23–41 (2010)
32. Han, J., Liu, Y., Wang, R., Yang, J., Ling, V., Borchers, C.H.: Metabolicprofiling of bile acids in human and mouse blood by LC-MS/MS incombination with phospholipid-depletion solid-phase extraction. Anal.Chem. 87, 1127–1136 (2015)
33. Jäntti, S.E., Kivilompolo, M., Ohrnberg, L., Pietilainen, K.H., Nygren,H., Orešič, M., Hyotylainen, T.: Quantitative profiling of bile acids inblood, adipose tissue, intestine, and gall bladder samples using ultra highperformance liquid chromatography-tandem mass spectrometry. Anal.Bioanal. Chem. 406, 7799–7815 (2014)
34. Wegner, K., Just, S., Gau, L., Mueller, H., Gérard, P., Lepage, P., Clavel,T., Rohn, S.: Rapid analysis of bile acids in different biological matricesusing LC-ESI-MS/MS for the investigation of bile acid transformation bymammalian gut bacteria. Anal. Bioanal. Chem. 409, 1231–1245 (2017)
35. Bobeldijk, I., Hekman, M., de Vries-van der Weij, J., Coulier, L.,Ramaker, R., Kleemann, R., Kooistra, T., Rubingh, C., Freidig, A.,Verheij, E.: Quantitative profiling of bile acids in biofluids and tissuesbased on accurate mass high resolution LC-FT-MS: Compound classtargeting in a metabolomics workflow. J. Chromatogr. B Anal. Technol.Biomed. Life Sci. 871, 306–313 (2008)
36. Alnouti, Y., Csanaky, I.L., Klaassen, C.D.: Quantitative-profiling of bileacids and their conjugates in mouse liver, bile, plasma, and urine usingLC-MS/MS. J. Chromatogr. B Anal. Technol. Biomed. Life Sci. 873,209–217 (2008)
37. Mims, D., Hercules, D.: Quantification of bile acids directly from urine byMALDI-TOF-MS. Anal. Bioanal. Chem. 375, 609–616 (2003)
38. Mims, D., Hercules, D.: Quantification of bile acids directly from plasmaby MALDI-TOF-MS. Anal. Bioanal. Chem. 378, 1322–1326 (2004)
39. Ruh, H., Salonikios, T., Fuchser, J., Schwartz, M., Sticht, C., Hochheim,C., Wirnitzer, B., Gretz, N., Hopf, C.: MALDI imaging MS revealscandidate lipid markers of polycystic kidney disease. J. Lipid Res. 54,2785–2794 (2013)
40. Huang, N., Siegel, M.M., Kruppa, G.H., Luaukien, F.H.: Automation of aFourier transform ion cyclotron resonance mass spectrometer for acqui-sition, analysis, and e-mailing of high-resolution exact-mass electrosprayionizationmass spectral data. J. Am. Soc. Mass Spectrom. 10, 1166–1173(1999)
41. Hsu, F.F., Bohrer, A., Turk, J.: Formation of lithiated adducts ofglycerophosphocholine lipids facilitates their identification byelectrospray ionization tandem mass spectrometry. J. Am. Soc. MassSpectrom. 9, 516–526 (1998)
42. Dufresne, M., Thomas, A., Breault-Turcot, J., Masson, J.-F., Chaurand,P.: Silver-assisted laser desorption ionization for high spatial resolutionimaging mass spectrometry of olefins from thin tissue sections. Anal.Chem. 85, 3318–3324 (2013)
43. Cai, Y., Cole, R.B.: Stabilization of anionic adducts in negative ionelectrospray mass spectrometry. Anal. Chem. 74, 985–991 (2002)
44. Zhu, J., Cole, R.B.: Formation and decompositions of chloride adductions, [M + Cl]-, in negative ion electrospray ionization mass spectrome-try. J. Am. Soc. Mass Spectrom. 11, 932–941 (2000)
45. McLuckey, S.A., Cameron, D., Cooks, R.G.: Proton affinities fromdissociations of proton-bound dimers. J. Am. Chem. Soc. 103, 1313–1317 (1981)
46. Cooks, R.G., Wong, P.S.H.: Kinetic method of making thermochemicaldeterminations: advances and applications. Acc. Chem. Res. 31, 379–386(1998)
47. Graham Cooks, R., Patrick, J.S., Kotiaho, T., McLuckey, S.A.:Thermochemical determinations by the kinetic method. Mass Spectrom.Rev. 13, 287–339 (1994)
48. Cheng, X.H., Wu, Z.C., Fenselau, C.: Collision energy dependence ofproton-bound dimer dissociation – entropy effects, proton affinities, andintramolecular hydrogen-bonding in protonated peptides. J. Am. Chem.Soc. 115, 4844–4848 (1993)
49. Wu, Z., Fenselau, C.: Proton affinity of arginine measured by the kineticapproach. Rapid Commun. Mass Spectrom. 6, 403–405 (1992)
50. Bortolini, O., Fantin, G., Ferretti, V., Fogagnolo, M., Paolo Giovannini,P., Medici, A.: Relative acidity scale of bile acids through ESI-MSmeasurements. Org. Biomol. Chem. 8, 3674–3677 (2010)
51. Bortolini, O., Bernardi, T., Fantin, G., Ferretti, V., Fogagnolo, M.:Relative acidity scale of glycine- and taurine-conjugated bile acidsthrough ESI-MS measurements. Steroids 76, 596–602 (2011)
52. Rzagalinski, I., Volmer, D.A.: Quantification of low molecular weightcompounds by MALDI imaging mass spectrometry – a tutorial review.Biochim. Biophys. Acta – Proteins Proteom. 1865, 726–739 (2017)
53. Goodwin, R.J.A., Scullion, P., MacIntyre, L., Watson, D.G., Pitt, A.R.:Use of a solvent-free dry matrix coating for quantitative matrix-assistedlaser desorption ionization imaging of 4-bromophenyl-1,4-diazabicyclo(3.2.2) nonane-4-carboxylate in rat brain and quantitativeanalysis of the drug from laser microdissected tissue. Anal. Chem. 82,3868–3873 (2010)
54. Takai, N., Tanaka, Y., Inazawa, K., Saji, H.: Quantitative analysis ofpharmaceutical drug distribution in multiple organs by imaging massspectrometry. Rapid Commun. Mass Spectrom. 26, 1549–1556 (2012)
55. Takai, N., Tanaka, Y., Watanabe, A., Saji, H.: Quantitative imaging of atherapeutic peptide in biological tissue sections by MALDI MS.Bioanalysis. 5, 603–612 (2013)
56. Deininger, S.O., Cornett, D.S., Paape, R., Becker, M., Pineau, C., Rauser,S., Walch, A., Wolski, E.: Normalization in MALDI-TOF imagingdatasets of proteins: Practical considerations. Anal. Bioanal. Chem. 401,167–181 (2011)
57. Hager, J.W., Le Blanc, J.C.Y.: Product ion scanning using a Q-q-Q linearion trap (Q TRAP) mass spectrometer. Rapid Commun. Mass Spectrom.17, 1056–1064 (2003)
58. Ludwig, J., Ritman, E.L., LaRusso, N.F., Sheedy, P.F., Zumpe, G.:Anatomy of the human biliary system studied by quantitative computer-aided three-dimensional imaging techniques. Hepatology. 27, 893–899(1998)
I. Rzagalinski et al.: Mass Spectral Imaging of Bile Acids in Mouse Liver 721

59. Boyer, J.L.: Bile formation and secretion. Compr. Physiol. 3, 1035–1078(2013)
60. Roskams, T.A., Theise, N.D., Balabaud, C., Bhagat, G., Bhathal, P.S.,Bioulac-Sage, P., Brunt, E.M., Crawford, J.M., Crosby, H.A., Desmet,V., Finegold, M.J., Geller, S.A., Gouw, A.S.H., Hytiroglou, P., Knisely,A.S., Kojiro, M., Lefkowitch, J.H., Nakanuma, Y., Olynyk, J.K., Park,Y.N., Portmann, B., Saxena, R., Scheuer, P.J., Strain, A.J., Thung, S.N.,Wanless, I.R., West, A.B.: Nomenclature of the finer branches of thebiliary tree: Canals, ductules, and ductular reactions in human livers.Hepatology. 39, 1739–1745
61. Chiang, J.Y.L.: Bile acids: regulation of synthesis. J. Lipid Res. 50, 1955–1966 (2009)
62. Garcia-Canaveras, J.C., Donato, M.T., Castell, J.V., Lahoz, A.: Targetedprofiling of circulating and hepatic bile acids in human, mouse, and ratusing a UPLC-MRM-MS-validated method. J. Lipid Res. 53, 2231–2241(2012)
63. Warrack, B.M., Didanatot, G.C.: Ion spray liquid chromatographic/massspectrometric characterization of bile acids. Biol. Mass Spectrom. 22,101–111 (1993)
64. Marta, R.A., Wu, R., Eldridge, K.R., Martens, J.K., McMahon, T.B.: Thesodium cation-bound dimer of theophylline: IRMPD spectroscopy of ahighly symmetric electrostatically bound species. Int. J. Mass Spectrom.297, 76–84 (2010)
65. Cai, Y., Concha, M.C., Murray, J.S., Cole, R.B.: Evaluation of the role ofmultiple hydrogen bonding in offering stability to negative ion adducts in
electrospray mass spectrometry. J. Am. Soc. Mass Spectrom. 13, 1360–1369 (2002)
66. Mano, N., Mori, M., Ando, M., Goto, T., Goto, J.: Ionization of uncon-jugated, glycine- and taurine-conjugated bile acids by electrospray ioni-zation mass spectrometry. J. Pharm. Biomed. Anal. 40, 1231–1234(2006)
67. Wu, R., Marta, R.A., Martens, J.K., Eldridge, K.R., McMahon, T.B.:Experimental and theoretical investigation of the proton-bound dimer oflysine. J. Am. Soc. Mass Spectrom. 22, 1651–1659 (2011)
68. Wiegelmann, M., Soltwisch, J., Jaskolla, T.W., Dreisewerd, K.: Matchingthe laser wavelength to the absorption properties of matrices increases theion yield in UV-MALDI mass spectrometry. Anal. Bioanal. Chem. 405,6925–6932 (2013)
69. Vartak, N., Damle-Vartak, A., Richter, B., Dirsch, O., Dahmen, U.,Hammad, S., Hengstler, J.G.: Cholestasis-induced adaptive remodelingof interlobular bile ducts. Hepatology 63. 951–964 (2016)
70. Mano, N., Goto, T., Uchida, M., Nishimura, K., Ando, M., Kobayashi,N., Goto, J.: Presence of protein-bound unconjugated bile acids in thecytoplasmic fraction of rat brain. J. Lipid Res. 45, 295–300 (2004)
71. Dionísio, P.A., Amaral, J.D., Ribeiro, M.F., Lo, A.C., D’Hooge, R.,Rodrigues, C.M.P.: Amyloid-β pathology is attenuated bytauroursodeoxycholic acid treatment in APP/PS1mice after disease onset.Neurobiol. Aging. 36, 228–240 (2015)
72. Keitel, V., Görg, B., Bidmon, H.J., Zemtsova, I., Spomer, L., Zilles, K.,Häussinger, D.: The bile acid receptor TGR5 (Gpbar-1) acts as aneurosteroid receptor in brain. Glia 58, 1794–1805 (2010)
722 I. Rzagalinski et al.: Mass Spectral Imaging of Bile Acids in Mouse Liver