malaysia investment performance report 2019
TRANSCRIPT
M A L AY S I A I N V E S T M E N T P E R F O R M A N C E R E P O RT
2019

GLOBAL & MALAYSIA’s
FDI INFLOWS
MALAYSIA INVESTMENT PERFORMANCE REPORT 2019 3
World Developed
Economies
Developing
Economies
Developing
Asia
Transition
Economies
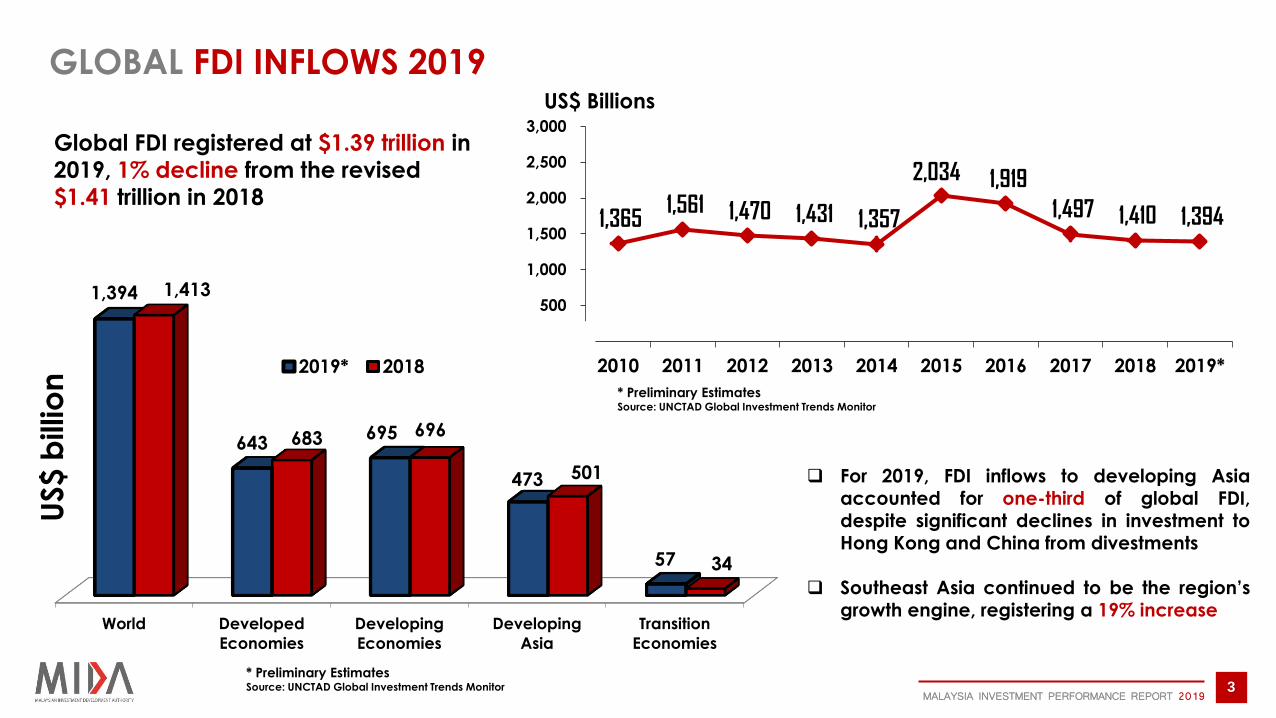
1,394
643 695
473
57
1,413
683 696
501
34
2019* 2018
1,365 1,561 1,470 1,431 1,357
2,034 1,919
1,497 1,410 1,394
-
500
1,000
1,500
2,000
2,500
3,000
2010 2011 2012 2013 2014 2015 2016 2017 2018 2019*
Global FDI registered at $1.39 trillion in 2019, 1% decline from the revised
$1.41 trillion in 2018
* Preliminary Estimates Source: UNCTAD Global Investment Trends Monitor
US$ Billions
For 2019, FDI inflows to developing Asia
accounted for one-third of global FDI, despite significant declines in investment to Hong Kong and China from divestments
Southeast Asia continued to be the region’s growth engine, registering a 19% increase
* Preliminary Estimates Source: UNCTAD Global Investment Trends Monitor
GLOBAL FDI INFLOWS 2019 U
S$
billio
n
MALAYSIA INVESTMENT PERFORMANCE REPORT 2019 4
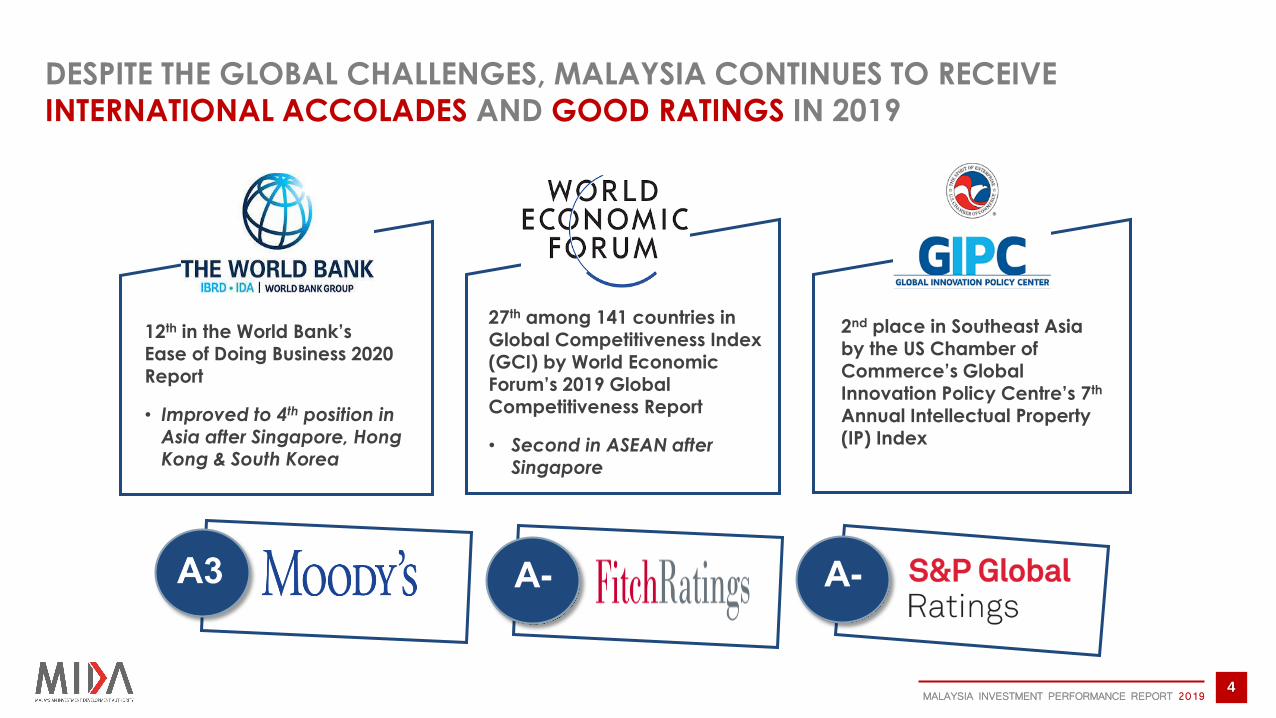
2nd place in Southeast Asia by the US Chamber of Commerce’s Global Innovation Policy Centre’s 7th
Annual Intellectual Property (IP) Index
27th among 141 countries in Global Competitiveness Index (GCI) by World Economic
Forum’s 2019 Global Competitiveness Report
• Second in ASEAN after Singapore
12th in the World Bank’s Ease of Doing Business 2020 Report
• Improved to 4th position in Asia after Singapore, Hong Kong & South Korea
DESPITE THE GLOBAL CHALLENGES, MALAYSIA CONTINUES TO RECEIVE
INTERNATIONAL ACCOLADES AND GOOD RATINGS IN 2019

APPROVED INVESTMENTS
IN THE ECONOMY, 2019

MALAYSIA INVESTMENT PERFORMANCE REPORT 2019 6
RM207.9 billion investments
5,140 projects
124,443 new jobs
RM207.9
billion
DDI
RM125.5 billion (60.37%)
FDI
RM82.4 billion (39.63%)
1.7% increase in approved
investments from RM204.4 billion
in 2018 to RM207.9 billion in 2019
FDI and DDI increased by 2.9%
and 1.1% from RM80.1 billion
and RM124.2 billion respectively
in 2018
DDI assumes greater role in
complementing FDI in driving
Malaysia’s investment agenda
TOTAL APPROVED INVESTMENTS
IN THE ECONOMY, 2019
MALAYSIA INVESTMENT PERFORMANCE REPORT 2019 7
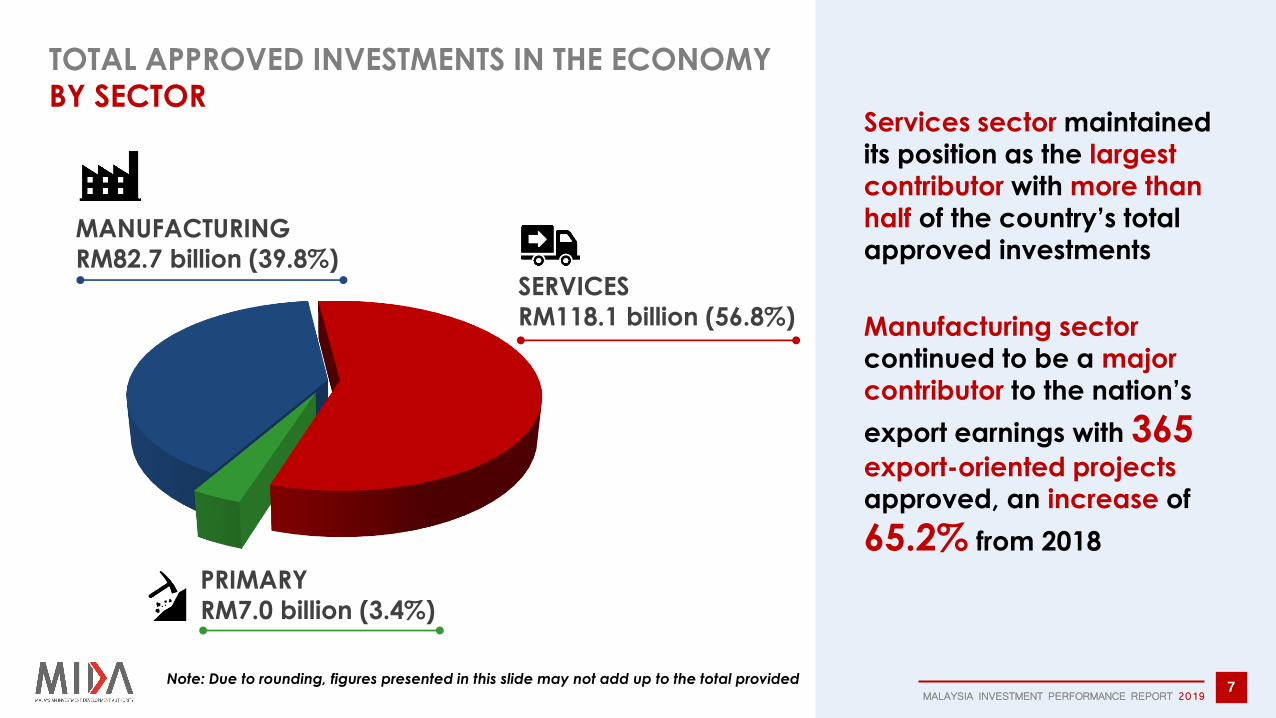
SERVICES
RM118.1 billion (56.8%)
PRIMARY
RM7.0 billion (3.4%)
MANUFACTURING
RM82.7 billion (39.8%)
Services sector maintained
its position as the largest
contributor with more than half of the country’s total
approved investments
Manufacturing sector continued to be a major
contributor to the nation’s
export earnings with 365 export-oriented projects
approved, an increase of
65.2% from 2018
TOTAL APPROVED INVESTMENTS IN THE ECONOMY
BY SECTOR
Note: Due to rounding, figures presented in this slide may not add up to the total provided
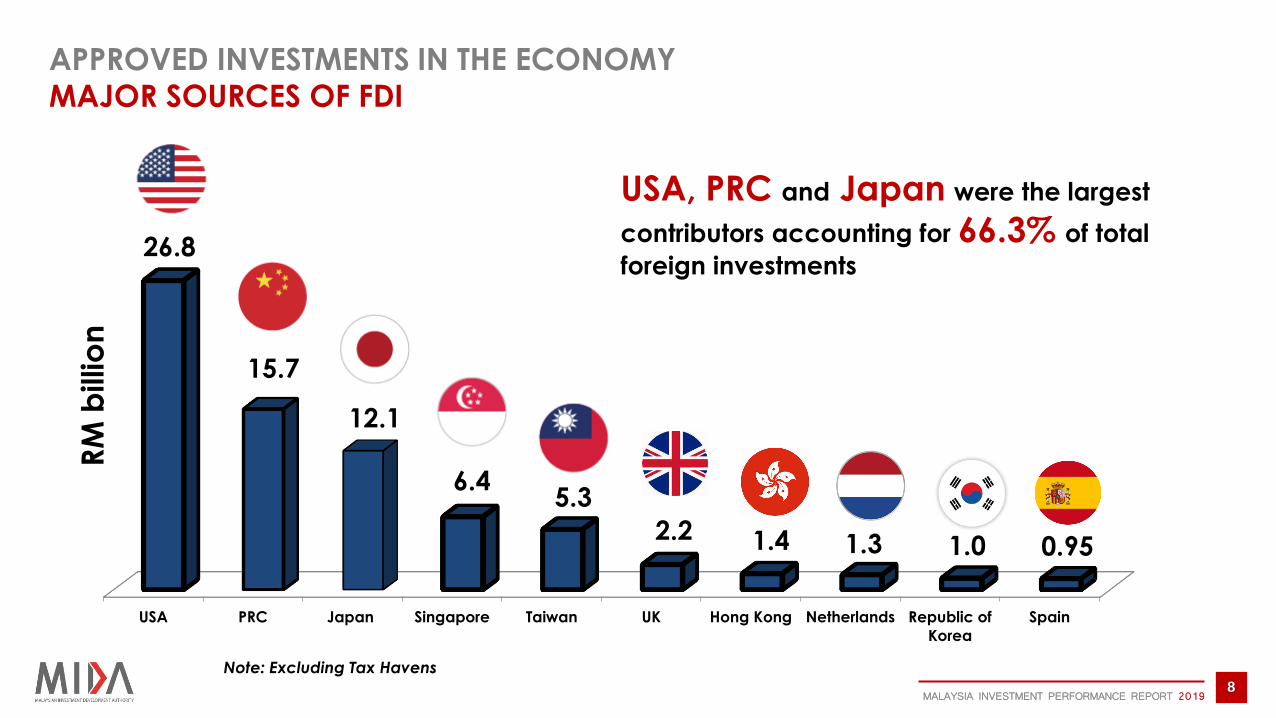
USA PRC Japan Singapore Taiwan UK Hong Kong Netherlands Republic of
Korea
Spain
26.8
15.7
12.1
6.4 5.3
2.2 1.4 1.3 1.0 0.95
MALAYSIA INVESTMENT PERFORMANCE REPORT 2019 8
RM
billio
n
APPROVED INVESTMENTS IN THE ECONOMY
MAJOR SOURCES OF FDI
Note: Excluding Tax Havens
USA, PRC and Japan were the largest
contributors accounting for 66.3% of total
foreign investments
MALAYSIA INVESTMENT PERFORMANCE REPORT 2019
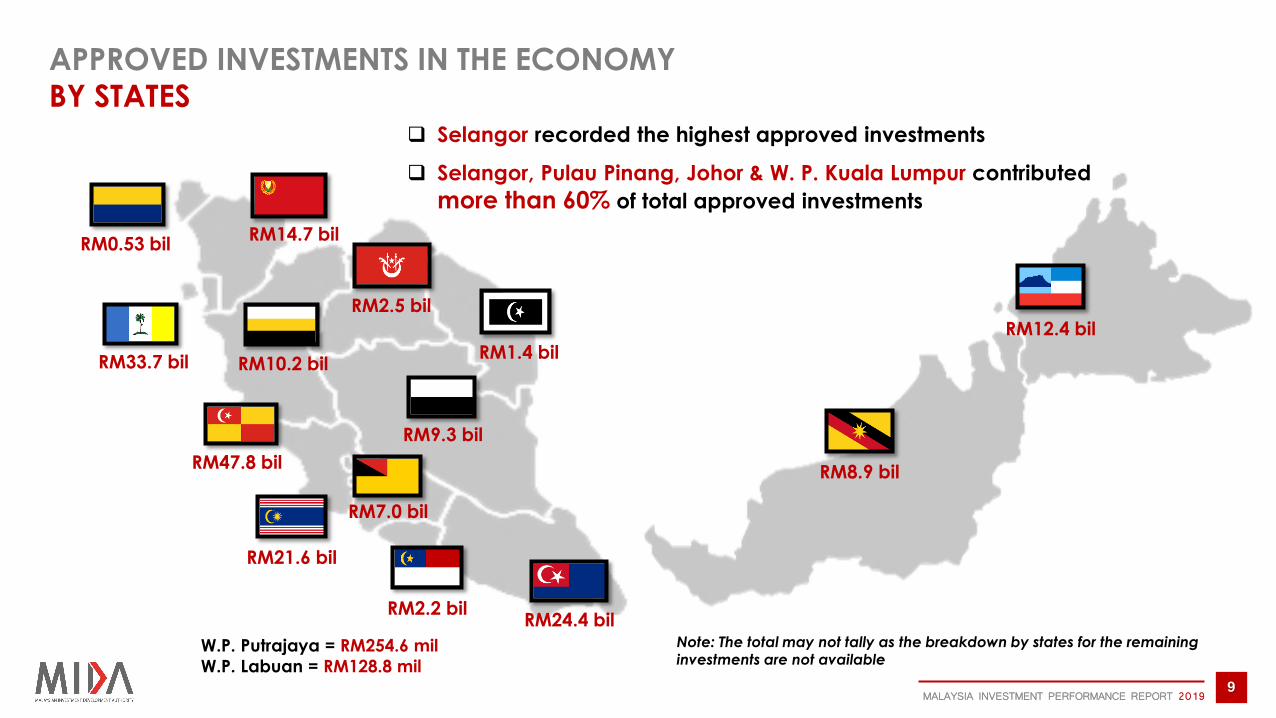
RM47.8 bil
RM33.7 bil
RM14.7 bil
RM24.4 bil
RM10.2 bil
RM9.3 bil
RM1.4 bil
RM2.5 bil
RM2.2 bil
RM7.0 bil
RM0.53 bil
RM12.4 bil
RM8.9 bil
RM21.6 bil
Selangor recorded the highest approved investments
Selangor, Pulau Pinang, Johor & W. P. Kuala Lumpur contributed
more than 60% of total approved investments
Note: The total may not tally as the breakdown by states for the remaining investments are not available
APPROVED INVESTMENTS IN THE ECONOMY
BY STATES
W.P. Putrajaya = RM254.6 mil
W.P. Labuan = RM128.8 mil 9
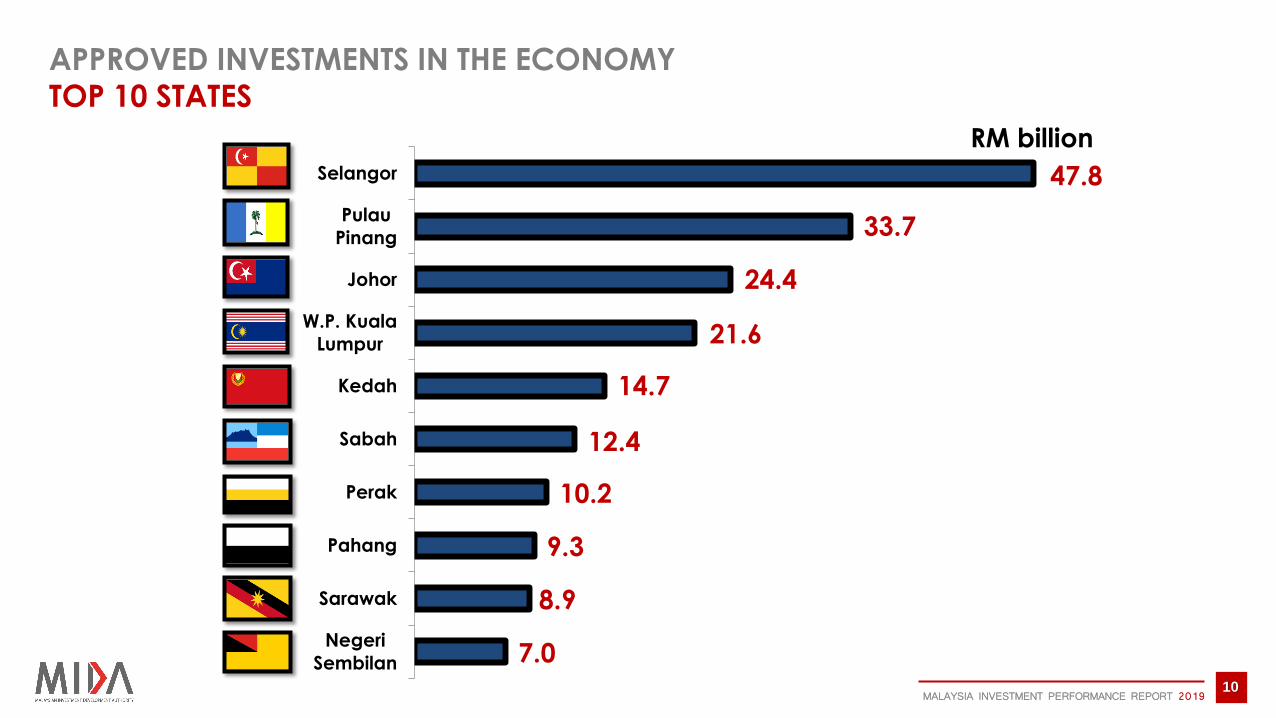
47.8
33.7
24.4
21.6
14.7
12.4
10.2
9.3
8.9
7.0
Selangor
Pulau
Pinang
Johor
W.P. Kuala
Lumpur
Kedah
Sabah
Perak
Pahang
Sarawak
Negeri
Sembilan
MALAYSIA INVESTMENT PERFORMANCE REPORT 2019
APPROVED INVESTMENTS IN THE ECONOMY
TOP 10 STATES
RM billion
10

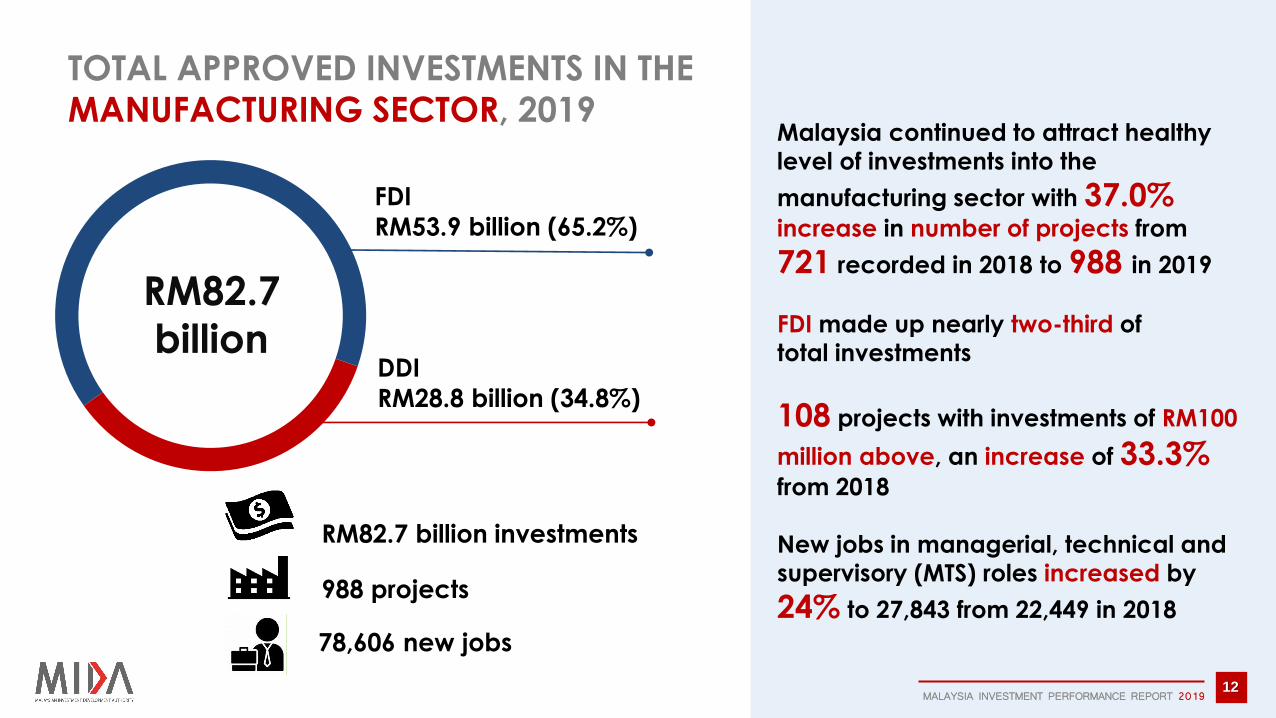
MANUFACTURING
SECTOR
MALAYSIA INVESTMENT PERFORMANCE REPORT 2019 12
RM82.7 billion investments
988 projects
78,606 new jobs
RM82.7
billion
FDI
RM53.9 billion (65.2%)
DDI
RM28.8 billion (34.8%)
Malaysia continued to attract healthy
level of investments into the
manufacturing sector with 37.0%
increase in number of projects from
721 recorded in 2018 to 988 in 2019
FDI made up nearly two-third of
total investments
108 projects with investments of RM100
million above, an increase of 33.3%
from 2018
New jobs in managerial, technical and
supervisory (MTS) roles increased by
24% to 27,843 from 22,449 in 2018
TOTAL APPROVED INVESTMENTS IN THE
MANUFACTURING SECTOR, 2019

NEW PROJECTS
RM45.2 billion (54.7%)
EXPANSION/DIVERSIFICATION PROJECTS RM37.5 billion (45.3%)
RM82.7
billion 535 projects
47,000 new jobs
453 projects
31,606 new jobs
Malaysia remained an ideal
location for new investors with
535 new projects recorded, or
54.1% of total projects approved
RM45.2 billion or 54.7% from the
total approved investments, were new investments FDI continued to dominate both
new and expansion/diversification projects DDI focused on new projects with investments worth of
RM18.0 billion, 65.1% higher
than expansion/diversification projects
RM18.0 bil (39.8%)
RM27.2 bil (60.2%)
RM10.9 bil (28.9%)
RM26.7 bil (71.1%)
FDI DDI
FDI
DDI
TOTAL APPROVED INVESTMENTS IN THE MANUFACTURING SECTOR
BY TYPE OF PROJECTS
MALAYSIA INVESTMENT PERFORMANCE REPORT 2019 13

Electrical & Electronics
Paper, Printing & Publishing
Transport Technology
Non-Metallic Mineral Products
Chemicals & Chemical Products
Rubber Products
Machinery & Equipment
Food Manufacturing
Petroleum Products (inc. Petrochemicals)
Scientific & Measuring Equipment
Plastic Products
Fabricated Metal Products
Others (wood, basic metal, natural gas,
textiles, furniture, miscellaneous)
MALAYSIA INVESTMENT PERFORMANCE REPORT 2019 14
25.7
10.8
8.0
6.9
4.8
4.6
4.5
3.8
3.2
2.5
2.5
2.0
< 1.0
RM billion
Top 5 Industries contributed 68.0% of total
approved investments in the manufacturing sector
FDI and DDI for the following industries
increased more than 100% from 2018:
FDI:
Electrical & Electronics, Machinery & Equipment,
Transport Technology, Food Manufacturing,
Non-Metallic Mineral Products and Scientific &
Measuring Equipment
DDI:
Transport Technology, Electrical & Electronics,
Non-Metallic Mineral Products, Chemicals &
Chemical Products, Plastic Products and Paper,
Printing & Publishing
APPROVED INVESTMENTS IN THE MANUFACTURING SECTOR
BY INDUSTRY

Electrical & Electronics
Chemicals & Chemical
Products
Machinery & Equipment
Medical Devices
Aerospace
MALAYSIA INVESTMENT PERFORMANCE REPORT 2019 15
RM billion
APPROVED INVESTMENTS IN THE MANUFACTURING SECTOR
3 catalytic and 2 high growth sub-sectors (3+2) under the 11th Malaysia Plan
25.7
4.8
4.5
3.9
2.0
Approved investments
increased by 90.2% from
RM21.5 billion in 2018 to
RM40.9 billion
386 approved projects,
an increase of 53.8% from
251projects in 2018
Capital Investment Per
Employee (CIPE) increased
by 20.0% from 2018
13,391 new jobs in
managerial, technical and
supervisory (MTS) roles
RM40.9 billion (49.5% from total approved
investments in manufacturing sector)
FDI – RM30.6 billion
(80.0% increase from RM17.0 bil in 2018)
DDI – RM10.3 billion (128.9% increase from RM4.5 bil in 2018)
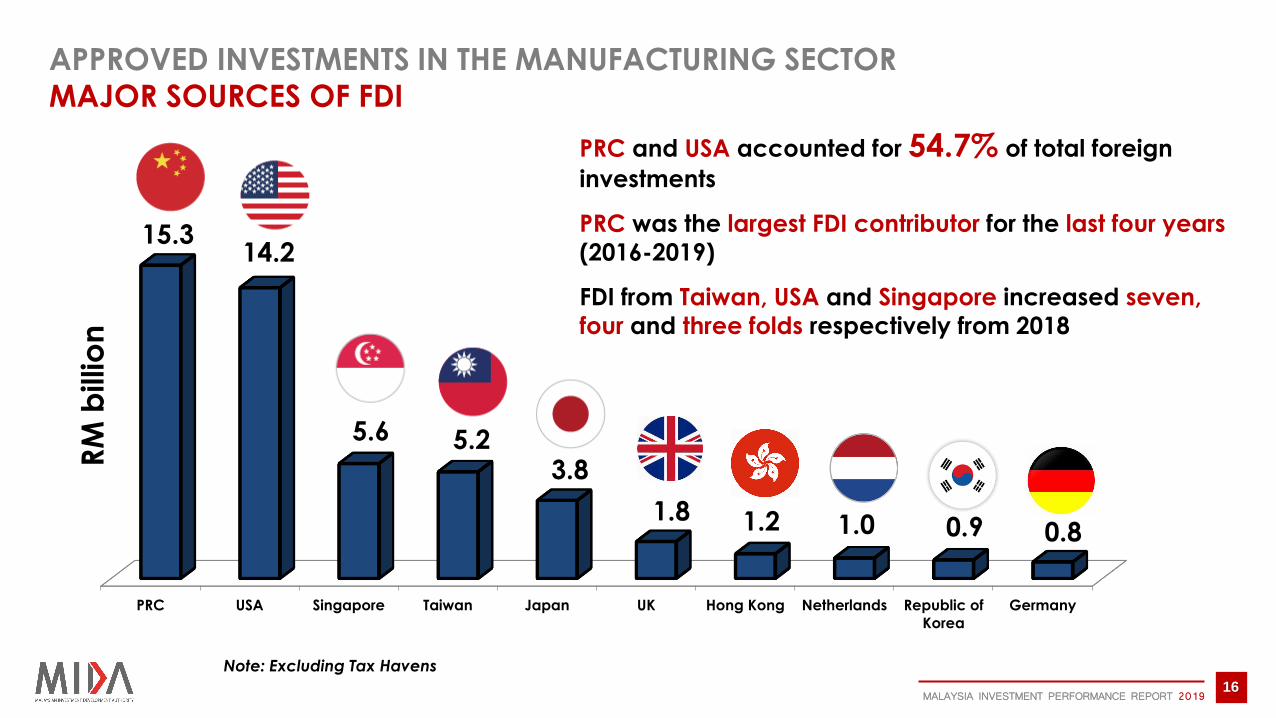
PRC USA Singapore Taiwan Japan UK Hong Kong Netherlands Republic of
Korea
Germany
15.3 14.2
5.6 5.2 3.8
1.8 1.2 1.0 0.9 0.8
MALAYSIA INVESTMENT PERFORMANCE REPORT 2019 16
PRC and USA accounted for 54.7% of total foreign
investments
PRC was the largest FDI contributor for the last four years
(2016-2019)
FDI from Taiwan, USA and Singapore increased seven,
four and three folds respectively from 2018
RM
billio
n
APPROVED INVESTMENTS IN THE MANUFACTURING SECTOR
MAJOR SOURCES OF FDI
Note: Excluding Tax Havens

MALAYSIA INVESTMENT PERFORMANCE REPORT 2019 17
RM17.0 bil
RM16.9 bil
RM11.5 bil
RM11.5 bil
RM6.6 bil
RM4.9 bil
RM638.8 mil
RM18.5 mil
RM879.3 mil
RM3.6 bil
RM53.3 mil
RM6.5 bil
RM2.6 bil
RM174.2 mil
APPROVED INVESTMENTS IN THE MANUFACTURING SECTOR
BY STATES
Selangor recorded the highest approved investments
for manufacturing sector
Selangor, Pulau Pinang, Kedah & Johor contributed
nearly 70% of total approved investments
MALAYSIA INVESTMENT PERFORMANCE REPORT 2019 18
0%
20%
40%
60%
80%
100%
120%
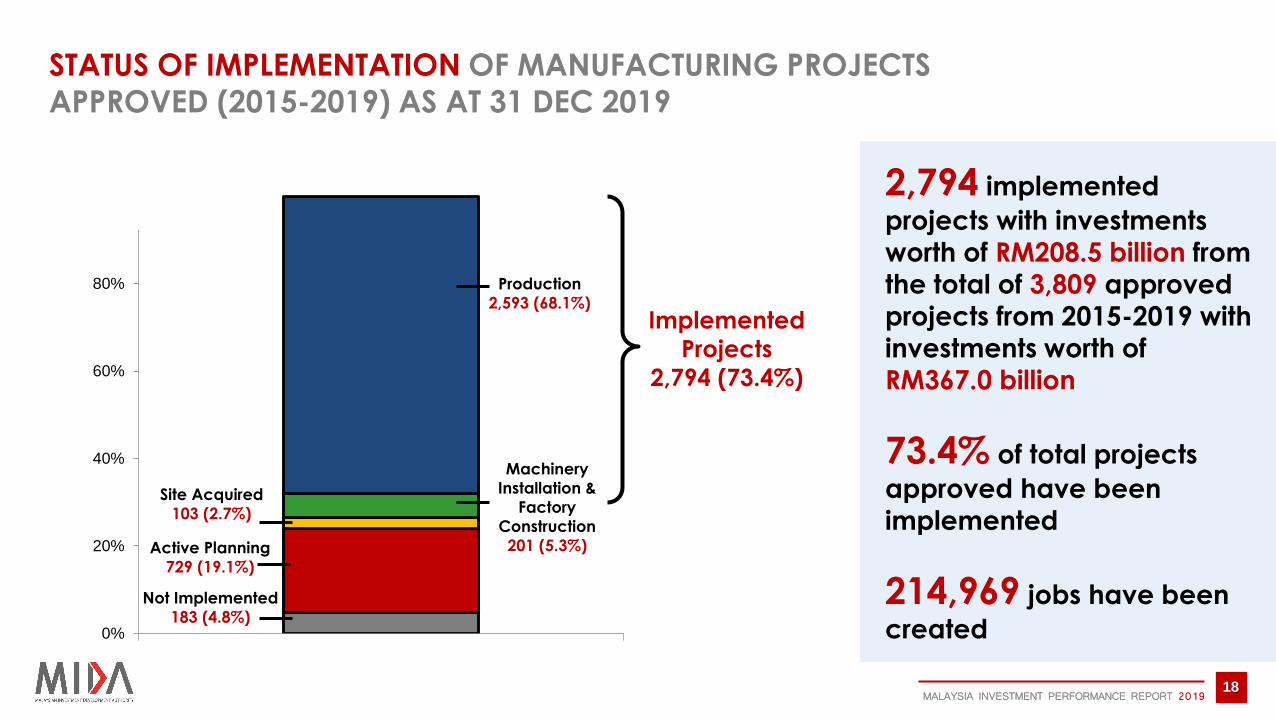
2,794 implemented
projects with investments
worth of RM208.5 billion from
the total of 3,809 approved
projects from 2015-2019 with investments worth of
RM367.0 billion
73.4% of total projects
approved have been
implemented
214,969 jobs have been
created
STATUS OF IMPLEMENTATION OF MANUFACTURING PROJECTS
APPROVED (2015-2019) AS AT 31 DEC 2019
Production
2,593 (68.1%)
Machinery
Installation &
Factory
Construction
201 (5.3%)
Site Acquired
103 (2.7%)
Active Planning
729 (19.1%)
Implemented
Projects
2,794 (73.4%)
Not Implemented
183 (4.8%)
MALAYSIA INVESTMENT PERFORMANCE REPORT 2019 19
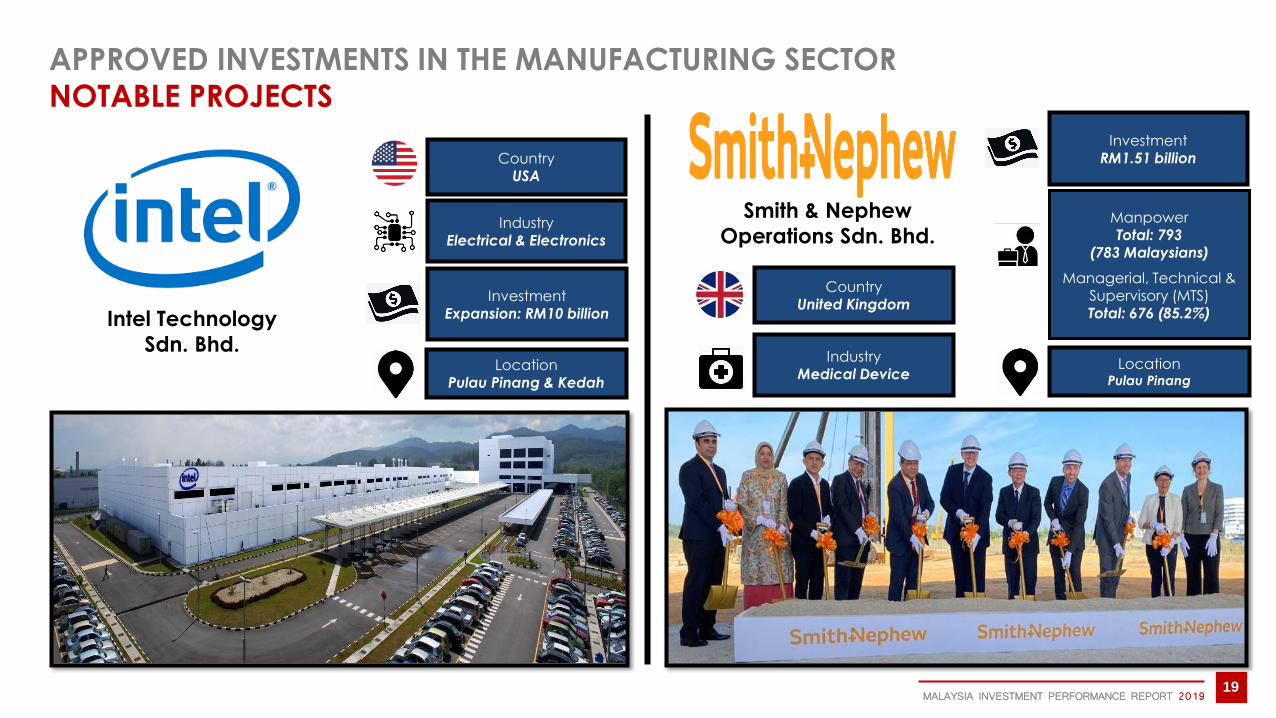
Intel Technology
Sdn. Bhd.
Smith & Nephew
Operations Sdn. Bhd.
APPROVED INVESTMENTS IN THE MANUFACTURING SECTOR
NOTABLE PROJECTS
Country United Kingdom
Industry Medical Device
Investment RM1.51 billion
Location Pulau Pinang
Manpower Total: 793
(783 Malaysians)
Managerial, Technical & Supervisory (MTS)
Total: 676 (85.2%)
Country USA
Industry Electrical & Electronics
Investment Expansion: RM10 billion
Location
Pulau Pinang & Kedah
MALAYSIA INVESTMENT PERFORMANCE REPORT 2019 20
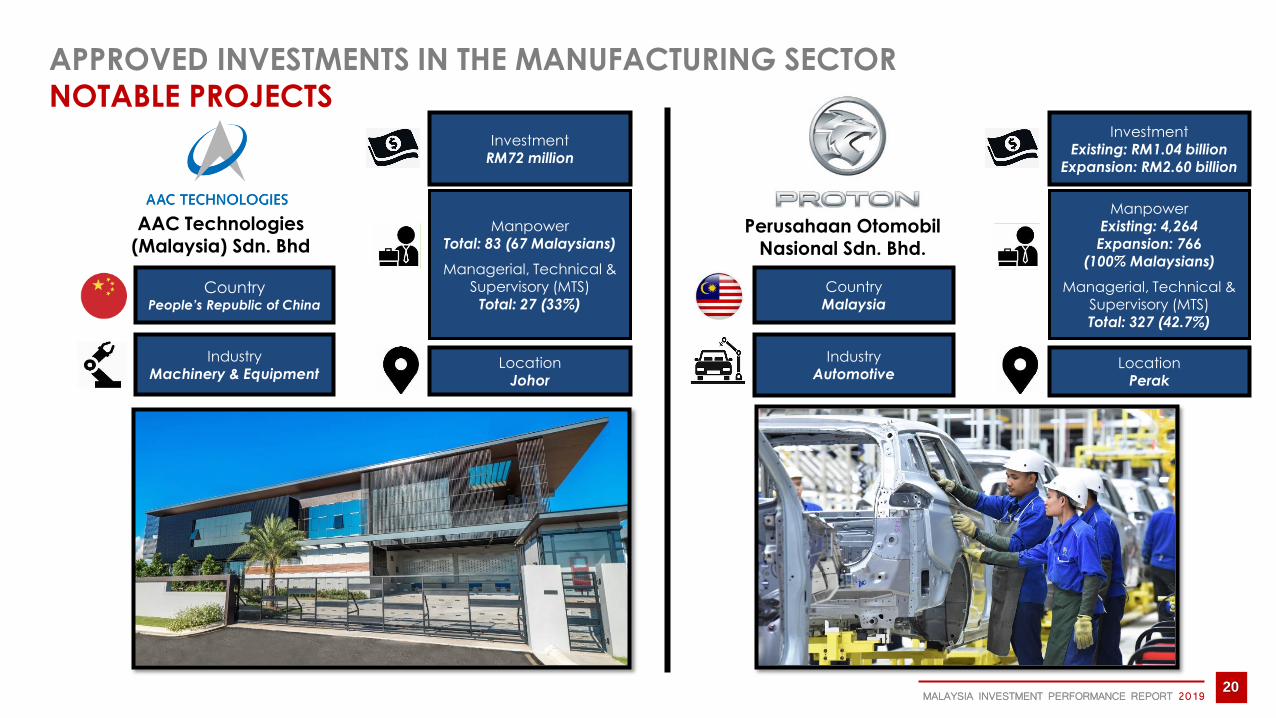
APPROVED INVESTMENTS IN THE MANUFACTURING SECTOR
NOTABLE PROJECTS
Country Malaysia
Industry Automotive
Investment Existing: RM1.04 billion
Expansion: RM2.60 billion
Location Perak
Manpower Existing: 4,264 Expansion: 766
(100% Malaysians)
Managerial, Technical &
Supervisory (MTS) Total: 327 (42.7%)
Perusahaan Otomobil Nasional Sdn. Bhd.
Country People’s Republic of China
Industry Machinery & Equipment
Investment RM72 million
Location Johor
Manpower Total: 83 (67 Malaysians)
Managerial, Technical & Supervisory (MTS)
Total: 27 (33%)
AAC Technologies
(Malaysia) Sdn. Bhd

SERVICES SECTOR
MALAYSIA INVESTMENT PERFORMANCE REPORT 2019 22
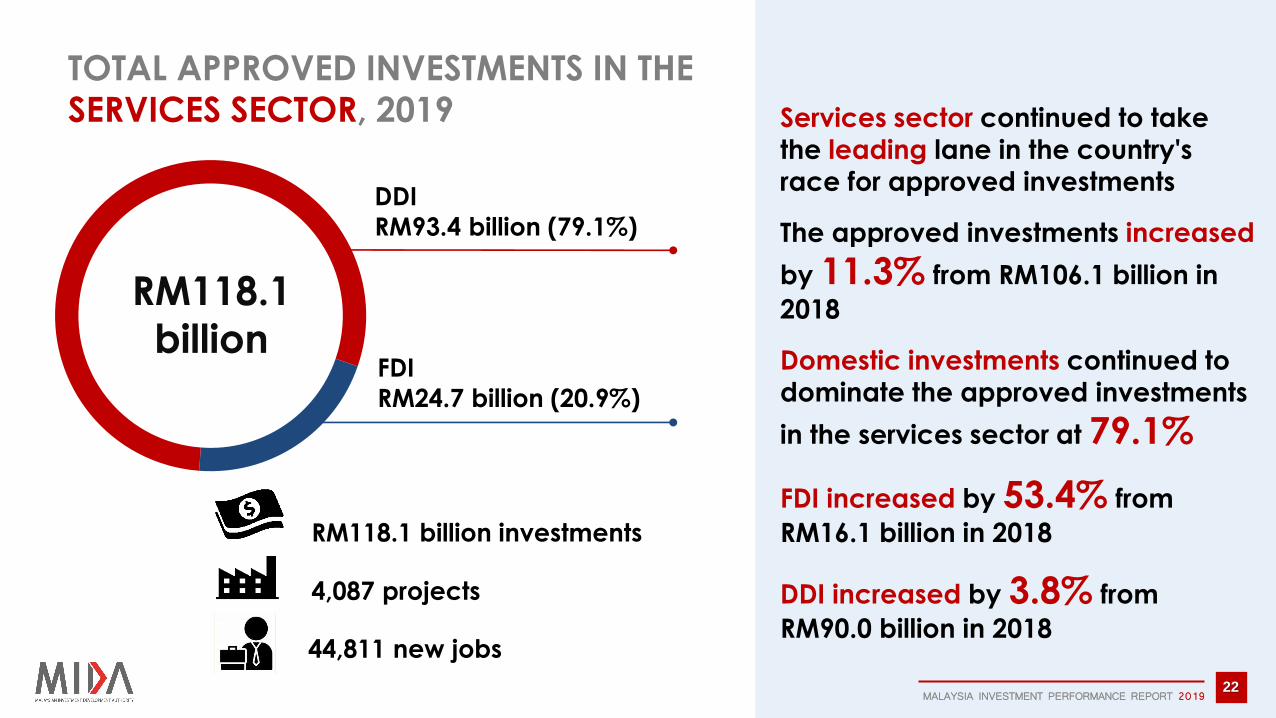
RM118.1 billion investments
4,087 projects
44,811 new jobs
RM118.1
billion
DDI
RM93.4 billion (79.1%)
FDI
RM24.7 billion (20.9%)
Services sector continued to take
the leading lane in the country's race for approved investments
The approved investments increased
by 11.3% from RM106.1 billion in
2018
Domestic investments continued to
dominate the approved investments
in the services sector at 79.1%
FDI increased by 53.4% from
RM16.1 billion in 2018
DDI increased by 3.8% from
RM90.0 billion in 2018
TOTAL APPROVED INVESTMENTS IN THE
SERVICES SECTOR, 2019

Real Estate
Utilities
Global Establishments
Distributive Trade
Support Services
Hotel & Tourism
Telecommunications
Financial Services
Transport, Education Services,
Health Services & Other Services
MALAYSIA INVESTMENT PERFORMANCE REPORT 2019 23
40.9
32.6
11.8
11.7
5.7
5.1
5.0
4.1
1.3
RM billion
Real Estate, Utilities, Global
Establishments & Distributive Trade
sub-sectors contributed
more than 80% of total
investments approved for services
sector
APPROVED INVESTMENTS IN THE SERVICES SECTOR
BY SUB-SECTORS
MALAYSIA INVESTMENT PERFORMANCE REPORT 2019 24
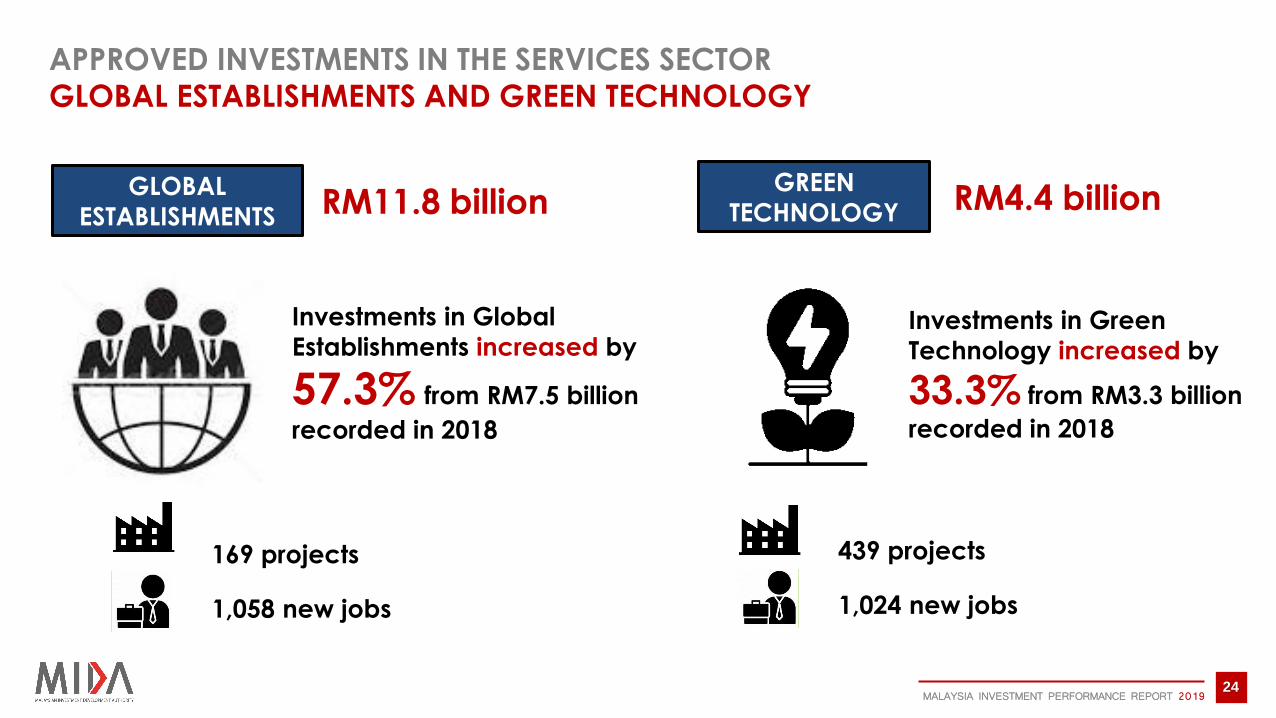
Investments in Global
Establishments increased by
57.3% from RM7.5 billion
recorded in 2018
GLOBAL
ESTABLISHMENTS
GREEN
TECHNOLOGY RM11.8 billion
Investments in Green
Technology increased by
33.3% from RM3.3 billion
recorded in 2018
169 projects
1,058 new jobs
RM4.4 billion
439 projects
1,024 new jobs
APPROVED INVESTMENTS IN THE SERVICES SECTOR
GLOBAL ESTABLISHMENTS AND GREEN TECHNOLOGY

MALAYSIA INVESTMENT PERFORMANCE REPORT 2019 25
APPROVED INVESTMENTS IN THE SERVICES SECTOR
NOTABLE PROJECTS
Country United Kingdom
Industry Healthcare
Investment RM158.16 million
Location
Wilayah Persekutuan Putrajaya
Manpower Total: 465
(461 Malaysians)
Employees with salary more than RM5,000
Total: 54 (11.6%) Country
Malaysia
Industry Green Technology
Investment RM587.5 million
Location Sabah
Manpower Total: 30
(100% Malaysians)
Managerial, Technical & Supervisory (MTS)
Total: 12 (40%)
Daehan Rehabilitation Services Sdn. Bhd.
Telekosang Hydro One (TH1) and Two (TH2)

MALAYSIA INVESTMENT PERFORMANCE REPORT 2019 26
APPROVED INVESTMENTS IN THE SERVICES SECTOR
NOTABLE PROJECTS
Country Malaysia
Industry Logistic
Investment Existing: RM176.38 million
Expansion: RM114.71 million
Location
Sarawak
Manpower Total: 273
(89.4% Malaysians)
Employees with salary more than RM5,000
Total: 29 (10.6%)
Air Marine Cargo Agency
Sdn. Bhd.
Country
Malaysia
Industry Hospitality (5-Star Hotel)
Investment RM281 million
Location Sabah
Manpower Total: 420
(100% Malaysians)
Interland Development Sdn. Bhd.

PRIMARY SECTOR
MALAYSIA INVESTMENT PERFORMANCE REPORT 2019 28
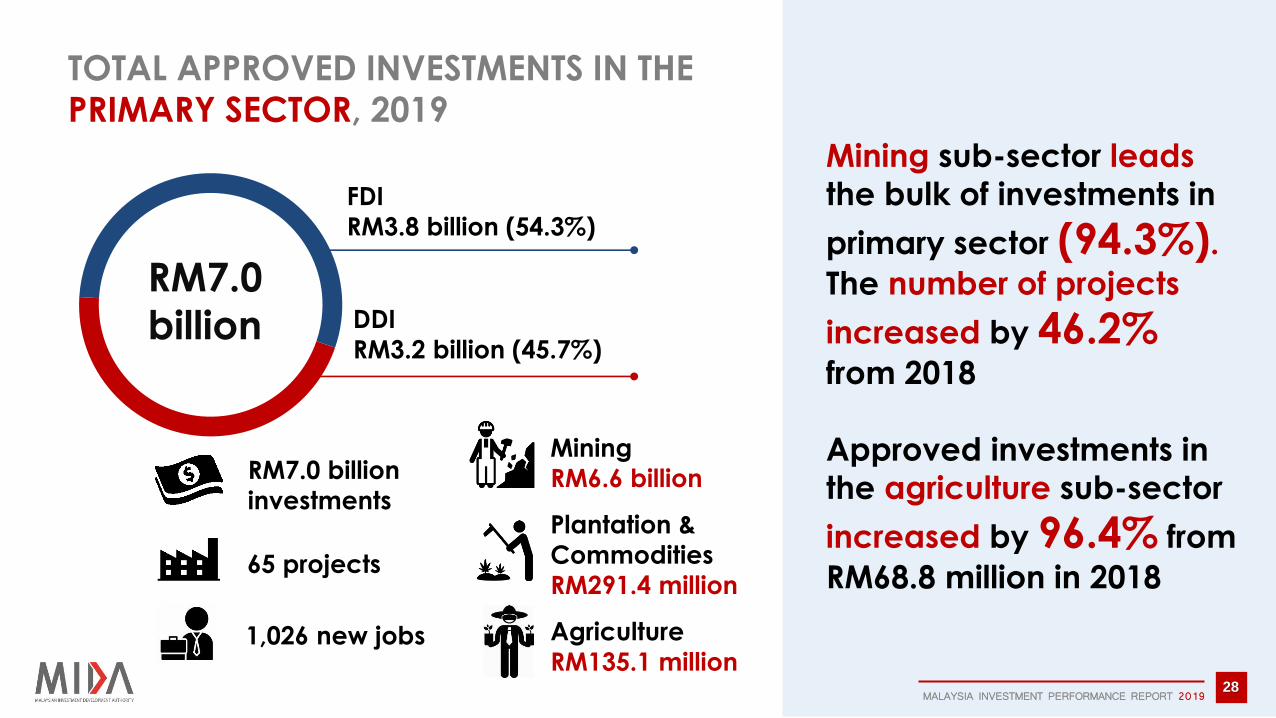
RM7.0
billion
FDI
RM3.8 billion (54.3%)
DDI
RM3.2 billion (45.7%)
Mining
RM6.6 billion
Plantation &
Commodities
RM291.4 million
Agriculture
RM135.1 million
RM7.0 billion
investments
65 projects
1,026 new jobs
Mining sub-sector leads
the bulk of investments in
primary sector (94.3%).
The number of projects
increased by 46.2%
from 2018
Approved investments in
the agriculture sub-sector
increased by 96.4% from
RM68.8 million in 2018
TOTAL APPROVED INVESTMENTS IN THE
PRIMARY SECTOR, 2019

STRATEGIC INITIATIVES
& KEY MESSAGES

MALAYSIA INVESTMENT PERFORMANCE REPORT 2019 30
1 ENHANCEMENT OF NATIONAL COMMITTEE ON INVESTMENT (NCI)
Empowering NCI as the ‘Sole Approving Committee for Investments’ to ensure that investors have a
transparent and obstacle-free process when applying for licence and investment incentives
STRATEGIC INITIATIVES
COST-BENEFIT ANALYSIS (CBA) MODULE
Streamlining and developing the CBA module for the evaluation process of investment projects
for all IPAs, based on MIDA’s current CBA
DOMESTIC INVESTMENT COORDINATION PLATFORM (DICP)
Facilitating in business match-making, access to source of capital (debt and equity),
assisting in initial public offering (IPO) as well as coordinating and arranging for
mergers & acquisition (M&A), divestments and takeovers
MIDA-SLDN APPRENTICESHIP PROGRAMME
Collaboration programme between MIDA, FMM and MOE to bridge the gap
for technical-skilled workers required by industries
NCI
e-TRANS
Transforming MIDA’s core business functions towards
improved efficiency and productivity
2
3
4
5
CBA
DICP
SLDN
5 e-TRANS
FAST - TRACK
6
FAST-TRACK MECHANISM
86.9% of 988 investment projects in the
manufacturing sector were approved through
fast-track mechanism
MALAYSIA INVESTMENT PERFORMANCE REPORT 2019 31
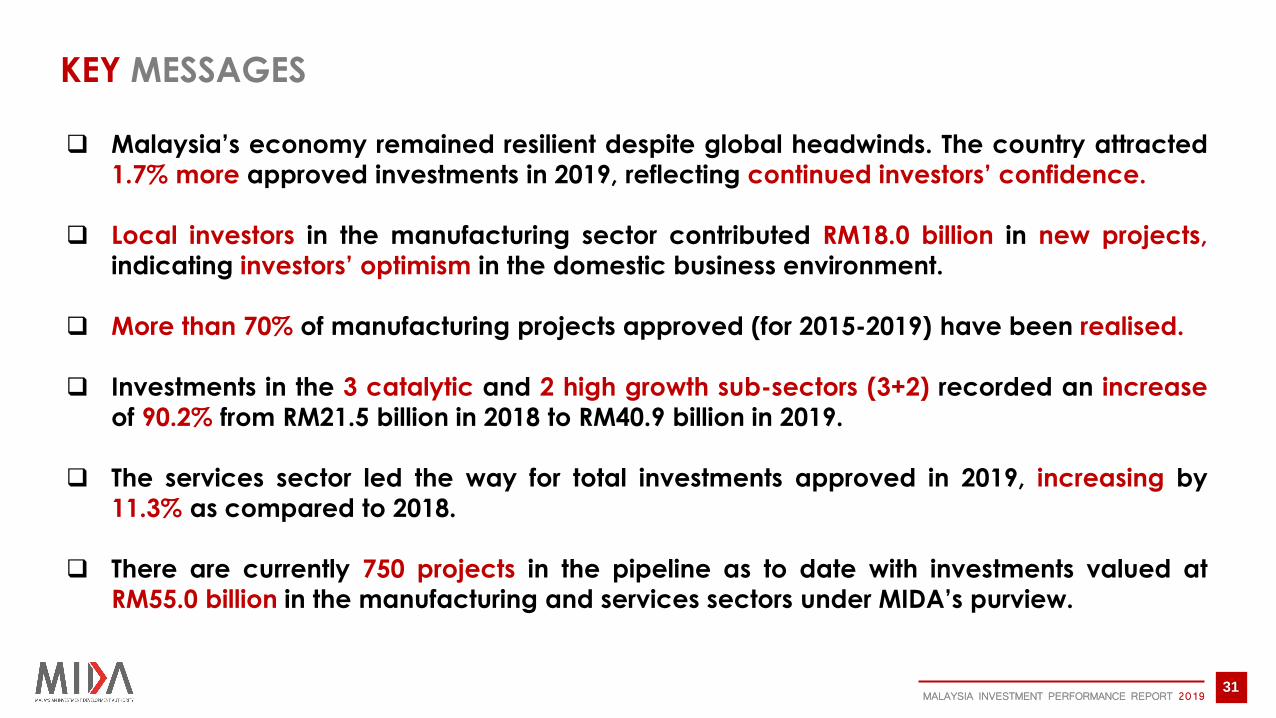
Malaysia’s economy remained resilient despite global headwinds. The country attracted
1.7% more approved investments in 2019, reflecting continued investors’ confidence.
Local investors in the manufacturing sector contributed RM18.0 billion in new projects,
indicating investors’ optimism in the domestic business environment.
More than 70% of manufacturing projects approved (for 2015-2019) have been realised.
Investments in the 3 catalytic and 2 high growth sub-sectors (3+2) recorded an increase
of 90.2% from RM21.5 billion in 2018 to RM40.9 billion in 2019.
The services sector led the way for total investments approved in 2019, increasing by
11.3% as compared to 2018.
There are currently 750 projects in the pipeline as to date with investments valued at
RM55.0 billion in the manufacturing and services sectors under MIDA’s purview.
KEY MESSAGES

THANK YOU