making use of big data october 2015
TRANSCRIPT

Making Use of Big Data What You Can Learn from Detailed Real Estate Data
October 20, 2015
PETER ANGELIDES, PHD, AICP
PRINCIPAL
ECONSULT SOLUTIONS, INC.
PHILADELPHIA, PA

Overview
• Trends in Big Data availability
• Examples of planning-related Big Data
usage
• Real Estate- specific data sources and
uses
Source: SINTEF, http://www.sciencedaily.com/releases/2013/05/130522085217.htm
More than
90%of the world’s data has
been generated since 2011

Creation of Big Data
Source: IBM 2012, https://www.ibm.com/annualreport/2013/bin/assets/2013_ibm_annual.pdf

Big Data
• Trend towards big, “open” data
• Data available from municipal
sources, corporate sources, and more
• Uses are varied and creative

Federal/Regional Sources
• Census (LEHD, Decennial, ACS, PUMS)
• Bureau of Labor Statistics
• Department of Transportation
• World Health Org. or World Bank
• MPOs (i.e. DVRPC)

CENSUS - DECENNIAL
• Collected once every 10 years
• Intended to provide accurate population
count and basic demographic data
• Sent to every U.S. household
Source: http://www.census.gov/2010census/about/

Municipal Sources
• Individual Office Datasets
- Property Assessments
- Recorder of Deeds
- Police (Crime Incident Data)
- 311 calls
• Munistats (municipal tax rates in PA)

Municipal Sources
New Trend: Citywide Open Data

Private Sources
Data Collected by Private Companies
• Uber
• Mastercard

Private Sources
Data for Purchase
• REIS/ CoStar/ IRR (Real Estate)
• NETS (Businesses)
• ESRI (Geo and census)
• STR (Industry)
• Nielson (Consumer data)

EXAMPLE 1 - PHI
Philadelphia Housing Index
• Assessment Data
• Transaction Data
• Many uses

Case Study: ESI Philadelphia Housing
Index
Philadelphia House Sales
Dataset
Philadelphia Property
Assessment Data (OPA)
Philadelphia Transaction Data
(Recorder of Deeds)
Philadelphia Geographic Data
(Census, ESI, OpenDataPhilly)

Data Merge Problems
Human Error/ Dataset Differences
VS
OPA Entries
248 Krams Ave
230 Furley St
9906 Bustleton Ave, Unit C13
1737-39 Chestnut St
Philadox Entries
248 Krams St
230 W Furley St
9906 Bustleton Ave, Unit C-13
1737 Chestnut St

Data Merge Problems
Time Lag in Data Entry
Screenshot from Philadox Deed

Case Study: ESI Philadelphia Housing
Index
Philadelphia and Comparative House Price Indices 2003 – 2014 Q3 (2003 = 100)
90
110
130
150
170
190
210
2003 2004 2005 2006 2007 2008 2009 2010 2011 2012 2013 2014
Philadelphia Philadelphia Metro Area National Average

Case Study: ESI Philadelphia Housing
Index

Case Study: ESI Philadelphia Housing
Index
Each dot on the map represents
one sale. The color indicates the
price per square foot, following the
classification shown on the chart
below.
More than $200
$150 to $200
$101 to $150
$51 to $100
$26 to $50
$25 or Less
473
406
849
930
456
497
Count of Sales by Price per Square Foot
2014, Q3

Case Study: ESI Philadelphia Housing
Index
Subregion House Price Indices 2000 – 2014 Q3 (2003 = 100)
100
120
140
160
180
200
220
240
260
280
2003 2004 2005 2006 2007 2008 2009 2010 2011 2012 2013 2014
Far Northeast Northeast North
Northwest Lower North/River Center City/University
West/Southwest South Citywide
Color of Subregion on chart corresponds to color of
Subregions on map. Quarterly changes noted on map.
-0.1%
+1.0%
-1.3%
+1.6%
+2.8%
+1.2%+0.3%
+5.2%
EXAMPLE 2 – Open Space
Similar to PHI
• Values an asset or characteristic

Case Study: Value of Open Space
$16.3 billion added to the value of
southeastern Pennsylvania’s
housing stock
$240 millionIn annual property and
transfer tax revenue for
local governments
$133 millionIn costs avoided as a result
of the natural provision of
environmental services
$577 millionIn annual benefit for
residents who recreate on
protected open space
$795 millionIn avoided medical costs as a
result of recreation
that takes place on
protected open space
6,900 jobscreated on or as a result
of protected open space
in the five county region

Case Study: Value of Open Space

Case Study: Value of Open Space

EXAMPLE 3 – LEHD
Commuting Patterns
• Works at any geography
• Stratified by income
- $0 - $1,250
- $1250 - $3,333
- >$3,333

CENSUS - LEHD (ON THE MAP)
Source: U.S. Census 2015, http://onthemap.ces.census.gov/

CENSUS - LEHD (ON THE MAP)
Source: U.S. Census 2015, http://onthemap.ces.census.gov/

MUNISTAT
Sources: Munistat - PA DCED (2015), Econsult Solutions (2015)
Combined Resident and School District Earned Income Tax

CENSUS - LEHD (ON THE MAP)
Sources: LEHD 2015 http://onthemap.ces.census.gov, PA DCED (2015) https://www.dced.state.pa.us/systems-and-websites/
Estimated Resident EIT Payments to Sampleville Township
under One Percent Resident EIT, County Summary
County of
Workplace
Sampleville
Resident
Jobs
subject to
EIT
Earnings of
Sampleville
Resident Jobs
subject to EIT
Estimated EIT
Payments to
Sampleville
Estimated EIT
Currently Paid
to Other
Municipalities
Percent of
Estimated EIT
Currently Paid
to Other
Municipalities
Bucks 12,152 491,559,798 4,915,598 1,839,721 37%
Montgomery 3,113 148,242,619 1,482,426 1,295,707 87%
Delaware 660 31,330,978 313,310 102,300 33%
Chester 546 25,159,330 251,593 143,338 57%
Northampton 135 5,884,209 58,842 60,458 100%
Other Counties 381 14,555,996 145,560 149,590 100%
Total PA 16,986 716,732,930 7,167,328 3,591,114 50%
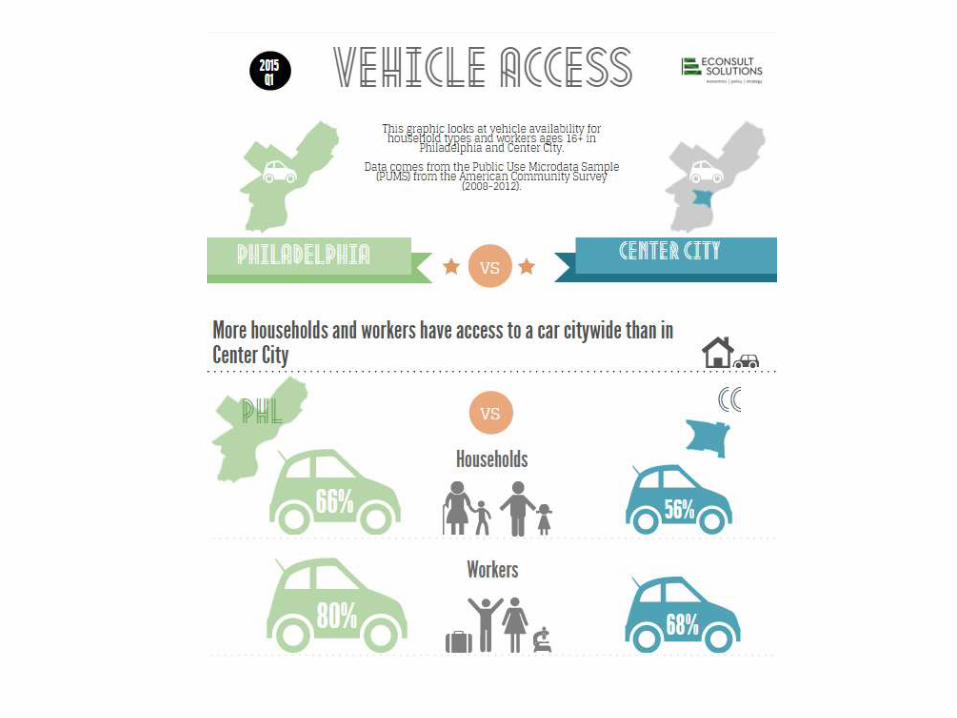
EXAMPLE 4 – ACS
Similar to PHI
• Values an asset or characteristic

CENSUS – AMERICAN COMMUNITY SURVEY
(ACS)
• Collected continuously and available in 1, 3,
and 5 year aggregations
• Sent to small sample of U.S. households
(roughly 3.5 million per year), so all data are
estimates
• Intended to provide more detailed but less
accurate data.
Source: http://www.census.gov/programs-surveys/acs/guidance.html
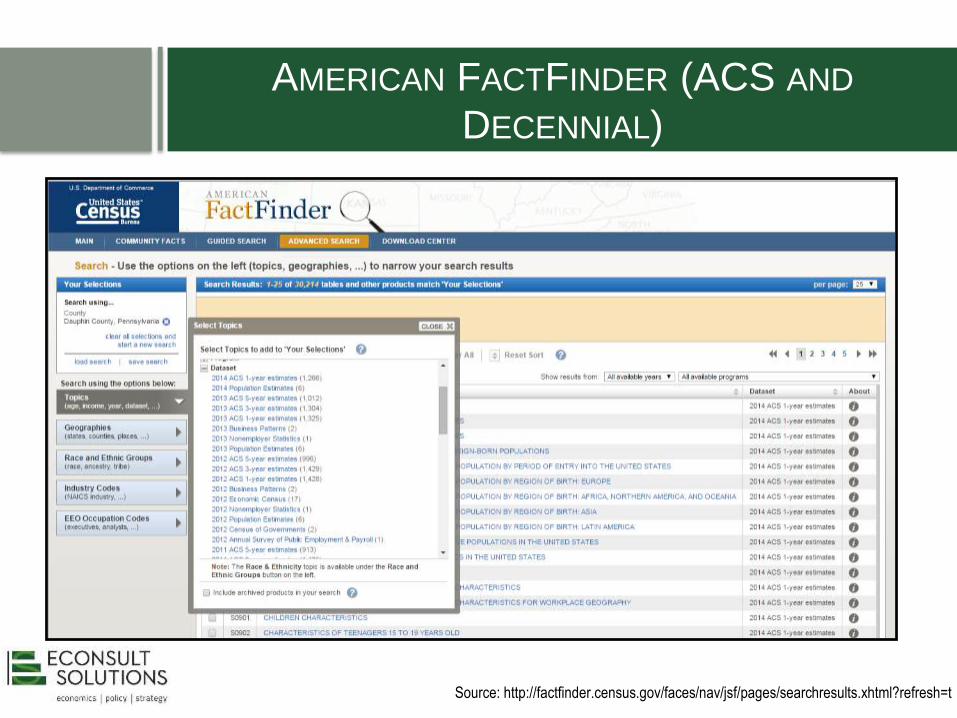
AMERICAN FACTFINDER (ACS AND
DECENNIAL)
Source: http://factfinder.census.gov/faces/nav/jsf/pages/searchresults.xhtml?refresh=t

AMERICAN FACTFINDER (ACS AND
DECENNIAL)
Source: http://factfinder.census.gov/faces/nav/jsf/pages/searchresults.xhtml?refresh=t

CENSUS – PUBLIC USE MICRODATA SAMPLE
(PUMS)
• Raw version of the data used to create
ACS estimates
• Contains raw individual responses
instead of data aggregated to
geographic area
• Gives much more information but large
and more complex to use
Source: https://www.census.gov/programs-surveys/acs/technical-documentation/pums.html


DEMOGRAPHIC MULTIPLIERS WITH PUMS
• Raw data allows for creation of
demographic multipliers based on
averages from ACS data
• Vital to development impact assessment
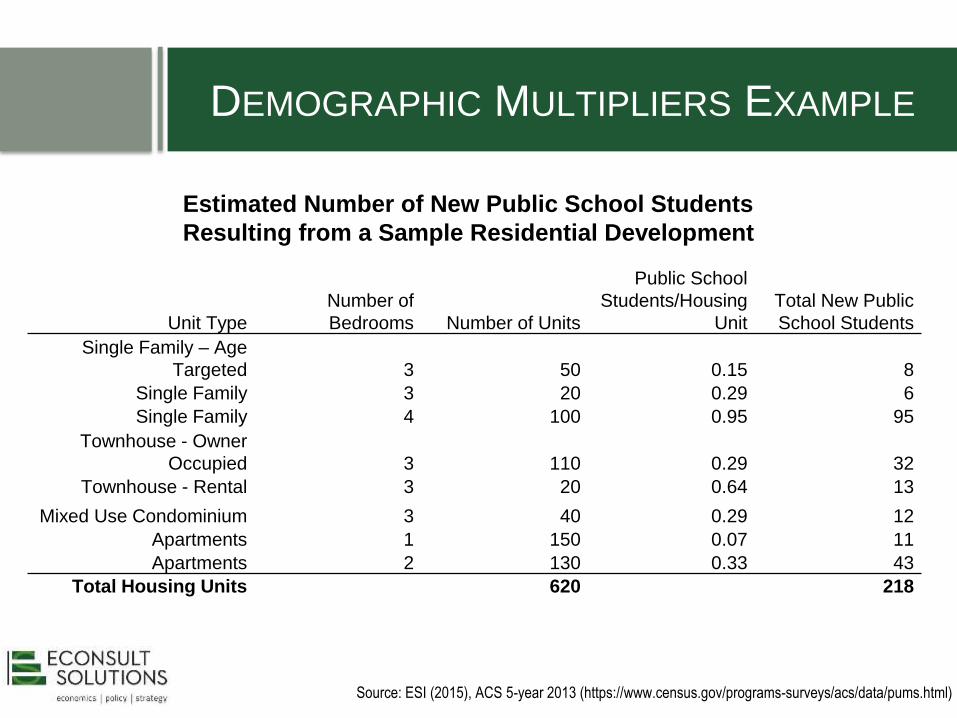
DEMOGRAPHIC MULTIPLIERS EXAMPLE
Unit Type
Number of
Bedrooms Number of Units
Public School
Students/Housing
Unit
Total New Public
School Students
Single Family – Age
Targeted 3 50 0.15 8
Single Family 3 20 0.29 6
Single Family 4 100 0.95 95
Townhouse - Owner
Occupied 3 110 0.29 32
Townhouse - Rental 3 20 0.64 13
Mixed Use Condominium 3 40 0.29 12
Apartments 1 150 0.07 11
Apartments 2 130 0.33 43
Total Housing Units 620 218
Estimated Number of New Public School Students
Resulting from a Sample Residential Development
Source: ESI (2015), ACS 5-year 2013 (https://www.census.gov/programs-surveys/acs/data/pums.html)

DEMOGRAPHIC MULTIPLIERS EXAMPLE
Source: ESI (2015), ACS 5-year 2013 (https://www.census.gov/programs-surveys/acs/data/pums.html)
Revenue Deficit
Revenue Surplus
• Only available
in summarized
tables
• Small
sample
size
• Conducted
yearly
• More
detailed
data
• Only available as
raw data
• Large sample size
• Conducted every 10 years
• Contains only basic data
PUMS
DECENNIAL
ACS
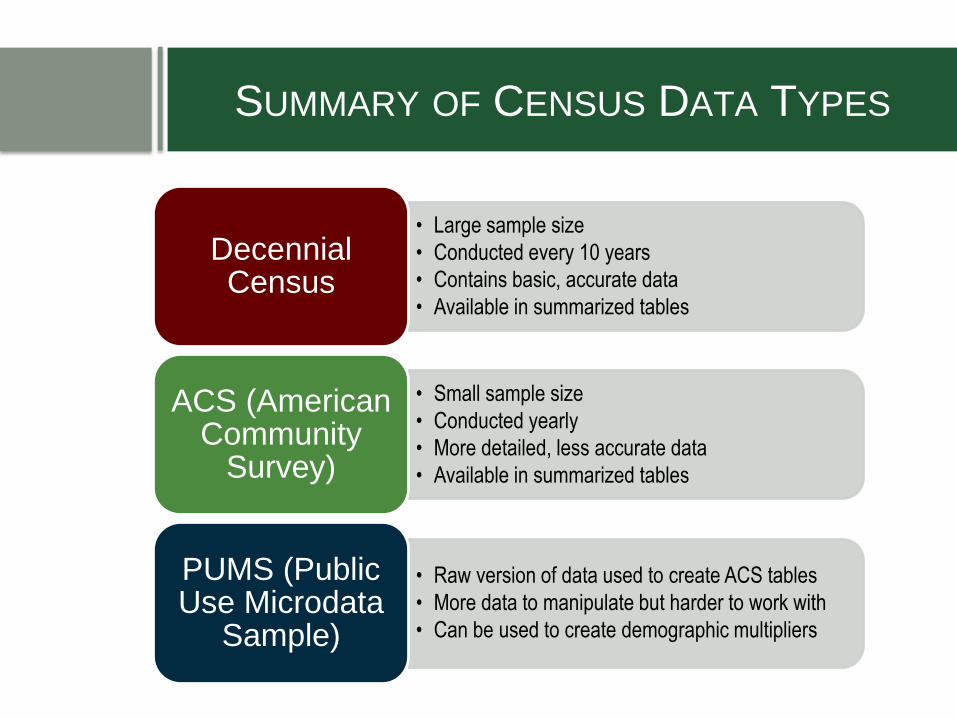
• Large sample size
• Conducted every 10 years
• Contains basic, accurate data
• Available in summarized tables
Decennial Census
• Small sample size
• Conducted yearly
• More detailed, less accurate data
• Available in summarized tables
ACS (American Community
Survey)
• Raw version of data used to create ACS tables
• More data to manipulate but harder to work with
• Can be used to create demographic multipliers
PUMS (Public Use Microdata
Sample)
SUMMARY OF CENSUS DATA TYPES

Other Examples
• CyclePhilly
• WindyGrid
• SEPTA / PAT Cards
• Rich Blocks Poor Blocks (census
data)
• Asavea / Philly Police Crime Map
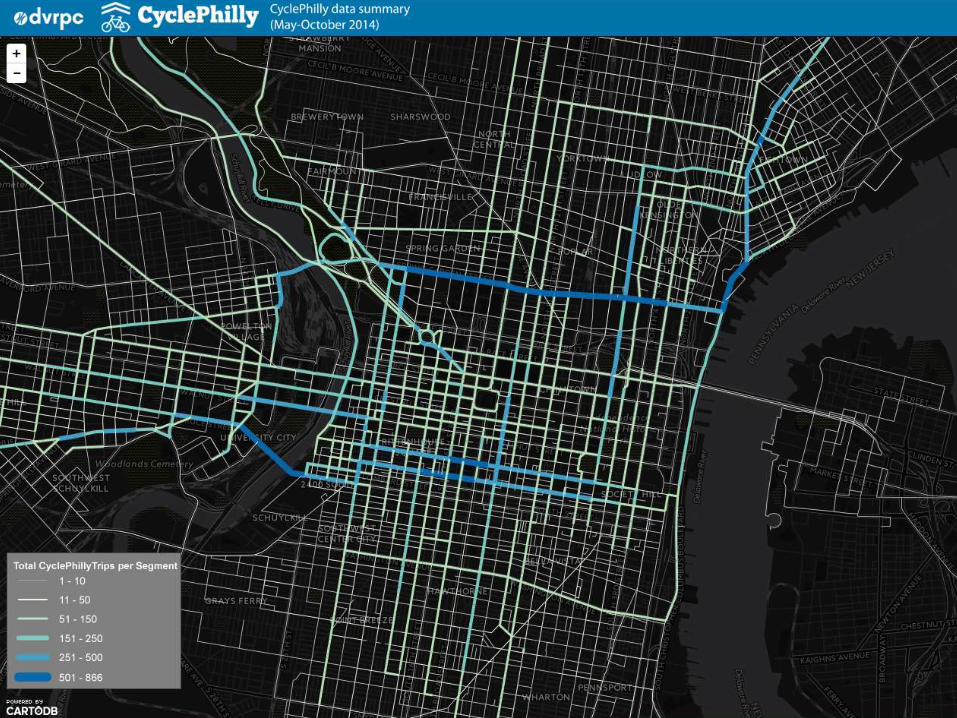
Use: DVRPC/ CyclePhilly
• Smartphone app CyclePhilly collects
data on bicycle trips from users
• DVRPC used data to analyze biking
patterns in Philadelphia
Source: http://www.cyclephilly.org/

Use: Chicago WindyGrid
GIS Application for use by city officials that integrates city building
and spatial data, 911 and 311 calls, and public tweets in real-time.
Source: Harvard Data-Smart City Solutions, http://datasmart.ash.harvard.edu/

Use: New Transit Cards

Thank You
Questions?
Peter Angelides, PhD, AICPEconsult Solutions215-717-2777econsultsolutions.com