making the right move - itdcem.co.in€¦ · procurement and construction across multiple lines of...
TRANSCRIPT
Annual Report 2017
ITD Cementation India Limited
Making the Right Move

What’s Inside
Making the Right Move 01
A Right-Thinking Organisation 02
Right Strategic Approach 08
Financial Performance 10
Letter from the Chairman’s Desk 12
In conversation with Mr. Adun Saraban, Managing Director 14
Moving Right Through Diversification 16
Moving Right Through Partnerships 18
Moving Right Through Technological Advancements 20
Making the Right Business Moves 22
Five Years Financial Highlights 32
An Endorsement that We are on the Right Path 33
Board of Directors and Management Team 34
CORPORATE OVERVIEW01
Standalone Financial Statements
Auditor’s Report 94
Balance Sheet 100
Statement of Profit and Loss 101
Cash Flow Statement 102
Statement of Changes in Equity 104
Accounting Policies and Notes on Accounts 105
Consolidated Financial Statements
Auditor’s Report 150
Consolidated Balance Sheet 154
Consolidated Statement of Profit and Loss 155
Consolidated Cash Flow Statement 156
Consolidated Statement of Changes in Equity 158
Accounting Policies and Notes on Accounts 159
FINANCIAL STATEMENTS
Caution regarding forward-looking statements:This document contains statements about expected future events and financial and operating results of ITD Cementation India Limited, which are forward-looking. By their nature, forward-looking statements require the Company to make assumptions and are subject to inherent risks and uncertainties. There is significant risk that the assumptions, predictions and other forward-looking statements will not prove to be accurate. Readers are cautioned not to place undue reliance on forward-looking statements as a number of factors could cause assumptions, actual future results and events to differ materially from those expressed in the forward-looking statements. Accordingly, this document is subject to the disclaimer and qualified in its entirety by the assumptions, qualifications and risk factors referred to in the management’s discussion and analysis of ITD Cementation India Limited Annual Report 2017.
Board’s Report 37
Management Discussion and Analysis 63
Report on Corporate Governance 76
Business Responsibility Report 87
STATuTORY REPORTS37
94

Business success is not a mere accident but a mix of various factors, all of them collectively driven by the ability to make the right move, every time in every way. This ability is what differentiates a winner from a loser, and distinguishes a successful organisation from an average entity.
At ITD Cementation India Limited, we have evolved this ability to levels that go beyond successful execution delivery to delivering excellence in execution.
We stand today in the capstone of the industry leadership pyramid, with the right understanding of the emerging opportunities across every vertical of our business spectrum.
We have developed a skill-set that gives us the right credentials to harness the huge opportunity matrix carved by the Government of India’s increased focus on infrastructure development, as the key to the nation’s economic progress.
We have in place the right combination of strengths and competencies, coupled with the right attitude and mindset, to ensure on-time delivery with stringent adherence to our commitment, reliability and quality.
Our success story is scripted on this simple mantra of
‘Making the Right Move’.
We have the right technological prowess, to move right through partnerships, to successfully handle large and complex projects effectively and efficaciously, thus building an enviable portfolio of high-end projects across the verticals of our presence.
We have created the right mix of experience and expertise, agility and flexibility to build a unique portfolio of path-breaking projects that stand tall on India’s infrastructural landscape.
And last but not the least, we have the right pedigree in the form of unwavering and active support of our parent company, Italian-Thai Development Public Company Limited, one of the largest construction companies in South East Asia, which gives us access to the best processes and technologies in the infrastructure industry.

A Right-Thinking Organisation
ITD Cementation India Limited is a leading construction company in India operating for over eight decades with proven expertise and an excellent track record of delivering integrated services in design, engineering, procurement and construction across multiple lines of business.
Our busIness verTICaLsOur operational strength spans all the major areas of infrastructure development, with a leadership position in some of the key divisions of growth.
Maritime structures urban Infrastructure/ MrTs
specialist engineering Highways, bridges & Flyovers
Industrial structures & buildings
Hydroelectric Power, Dams & Irrigation
Water & Waste Water Treatment
As the only Company with MNC parentage, we have developed a strong brand recall among clients, including government organisations, port authorities, public sector undertakings, large private sector companies, and state boards, among others.
Headquartered in Mumbai, with area offices in Mumbai, Delhi, Kolkata and Chennai and with a team strength of 2010, the Company is structured to deliver excellence across the entire gamut of its services throughout the EPC value chain.
ITD Cementation India Limited
02 204

Our vision Our aim is a satisfied client, a strong and proactive workforce and a quality product finished on-time and to budget.
Our MissionTo make ITD Cementation India Limited the country’s leading construction Company in customer choice, quality and safety.
Our Core Principles Customers come first.
Employees are our most important asset – working conditions and training must enable them to give their best.
Our quality, health and safety standards will be second to none.
Timely commencement and completion of projects.
Good plant and machinery is our wealth. We ensure that these are always well maintained and in good working order.
Well-developed MIS systems and state-of-the-art technology is our priority.
Environmental awareness and care for the world in which we live will be part of our business philosophy.
Our competitive edge is maintained through specialist skills and commitment to both – training and R&D.
We are the only MnC controlled construction company that is listed on the Indian stock exchanges.
Annual Report 2017
03 204
Com
pany
at a
Gla
nce
Fina
ncia
l Sta
tem
ents
Sta
tuto
ry R
epor
tsC
orpo
rate
Ove
rvie
w

A Right-Thinking Organisation
Maritime structures 41%Urban infrastructure/MRTS 37%Hydro/dams/tunnels/ irrigation 12%Industrial structures and buildings 4%Highways, bridges and flyovers 4%Specialist engineering 2%
Order backlog, 31 December 2016 (%)
Consolidated Order book as at year end
a robust Growth Pipeline Steered by a right-thinking strategy, which is focussed on making the right moves at the right time, we have built a diversified presence across business verticals, clients and geographies, with a current order pipeline consisting of 60 projects in 14 states of India.
We successfully raised ` 336.83 crore through QIP during the quarter ended March 2018, underscoring the success of our strategy and the strength of our business model.
2013 2014 2015 2016 2017` crore 3,821 4,763 5,204 6,584 7,513
As of 31 December 2017, we have an order book of ` 7,513 crore, executable over a period of 30 months. Secured orders of about ` 2,400 crore in January & February 2018 which include a contract of maritime structures of about ` 1,900 crore from Tamil Nadu Generation and Distribution Corporation Limited (TANGENCO) to be executed over a period of approximately 2.5 years.
Maritime structures 22%Urban infrastructure/MRTS 60%Hydro/dams/tunnels/ irrigation 14%Industrial structures and buildings 1%Highways, bridges and flyovers 1%Specialist engineering 1%Water & waste water 1%
Order backlog, 31 December 2017 (%)
ITD Cementation India Limited
04 204
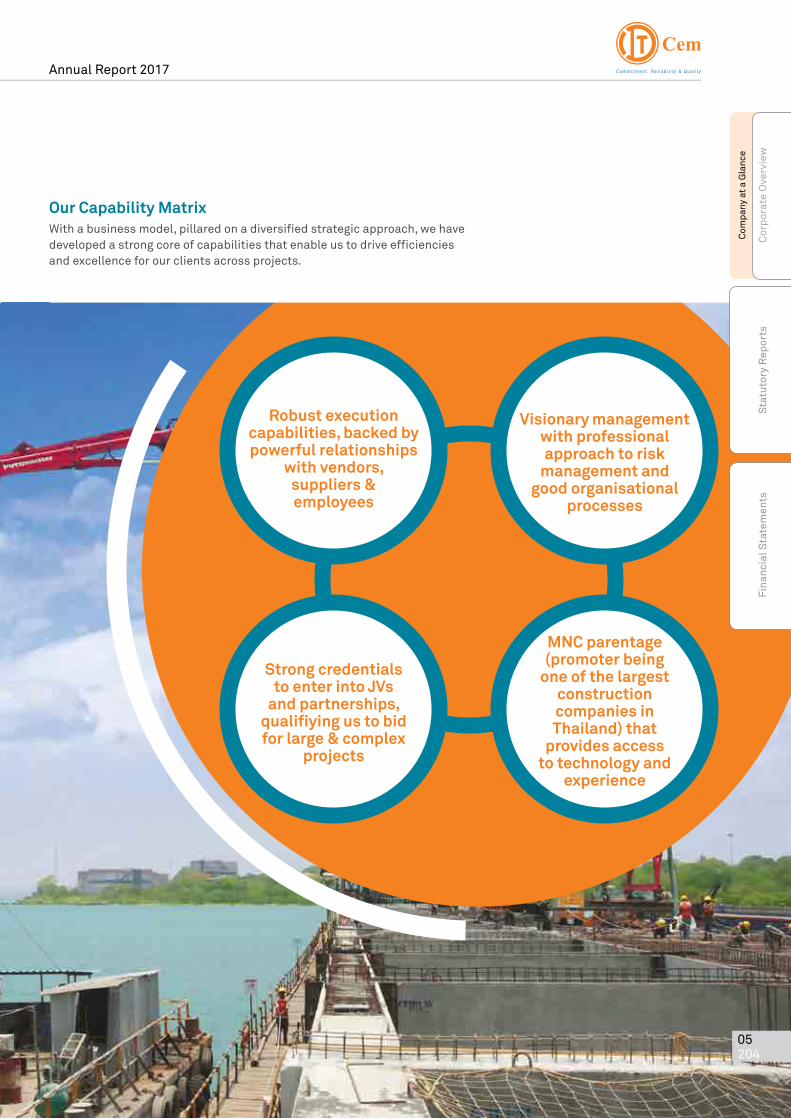
Our Capability MatrixWith a business model, pillared on a diversified strategic approach, we have developed a strong core of capabilities that enable us to drive efficiencies and excellence for our clients across projects.
robust execution capabilities, backed by powerful relationships
with vendors, suppliers & employees
strong credentials to enter into Jvs
and partnerships, qualifiying us to bid for large & complex
projects
visionary management with professional approach to risk
management and good organisational
processes
MnC parentage (promoter being
one of the largest construction companies in Thailand) that
provides access to technology and
experience
Annual Report 2017
05 204
Com
pany
at a
Gla
nce
Fina
ncia
l Sta
tem
ents
Sta
tuto
ry R
epor
tsC
orpo
rate
Ove
rvie
w

A Right-Thinking Organisation
state-of-the-art facilities: Strong inventory of modern, well-equipped plant base handled in a centralised function headed by senior experienced professional team
IsO & OHsas-Latest Re-certification by Dnv-GL:ITD Cementation India Limited has been recently re-certified by DNV-GL for the new IMS standards “ISO 9001:2015, ISO 14001:2015 & OHSAS 18001:2007”
Technological Prowess: Employment of various specialist & sophisticated technologies and processes, including first-time demonstrations/applications
Professional Team: Passionate, skilled and well-trained workforce built by providing a professional work environment & opportunities for career development
Our Competitive strengthsWe have, over the past eight decades, developed core strengths to augment our capabilities, thus facilitating our emergence as one of India’s leaders in the construction industry through superior execution of projects driven by our commitment, reliability, quality and safety.
ITD Cementation India Limited
06 204

Our Marquee ClienteleGovernmentDelhi Metro Rail Corporation, Rail Vikas Nigam Limited, Kolkata Metro Rail Corporation, Inland Waterways Authority of India (IWT), Indian Oil Corporation, Nuclear Power Corporation, Bangalore Metro Rail Corporation, National Highways Authority of India, Mazagon Dock Ltd., Garden Reach Shipbuilders, Airports Authority of India, Indian Railways, Govt. of Telangana, Rites Ltd., Central Public Works Department, Noida, Mumbai Port Trust, Kamarajar Port Limited (erstwhile Ennore Port Ltd.), Nagpur Metro Rail Corporation, Mumbai Metro Rail Corporation
PrivateReliance – Anil Dhirubhai Ambani Group, IHI Corporation, Nhava Sheva Gateway Terminal, Tata Power, PSA (Singapore), DP World, China KunLun Contracting
and Engineering Corporation, Adani Group, Jindal Steel, Samsung, Reliance Industries Limited, Larsen & Toubro, Jindal Power, Gangavaram Port Ltd., IIC Ltd.
Our Quality & esH focusAs a responsible corporate striving to create landmarks of excellence across India’s infrastructural landscape, we remain committed to ensuring stringent controls on quality, environment, safety and health. We have in place integrated systems, aligned to global standards, across the value chain of our operations, to ensure sustained adherence to the highest benchmarks of Quality and ESH principles. We are the first Indian Construction Company to be accredited with Quality Management System in Ports & Harbour domain.
Com
pany
at a
Gla
nce
Fina
ncia
l Sta
tem
ents
Sta
tuto
ry R
epor
tsC
orpo
rate
Ove
rvie
w
Annual Report 2017
07 204

Right Strategic Approach
Development of skill sets and increased investment across a diverse portfolio of infrastructure projects.
Focussing on on-time completion of projects, coupled with constant efforts to improve quality and environmental standards.
Increased shift towards more complex and profitable infrastructure projects.
We are continuously striving to make the most of the increased thrust on infrastructure development, resulting from greater government and private industry investment in this area through:
Focussing on cash positive and margin accretive projects, with faster claim realisation and cost reduction through increasing efficiency.
Exploring possible mid and long term avenues for participation in the infrastructure development projects in order to make the most of the major emerging infrastructural opportunities in the country.
We continue to strengthen our financial capabilities to take up major construction projects and infrastructure development activities, with our past track record of similar projects and bid capacity proving to be critical facilitators for the same. Our initiatives in this direction include:
Select projects based on careful review of our overall margins, including the follow-on construction opportunity in comparison to the risks involved.
Pursue projects in select sectors where we enjoy expertise and face limited competition, such as Urban Infrastructure/MRTS and Maritime Structures.
Enhance our core strengths, such as execution capability, using appropriate systems, processes and on-site working, to equip ourselves for larger and more complex projects.
Expand into areas of construction offering significant growth opportunities in the country.
We are focussed on expanding our presence in infrastructure through participation in key projects on our own, or in partnership with companies with complimentary skill sets, based on the following parameters:
Our business strategies encompass a multi-faceted approach, with the focus on making the right moves in order to harness the best of opportunities in every vertical of our business.
ITD Cementation India Limited
08 204

Enhancing our people’s strength to augment our ability to effectively execute and manage projects in multiple geographic regions.
Providing in-house and external training opportunities to facilitate continuous learning for our existing teams and fresh talent.
Development of human resources and skills enhancement is central to our strategic approach in our journey toward translating India’s infrastructural growth opportunities into greater value for our stakeholders. Towards this end, we remain focussed on:
Concentrating on projects and geographies where we can retain a competitive edge and seek better margins.
We are steadily and successfully increasing our portfolio not only to cater to a wide range of projects across the country but also to diversify into new regions of growth by:
Investments in state-of-the-art construction machinery and equipment, and related operating methods.
Project management skills, with better controls on operating and overhead costs, to maximise our operating margins.
Thrust on strengthening our internal systems to facilitate efficient and cost-effective decision-making.
It is our endeavour to enhance our productivity and competitiveness in order to boost operational and cost efficiencies across our value chain and deliver excellence to our clients by enhancing our:
Str
ateg
ic O
verv
iew
Fina
ncia
l Sta
tem
ents
Sta
tuto
ry R
epor
tsC
orpo
rate
Ove
rvie
w
Annual Report 2017
09 204

Financial Performance
Consolidated Financials (` crore)standalone Financials (` crore)
revenue from operations
2013 2014 2015 2016 2017 Revenue 1,584 1,719 3,071 2,938 2,061
revenue from operations
2013 2014 2015 2016 2017 Revenue 1,260 1,369 2,744 2,917 1,873
ebITDa
2013 2014 2015 2016 2017 EBITDA 197 205 90 235 271 % 12.5 11.9 2.9 7.9 13.2
ebITDa
2013 2014 2015 2016 2017 EBITDA 158 177 51 234 265 % 12.9 13.1 1.9 8.0 14.2
PaT & ePs PaT & ePs
2013 2014 2015 2016 2017 PAT 9 19 (59) 49 71
PAT % 0.8 1.4 (2.2) 1.7 3.8 EPS 0.8 1.5 (3.8) 3.3 4.7
2013 2014 2015 2016 2017 PAT 9 19 (59) 50 71
PAT % 0.6 1.1 (1.9) 1.7 3.4 EPS 0.8 1.5 (3.8) 3.3 4.7
Figures for the years 2013, 2014 and 2015 are as per IGAAP, while 2016 and 2017 figures are as per Ind AS.
ITD Cementation India Limited
10 204

Consolidated Financials (` crore)
Fina
ncia
l Per
form
ance
Fina
ncia
l Sta
tem
ents
Sta
tuto
ry R
epor
tsC
orpo
rate
Ove
rvie
w
standalone Financials (` crore)
net Worth net Worth
2013 2014 2015 2016 2017 Net Worth 408 568 508 552 617 RoE% 2.3 4.0 (11.0) 9.4 12.1
2013 2014 2015 2016 2017 Net Worth 408 568 508 553 618 RoE% 2.3 4.0 (11.0) 9.4 12.1
DebT
2013 2014 2015 2016 2017 EBITDA 770 765 601 356 489 D/E Ratio 1.9 1.4 1.2 0.6 0.8
DebT
2013 2014 2015 2016 2017 EBITDA 695 671 488 356 489 D/E Ratio 1.7 1.2 0.9 0.6 0.8
Figures for the years 2013, 2014 and 2015 are as per IGAAP, while 2016 and 2017 figures are as per Ind AS.
Annual Report 2017
11 204

Letter from the Chairman’s Desk
Dear Shareholders,
It gives me great pleasure to present to you the Company’s annual report for the year. With the sentiment looking up in both the global and the Indian economies, and projections for 2018 clearly positive, the mood in the infrastructure construction industry is upbeat.
The Government of India’s renewed push to infrastructure development, as an engine to drive economic growth, has paved the way for exceptional growth in this sector, creating the enabling environment needed for putting India on a high-growth trajectory. Following up on a series of rigorous policy reforms initiated on social, business and economic fronts over the past few years, the government is now focussed on building the physical infrastructure needed to boost business and investor mood by promoting ease of business.
There is, hence, a concerted and aggressive thrust on building the country’s infrastructural strength in the areas of maritime structures, water & sanitation, power, roads
& highways, railway and metro, aviation, telecommunication etc. The Union Budget for 2018-19 has allocated ` 5.97 trillion for the creation and upgradation of infrastructure. It has also provided for the largest-ever rail and road budget of ` 1.48 trillion and ` 1.21 trillion, respectively.
The policy and budgetary support from the Government to the critical road transport infrastructure, along with focussed rural development initiatives and introduction of Hybrid Annuity Model (HAM) and EPC Projects under Bharatmala, has paved the way for increased investments in this segment. The road transport segment is also getting a lot of international support, which is further expected to boost growth in the area.
The prospects ahead of us are bright indeed, amid strong expectations of a sustained growth phase for the Indian infrastructure sector in particular, and the economy as a whole. Some challenges still remain, particularly in the form of slow pace of urbanisation with transportation infrastructure in cities failing to
The union budget for 2018-19 has
allocated
` 5.97 trillionfor infrastructure
match global standards, poor road and highways connectivity, and capacity constraints at airports and ports. However, the opportunities far outweigh the challenges, giving us a strong sense of optimism as we move strategically towards making the right moves in the transforming environment.
Undoubtedly, we are well prepared, and are at the right place with the right credentials, to ride the rising infrastructure development wave. I am confident that with the continued support of our customers, bankers, partners and shareholders, we shall make the most of the opportunity to deliver greater value to all our stakeholders. I would like to take this opportunity to thank you all for partnering us in this journey, and assure you that we are on track and making the right move.
Thank you.
With my best wishes,
Premchai KarnasutaChairman
The infrastructure development segment is in the midst of extreme positivity, at the back of the Government of India’s renewed thrust on this sector and an overall optimism in the economic sentiment of the country.
ITD Cementation India Limited
12 204

Annual Report 2017
13 204
Cha
irm
an's
Mes
sage
Fina
ncia
l Sta
tem
ents
Sta
tuto
ry R
epor
tsC
orpo
rate
Ove
rvie
w

In conversation with Mr. Adun Saraban, Managing Director
Q. The board of Directors of your Company approved the allotment of equity shares in early February 2018. Could you throw some light on this topic?
A: We have completed Qualified Institutions Placement of 16,629,684 equity shares of face value of ` 1 per share at ` 202.55 per equity share and mobilised ` 336.83 crore. Reputed investors participated in our QIP and we are very thankful to them for reposing their faith and trust in the Company’s Management.
Q. Please tell us about some of your major ongoing projects.
A: We have commenced construction of ten elevated metro stations, excluding viaducts, on the East-West Corridor in Reach-3 of the Nagpur Metro Rail Project, which are together worth ` 512 crore. The elevated viaduct design and construction project is worth another ` 336 crore.
There are four projects for construction of elevated structures that we are working on for Bangalore Metro Rail Corporation Ltd., which are around ` 2,370 crore. We are also engaged in underground section work for Mumbai Metro Line 3. Of the three Tunnel Boring Machines (TBMs) slated for the project, two are already in operation and the third is slated to commence work by the end of May 2018.
We have undertaken construction of the Multi Modal Inland Water Transport (IWT) Terminal for Haldia - West Bengal and are also involved in improving the Capacity Utilisation of two berths for Visakhapatnam Port Trust.
In addition, we are involved in EPC work for Berth & Approach Trestle
10 projects in progress. Hydroelectric Power, Dams & Irrigation verticals contributed 14% to the order book, with the remaining segments accounting for the balance.
I see further consolidation in the order book, going forward, having already secured orders worth about ` 2,400 crore in January and February, 2018. This includes one large contract of maritime structure of about ` 1,900 crore from the Tamil Nadu Generation and Distribution Corporation Limited, for the establishment of a captive coal jetty, to be executed over a period of about 2.5 years.
Q. Let us start with the order book - how does the total order book stand as of now? also, could you throw some light on the vertical-wise breakup of the order book for us.
A: Our total order book, as of 31 December 2017, stands at an attractive ` 7,513 crore. This includes our share in the joint venture projects that are under execution. A large part of our order book stems from the Urban Infrastructure/MRTS sector, where we are working on 14 major projects, which are together worth ` 4,547 crore. The Maritime Structure sector has emerged as another major contributor to our order book, accounting for 22%, with
He reflects on the performance of the Company for the year gone by and shares his views on the outlook for the next year.
ITD Cementation India Limited
14 204

in Parangipettai Port, Tamil Nadu, amongst other projects.
Q. The order book looks skewed towards the metro rail and marine sectors. With all the Government focus on the roads and highways sector, will the Company be looking at the opportunities in that sector more aggressively?
A: It is our constant endeavour to de-risk our business through a diversified approach that is directly aligned to the emerging opportunities. Metro rail and marine sectors are, at present, high on our priority, given the huge potential for growth they offer.
While this approach, as mentioned, is driven largely by the opportunities arising in a particular sector, we are also, at the same time, cognizant of the need to carefully review our overall margins vis-à-vis the risks involved in selecting the projects that we should bid for. We shall follow the same strategy going forward as we decide on which projects to focus on at a particular stage of our growth trajectory.
With the kind of project mix we have, our Company has the ability to sustain itself. If there is a slowdown in any one particular vertical, it will de-risk its business by operating in any other available verticals / projects.
Q. What is your order book outlook for the year ahead?
A: The Government of India’s aggressive thrust on promoting the infrastructure sector has given a powerful push to the prospects for growth of our key business segment in the year ahead. Our order book outlook is extremely positive, with several new projects on the radar. Notably, we have bid for a
number of tenders in the Maritime Structures, which we see opening up in a big way. We are also bidding for Airports, selective HAM Model Road Projects, Missing Link Tunnels for Pune Expressway, Track work and Underground MRTS, along with some projects in the hydro space, where we see good margins.
Q. What has been the CaPeX number for 2017 and what should we expect this year?
A: On a consolidated basis, our CAPEX stood at about ` 145 crore. We are looking at similar investments in 2018-19.
Q. What are the initiatives that the Company expects to carry out in the area of Corporate social responsibility?
A: We believe in fulfilling our Corporate Social Responsibility objectives by contributing a part of our earnings towards various activities aimed at providing welfare to the poor, socially and economically backward sections of the society where we have our project construction activities.
Q. Lastly, as the industry becomes more competitive and opportunities increase too, could you share with us the macro direction in which the Company is headed?
A: The theme of this report actually encapsulates our macro direction. In an intensely competitive market environment, leveraging the emerging opportunities requires the ability to make the right moves at the right time, in the right place. This, in turn, is linked to the Company’s ability to develop
the right tools and the right skill-sets needed to ensure not just the capabilities to bid for the right kind of projects but also to execute them successfully, within shorter time frames and benchmarked to the highest benchmarks of quality and safety.
To build these competencies, we are continuously working on improving operational and cost efficiencies, while, at the same time, nurturing our talent pool to steer our business strategies more effectively. Our efforts are also focussed on strengthening our T&D (Training & Development) capabilities to equip us with the technological capabilities needed to effectively address the needs of larger and more complex projects.
Besides growing our presence in the sectors of Metro, Maritime Structures and Specialist engineering, where we continue to see excellent opportunities for further growth, we shall also focus on pursuing sustainable growth opportunities in other sectors, where our parent company has experience and expertise. These include Airports, Highways, HAM selective road projects under Bharatmala, high speed rail, hydro and industrial/ building projects.
We are looking at bidding for larger and complex projects in collaboration with international majors, besides focussing on unique partnership-driven approach with strong subcontract and vendor management. Our goals are also oriented towards team building to cope with the sustainable growth that we see taking place, especially over the next three years.
Annual Report 2017
15 204
Q&
A w
ith
the
Man
agin
g D
irec
tor
Fina
ncia
l Sta
tem
ents
Sta
tuto
ry R
epor
tsC
orpo
rate
Ove
rvie
w

Moving Right Through Diversification
Business diversificationWe have a diversified presence across business areas like Maritime Structures, Urban Infrastructure Projects/Mass Rapid Transit Systems, Airports, Hydroelectric Power Projects, Tunnels and Dams, Irrigation Projects, Highways, Bridges and Flyovers, Industrial Structures and Buildings and Specialist Engineering.
Our ability to shift between the key segments of infrastructure growth, particularly between Urban Infrastructure and Maritime
Structures, has helped us de-risk us from the cyclic fluctuations in any one segment. At the same time, it has enabled us to effectively tap opportunities in segments that present large opportunities and offer higher returns.
Geographic spreadOur projects are geographically dispersed across various states in the country. At present, we are executing 60 projects across 14 states in India, giving us sufficient flexibility in terms of regional presence.
Client diversificationOur client base is a healthy mix of government organisations, port authorities, public sector undertakings, large private sector companies, state boards, amongst others. This helps insulate us from the risks involved in engaging heavily with clients in a limited category.
Diversified resource baseWe have a wide and diversified resource base of vendors and suppliers to ensure timely and uninterrupted availability of raw materials at cost-effective prices.
We believe that diversification is a necessary imperative to convert market opportunities into business prospects in the fast-evolving industry landscape. It is, at the same time, a vital component of our de-risked business model, which is founded on the platform of our flexible approach that enables us to align ourselves to the transforming market dynamics of our business.
ITD Cementation India Limited
16 204
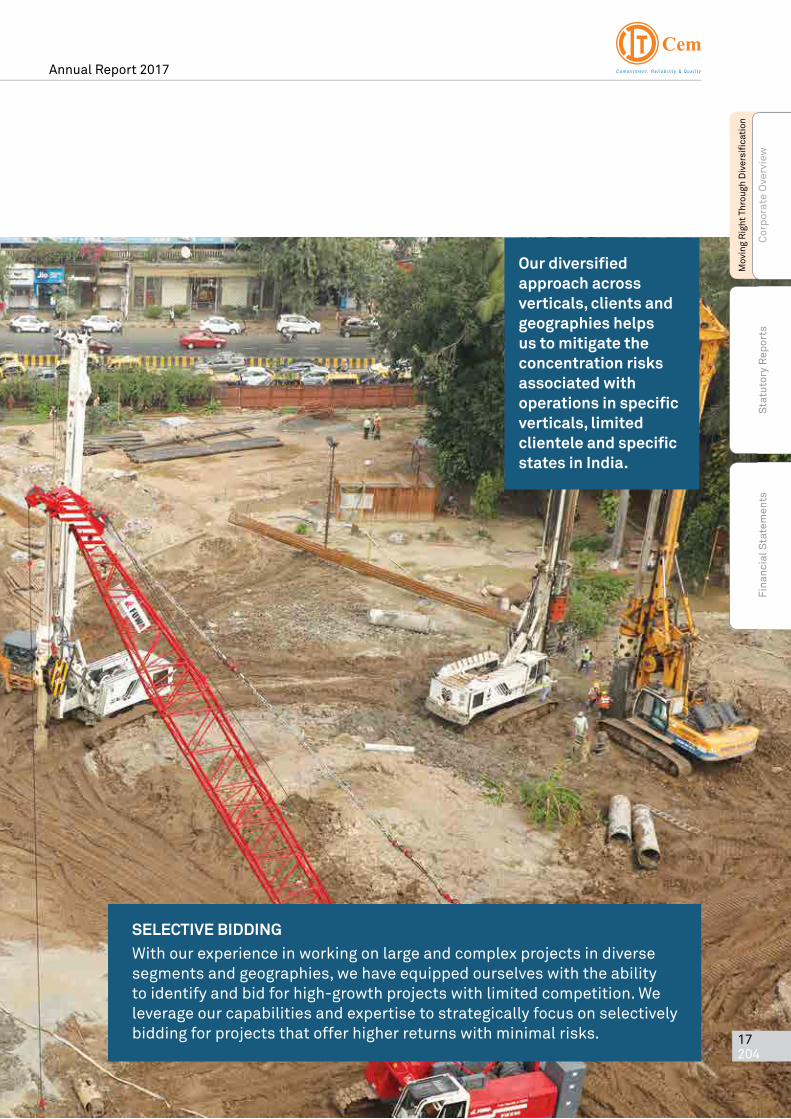
Our diversified approach across verticals, clients and geographies helps us to mitigate the concentration risks associated with operations in specific verticals, limited clientele and specific states in India.
seLeCTIve bIDDInGWith our experience in working on large and complex projects in diverse segments and geographies, we have equipped ourselves with the ability to identify and bid for high-growth projects with limited competition. We leverage our capabilities and expertise to strategically focus on selectively bidding for projects that offer higher returns with minimal risks.
Annual Report 2017
17 204
Mov
ing
Rig
ht T
hrou
gh D
iver
sifi
cati
on
Fina
ncia
l Sta
tem
ents
Sta
tuto
ry R
epor
tsC
orpo
rate
Ove
rvie
w

Our trained and experienced employee base helps in seamless execution of complex and challenging infrastructure construction projects. Our HR ethos is focussed on creating a progressive culture of empowerment, with robust systems in place to promote people empowerment. Nurturance of talent is central to this philosophy, and we are continually ramping our training systems and modules to align them with the continuously changing needs of the industry.
Our partnership ethos also extends to our technological alliances and we have created a pool of some of the world’s best technological companies to strengthen our capabilities to bid for large and complex projects. Not only does this help us benefit from the technical skills of these companies but also leads to sharing of the risks.
Our efforts to continually strengthen our relationships with our partners are centred on a collaborative approach. We also work closely with our vendors and suppliers to ensure on-time completion of projects with total quality adherence.
Moving Right Through Partnerships
We are cognizant of the importance of nurturing close relationships with our Clients, as well as our technological partners along with our vendors and suppliers, to successfully drive our business strategies.
ITD Cementation India Limited
18 204

as an initiative to build strong vendor relationships, we hold annual sub-contract meetings to elicit vendor feedback, understand their pain points and work together to find solutions. It is our endeavour to maintain close and cordial relations with our vendors making us their preferred partners.
Mov
ing
Rig
ht T
hrou
gh P
artn
ersh
ips
Fina
ncia
l Sta
tem
ents
Sta
tuto
ry R
epor
tsC
orpo
rate
Ove
rvie
w
Annual Report 2017
19 204

Moving Right Through Technological Advancements
It is our firm belief that building prowess in specialist technologies equips us with the wherewithal to take on a variety of construction activities, besides helping us showcase the best-in-class execution capabilities with strict adherence to time schedules and quality benchmarks.
We own a fleet of equipment and tools, including modern equipment for various infrastructure related construction, concrete production and movement, maritime gantries, modern hydraulic piling plant and associated equipment. Additions to our fleet of equipment and tools
are carried out, based on project requirements and schedules to cater to the needs of various project sites located pan India.
Our innovation-led business approach and our technological prowess enable us to rise to every challenge in the execution of projects with total efficiency and efficacy.
ITD Cementation India Limited
20 204

armed with modern technologies, processes and skills, we are able to provide our clients with comprehensive, value engineered solutions to meet varied civil engineering challenges, especially in areas of ground engineering, piling, maritime construction and irrigation projects.
Mov
ing
Rig
ht T
hrou
gh T
echn
olog
y
Fina
ncia
l Sta
tem
ents
Sta
tuto
ry R
epor
tsC
orpo
rate
Ove
rvie
w
Annual Report 2017
21 204

Order book status
2015 472
2016 2,300
2017 4,547
3-year performance graph (` crore) (As on 31 December)
Making the Right Business Moves
Key Projects executed Underground Tunnels, Viaduct, Stations
and Track works for Delhi Metro, Kolkata Metro, Jaipur Metro and Bangalore Metro
Construction of Integrated Passenger Terminal Building at NSCBI Airport, Kolkata, West Bengal
Major Projects under executionProjects of Delhi Metro, Bangalore Metro, Kolkata Metro, Mumbai Metro and Nagpur Metro are currently under execution. These include: Construction of stations for airport
corridor of Kolkata Metro, Kolkata, West Bengal
Design and construction of elevated viaduct and elevated metro stations for Nagpur Metro, Nagpur, Maharashtra
Execution of Civil Engineering works for RCC box tunnel for the Kolkata Metro, Kolkata, West Bengal
Design and construction of underground section for the Kolkata Metro, Kolkata, West Bengal
Design and construction of underground section including 3 (three) underground stations for Mumbai Metro, Mumbai, Maharashtra
Construction of elevated structures (viaduct and stations) for Bangalore Metro for Bangalore Metro Phase 2, Bangalore, Karnataka
urban InFrasTruCTure/MrTs While primarily focussed on the construction of Mass Rapid Transit Systems, we were also involved in construction of passenger terminals and allied services at Airports.
Our right-thinking approach is manifest across our business verticals, and at every stage of our operational value chain. From being right-sized to right-strategised, we have developed a business model that enables us to invest in the right business opportunities of growth at the right time to create value for our clients and all our stakeholders.
Harnessing the opportunities triggered by the growing demand-supply gap for good transport infrastructure in the cities, we have scaled up our presence in this vertical, which now contributes 60% of the total order book of the Company.
ITD Cementation India Limited
22 204

as of 31 December 2017, we have a total of 14 urban Infrastructure / MrTs projects in different stages of construction in progress, with an aggregate value of ` 4,547 crore.
Annual Report 2017
23 204
Perf
orm
ance
Rev
iew
Fina
ncia
l Sta
tem
ents
Sta
tuto
ry R
epor
tsC
orpo
rate
Ove
rvie
w

Making the Right Business Moves
Order book status
2015 2,773
2016 2,726
2017 1,631
3-year performance graph (` crore) (As on 31 December)
Our activities and leadership position in this business vertical encompasses providing designs, as well as planning and execution of contracts benchmarked to international standards. We have been undertaking projects independently, in this business unit, which contributes 22% of the current order book.
MarITIMe sTruCTuresIn the area of Maritime Structures, we are engaged in the construction of jetties, dolphins and service platforms, quays, berths on concrete and steel piles, breakwater structures, as well as solid gravity type wharf structures, construction of ship lift facility, dry dock, wet basin and inclined berth, building of jetties for handling liquid and solid cargo, wharfs, berths and quays for handling of containers including dredging and reclamation.
Key Projects executed Ship-lift facility civil works for Indian
Navy at Karwar, Karnataka Liquid Chemical Jetty at Dahej, Gujarat
for Gujarat Chemical and Port Terminal Dock modernisation project at
Mazagon Dock, Maharashtra Design and Construction of Wharf
Structure at Nhava Sheva (India) Gateway Terminal, JNPT
Container Terminal at Ennore Port Wharf, Tamil Nadu
Design and construction of reclamation and container yard with associated facilities at Jawaharlal Nehru Port Trust (JNPT), Navi Mumbai, Maharashtra
Dredging and reclamation works for development of 4th container terminal in Jawaharlal Nehru Port (JNP), Phase-I in Navi Mumbai, Maharashtra
EPC contract for Container Terminal 5 at Mundra, Gujarat
Construction of Coal Berth No. 3 at Ennore Port, Chennai
Major Projects under execution Marine facilities at Karanja Creek Port,
Maharashtra Development of West Quay North (WQ
7 & WQ 8) Berth in Inner Harbour of Visakhapatnam Port, Andhra Pradesh (Left Over Works)
Development of Multipurpose Terminal in Inner Harbour of Visakhapatnam Port Trust in Andhra Pradesh
Civil works for the project of 5th oil berth at Jawahar Dweep in Mumbai Harbour, Maharashtra
Construction of Multi Modal IWT terminal for Haldia, West Bengal
Improving the Capacity Utilisation of OR-I & OR-II Berths for Visakhapatnam Port Trust in Andhra Pradesh
Engineering, Procurement and Construction of Berth and Approach Trestle in Parangipettai Port, Tamil Nadu
ITD Cementation India Limited
24 204

as of 31 December 2017, we have a total of 10 Marine projects in different stages of construction in progress, with an aggregate value of ` 1,631 crore.
Perf
orm
ance
Rev
iew
Fina
ncia
l Sta
tem
ents
Sta
tuto
ry R
epor
tsC
orpo
rate
Ove
rvie
w
Annual Report 2017
25 204

Key Projects executed Execution of civil works (piling) for
4 x 600 MW O P Jindal Super Thermal Power Plant at Tamnar, Chhattisgarh
Diaphragm wall for Sabarmati River Front, Gujarat
Four subways in Chennai through box pushing
Piling works for Paradip Refinery, Odisha Piling, Civil and Temporary Construction
Facility works for GIR Project at Dahej, Gujarat
Piling works of Talwandi 3x660 MW Superficial Thermal Power Plant at Talwandi, Punjab
Piling works for Polypropylene Plant at Indian Oil Corporation Limited, Paradip Refinery, Odisha
Major Projects under execution Construction of 2 nos. Subway through track
by Box pushing at Shalimar Railway station Secant Pile wall works for Mumbai
Metro Line-3 Package-4, Mumbai, Maharashtra
Piling and Associated Works at Panipat Refinery for BS-VI Project of IOCL, Haryana
Shotcreting to U/s Face, Drilling, Grouting and Deep Pointing on Downstream Face of Linganmakki Dam, Karnataka
Piling work for JSW, Dolvi, Maharashtra
Order book status
2015 131
2016 152
2017 83
3-year performance graph (` crore) (As on 31 December)
Making the Right Business Moves
We have also developed expertise in rehabilitation work for protection and life enhancement of stressed dams and other structures through drilling, grouting and anchor stressing and other engineering solutions.
sPeCIaLIsT enGIneerInGWe have developed a strong leadership position in the Specialist engineering, which involves foundation and specialist works that include geotechnical, piling, diaphragm walling, sand wicks / band drains, vibro-floatation stone columns / vibro compaction, drilling and grouting, rock / soil anchors, colcrete, guniting/ shotcrete, grouted mattress, repairs, tube heading and box pushing.
ITD Cementation India Limited
26 204

as of 31 December 2017, we have 10 major projects in specialist engineering in different stages of construction in progress, with an aggregate value of ` 83 crore.
Perf
orm
ance
Rev
iew
Fina
ncia
l Sta
tem
ents
Sta
tuto
ry R
epor
tsC
orpo
rate
Ove
rvie
w
Annual Report 2017
27 204

Key Projects executed Completed road projects in Maharashtra,
Madhya Pradesh, Andhra Pradesh and Tamil Nadu for NHAI
Construction of elevated road at Noida and Delhi Construction of ROB, Ghaziabad,
Uttar Pradesh
Major Projects under execution Construction of 6 Laning of Pune-Satara
Road (NH 4) - Package 1, Maharashtra Civil construction work of ROB, RUB
and allied works at Nashik Railway Line Bridge, Nashik, Maharashtra
Making the Right Business Moves
HIGHWaYs, brIDGes & FLYOversConstruction of roads, bridges and flyovers are key areas of our presence in this vertical. We have developed considerable expertise in this sector, having pioneered the construction of a two-tiered flyover over Jaipur Metro.
as of 31 December 2017, we have a total of 3 projects in the Highways, bridges & Flyovers, in different stages of construction in progress, with an aggregate value of ` 46 crore.
Order book status
2015 493
2016 239
2017 46
3-year performance graph (` crore) (As on 31 December)
ITD Cementation India Limited
28 204

InDusTrIaL sTruCTures & buILDInGsOur presence in this business vertical is primarily focussed on construction of metro station buildings and civil and industrial structures for refineries, petrochemicals, power, steel and fertiliser plants, as well as construction of civil structures for academic institutes, airport complex, etc.
Key Projects executed Plant building and offsite facilities
at Unchahar for NTPC, Uttar Pradesh
Piling and civil works for IFFCO at Aonla and Phulpur, Uttar Pradesh
Civil works for water supply package at Bakreswar thermal power project, West Bengal
General civil works at Sasan for Reliance, Uttar Pradesh
Construction of General Civil works and Building Utilities For 200 KV GIS Building at Mumbai, Maharashtra
Construction of LNG storage tanks at Mundra, Gujarat
Haj Tower, Kolkata, West Bengal Construction of Super Structure for
Bose Institute, Kolkata, West Bengal
Major Projects under execution Construction of Buildings, including
allied works, under phase-I for IIT Ropar at Ropar, Punjab
Architectural Finishing, Plumbing, Tubewell, VAC, Electrical, Fire Fighting works for 6 Elevated Stations for Kolkata Metro
Civil, Structural Fabrication and Erection, Water Supply & Drainage HVAC installation work for Paradip Refinery, Odisha
as of 31 December 2017, we have a total of 2 projects in the Industrial structures & buildings, in different stages of construction in progress, with an aggregate value of ` 79 crore.
Order book status
2015 330
2016 251
2017 79
3-year performance graph (` crore) (As on 31 December)
Perf
orm
ance
Rev
iew
Fina
ncia
l Sta
tem
ents
Sta
tuto
ry R
epor
tsC
orpo
rate
Ove
rvie
w
Annual Report 2017
29 204

as of 31 December 2017, we have a total of 5 projects in the Hydroelectric Power, Dams & Irrigation, in different stages of construction in progress, with an aggregate value of ` 1,052 crore.
Order book status
2015 897
2016 769
2017 1,052
3-year performance graph (` crore) (As on 31 December)
Key Projects executed Construction of Sripada Rao Project
across River Godavari, near Yellampally village, Ramagundam Mandal, Telangana
Water transmission line at Tallah Palta for Kolkata Municipal Corporation, Kolkata, West Bengal
Hydroelectric Power project structures for Umtru, Meghalaya
Constructing pumping stations, power houses, tunnels, intake structures, headrace tunnels, pressure shafts and penstock pipes for TATA Power Company Limited
Major Projects under execution Investigation, design and execution
of water conveyor system consisting
of lined gravity canal, CM & CD works tunnels, Pranahita (Kaleshwaram), Telangana
Laying of Water Trunk Main by Micro-tunnelling method for Kolkata Environmental Improvement Investment Program (KEIIP), West Bengal
Providing and laying 1400mm dia / 1800mm dia. RCC NP4 class drainage gravity line by micro-tunnelling method, Vadodara, Gujarat
Laying of Trunk Sewer along James Long Sarani by micro-tunneling method, Kolkata, West Bengal
Construction of balance tunnelling work of Tunnel T-1 at Jammu & Kashmir
Making the Right Business Moves
In the Hydroelectric Power, Tunnel & Dams and Irrigation business vertical, we undertake projects for construction of earthfill embankment, concrete and masonry dams, irrigation and hydro tunnels, micro-tunnelling, hydropower stations and irrigation canal structures.
Cutting-edge knowhow, project management competencies and ability to execute projects of all sizes have enabled us to build a strong presence in this vertical, which often takes us to difficult and remote areas, requiring exceptional execution capabilities for successful and timely completion.
HYDrOeLeCTrIC POWer, DaMs & IrrIGaTIOn
ITD Cementation India Limited
30 204

WaTer & WasTe WaTer TreaTMenTWe have diversified into this high growth potential business vertical. Our presence in this area encompasses design, construction, supply, installation, commissioning of pipelines including mechanical & electrical equipment, and operation work for Water Treatment Plant & Waste Water Treatment Plants and Pumping Stations.
Major Projects under execution Rehabilitation and Refurbishment of Water Works at
Palta and Garden Reach, Kolkata, West Bengal Designing, Providing, Constructing, Erecting, Testing
& Commissioning of Intake Channel Jackwell, Pump House works for Bhama Askhed Water Supply Scheme, Pune
Drainage System of Agartala Municipal Area, Tripura
as of 31 December 2017, we have a total of 3 projects in the Water & Waste Water Treatment, in different stages of construction in progress, with an aggregate value of ` 75 crore.
Order book status
2015 109
2016 146
2017 75
3-year performance graph (` crore) (As on 31 December)
Perf
orm
ance
Rev
iew
Fina
ncia
l Sta
tem
ents
Sta
tuto
ry R
epor
tsC
orpo
rate
Ove
rvie
w
Annual Report 2017
31 204

Five Years Financial Highlights
sTanDaLOne FInanCIaLs(` crore)
Particulars 2017 2016 2015 2014 2013
Order book 3,472.2 4,329.0 4,387.5 3,638.0 2,534.8Revenue from operations 1,872.9 2,917.4 2,743.5 1,369.4 1,260.2PBT (before exceptional item) 146.2 99.0 35.2 (67.6) 9.4PBT (after exceptional item) 124.4 99.0 (88.8) 27.9 9.4EBITDA 265.1 233.6 51.2 177.3 158.4EBITDA margin (%) 14.2 8.0 1.9 13.1 12.9Net profit 70.9 49.4 (59.3) 19.4 9.3Net profit margin (%) 3.8 1.7 (2.2) 1.4 0.8Net worth 617.3 552.0 508.2 567.8 408.4Total debt 488.6 356.2 488.4 670.8 695.0Debt Equity ratio 0.8 0.6 0.9 1.2 1.7Book value per share (Face value of ` 1 each) 39.8 35.6 32.8 36.6 35.5Earnings per share (`) 4.7 3.3 (3.8) 1.5 0.8Return on capital employed (%) 15.5 14.6 5.0 11.9 11.4Return on equity (%) 12.1 9.4 (11.0) 4.0 2.3Dividend per share (face value of ` 1 each) 0.4 0.3 - - 0.1
Figures for the years 2013, 2014 and 2015 are as per IGAAP, while 2016 and 2017 figures are as per Ind AS.
COnsOLIDaTeD FInanCIaLs(` crore)
Particulars 2017 2016 2015 2014 2013
Order book 7,513.2 6,583.5 5,204.3 4,763.0 3,821.0Revenue from operations 2,060.5 2,937.7 3,070.9 1,718.9 1,584.1PBT (before exceptional item) 147.6 99.1 39.4 (68.6) 23.9PBT (after exceptional item) 125.7 99.1 (84.6) 26.9 23.9EBITDA 271.1 234.5 89.8 205.1 196.5EBITDA margin (%) 13.2 7.9 2.9 11.9 12.5Net profit 71.0 49.8 (59.3) 19.4 9.3Net profit margin (%) 3.4 1.7 (1.9) 1.1 0.6Net worth 618.2 552.8 508.2 567.8 408.4Total debt 488.6 356.2 600.7 765.3 769.5Debt Equity ratio 0.8 0.6 1.2 1.4 1.9Book value per share (Face value of ` 1 each) 39.8 35.6 32.8 36.6 35.5Earnings per share (`) 4.7 3.3 (3.8) 1.5 0.8Return on capital employed (%) 15.7 14.6 6.4 12.3 11.7Return on equity (%) 12.1 9.4 (11.0) 4.0 2.3
Figures for the years 2013, 2014 and 2015 are as per IGAAP, while 2016 and 2017 figures are as per Ind AS.
ITD Cementation India Limited
32 204

An Endorsement that We are on the Right Path
Bombay Chamber of Commerce and Industry honours ITD Cementation India Limited with Good Corporate Citizen Award 2016-17.
Best CEO of the Year 2017 awarded to our Managing Director, Mr. Adun Saraban by Construction Times.
Taking-Over Certificate for “Dredging & Reclamation Works for Development of 4th Container Terminal in JNP” project for Bharat Mumbai Container Terminals Pvt. Ltd. (BMCT, Port of Singapore Authority).
Certificate of Excellence for Outstanding Commitment to Quality for IIT Ropar Project (Phase 1A) from CPWD.
Certificate of Excellence from International Company, CKCEC for IOCL Paradip Refinery Project on achieving 3 million safe man-hours.
safety and Quality awards and Certification
Safety Certificate from the Central Public Works Department for successful completion of 10 million Safe Man Hours Working at the IIT Ropar Project (December 2017).
Letter of Appreciation from Whessoe Engineering Ltd. for showing good project management and taking care of safety and quality for IHI Japan LNG Plant, Mundra, Gujarat.
Certificate in recognition from National Safety Council of India, for developing and implementing effective Management Systems & Procedures and achieving good performance in OSH in 2015, at the Safety Awards, 2016.
Fina
ncia
l Hig
hlig
hts
| Aw
ards
Fina
ncia
l Sta
tem
ents
Sta
tuto
ry R
epor
tsC
orpo
rate
Ove
rvie
w
Our rewards and recognitions endorse the success of our right-moving strategy.
Annual Report 2017
33 204

Mr. Premchai Karnasuta Chairman
Mr. Premchai Karnasuta is a Director and Chairman of the Company since 2004 and he is also the President and Director of Italian-Thai Development Public Company Limited, the Promoter of the Company. He holds a Bachelor’s degree in Mining Engineering from Colorado School of Mines, United States of America and a Masters degree in Business Administration from University of Southern California, United States of America. He has more than three decades of experience in the infrastructure construction industry and has been the guiding force of the Company’s progress over the years.
Mr. Pathai Chakornbundit Vice Chairman
Mr. Pathai Chakornbundit is a Non-Executive Director of the Company since 2004. He is also the Vice Chairman of the Company. He holds a Bachelor's Degree in Engineering from Chulalongkorn University. He holds huge experience of more than four decades in the construction industry. He is also a Director and Senior Executive Vice President of Italian-Thai Development Public Company Limited, the Promoter of the Company.
Mr. Darius erach udwadia Independent Director
Mr. D E Udwadia is a Solicitor and Advocate of the Bombay High Court and a Solicitor of the Supreme Court of England. He was a partner of Crawford Bayley & Co., Solicitors & Advocates, Mumbai for 21 years. He was a founder partner of M/s. Udwadia & Udeshi, Solicitors and Advocates, Mumbai, from July 1997. In 2012, the firm was enlarged and reconstituted as Udwadia Udeshi & Argus Partners where he was a Senior Partner. Mr. Udwadia set up a new firm “Udwadia & Co” in 2015 of which he is the Sole Proprietor. Mr. Udwadia has spent 51 years in active law practice and has vast experience in corporate law, mergers, acquisitions and takeovers, corporate restructuring, foreign collaborations, project and infrastructure finance, intellectual property, international loans and finance-related transactions and instruments, mutual funds, real estate and conveyancing.
Board of Directors
ITD Cementation India Limited
34 204

Mr. Deba Prasad roy Independent Director
Mr. D.P. Roy is a Director of the Company since 2007. He was the former Executive Chairman of SBI Capital Markets Limited and has a rich and wide experience in Corporate, International and Investment Banking Sectors of over 40 years. He held various senior executive and managerial posts in State Bank of India like Deputy Managing Director and Group Executive (International Banking), President and CEO New York and Country Manager USA, Deputy Managing Director and Group Executive (Associates and Subsidiaries), Manager in SBI London, etc. He is also a certified Associate of the Indian Institute of Bankers and Fellow of Indian Council of Arbitration and he is actively engaged in Arbitration in NSE, BSE, MCX, NCDEX and ICA and is also on the advisory committee of Central Bank of India. He is an Independent Director on other Boards. He attended all the Board and Audit Committee meetings of the Company. He participates actively in the proceedings of the Board and Audit Committee meetings as an Independent Director. He holds a Degree in M.Sc Chemistry from Jadavpur University, Calcutta.
Mrs. ramola Mahajani Independent Director
Mrs. Ramola Mahajani is a Director of the Company since 2014. She is a Human Resources Development and Management professional with 40+ years of experience in The Indian Hotels Company Ltd. and extended experience in Consulting as Managing Director of SHL, South Asia. She has her own Consulting firm. She holds two Masters’ Degrees in advanced Applied Psychology and is a Chartered Occupational Psychologist as also an Associate Fellow of the British Psychological Society. Her areas of expertise include application of the principles of Occupational Psychology in Employee Selection, Training, Management Development and HR Planning. She is a winner of British Council Award (UK); Qimpro Silver Standard Award, Indira Group of Institutes’ Super Achiever Award, Lifetime Achievement Award at World HRD Congress; Nominee of the Government of Maharashtra: World Trade Centre Management Council; Convener – Human Resources Sub Committee: Bombay Gymkhana Limited; Member – Ladies Wing, Vision Foundation of India; President Elect: Rotary Club of Bombay Seaface. She is a Key Associate with “insightGURU”, a technology driven people Assessment Company. She serves as a Non-Executive Independent Director on Boards of four listed companies. She attended all the Board meetings of the Company. She participates actively in the proceedings of the Board meetings as an Independent Director.
Mr. Piyachai Karnasuta Director
Mr. Piyachai Karnasuta is a Non-Executive Director of the Company since 2015. He has experience and knowledge in Civil Engineering and Construction of over 15 years. He holds a Bachelor’s degree in Civil Engineering from Washington University and a Masters in Business Administration from Waseda University. He is an Executive Vice President of Italian-Thai Development Public Company Limited, the Promoter of the Company.
Boa
rd o
f Dir
ecto
rs
Fina
ncia
l Sta
tem
ents
Sta
tuto
ry R
epor
tsC
orpo
rate
Ove
rvie
w
Annual Report 2017
35 204

Mr. sunil shah singh Additional Director
Mr. Sunil Shah Singh has served as the Managing Director of ITD Cementation India Limited from June 2000 to December 2009 and thereafter as its Corporate Advisor from January 2010 to December 2013. Mr. Singh has been the President of Kirloskar Pneumatic Company Limited, Pune and Tetra Pak Processing and also served as Country head of Energyworks India. He has over 50 years of experience in Industry with Engineered product manufacturing and construction companies covering varied fields. He has served on a number of national level industry bodies and on government panels including for ‘Standards’ setting and ‘Industry development’ and has been a national council member of Construction Federation of India, Construction Industry Development Council and on the governing body of National Institute of Construction Management and Research.
He was on the development panel of Director General of Trade and Development for pumps and currently serves on the Boards of a number of companies in the position of Chairman/Director.
Board of Directors
Mr. adun saraban Managing Director
Mr. Adun Saraban is a Director of the Company since 2009 and the Managing Director of the Company from 2010. He has an experience of more than three decades in Civil Engineering and Construction Project Management and also brings in vast exposure to global best modern construction methodologies. He holds a Bachelor's degree in Civil Engineering from the King Mongkut’s University of Technology, Thonburi, Thailand.
Management TeamMr. bijoy K. saha Senior Executive Vice President &
CTO
Mr. Jayanta basu Executive Vice President & COO
Mr. K. rajan Senior Executive Vice President &
CCO
Mr. ashwin Parmar Executive Vice President & CBO
Mr. Prasad Patwardhan Senior Executive Vice President &
CFO
Mr. rahul neogi Company Secretary
ITD Cementation India Limited
36 204
Annual Report 2017
Boa
rd’s
Rep
ort
Fina
ncia
l Sta
tem
ents
Sta
tuto
ry R
epor
tsC
orpo
rate
Ove
rvie
w
37 204
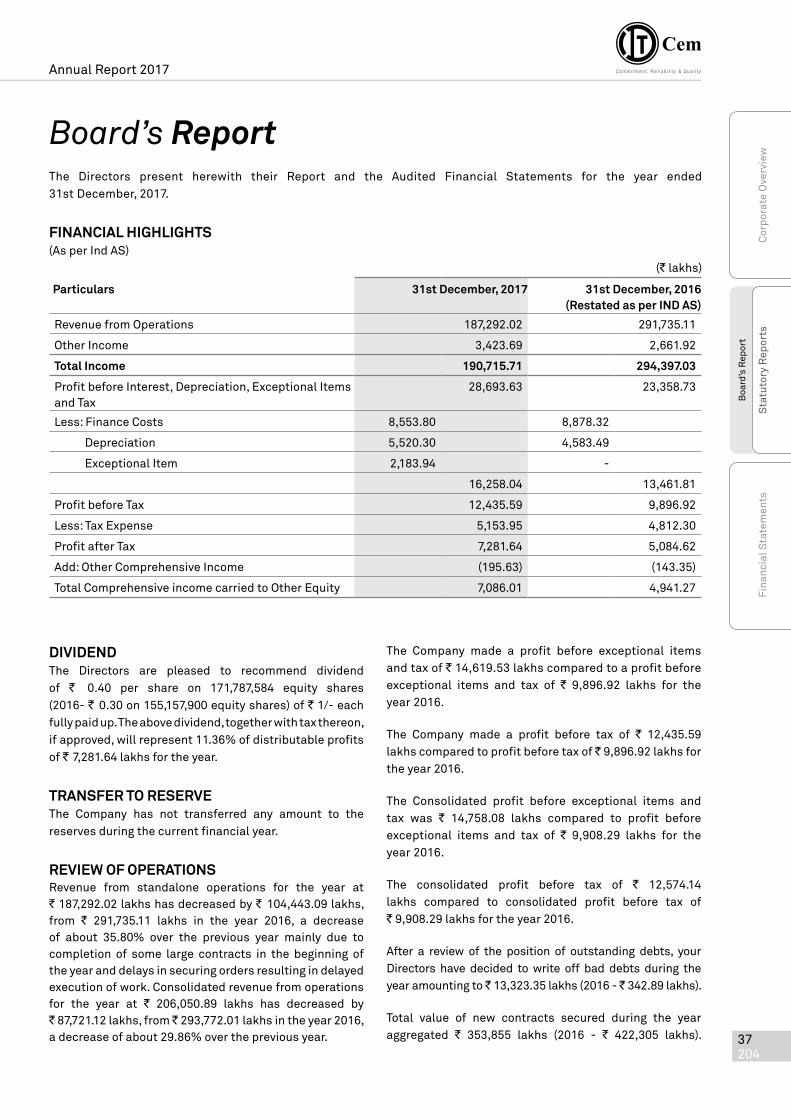
Board’s ReportThe Directors present herewith their Report and the Audited Financial Statements for the year ended 31st December, 2017.
Financial HigHligHts(As per Ind AS)
(` lakhs)
Particulars 31st December, 2017 31st December, 2016 (Restated as per inD as)
Revenue from Operations 187,292.02 291,735.11
Other Income 3,423.69 2,661.92
total income 190,715.71 294,397.03
Profit before Interest, Depreciation, Exceptional Items and Tax
28,693.63 23,358.73
Less: Finance Costs 8,553.80 8,878.32
Depreciation 5,520.30 4,583.49
Exceptional Item 2,183.94 -
16,258.04 13,461.81
Profit before Tax 12,435.59 9,896.92
Less: Tax Expense 5,153.95 4,812.30
Profit after Tax 7,281.64 5,084.62
Add: Other Comprehensive Income (195.63) (143.35)
Total Comprehensive income carried to Other Equity 7,086.01 4,941.27
DiviDenDThe Directors are pleased to recommend dividend of ` 0.40 per share on 171,787,584 equity shares (2016- ` 0.30 on 155,157,900 equity shares) of ` 1/- each fully paid up. The above dividend, together with tax thereon, if approved, will represent 11.36% of distributable profits of ` 7,281.64 lakhs for the year.
tRansFeR to ReseRve The Company has not transferred any amount to the reserves during the current financial year.
Review oF oPeRationsRevenue from standalone operations for the year at ` 187,292.02 lakhs has decreased by ` 104,443.09 lakhs, from ` 291,735.11 lakhs in the year 2016, a decrease of about 35.80% over the previous year mainly due to completion of some large contracts in the beginning of the year and delays in securing orders resulting in delayed execution of work. Consolidated revenue from operations for the year at ` 206,050.89 lakhs has decreased by ` 87,721.12 lakhs, from ` 293,772.01 lakhs in the year 2016, a decrease of about 29.86% over the previous year.
The Company made a profit before exceptional items and tax of ` 14,619.53 lakhs compared to a profit before exceptional items and tax of ` 9,896.92 lakhs for the year 2016.
The Company made a profit before tax of ` 12,435.59 lakhs compared to profit before tax of ` 9,896.92 lakhs for the year 2016.
The Consolidated profit before exceptional items and tax was ` 14,758.08 lakhs compared to profit before exceptional items and tax of ` 9,908.29 lakhs for the year 2016.
The consolidated profit before tax of ` 12,574.14 lakhs compared to consolidated profit before tax of ` 9,908.29 lakhs for the year 2016.
After a review of the position of outstanding debts, your Directors have decided to write off bad debts during the year amounting to ` 13,323.35 lakhs (2016 - ` 342.89 lakhs).
Total value of new contracts secured during the year aggregated ` 353,855 lakhs (2016 - ` 422,305 lakhs).

ITD Cementation India Limited
38 204
Major contracts having a value of ` 7,500 lakhs and above were as under -
• Design and Construction of Elevated Viaduct ofNagpur Metro Rail Project for Nagpur Metro Rail Corporation Limited, Maharashtra.
• Improving the capacity utilisation of OR-I andOR-II Berths for Visakhapatnam Port Trust, Andhra Pradesh.
• Construction of Eight numbers ElevatedMetro Stations-Reach 4 of Nagpur Metro Rail Project for Maharashtra Metro Rail Corporation Limited, Maharashtra.
• Engineering, Procurement and Construction ofBerth and Approach Trestle in Parangipettai Port, Tamil Nadu.
• Civil Engineering Works for the undergroundconstruction of RCC Box Tunnel for Metro Railway, Kolkata,WestBengal.
Duringtheyear,yourCompany’sJointVenture,
i. ITD Cemindia JV, has received four contracts forConstruction of Elevated Structures (Viaduct andstations) of Bangalore Metro Rail Project Phase 2 for Bangalore Metro Rail Corporation Limited aggregating to ` 237,019 lakhs, and
ii. ITDCem Maytas JV, has received contract forextension of Kaleshwaram Project-Package No. 17-Investigation, Design and Execution of WaterconveyorsystematPranahita.Value` 32,294 lakhs.
During the year under report, a number of contracts were completed including-
• ConstructionofNewUmtruHydroElectricProjectforMeghalaya Power Generation Corporation Limited, Meghalaya.
• Construction of balance work of Tunnels betweenKawi and Dugga on Katra Dharam Sanction of Udhampur,Srinagar,Jammu&Kashmir.
• Civil work for two LNS Storage Tanks at Mundra, Gujarat.
• DredgingandReclamationworksfordevelopmentof Fourth Container Terminal of Jawaharlal Nehru
Port for Bharat Mumbai Container Terminals Port Ltd., Maharashtra.
• EPC Contract for Container Terminal 5 at Mundra, Gujarat.
• Construction of Coal Berth No. 3 at Ennore Port, Chennai.
• DesignandconstructionofTunnelbyshieldTBMandunderground stations under Delhi MRTS project of Phase III for Delhi Metro Rail Corporation Limited, New Delhi.
• Various piling and civil works in Maharashtra,Gujarat, Noida, Gangtok, Sikkim, etc.
Raising oF FunDs tHoRugH QualiFieD institutions Placement (“QiP”)In February 2018, the Company issued and allotted 16,629,684 fully paid up equity shares of face value of ` 1/- each at a price of ` 202.55 (including premium of ` 201.55) per share, aggregating to ` 33,683.42 lakhs through Qualified Institutions Placement (QIP). The shares were allotted on 2nd February, 2018 and the paid up share capital of the Company increased from ` 155,157,900 divided into 155,157,900 equity Shares of ` 1/- each fully paid up to ` 171,787,584 divided into 171,787,584 equity Shares of ` 1/- each fully paid up. Consequent upon the aforesaid allotment, the shareholding percentage of Italian-Thai Development Public Company Limited, Thailand, the Parent Company, has reduced from 51.63% to 46.64% in the paid up share capital of the Company.
PeRFoRmance anD Financial Position oF subsiDiaRy anD Joint ventuResAs required under Regulation 36 of the Securities and Exchange Board of India (Listing Obligations and Disclosure Requirements) Regulations, 2015 as amended time to time (hereinafter referred to as ‘Listing Regulations, 2015’) and Section 129 of the Companies Act, 2013 (hereinafter referred to as the ‘Act’), the Consolidated Financial Statements, which have been prepared by the Company in accordance with the applicable provisions of the Act and the applicable Accounting Standards, forms part of this Annual Report.

Annual Report 2017
Boa
rd’s
Rep
ort
Fina
ncia
l Sta
tem
ents
Sta
tuto
ry R
epor
tsC
orpo
rate
Ove
rvie
w
39 204
The performance and financial position of the Company’s subsidiary and joint ventures are summarised herein below:(` lakhs)
name total income Profit/ (loss) for the year
% share share of Profit/ (loss)
subsidiary:
• ITDCementationProjectsIndiaLimited 0.26 (0.09) 100% (0.09)
Joint ventures:
• ITDCemindiaJV 19,345.74 54.77 80% 43.82
• ITD-ITDCemJV 35,181.28 (2,820.87) 49% (1,382.23)
• ITD-ITDCemJV(ConsortiumofITD-ITDCementation)
335.91 (1.08) 40% (0.43)
• ITDCem-MaytasConsortium 55.23 1.78 95% 1.69
• CEC-ITDCem-TPLJV 24,477.64 NIL 60% NIL
A statement containing the salient features of the performance and financial position of the said Subsidiary and Joint Ventures as required under Rule 5 of theCompanies (Accounts) Rules, 2014 is provided in Form AOC-1 - marked as Annexure 1 and forms part of the Consolidated Financial Statements.
The annual accounts of the Subsidiary Company will be made available to any Member of the Company seeking such information at any point of time and are also available for inspection by any Member of the Company at the Registered Office of the Company on any working day during business hours up to the date of the Annual General Meeting.
eneRgy conseRvation, tecHnology absoRPtion anD FoReign excHange eaRnings anD outgoThe Company lays significant emphasis on improvements in methods and processes in its areas of construction and operations. The Company has an in-house Research & Development Division. The primary focus of researchis to continually refine the frequently used systems at our project sites to derive optimisation, reduction in the breakdowns, improve effectiveness and efficiency of use and hence provide a competitive edge for any project. Energy Conservation, Technology Absorption, Foreign Exchange Earnings and Outgo as required under Section 134(3)(m) of the Act read with Rule 8 of the Companies (Accounts) Rules, 2014 is annexed herewith and marked as Annexure 2.
statutoRy auDitoRsMessrsWalkerChandiok&CoLLP,CharteredAccountants,Mumbai, having Firm Registration No. 001076N/N500013 were re- appointed as the Auditors of the Company at the 39th Annual General Meeting (AGM) held on 11th May, 2017 for a period of five years from the conclusion of the 39th AGM until the conclusion of the 44th AGM subject to
ratification of their appointment by the shareholders of the Company at every following AGM or as may be required under the applicable provisions of the Companies Act, 2013 (“the Act”) pursuant to the provisions of Section 139 of the Act. Their appointment is to be ratified at the ensuing 40th AGM of the Company.
As required under the provisions of Section 139 (1) of the Act, the Company has received written consent from MessrsWalkerChandiok&CoLLP,CharteredAccountants,Mumbai informing that their appointment, if made, would be in accordance with the provisions of the Act read with Rule 4(1) of the Companies (Audit and Auditors) Rules, 2014 and that they satisfy the criteria provided in Section 141 of the Act. As required under the Listing Regulations, 2015, the Statutory Auditors have also confirmed that they hold a valid certificate issued by the Peer Review Board of the Institute of Chartered Accountants of India.
DiRectoRs anD Key manageRial PeRsonnel a) Key managerial Personnel (KmP) In accordance with the provisions of Section 203 of
the Act, the following persons have been designated as KMP of the Company as at 31st December, 2017:
name of the KmP Designation
Mr. Adun Saraban Managing Director
Mr. S. Ramnath 3 Chief Financial Officer
Mr. Prasad Patwardhan 4 Chief Financial Officer
Mr. R.C. Daga 1 Company Secretary
Mr. Rahul Neogi 2 Company Secretary
1 Mr. R.C. Daga retired as Company Secretary w.e.f. 31st January, 2017.
2 Mr. Rahul Neogi has been appointed as Company Secretary w.e.f. 1st February, 2017.
3 Mr. S. Ramnath retired as Chief Financial Officer of the Company w.e.f. 15th July, 2017.
4 Mr. Prasad Patwardhan has been appointed as Chief Financial Officer of the Company w.e.f. 16th July, 2017

ITD Cementation India Limited
40 204
b) Directors Mr. Piyachai Karnasuta (DIN: 07247974) will retire
by rotation and, being eligible, offers himself for re-appointment.
The Board of Directors, at its meeting held on 22nd February, 2018, appointed Mr. Sunil Shah Singh (DIN: 00233918) as an Additional Director of the Company with effect from 22nd February, 2018 and he shall hold office upto the date of the forthcoming AGM of the Company and is eligible for appointment. Pursuant to Section 152(2) and Section 161 of the Act, Agenda Item relating to appointment of Mr. Singh as a Director of the Company has been included in the Notice convening the AGM of the Company. At the above Board Meeting, Mr. Singh was also appointed as an Independent Director for a term of five years from 11th May, 2018 to 10th May, 2023 (both inclusive) subject to the approval of the Members at the Annual General Meeting of the Company to be held in the year 2019.
Mr.PerEbbeHofvander(DIN:00254616)IndependentNon-Executive Director resigned with effect from 23rd February, 2018 on account of health reasons. The Board placed on record its deep appreciation of the valuable servicesrenderedbyMr.PerEbbeHofvanderduringhistenure as an Independent Director of the Company.
c) Declarations by independent Directors The Company has received necessary declarations
from each Independent Director of the Company under Section 149(7) of the Act confirming that they meet with the criteria of independence as laid down in Section 149(6) of the Act.
d) Performance evaluation Pursuant to the provisions of Section 134 (3) (p),
Section149(8)andScheduleIVoftheActandListingRegulations, 2015, Annual Performance Evaluation of the Board, the Directors as well as Committees of the Board has been carried out.
The Performance Evaluation of the Independent Directors was carried out by the entire Board and the Performance Evaluation of the Chairman and Non- Independent Directors was carried out by the Independent Directors.
During the year the Independent Directors of the Company met on 21st February and 8th November, 2017.
e) number of meetings of board of Directors 9 meetings of Board of Directors were held during
the year under report. For details of the Meetings of the Board, please refer to the Report on Corporate Governance, which forms part of this Report.
RemuneRation oF DiRectoRs anD KmPsDisclosure with respect to the remuneration of Directors, KMPs and employees as required under Section 197 of the Act read with Rule 5(1) of the Companies (Appointment and Remuneration of Managerial Personnel) Rules, 2014 is given below:
(a) The ratio of the remuneration of each Director to the median remuneration of the employees of the Company for the financial year:
Directors Ratio to median remuneration
Non - Executive Director
Mr. Premchai Karnasuta -
Mr. Pathai Chakornbundit -
Mr.D.E.Udwadia 1:0.59
Mr.PerEbbeHofvander -
Mr. D.P. Roy 1:0.59
Mrs. Ramola Mahajani 1:0.59
Mr. Piyachai Karnasuta -
Executive Director
Mr. Adun Saraban 1:18.99
Non - Executive Directors were paid sitting fees as given in the Report on Corporate Governance and no other remuneration was paid to them. Sitting fees do not constitute an element of remuneration.
(b) The percentage increase in remuneration of each director, chief executive officer, chief financial officer, company secretary in the financial year:
Directors, chief executive officer, chief Financial officer and company secretary
Mr. Premchai Karnasuta -
Mr. Pathai Chakornbundit -
Mr.D.E.Udwadia -
Mr.PerEbbeHofvander -
Mr. D.P. Roy -
Mrs. Ramola Mahajani -
Mr. Piyachai Karnasuta -
Mr. Adun Saraban, Managing Director 25%
Mr. S. Ramnath, Chief Financial Officer3 15.49%
Mr. R.C. Daga, Company Secretary1 12.03%
Mr. Rahul Neogi, Company Secretary2 13.05%
Mr. Prasad Patwardhan, Chief Financial Officer4
-NA-
1 Mr. R.C.Daga retired as Company Secretary w.e.f. 31st January, 2017.
2 Mr. Rahul Neogi has been appointed as Company Secretary w.e.f. 1st February, 2017.
3 Mr. S. Ramnath retired as Chief Financial Officer of the Company w.e.f. 15th July, 2017.
4 Mr. Prasad Patwardhan has been appointed as Chief Financial Officer of the Company w.e.f. 16th July, 2017.

Annual Report 2017
Boa
rd’s
Rep
ort
Fina
ncia
l Sta
tem
ents
Sta
tuto
ry R
epor
tsC
orpo
rate
Ove
rvie
w
41 204
(c) The percentage increase in the median remuneration of employees in the financial year: 14.88%
(d) The number of permanent employees on the rolls of the Company: 2010 (As on 31st December, 2017)
(e) Average percentile increase already made in the salaries of employees other than the managerial personnel in the last financial year and its comparison with the percentile increase in the managerial remuneration and justification thereof and point out if there are any exceptional circumstances for increase in the managerial remuneration:
sr. no
other employees managerial Remarks
1 13.28% 15.63% NIL
(f) Affirmation that the remuneration is as per the remuneration policy of the Company:
The Company affirms that the remuneration is as per the remuneration policy of the Company.
DiRectoRs’ ResPonsibility statementPursuant to Section 134(5) of the Act, the Board of Directors, to the best of their knowledge and ability, confirms that:
• in the preparation of the annual accounts for the financial year ended 31st December, 2017, the applicable accounting standards have been followed and there have been no material departures;
• theDirectorshadselectedsuchaccountingpoliciesand applied them consistently, and made judgments and estimates that are reasonable and prudent, so as to give a true and fair view of the state of affairs of the Company at the end of the financial year and of the profit of the Company for that period;
• the Directors had taken proper and sufficientcare for the maintenance of adequate accounting records, in accordance with the provisions of the Act for safeguarding the assets of the Company and for preventing and detecting fraud and other irregularities;
• theDirectorshadpreparedtheannualaccountsonagoing concern basis;
• theDirectorshadlaiddowninternalfinancialcontrolsto be followed by the Company and that such internal financial controls are adequate and were operating effectively; and
• theDirectorshaddevisedpropersystemstoensure compliance with the provisions of all applicable laws and that such systems were adequate and operating effectively.
auDit committeeThe details pertaining to the composition of the Audit Committee are included in the Report on Corporate Governance, which forms part of this Report.
During the year under review, there was no instance wherein the Board had not accepted any recommendation of the Audit Committee.
vigil mecHanism FoR DiRectoRs anD emPloyeesThe Company has formulated and published a WhistleBlowing and Prevention of Sexual Harassment Policyand Procedures to deal with instances of harassment or victimisation, if any. This Policy has adequate safeguards against victimisation of the whistle blower and ensures protectionofthewhistleblower’sidentity.WhistleBloweror Complainant, as the case may be under the said Policy, shall be entitled to direct access to the Chairperson of the Audit Committee in appropriate or exceptional cases. In case of any Whistle Blowing Disclosure, theManaging Director shall constitute a Committee from Senior Management Team members as stipulated in the said Policy. This Policy is available on the website of the Company.
inteRnal Financial contRolsThe Company has an internal control system commensurate with the size, scale and complexity of its operations. In order to enhance controls and governance standards, the Company has adopted Standard Operating Procedures which ensure that robust internal financial controls exist in relation to operations, financial reporting and compliance. In addition, the Internal Audit function monitors and evaluates the efficacy and adequacy of the internal control system in the Company, its compliance with operating systems, accounting procedures and policies at all locations. Periodical reports on the same are also presented to the Audit Committee.
During the year, the internal controls were tested and found effective, as a part of the Management’s control testing initiative. Accordingly, the Board, with the concurrence of the Audit Committee and the Auditors, is of the opinion that the Company’s Internal Financial Controls were adequate and operating effectively for the financial year ended 31st December, 2017.
PaRticulaRs oF loans, guaRantees anD investmentsParticulars of loans, guarantees and investments as required under the provisions of Section 186 of the Act have been given in the Financial Statements.

ITD Cementation India Limited
42 204
PaRticulaRs oF contRacts oR aRRangements witH RelateD PaRties All contracts or arrangements with related parties, entered during the financial year were at arm’s length basis and in the ordinary course of the Company’s business. All such contracts or arrangements were entered into only with prior approval of the Audit Committee. No material contract or arrangement with related parties was entered into during the year under report. Therefore, there is no requirement to report any transaction in Form No. AOC-2 in terms of Section 134 of the Act, read with Rule 8 of the Companies (Accounts) Rules, 2014.
The related party disclosures as specified in Para A of Schedule V read with Regulation 34(3) and 53(f)of the Listing Regulations, 2015 are given in the Financial Statements.
A Policy governing the related party transactions has been adopted and the same has been uploaded on the Company’s website.
RisK managementThe Board of Directors constituted a Risk Management Committee comprising Mr. Per Hofvander, (Chairman), Mr. Adun Saraban and Mr. B. K. Saha, Senior Executive VicePresidentoftheCompany.
The Company adopted a risk management policy and has in place a mechanism to inform the Audit / Board Members about risk assessment and minimisation procedures and its periodical review.
More details in respect to risk management are given in ManagementDiscussionandAnalysis(MD&A).
coRPoRate social ResPonsibility (csR)The Board of Directors constituted a CSR Committee comprising Mr. Per Hofvander, (Chairman), Mr. PathaiChakornbundit and Mr. Adun Saraban.
The Company adopted the CSR Policy and the same has been uploaded on the Company’s website.
On account of the losses incurred by the Company, there was no average net profit in the three immediately preceding financial years as computed in accordance with the CSR Rules and the Company was therefore not in a position to spend any amount on CSR activities for the year under report.
The disclosures required to be given under Section 135 of the Act read with Rule 9 of the Companies (Corporate Social Responsibility Policy) Rules, 2014 are in Annexure 3 and form part of this Report.
nomination anD RemuneRation committee (nRc)The Board of Directors has constituted an NRC comprising Mr. D.E. Udwadia, Mr. Premchai Karnasuta, Mr. PathaiChakornbunditandMr.PerHofvander.Mr.D.E.Udwadiaisthe Chairman of this Committee.
The details pertaining to the composition of the NRC are included in the Report on Corporate Governance, which forms part of this Report.
The Nomination and Remuneration Policy on Directors’ appointment and remuneration is given in Annexure 4 and forms part of this Report.
The Company has adopted the Nomination and Remuneration Policy and the same has been uploaded on the Company’s website.
PaRticulaRs oF emPloyees anD RelateD DisclosuResParticulars of employees as required under Section 197 of the Act read with Rule 5(2) and 5(3) of the Companies (Appointment and Remuneration of Managerial Personnel) Rules, 2014 is annexed to the Board’s Report and marked as Annexure 5. In accordance with the provisions of Section 136 of the Act, the Annual Report and Accounts are being sent to all the Members of the Company excluding the aforesaid information and the said particulars will be made available on request and also made available for inspection at the Registered Office of the Company. Any Member interested in obtaining such particulars may write to the Company Secretary at the Registered Office of the Company.
secRetaRial auDit RePoRtPursuant to the provisions of Section 204 of the Act, read with the Rules therein, the Secretarial Audit Report issuedbyM/sParikh&Associates,PracticingCompanySecretaries is attached and marked as Annexure 6 to this Report.
extRact oF tHe annual RetuRnPursuant to Section 92(3) and Section 134 (3)(a) of the Act read with Rule 12(1) of the Companies (Management and Administration) Rules, 2014, an extract of the Annual Return in Form MGT-9 is attached and marked as Annexure 7 to this Report.
DePositsThe Company has not accepted any deposit from the public falling under Section 73 of the Act and the Companies (Acceptance of Deposits) Rules, 2014.

Annual Report 2017
Boa
rd’s
Rep
ort
Fina
ncia
l Sta
tem
ents
Sta
tuto
ry R
epor
tsC
orpo
rate
Ove
rvie
w
43 204
management Discussion anD analysis Pursuant to Listing Regulations, 2015, the Management Discussion and Analysis is attached hereto and forms part of this Report and marked as Annexure 8 to this Report.
coRPoRate goveRnancePursuant to Listing Regulations, 2015, the Report on Corporate Governance alongwith a certificate of compliance from the Auditors are attached hereto and marked as Annexure 9 to this Report.
business ResPonsibility RePoRtAs required under Regulation 34(2)(f) of the Securities and Exchange Board of India (Listing Obligations and Disclosure Requirements) (Amendment) Regulations, 2015, the Business Responsibility Report forms part of this Annual Report.
mateRial cHanges anD commitments aFFecting tHe Financial Position oF tHe comPanyThere are no material changes and commitments affecting the financial position of the Company, which have occurred between the end of the financial year under review and the date of this Report.
signiFicant anD mateRial oRDeRs PasseD by tHe RegulatoRs oR couRts oR tRibunalsDuring the year under review, there were no significant and material orders passed by any regulator or court or tribunal, impacting the going concern status of the Company and its future operations.
DisclosuRes unDeR sexual HaRassment oF women at woRKPlace (PRevention, PRoHibition & ReDRessal) act, 2013During the year under review, there were no cases filed pursuant to the Sexual Harassment of Women atWorkplace (Prevention, Prohibition and Redressal) Act,2013 and the Rules framed thereunder.
RePoRting oF FRauDThe Auditors of the Company have not reported any fraud as specified under the second proviso of Section 143(12) of the Act.
A case has been registered by the Anti-Corruption Bureau againstsomeofficersattheStateTaxEnforcementWingat Vijayawada and an employee of the Company alongwith a representative of the Company for allegedly bribing an Additional Commissioner of Commercial Taxes, Andhra Pradesh.Whileinvestigationprocessison,theconcernedemployee has been suspended.
iso 9001:2015, iso 14001:2015 & oHsas 18001:2007The Company has an established Integrated Management System comprising Quality Management System (QMS) conforming to ISO 9001:2015, Environmental Management System (EMS) conforming toISO14001:2015andOccupationalHealthandSafetyManagementSystemconformingtoOHSAS18001:2007at all offices, project sites and depots. During the year, the Company’s Management System has been audited and compliance to the requirements of the International Standards has been confirmed by DNV GL-BusinessAssurance(DNVGL-BA).
The Company is amongst the few construction companies who have established an Integrated Management System and is adequately maintaining the system to ensure customer satisfaction, compliance to legal and other non-regulatory requirements as per the Standards along with continual improvements to the system.
outlooK Infrastructure is a key enabler of growth in India; estimates suggest that every rupee invested in infrastructure development has a ripple effect and helps the GDP grow by ~2. According to S&P Global Rankings (August, 2016),the country’s poor infrastructure is the biggest hurdle to government’s flagship Make in India programme. Yet despite all the policies and promotion by the government and the initiatives undertaken by the private sector, the infrastructure deficit continues to be colossal. A paper presented at the India Infra Summit 2017 quoted, “India needs about $1.5 trillion investment in the infrastructure sector in the coming 10 years. The figure is roughly equal to the nominal GDP of the second largest country in the world in terms of land mass – Canada.”
Yet it is this very disadvantage that poses an immense opportunity to various stakeholders. Due to India’s fast-paced growth and its consistent role as a forerunner among emerging markets, it has become an attractive destination for global investment. At the same time, it gives the government and the ECP community the opportunity to provide environment-friendly, state-of-the-art infrastructure that meets unique local needs to the end users.
Against this backdrop, the Company is advantageously placed to harness this opportunity. With its pedigreeparentage and the expertise that it has developed over the years, while executing various complex and intricate projects, the Company maintains its focus on project selection for bidding after due evaluation of risks, profitability and project cashflow.

ITD Cementation India Limited
44 204
Once again, it has been able to build a strong and diverse order book worth ` 751,320 lakhs as on 31st December, 2017. The Company looks forward to honing its capabilities in the future, and deliver project executions that provide immense utility to end-users, pride to its people and economic gains to its shareholders.
PaRent comPany Italian-Thai Development Public Company Limited (ITD), founded in 1958, is a leading civil engineering & infrastructure construction and developmentcompany inThailand.Withawell-diversifiedpresenceacross the construction space that includes MRT, airports, buildings, dams & tunnels, highways,expressways & bridges, industrial works, mining andtelecommunications, ITD is listed in Nikkei Asia300; a list of Asia’s biggest and fastest growing companies among 11 economies in the continent.
ITD has been a leader in infrastructure construction in Thailand for more than 59 years and has since then expanded its operations across several other countries in south east and south Asia.
ITD is the only Thai construction company to win the prestigiousInternationalFederationofAsianandWesternPacific Contractor’s Association (IFAWPCA) Gold MedalAward for civil engineering in 1982. It was awarded to ITD for the construction of the largest and most challenging civil engineering project ever attempted in Thailand - the Khao Laem Dam.
The Royal Seal of The Garuda was awarded to the companybyHisMajestytheKingon23rdDecember,1985.The Royal Seal of the Garuda is the highest and most honourable achievement under the Royal Patronage of the King of Thailand.
One of the landmark projects which ITD has been proudly associated with is the construction of the Suvarnabhumi International Airport, approximately 25 km east of Bangkok, which ITD successfully completed in 2006. This is the twentieth busiest airport in the world and the ninth busiest airport in Asia for the year 2016.
ITD has an experienced in-house training division responsible for maintaining the high level of construction skills and safety - a prime company objective.
In 2016, ITD posted revenues of over 47 billion Thai Baht (about ` 935,500 lakhs) and had 25,678 employees on its rolls.
DePositoRy systemIt is mandatory that the shares of the Company are traded in electronic form. The Company has entered into Agreements with both the depositories i.e. National Securities Depository Limited (NSDL) and Central Depository Services (India) Limited (CDSL).
Financial yeaRFinancial Year of the Company under report is January- December for which the Company Law Board, New Delhi had granted permission to the Company.
Consequent upon issue and allotment of 16,629,684 fully paid up equity shares of ` 1/- each to Qualified Institutional Buyers through Qualified Institutions Placement on 2nd February, 2018, the shareholding percentage of ITD, Thailand in the paid up share capital of the Company reduced from 51.63% to 46.64%. The Company thereupon ceased to be a subsidiary company of ITD, Thailand effective 2nd February, 2018. In view of this, the Company would be required to align its financial year as per the provisions of Section 2(41) of the Act and the Rules framed thereunder and hence the exemption granted by the Company Law Board to the Company to follow 1st January to 31st December as the Company’s financial year will no longer be available to the Company. Accordingly, the next financial year of the Company would be for a period of fifteen months from 1st January, 2018 to 31st March, 2019 and thereafter the financial years of the Company would be for a period of 12 months commencing on 1st April and ending on 31st March every year.
inDustRial Relations Relations with staff and labour remained peaceful and cordial during the year under review.
acKnowleDgementThe Directors thank ITD for the continued support extended by it and the guidance provided to your Company.
The Directors thank all employees for their contribution and the shareholders, customers and bankers for their continued support.
For and on behalf of the Board
Premchai Karnasuta 22nd February, 2018 (DIN: 00233779)
Chairman

Annual Report 2017
Boa
rd’s
Rep
ort
Fina
ncia
l Sta
tem
ents
Sta
tuto
ry R
epor
tsC
orpo
rate
Ove
rvie
w
45 204
annexuRe 1
Form aoc-1(Pursuant to first proviso to sub-section (3) of Section 129 of the Companies Act, 2013 read with
Rule 5 of the Companies (Accounts) Rules, 2014)statement containing salient features of the financial statement of
subsidiaries/associate companies/joint ventures
Part “a”: subsidiaries(Information in respect of each subsidiary to be presented with amounts in ` in lakhs)
sl. no.
Particulars Details
1. Name of the subsidiary ITD Cementation Projects India Limited
2. Reporting period for the subsidiary concerned, if different from
the holding company’s reporting period
1st January, 2017 – 31st December, 2017
3. Reporting currency and Exchange rate as on the last date of the
relevant Financial year in the case of foreign subsidiaries
INR
4. Share capital 5.00
5. Reserves&surplus (0.65)
6. Total assets 4.42
7. Total liabilities 4.42
8. Investments NIL
9. Turnover 0.26
10. Profit before taxation (0.09)
11. Provision for taxation NIL
12. Profit after taxation (0.09)
13. Proposed Dividend NIL
14. % of shareholding 100%
notes: 1. Names of subsidiaries which are yet to commence operations - None 2. Names of subsidiaries which have been liquidated or sold during the year -None 3. Financial year of the subsidiary is April to March.

ITD Cementation India Limited
46 204
Part “b”: associates and Joint venturesStatement pursuant to Section 129 (3) of the Companies Act, 2013 related to
AssociateCompanies/JointVentures
name of associates/Joint ventures
itD-itD cem Jv (consortium of itD-
itD cementation)
itDcem-maytas consortium
itD-itD cem Jv
itD cemindia Jv
cec-itD cem-tPl Jv
Latest audited Balance Sheet Date
31.12.2017 31.12.2017 31.12.2017 31.12.2017 31.12.2017
Shares of Associate/Joint Venturesheldbythe Company on the year end
NIL NIL NIL NIL NIL
No. NIL NIL NIL NIL NIL
Amount of Investment in Associates/Joint Venture
671.20 76.44 35,888.17 19,305.97 81.21
Extend of Holding%
40% 95% 49% 80% 60%
Description of how there is significant influence
JointVenture JointVenture JointVenture JointVenture JointVenture
Reason why the Associate/Joint Ventureisnotconsolidated
Consolidated- equity method
Consolidated as Subsidiary
Consolidated- equity method
Consolidated as Subsidiary
Consolidated- equity method
Net worth attributable to shareholding as per latest audited Balance Sheet
1,672.07 95.10 40,524.02 18,975.11 19.01
Profit/(Loss) for the year
(1.08) 1.78 (2,820.87) 54.77 NIL
i. Considered in Consolidation
(0.43) 1.69 (1,382.23) 43.82 NIL
ii. Not Considered in Consolidation
(0.65) 0.09 (1,438.64) 10.95 NIL
1. Names of associates or joint ventures which are yet to commence operations – None 2. Names of associates or joint ventures which have been liquidated or sold during the year – None 3. Names of associates or joint ventures is not consolidated – None
adun saraban Pathai chakornbunditManaging Director Director
Prasad Patwardhan Rahul neogiChief Financial Officer Company Secretary
22nd February, 2018

Annual Report 2017
Boa
rd’s
Rep
ort
Fina
ncia
l Sta
tem
ents
Sta
tuto
ry R
epor
tsC
orpo
rate
Ove
rvie
w
47 204
annexuRe 2
energy conservation, technology absorption and Foreign exchange earnings and outgoInformation pursuant to Section 134(3) (m) of the Companies Act, 2013 read with Rule 8 of the Companies (Accounts) Rules, 2014:
Research and DevelopmentThe Company lays significant emphasis on improvements in methods and processes in its areas of construction and operations. The Company has an in-house Research & Development Division. Theprimary focus of research is to continually refine the frequently used systems at our project sites to derive optimisation, reduction in the breakdowns, improve effectiveness and efficiency of use and hence provide a competitive edge for any project.
a) conservation of energy(i) steps taken or impact on conservation of energy:
• Production of concrete is one of the mostenergy intensive process in construction industry. Out of all ingredients in concrete, Cement accounts for embodied energy in concrete. To reduce embodied energy in concrete the Company is using pozzolanic materials (Fly ash / GGBS) replacing ordinary portland cement at suitable proportions in compliance with contract and codal specification, blended at site mixing plant to produce various grades of concrete. The production of GGBS/Fly Ash consumes much lesser amount of energy compared to cement and thereby less energy consumption for production of concrete.
• TheCompany has started replacing existingconventional lighting system to energy efficient LED systems.
• TheCompanycontinuesusingtheTranslucentPolycarbonate sheets at all project sites stores in place of conventional roofing material allowing daylight, thereby saving on electricity.
• The Company continues phase wisereplacement of power consuming Transformer welding machines with rectifier welding machines and now with new generation IGBT based Welding machine leading to muchsavings in energy.
(ii) steps taken by the company for utilising alternate sources of energy:
• The Company has started using SolarRenewable products such as Solar Blinkers, required for safer road diversions, for major Road and Metro project sites.
(iii) capital investment on energy conservation equipment:
• Traditionally, construction industry inIndia has been using mechanical cranes at construction sites. The Company has taken a conscious decision to progressively replace the mechanical cranes with the more efficient, energy conserving hydraulic cranes.
• Recycle of Returned Concrete: In majorMetro project sites the quantity of returned concrete from the pouring is a burden and adds towastage in terms of energy & cost.The Company introduced concrete reclaimers at one of the major project sites to recycle the aggregates out of the returned concrete as a trial step to conservation of energy.
b) technology absorption (i) efforts made towards technology
absorption - nil
(ii) benefits derived like product improvement, cost reduction, product development or import substitution:
• Savingoffuel.
• Savingofelectricity.
• The Company continues to utiliseSecant pile forming a continuous wall of soft and hard piles, alternating to each other with the harder pile cutting into adjacent soft pile in project involving deep excavation with shallow ground water table. This process is extensively used for Mumbai underground Metro shaft construction and also for Nagpur Metro Project.
(iii) in case of imported technology (imported during the last three years reckoned from the beginning of the financial year):
(a) the details of technology imported: None
(b) the year of import: N.A.

ITD Cementation India Limited
48 204
(c) whether the technology been fully absorbed: N.A.
(d) if not fully absorbed, areas where absorption has not taken place, and the reasons thereof: N.A.
and
(iv) expenditure incurred on Research and Development- Nil
c) Foreign exchange earnings and outgo a. The Company did not have any export during
the year under report.
b. The foreign exchange received during the year under report from sale of two old used equipments is ` 85.09 lakhs. The foreign exchange outgo on account of travelling, import of consumables, capital goods, tools and spare parts, fees, royalty etc. aggregated to 3,113.47 lakhs (previous year ` 3,051.39 lakhs).
For and on behalf of the Board
Premchai Karnasuta 22nd February, 2018 Chairman

Annual Report 2017
Boa
rd’s
Rep
ort
Fina
ncia
l Sta
tem
ents
Sta
tuto
ry R
epor
tsC
orpo
rate
Ove
rvie
w
49 204
annexuRe 3
corporate social Responsibility (csR)
[Pursuant to clause (o) of sub-section (3) of Section 134 of the Companies Act, 2013 and Rule 9 of the Companies (Corporate Social Responsibility) Rules, 2014]
1. A brief outline of the Company’s CSR policy, including overview of projects or programmes proposed to be undertaken and a reference to the web-link to the CSR policy and projects or programmes:
CSR Policy aims at implementing its CSR activities in accordance with Section 135 of the Companies Act, 2013 and the notified Rules. The CSR Committee shall periodically review the implementation of the CSR Policy and the same has been uploaded on the Company’s website with the following link:
http://www.itdcem.co.in/about-us/csr/
2. The Composition of the CSR Committee:
The CSR Committee comprises of Mr. Per Hofvander (Chairman),Mr. Pathai Chakornbunditand Mr. Adun Saraban.
3. Average net profit of the Company for last three financial years: (` 1,095.16 lakhs)
4. Prescribed CSR Expenditure (two per cent of the amount as in item 3 above): Not Applicable
5. Details of CSR spent during the financial year.
(a) Total amount to be spent for the financial year: NIL
(b) Amount unspent, if any: NIL
6. In case the company has failed to spend the two percent of the average net profit of the last three financial years or any part thereof, the company shall provide the reasons for not spending the amount in its Board’s Report. – On account of the losses incurred by the Company, there was no average net profit in the three immediately preceding financial years and therefore the Company was not in a position to spend any amount on CSR activities during the year under report.
7. A responsibility statement of the CSR Committee that the implementation and monitoring of CSR Policy, is in compliance with CSR objectives and Policy of the Company: Yes
adun saraban Per Hofvander Managing Director Chairman
22nd February, 2018

ITD Cementation India Limited
50 204
annexuRe 4
extract from nomination and Remuneration Policy on Directors’ appointment and Remuneration
In terms of Nomination and Remuneration Policy of the Company, present members of Nomination and Remuneration Committee are comprised of Mr. D.E. Udwadia, Mr. Premchai Karnasuta, Mr. PathaiChakornbunditandMr.PerHofvander.
1. the nomination and Remuneration committee is applicable to
• Directors(ExecutiveandNon-Executive)
• KeyManagerialPersonnel
• SeniorManagementPersonnel
2. Role and Functions of the committee relating to nomination:
(a) Review the Board structure, size and composition and make recommendations to the Board in this regard;
(b) To identify persons who are qualified to become directors (including appointments to committees) and who may be appointed in Senior Management in accordance with the criteria laid-down, recommend to the Board their appointment and removal and to carry out evaluation of every director’s performance;
(c) To formulate the criteria for determining qualifications, positive attributes and independence of a director;
(d) To recommend to the Board plans for succession, in particular, of the Managing Director, the Executive Directors, Key Managerial Personnel and Senior Management Personnel;
(e) To evaluate the performance of the Board and Senior Management Personnel on certain pre-determined parameters as may be laid down by the Board as part of the self-evaluation process.
3. Functions and Responsibilities of the committee relating to Remuneration:
The functions and responsibilities of the Committee in relation to remuneration will be as under:
3.1 Relating to the company: • The Committee to formulate and recommend
to the Board a policy relating to the remuneration for the directors, key managerial personnel and other employees.
• The Committeewhile formulating the abovepolicy shall ensure that –
(a) the level and composition of remuneration be reasonable and sufficient to attract, retain and motivate directors of the quality required to run the Company successfully;
(b) relationship of remuneration to performance be clear and meets appropriate performance benchmarks; and
(c) remuneration to directors, key managerial personnel and senior management personnel involves a balance between fixed and incentive pay reflecting short and long term performance objectives appropriate to the working of the Company and its goals.
• Evaluate and approve the Company’sremuneration plan, annual salary increase principles and budgets, policies and programmes such as succession planning, employment agreements, severance agreements and any other benefits.
• ReviewprogressontheCompany’sleadershipdevelopment programmes, including for promotion to the board, employee engagement initiatives and employee surveys.
• Evaluateissuespertainingtotheappointmentof and remuneration payable to, Senior Management Personnel.
• EvaluatetermsandconditionsrelatingtotheAnnual and Long Term Incentive Plans of the Company, including plan design, supervision and payouts.
Annual Report 2017
Boa
rd’s
Rep
ort
Fina
ncia
l Sta
tem
ents
Sta
tuto
ry R
epor
tsC
orpo
rate
Ove
rvie
w
51 204
• Consider and approve matters relatingto normal retirement plans, VoluntaryRetirement and Early Separation Schemes for employees of the Company.
3.2 Relating to the Performance and Remuneration of the managing Director, Key managerial Personnel and senior management Personnel:
• Establish key performance metrics tomeasure the performance of the Managing Director, Key Managerial Personnel and Senior Management Personnel including the use of financial, non-financial and qualitative measures.
• EvaluateSeniorManagementPersonnelteamperformance regularly to strengthen the cumulative annual assessment and to provide timely feedback to the assessed individuals.
• Review and recommend to the Board theremuneration and performance bonus or commission to the Managing Director and Key Managerial Personnel.
3.3 Relating to the Performance and Remuneration of the non-executive Directors:
Define the principles, guidelines and process for determining the payment of commission to non-executive directors of the Company.
4. other Functions: Perform such other activities within the scope of
this Policy as may be requested by the Board of Directors or under any regulatory requirements.
5. nomination Duties: Evaluating the performance of the Board
members and Senior Management in the context of the Company’s performance from business and compliance perspective.
6. Remuneration Duties: The duties of the Committee in relation to
remuneration matters include:
(a) to consider and determine the Remuneration Policy, based on the performance and also bearing in mind that the remuneration is reasonable and sufficient to attract, retain and motivate members of the Board and such other factors as the Committee shall deem appropriate all elements of the remuneration of the members of the Board;
(b) to approve the remuneration of the Senior Management including Key Managerial Personnel of the Company maintaining a balance between fixed and incentive pay reflecting short and long term performance objectives appropriate to the working of the Company;
(c) to delegate any of its powers to one or more of its members or the Secretary of the Committee;
(d) to consider any other matters as may be requested by the Board;
(e) professional indemnity and liability insurance for Directors and senior management.

ITD Cementation India Limited
52 204
FoRm no. mR-3
secRetaRial auDit RePoRt
FORTHEFINANCIALYEARENDED31stDECEMBER,2017
(Pursuant to Section 204 (1) of the Companies Act, 2013 and rule No. 9 of the Companies (Appointment and Remuneration of Managerial Personnel) Rules, 2014)
annexuRe 6
To,The Members,ITD Cementation India LimitedNational Plastic Building, A- Subhash Road,ParanjapeBScheme,VileParle(East),Mumbai - 400057
We have conducted the secretarial audit of thecompliance of applicable statutory provisions and the adherence to good corporate practices by ITD Cementation India Limited (hereinafter called the Company). Secretarial Audit was conducted in a manner that provided us a reasonable basis for evaluating the corporate conducts/statutory compliances and expressing our opinion thereon.
Based on our verification of the Company’s books, papers, minute books, forms and returns filed and other records maintained by the Company, the information provided by the Company, its officers, agents and authorised representatives during the conduct of secretarial audit, the explanations and clarifications given to us and the representations made by the Management, we hereby report that in our opinion, the company has, during the audit period covering the financial year ended on 31st December, 2017 generally complied with the statutory provisions listed hereunder and also that the Company has proper Board processes and compliance mechanism in place to the extent, in the manner and subject to the reporting made hereinafter:
We have examined the books, papers,minute books,forms and returns filed and other records made available to us and maintained by the Company for the financial year ended on 31st December, 2017 according to the provisions of:
(i) The Companies Act, 2013 (the Act) and the rules made thereunder;
(ii) The Securities Contract (Regulation) Act, 1956 (‘SCRA’) and the rules made thereunder;
(iii) The Depositories Act, 1996 and the Regulations and Bye-laws framed thereunder;
(iv) Foreign Exchange Management Act, 1999 and the rules and regulations made thereunder to the extent of Foreign Direct Investment, Overseas Direct Investment and External Commercial Borrowings;
(v) The following Regulations and Guidelines prescribed under the Securities and Exchange Board of India Act, 1992 (‘SEBI Act’)
(a) The Securities and Exchange Board of India (Substantial Acquisition of Shares and Takeovers) Regulations, 2011;
(b) The Securities and Exchange Board of India (Prohibition of Insider Trading) Regulations, 2015;
(c) The Securities and Exchange Board of India (Issue of Capital and Disclosure Requirements) Regulations, 2009 and amendments from time to time;
(d) The Securities and Exchange Board of India (Share Based Employee Benefits) Regulations, 2014; (Not applicable to the Company during the audit period)
(e) The Securities and Exchange Board of India (Issue and Listing of Debt Securities) Regulations, 2008; (Not applicable to the Company during the audit period)
(f) The Securities and Exchange Board of India (Registrars to an Issue and Share Transfer Agents) Regulations, 1993 regarding the Companies Act and dealing with client; (Not applicable to the Company during the audit period)

Annual Report 2017
Boa
rd’s
Rep
ort
Fina
ncia
l Sta
tem
ents
Sta
tuto
ry R
epor
tsC
orpo
rate
Ove
rvie
w
53 204
(g) The Securities and Exchange Board of India (Delisting of Equity Shares) Regulations, 2009; (Not applicable to the Company during the audit period) and
(h) The Securities and Exchange Board of India (Buyback of Securities) Regulations, 1998; (Not applicable to the Company during the audit period)
(vi) Other laws applicable specifically to the Company namely :
1 TheContractLabour(R&A)Act,1970andRulesmade thereunder;
2 The Building & Other Construction (RE&CS)Act,1996 and Rules made thereunder;
3 The Inter-state Migrant Workmen Act, 1976and Rules made thereunder;
4 The Explosive Act 1884 and Rules made thereunder;
5 Air (Prevention and Control of Pollution) Act, 1981and Rules made thereunder;
6 Water (Prevention and Control of Pollution)Act, 1974and Rules made thereunder;
7 The Maharashtra Muncipal, Councils, Nagar Panchayats and Industrial Townships Act;
8 The Factories Act, 1948 and Rules made thereunder.
Wehavealsoexaminedcompliancewiththeapplicableclauses of the following:
(i) Secretarial Standards of The Institute of Company Secretaries of India with respect to board and general meetings.
(ii) The Listing Agreements entered into by the Company with BSE Limited and National Stock Exchange of India Limited read with the SEBI (Listing Obligations and Disclosure Requirements) Regulations, 2015.
During the period under review, the Company has complied with the provisions of the Act, Rules, Regulations, Guidelines, standards etc. mentioned above.
Wefurtherreportthat:
The Board of Directors of the Company is duly constituted with proper balance of Executive Directors, Non-Executive Directors and Independent Directors. The changes in the composition of the Board of Directors that took place during the period under review were carried out in compliance with the provisions of the Act.
Adequate notice was given to all directors to schedule the Board Meetings, agenda and detailed notes on agenda were sent at least seven days in advance for meetings other than those held at shorter notice, and a system exists for seeking and obtaining further information and clarifications on the agenda items before the meeting and for meaningful participation at the meeting.
Decisions at the Board Meetings were taken unanimously.
Wefurtherreportthatthereareadequatesystemsandprocesses in the Company commensurate with the size and operations of the Company to monitor and ensure compliance with applicable laws, rules, regulations and guidelines.
We further report that during the audit period noevents occurred which had bearing on the Company’s affairs in pursuance of the above referred laws, rules, regulations, guidelines etc.
For Parikh & associates Company Secretaries
Signature: P. n. ParikhPlace: Mumbai PartnerDate : 22nd February, 2018 FCS No: 327 CP No: 1228
This Report is to be read with our letter of even date which is annexed as Annexure A and Forms an integral part of this report.
ITD Cementation India Limited
54 204
annexuRe a
To, The Members ITD Cementation India Limited
Our report of even date is to be read along with this letter.
1. Maintenance of Secretarial record is the responsibility of the management of the Company. Our responsibility is to express an opinion on these secretarial records based on our audit.
2. Wehavefollowedtheauditpracticesandprocessaswereappropriatetoobtainreasonableassuranceaboutthe correctness of the contents of the Secretarial records. The verification was done on test basis to ensure thatcorrectfactsarereflectedinSecretarialrecords.Webelievethattheprocessandpractices,wefollowedprovide a reasonable basis for our opinion.
3. WehavenotverifiedthecorrectnessandappropriatenessoffinancialrecordsandBooksofAccountsoftheCompany.
4. Whereverrequired,wehaveobtainedtheManagementrepresentationabouttheComplianceoflaws,rulesand regulations and happening of events etc.
5. The Compliance of the provisions of Corporate and other applicable laws, rules, regulations, standards is the responsibility of management. Our examination was limited to the verification of procedure on test basis.
6. The Secretarial Audit report is neither an assurance as to the future viability of the Company nor of the efficacy or effectiveness with which the management has conducted the affairs of the Company.
For Parikh & associates Company Secretaries
Signature: P. n. ParikhPlace: Mumbai PartnerDate : 22nd February, 2018 FCS No: 327 CP No: 1228

Annual Report 2017
Boa
rd’s
Rep
ort
Fina
ncia
l Sta
tem
ents
Sta
tuto
ry R
epor
tsC
orpo
rate
Ove
rvie
w
55 204
annexuRe 7FoRm no. mgt - 9
extRact oF annual RetuRn
as on the financial year ended on 31.12.2017
Pursuant to Section 92 (3) of the Companies Act, 2013 and Rule 12(1) of the Companies (Management and Administration) Rules, 2014.
i RegistRation & otHeR Detailsi CIN L61000MH1978PLC020435
ii Registration Date 24th June, 1978
iii Name of the Company ITD Cementation India Limited
iv Category/Sub-category of the Company Public Company limited by Shares
v AddressoftheRegisteredOffice&Contactdetails National Plastic Building, A- Subhash
Road,ParanjapeBScheme,VileParle
(East), Mumbai – 400 057
Tel: +91 22 66931600/67680600
Fax: +91 22 66931628/67680841
Emails: [email protected]
Website:www.itdcem.co.in
vi WhetherlistedCompany Yes
vii Name,Address&contactdetailsoftheRegistrar&TransferAgent,
if any.
Karvy Computershare Private Limited
Karvy Selenium Tower B, Plot 31-32,
Gachibowli, Financial District,
Nanakramguda,Hyderabad–500032
Tel: +91 40 67162222
Fax:+91 40 23420814
Emails: [email protected]
ii PRinciPal business activities oF tHe comPanyAll the business activities contributing 10% or more of the total turnover of the Company shall be stated:-
sl no
name and Description of main products/services nic code of the Product /service
% to total turnover of the company
1 Construction&CivilEngineering 4290 100%
iii PaRticulaRs oF HolDing, subsiDiaRy anD associate comPaniessl no
name and address of the company
cin/gln Holding/ subsidiary/ associate
% of shares held
applicable section
1 Italian-Thai Development Public Company Limited, 2034/132-161 Italthai Tower, New Petchburi Road,Bangkapi,Huaykwang,Bangkok - 10320, Thailand
F2273 Holding 51.63 2(46)
2 ITD Cementation Projects India Limited, National Plastic Building, A-Subhash Road, Paranjape BScheme,VileParle(East), Mumbai - 400 057
U45205MH2007PLC171896 Subsidiary 100 2(87)

ITD Cementation India Limited
56 204
(iv) (i) categoRy - wise sHaRe HolDing between 01/01/2017 anD 31/12/2017
category code
category of shareholder
no. of shares held at the beginning of the year 01/01/2017
no. of shares held at the end of the year 31/12/2017
% change during
the year Demat Physical total % of total
sharesDemat Physical total % of total
shares
(i) (ii) (iii) (iv) (v) (vi) (vii) (viii) (ix) (x) (xi)
(a) PRomoteR anD PRomoteR gRouP
(1) INDIAN
(a) Individual/HUF 0 0 0 0.00 0 0 0 0.00 0.00
(b) Central Government/State Government(s)
0 0 0 0.00 0 0 0 0.00 0.00
(c) Bodies Corporate
0 0 0 0.00 0 0 0 0.00 0.00
(d) Financial Institutions / Banks
0 0 0 0.00 0 0 0 0.00 0.00
(e) Others 0 0 0 0.00 0 0 0 0.00 0.00
sub-total a(1) : 0 0 0 0.00 0 0 0 0.00 0.00
(2) FOREIGN
(a) Individuals (NRIs/Foreign Individuals)
0 0 0 0.00 0 0 0 0.00 0.00
(b) Bodies Corporate
80113180 0 80113180 51.63 80113180 0 80113180 51.63 0.00
(c) Institutions 0 0 0 0.00 0 0 0 0.00 0.00
(d) Qualified Foreign Investor
0 0 0 0.00 0 0 0 0.00 0.00
(e) Others 0 0 0 0.00 0 0 0 0.00 0.00
sub-total a(2) : 80113180 0 80113180 51.63 80113180 0 80113180 51.63 0.00
total a=a(1)+a(2)
80113180 0 80113180 51.63 80113180 0 80113180 51.63 0.00
(b) Public sHaReHolDing
(1) INSTITUTIONS
(a) Mutual Funds /UTI
38534738 1000 38535738 24.84 34431886 1000 34432886 22.19 2.64
(b) Financial Institutions /Banks
42118 1300 43418 0.03 161430 500 161930 0.10 -0.08
(c) Central Government / State Government(s)
0 0 0 0.00 0 0 0 0.00 0.00
(d) VentureCapitalFunds
0 0 0 0.00 0 0 0 0.00 0.00
(e) Insurance Companies
0 0 0 0.00 0 0 0 0.00 0.00

Annual Report 2017
Boa
rd’s
Rep
ort
Fina
ncia
l Sta
tem
ents
Sta
tuto
ry R
epor
tsC
orpo
rate
Ove
rvie
w
57 204
category code
category of shareholder
no. of shares held at the beginning of the year 01/01/2017
no. of shares held at the end of the year 31/12/2017
% change during
the year Demat Physical total % of total
sharesDemat Physical total % of total
shares
(f) Foreign Institutional Investors
4192377 0 4192377 2.70 4345180 0 4345180 2.80 -0.10
(g) ForeignVentureCapital Investors
0 0 0 0.00 0 0 0 0.00 0.00
(h) Qualified Foreign Investor
0 0 0 0.00 0 0 0 0.00 0.00
(i) Others 0 0 0 0.00 0 0 0 0.00 0.00
sub-total b(1) : 42769233 2300 42771533 27.57 38938496 1500 38939996 25.10 (2.46)
(2) NON-INSTITUTIONS
(a) Bodies Corporate
4377816 31180 4408996 2.84 5317382 22730 5340112 3.44 0.60
(b) Individuals
(i) Individuals holding nominal share capital upto ` 1 lakh
17856945 1403530 19260475 12.41 21474244 1038375 22512619 14.51 2.10
(ii) Individuals holding nominal share capital in excess of ` 1 lakh
7597035 0 7597035 4.90 6889393 0 6889393 4.44 (0.46)
(c) Others
CLEARING MEMBERS
85749 0 85749 0.06 102268 0 102268 0.07 0.01
FOREIGN BANKS 0 500 500 0.00 0 0 0 0.00 0.00
I E P F 0 0 0 0.00 293560 0 293560 0.19 0.19
NON RESIDENT INDIANS
743377 5500 748877 0.48 742617 1500 744117 0.48 0.00
NRI NON-REPATRIATION
163555 0 163555 0.11 218704 0 218704 0.14 0.03
TRUSTS 8000 0 8000 0.01 3951 0 3951 0.00 0.01
(d) Qualified Foreign Investor
0 0 0 0.00 0 0 0 0.00 0.00
sub-total b(2) : 30832477 1440710 32273187 20.80 35042119 1062605 36104724 23.27 2.48
total b=b(1)+b(2) :
73601710 1443010 75044720 48.37 73980615 1064105 75044720 48.37 0.00
total (a+b) : 153714890 1443010 155157900 100.00 154093795 1064105 155157900 100.00 0.00
(C) Shares held by custodians, against which Depository Receipts have been issued
(1) Promoter and Promoter Group
0 0 0 0.00 0 0 0 0.00 0.00
(2) Public 0 0 0 0.00 0 0 0 0.00 0.00
gRanD total (a+b+c) :
153714890 1443010 155157900 100.00 154093795 1064105 155157900 100.00 0.00

ITD Cementation India Limited
58 204
(ii) shareholding of Promoters
sl no.
shareholder's name
shareholding at the beginning of the year (as on 01/01/2017)
shareholding at the end of the year (as on 31/12/2017)
% change in share holding
during the year
no. of shares(Face value of
` 1/- each)
% of total shares of the
company
% of shares Pledged /
encumbered to total shares
no. of shares (Face value of
` 1/- each)
% of total shares of the
company
% of shares Pledged /
encumbered to total shares
1 ITALIAN-THAIDEVELOPMENTPUBLICCOMPANY LIMITED
80113180 51.63 - 80113180 51.63 - NIL
total 80113180 51.63 - 80113180 51.63 - nil
(iii) change in Promoters’ shareholding (specify if there is no change)*
sl no.
shareholding at the beginning of the year (as on 01/01/2017)
cumulative shareholding during the year
no. of shares(Face value of ` 1/-
each)
% of total shares of the company
no. of shares (Face value of ` 1/- each)
% of total shares of the company
1 At the beginning of the year 80113180 51.63
2 Date wise increase / decrease in Promoter's shareholding during the year specifying the reasons for increase / decrease (e.g. allotment / transfer / bonus / sweat equity etc)
- - - -
3 At the end of the year (As on 31/12/2017)
80113180 51.63
(iv) shareholding Pattern of top ten shareholders (other than Direcors, Promoters and Holders of gDRs and aDRs)
sl no.
top 10 shareholders shareholding at the beginning of the year (as on 01/01/2017)
cumulative shareholding at the end of the year (as on 31/12/2017)*
no. of shares(Face value of ` 1/-
each)
% of total shares of the company
no. of shares (Face value of ` 1/- each)
% of total shares of the company
1 HDFCTRUSTEECOMPANYLIMITED-HDFCPRUDENCEFUND
10576780 6.82 955600 0.62
2 RELIANCECAPITALTRUSTEECO.LTD.-A/C RELIANCE T
0 0 9376105 6.04
3 UTI-MNCFUND 7633041 4.92 5649430 3.64
4 SBIMAGNUMMIDCAPFUND 5460315 3.52 5401284 3.48
5 HITESHRAMJIJAVERI 4150000 2.67 4000020 2.58
6 IDFCINFRASTRUCTUREFUND 150000 0.1 3563055 2.3
7 SUNDARAMMUTUALFUNDA/CSUNDARAMSMILEFUND
3535069 2.28 2657499 1.71
8 EASTSPRINGINVESTMENTSINDIAINFRASTRUCTUREEQUITY
3418958 2.2 2584178 1.67
9 FRANKLINTEMPLETONMUTUALFUNDA/C FRANKLIN INDIA
2850000 1.84 4000000 2.58
10 LANDTMUTUALFUNDTRUSTEELTD-LANDTMONTHLYIN
2318779 1.49 648948 0.42
* The shares of the Company are traded on a daily basis and hence the date wise increase/decrease in shareholding is not indicated.

Annual Report 2017
Boa
rd’s
Rep
ort
Fina
ncia
l Sta
tem
ents
Sta
tuto
ry R
epor
tsC
orpo
rate
Ove
rvie
w
59 204
(v) shareholding of Directors and Key managerial Personnel sl. no
name of Director / Key managerial Personnel
Date Reason shareholding at the beginning of the year -
(as on 01/01/2017)
cumulative shareholding during the year
no. of shares
% of total shares of the
company
no. of shares
% of total shares of the
company
1 Mr. Premchai Karnasuta
01/01/2017 At the beginning of the year 0 0 0 0
31/12/2017 At the end of the year 0 0
2 Mr. Pathai Chakornbundit
01/01/2017 At the beginning of the year 0 0 0 0
31/12/2017 At the end of the year 0 0
3 Mr.D.E.Udwadia 01/01/2017 At the beginning of the year 0 0 0 0
31/12/2017 At the end of the year 0 0
4 Mr.PerHofvander 01/01/2017 At the beginning of the year 0 0 0 0
31/12/2017 At the end of the year 0 0
5 Mr. D.P. Roy 01/01/2017 At the beginning of the year 0 0 0 0
31/12/2017 At the end of the year 0 0
6 Mrs. Ramola Mahajani 01/01/2017 At the beginning of the year 0 0 0 0
31/12/2017 At the end of the year 0 0
7 Mr. Piyachai Karnasuta
01/01/2017 Appointed w.e.f. 05/08/2015 0 0 0 0
31/12/2017 At the end of the year 0 0
8 Mr. Adun Saraban 01/01/2017 At the beginning of the year 0 0 0 0
31/12/2017 At the end of the year 0 0
9 Mr. S. Ramnath (upto 15th July, 2017)
01/01/2017 At the beginning of the year 0 0 0 0
31/12/2017 At the end of the year 0 0
10 Mr. Prasad Patwardhan (w.e.f. 16th July, 2017)
01/01/2017 At the beginning of the year 0 0 0 0
31/12/2017 At the end of the year 0 0
11 Mr. R.C.Daga (upto 31st January, 2017)
01/01/2017 At the beginning of the year 100 0 100 0
31/12/2017 At the end of the year 100 0
12 Mr. Rahul Neogi (w.e.f. 1st February, 2017)
01/01/2017 At the beginning of the year 0 0 0 0
31/12/2017 At the end of the year 0 0

ITD Cementation India Limited
60 204
v indebtednessIndebtedness of the Company including interest outstanding/accrued but not due for payment
(` in lakhs)
secured loans excluding
deposits
unsecured loans
Deposits total indebtedness
indebtedness at the beginning of the financial year
i) Principal Amount 18,121 17,500 NIL 35,621
ii) Interest due but not paid NIL NIL NIL NIL
iii) Interest accrued but not due 6 NIL NIL 6
total (i+ii+iii) 18,127 17,500 NIL 35,627
change in indebtedness during the financial year
Additions 15,586 17,500 NIL 33,086
Reduction -2,323 -17,500 NIL -19,823
Net Change 13,263 NIL NIL 13,263
indebtedness at the end of the financial year
i) Principal Amount 31,360 17,500 NIL 48,860
ii) Interest due but not paid NIL NIL NIL NIL
iii) Interest accrued but not due 30 NIL NIL 30
total (i+ii+iii) 31,390 17,500 nil 48,890
vi Remuneration of Directors and Key managerial Personnela. Remuneration to managing Director, whole time director and/or manager:
(` in lakhs)
sl. no Particulars of Remuneration name of the managing Director
total amount
Mr. Adun Saraban
1 Gross salary (a) Salary as per provisions contained in Section
17(1) of the Income Tax Act, 1961
98.55 98.55
(b) ValueofperquisitesunderSection17(2)oftheIncome tax Act, 1961
19.25 19.25
(c) Profits in lieu of salary under Section 17(3) of the Income Tax Act, 1961
NIL NIL
2 Stock option NIL NIL
3 Sweat Equity NIL NIL
4 Commission 17.50 17.50
- as % of profit 0.16 0.16
- others (specify) NIL NIL
5 Others, please specify NIL NIL
total (a) 135.30 135.30
ceiling as per the act 548.21

Annual Report 2017
Boa
rd’s
Rep
ort
Fina
ncia
l Sta
tem
ents
Sta
tuto
ry R
epor
tsC
orpo
rate
Ove
rvie
w
61 204
b. Remuneration to other directors(` in lakhs)
sl. no
Particulars of Remuneration
name of Directors total amount
1 Independent Directors Mr.D.E.Udwadia Mr. D.P. Roy Mrs. Ramola Mahajani
Mr.PerHofvander
(a) Fee for attending Board and Committee meetings
5.10 3.60 2.30 NIL 11.00
(b) Commission 5.00 5.00 5.00 NIL 15.00
(c) Others, please specify NIL NIL NIL NIL NIL
total (1) 10.10 8.60 7.30 nil 26.00
2 Other Non Executive Directors
Mr. Premchai Karnasuta
Mr. Pathai Chakornbundit
Mr. Piyachai Karnasuta
(a) Fee for attending Board and Committee meetings
NIL NIL NIL NIL
(b) Commission NIL NIL NIL NIL
(c) Others, please specify NIL NIL NIL NIL
total (2) nil nil nil nil
total (b)=(1+2) 10.10 8.60 7.30 nil 26.00
total managerial Remuneration
161.30
overall cieling as per the act.
657.85
c. RemuneRation to Key manageRial PeRsonnel otHeR tHan mD/manageR/wtD(` in lakhs)
sl. no
Particulars of Remuneration
Key managerial Personnel totalcompany
secretary (mr. Rahul neogi) -with effect from 1st February,
2017
company secretary (mr. R.c. Daga) - till 31st January,
2017
cFo (mr.Prasad Patwardhan) -with effect
from 16th July, 2017
cFo (mr. s. Ramnath) - till 15th July, 2017
1 Gross salary a) Salary as per
provisions contained in Section 17(1) of the Income Tax Act, 1961
38.70 3.96 34.12 46.60 123.38
(b) Valueofperquisitesunder Section 17(2) of the Income tax Act, 1961
2.82 0.23 1.86 3.79 8.69
(c) Profits in lieu of salary under Section 17(3) of the Income Tax Act, 1961
NIL NIL NIL NIL NIL
2 Stock option NIL NIL NIL NIL NIL
3 Sweat Equity NIL NIL NIL NIL NIL
4 Commission
- as % of profit NIL NIL NIL NIL NIL
- others (specify) NIL NIL NIL NIL NIL
5 Others, please specify NIL NIL NIL NIL NIL
total 41.51 4.18 35.99 50.39 132.07

ITD Cementation India Limited
62 204
vii Penalties/Punishment/comppounding of offences
type section of the companies act
brief Description
Details of Penalty/
Punishment/compounding fees imposed
authority (RD/nclt/court)
appeal made, if any (give
details)
a. comPany
Penalty
NIL Punishment
Compounding
b. DiRectoRs
Penalty
NIL Punishment
Compounding
c. otHeR oFFiceRs in DeFault
Penalty
NIL Punishment
Compounding

Annual Report 2017
Boa
rd’s
Rep
ort -
MD
& A
Fina
ncia
l Sta
tem
ents
Sta
tuto
ry R
epor
tsC
orpo
rate
Ove
rvie
w
63 204
Management Discussion and Analysis
Company profileITD Cementation India Limited is a leading engineering, procurement and construction (EPC) player in the infrastructure and construction industry. With proven competence in civil engineering, the Company undertakes projects in the realm of:
• Maritimestructures
• Hydroelectricpowerprojects, tunnels,damsandirrigation projects
• Urban infrastructure projects/mass rapid transitsystems/airports
• Highways,bridgesandflyovers
• Buildings&otherindustrialcivilworks
• Waterandwastewatertreatment
• Specialist ground improvement & foundationengineering
eConomiC overviewGlobal economyAccordingtoboth,theWorldBankandtheIMF,globalgrowth in 2017 was much stronger than expected.According to the World Bank’s Global EconomicPerspective (January 2018), benign financingconditions, generally accommodative policies, improvedconfidenceandthedissipatingimpactoftheearlier commodity price collapse also contributed togrowth.Asaresultofallthesefactors,theWorldBankexpectsglobalgrowthtoreach3.1%for2018.
3.5
3
2.5
2
1.5
1
2015 2016 2017E 2018E
%
2.8
2.4
3 3.1
Global Growth
Source: World Bank, Global Economic Perspective (January 2018)
annexure – 8
The IMF, on the other hand, estimated that globaloutputhasgrownby3.7%in2017.Itstated,initsWorldEconomic Outlook Update (January 2018) that thepick-upingrowthhasbeenbroad-based,withnotableupside surprises in Europe and Asia.
While the World Bank opined that the current, broad-based growth acceleration could be self-reinforcing, italso expressed concerns that the current demand-ledrecovery is likely to run up against supply constraints due toadecliningtrendintotalfactorproductivity.TheIMF’sviewwas also in linewith that of theWorld Bank as itprojectedthatriskstotheglobalgrowthforecastappearbroadlybalancedinthenearterm,butremainskewedtothedownsideoverthemediumterm.Italsoclarifiedthatontheupside,thecyclicalreboundcouldprovestrongerin the near term as the pick-up in activity and easier financialconditionsreinforceeachother.
emerging markets and Developing economies (emDes)Onthebackoffirmingactivityincommodityexportingcountriesand robustgrowth incountries that importcommodities,theWorldBankestimatedgrowthamongEMDEstohaveclimbedto4.3%in2017.Effectively,mostEMDE regions benefited from a recovery in exports.Economic activity among commodity exporters, wasdrivenbyariseinthepricesofmostcommodities,animprovementinconfidencelevels,ameliorationofthedrag from earlier policy tightening and a bottoming-outof investmentgrowthafteraprolongedperiodofweakness.Further,keyeconomies,suchasBrazilandtheRussianFederation,emergedfromrecession.
According to the World Bank, growth in EMDEs isexpectedtoaccelerateto4.5%in2018andanaverageof4.7%in2019-20.Thisexpectedspurtisattributedto a further pickup in the growth in commodityexportingcountries,asoilandothercommoditypricesfirm and the effects of the earlier commodity price collapse dissipate.
financial marketsThe improved global growth outlook and historicallylow interest rates resulted inbenignglobalfinancingconditionsacrosstheglobe.TheU.S.FederalReservehiked policy interest rates three times in 2017 andthe ECB announced a further reduction of its asset

ITD Cementation India Limited
64 204
purchaseprogrammefromJanuary2018.Nevertheless,bond yields remained low in both regions. Thefinancial liquidity in major advanced economiesdroveinvestmentstowardsEMDEassetsin2017.Asaresult, bond spreads declined, particularly for EMDEinvestmentgradeborrowers,andsidebyside,capitalflows, including portfolio and international bondissuances, increased.
Global economic outlook Despite the acceleration in growth in 2017 andexpectationsthatthismomentumwillcontinuein2018,there are concerns about growth in thenext decade.Thedecelerationcouldbetriggeredbythelaggedeffectofrecentinvestmentweakness,coupledwithslowingproductivitygrowth,asreflectedbyfallingtotalfactorproductivity, and unfavourable demographic trends.Thegrowth in labour forcehasbeenslowing inmanyparts of the world and this indicates that the paceof economic growth could be subdued in the future.The World Bank, in its Global Economic Perspective(January 2018) suggests that efforts to invest ininfrastructure and education, health and other human skillsandwellbeing,aswellas initiatives topromoteeconomicdiversificationandliberalisetrade,willboostgrowthprospectsandimprovestandardsofliving.
(Source:http://www.worldbank.org/en/publication/global-
economic-prospects)
indian economyDespite the economic impact of the demonetisation exercise and implementation of GST, the Indianeconomy is expected to clockanacceptable growthof 6.75% during FY18 according to the EconomicSurvey 2017-18. The report further projects thatthe economy will perform well in FY19, achieving agrowth of between 7 and 7.5%, to claim its positionof the fastest growing major economy in the worldonce more. Alongside the bottoming out of growth,thefinanceministryaimstoreducethefiscaldeficitfromanestimated3.2%ofGDPinFY18to3%inFY19.Whileinflationtoodeclinedtoasix-yearlowof3.3%duringFY18,theRBIhasraiseditsinflationforecastintheFebruary2018MonetaryPolicyMeet,asinflationbeganclimbingoncemore.AccordingtotheRBI,theinflationoutlookiscloudedbyseveraluncertainties,butlikelytobehigheronaccountofhigherminimumsupport price for farmers, a larger than expectedfiscaldeficitfigureforFY18aswellasFY19,increasedfoodandfuelpricesandhigherhouserentallowances(HRA)forgovernmentemployeesunderthe7thCentralPayCommission (CPC). Accordingly, theRBI has leftitsbenchmarkrate,thereporate,unchangedat6%attheFebruary2018MonetaryPolicyMeet.
8.28.07.87.67.47.27.06.86.66.46.26.0
2014-15 2015-16 2016-17 2017-18P2018-19E
7.5
8
7.1
6.757
7.5
india’s GDp Growth
Source: Economic Survey, 2017-18
repo rate6.30
6.25
6.20
6.15
6.10
6.05
6.00
5.95
Apr‘17 Jul‘17 Oct‘17 Jan‘18
Source: Tradingeconomics.com I Reserve Bank of India
Indiahasbeenundergoingrigorouspolicyreformsonvarious fronts-social, business and economic-overthepastfewyears.Duetothesustainedreformfocus,the country is being viewed more favourably by theglobal investmentcommunity;theWorldBankmovedIndia’srankingup30placesto100inits‘EaseofDoingBusiness’reportfor2018.
In addition to its strong macro-economic fundamentals and policy reforms, other indicators that make India one of themost attractive destinations for businessand investmentopportunitiesare itshugemanpowerbaseanddiversifiednaturalresources.
Most importantly, for India to progress further, itsphysical infrastructure-water and sanitation, power,transport, telecommunications, etc. must becomeefficient, reliable and affordable and it has becomeabundantly clear that the government has madeinfrastructure development as one of the key priorities.
SomeoftheproposalsrelatingtoinfrastructureintheUnionBudget2018-19.
• Investmentof` 5.97trilliontowardscreatingandupgradinginfrastructureinFY19
• Largest-everrailandroadbudgetof` 1.48trillionand ` 1.21trillion,respectively,inFY19

Annual Report 2017
Boa
rd’s
Rep
ort -
MD
& A
Fina
ncia
l Sta
tem
ents
Sta
tuto
ry R
epor
tsC
orpo
rate
Ove
rvie
w
65 204
8
6
4
2
0
2014-15 2017-18 2018-19E
` Tr
illio
n
1.81
4.945.97
Budget allocation for infrastructure
• Ambitious plans such as Sagarmala (estimatedinvestment of ` 8trillion)andBharatmala(estimatedinvestment of ` 10trillion) to improve its transportinfrastructure continue to receive focus
• Indiahasbeenconstructinghighwaysattherateof27-28kmsperday;aimtospeedupconstructionrateto41kmsperday
• Aim to connect 56 unserved airports and 31helipads
• UdeDeshKaAamNagrik(UDAN)schemeproposed;atleasthalftheseatsoneveryflighttohaveafarecap of ` 2,500perseatperhourofflying
• Introductionofseaplanesandpassenger-friendlytoll policy
• Toraiseresources,state-ownedfirmswillaccesstheequityandbondmarkets
• MonetisingvehicleslikeInfrastructureInvestmentTrust (InvIT) and Real Estate Investment Trust (ReITs)tobedeveloped
• NHAI to organise its road assets into SPVs anduse innovative monetising structures like TOT and InvITs
indian construction sectorAccording to a study titledConstruction in India-KeyTrendsandOpportunitiesto2020,India’sconstructionindustrywillcontinuetoexpandovertheperiod2016to2020,withinvestmentsinresidential,infrastructureandenergyprojectscontinuingtodrivegrowth.Thisriseinthedemandforconstructionserviceswillbedrivenbyindustrialisation,urbanisation,ariseindisposableincome and population growth in the country. Thestudy also mentioned that the government’s effortsto improve the country’s residential and transportinfrastructure would support growth. Some of thegovernment programmes that would be growth
drivers for the sectorwere theSmart CitiesMission,Housing for All, Atal Mission for Urban Rejuvenationand Transformation (AMRUT), Make in India andPowerforAll.Thestudyestimatedthattheindustry’soutput value is expected to riseat aCAGRof 5.65%,in real terms, over theperiod 2016 to 2020; thiswasconsiderablyhigherthantheCAGRof2.95%thatwaswitnessed during the immediately preceding periodbetween2011and2015.
Yet against this backdrop, India’s constructionindustrystillfacescertaintangiblechallenges.Theseinclude limited funding, slow policy reforms and a weakcurrency.
The Indian construction industry, according to the Planning Commission, comprises two broad segments-Real Estate construction andInfrastructure construction.
infraSTruCTure inDuSTry STruCTure In India, the infrastructure sector primarily includes thefollowing:
Category infrastructure Sub Sectors
1. Transport • Roadsandbridges• Ports• Shipyards• Inlandwaterways• Airport• Railwaytrack,tunnels,viaducts,
bridges,terminalinfrastructureincluding stations and adjoining commercial infrastructure
2. Energy • Electricitygeneration• Electricitytransmission• Electricitydistribution• OilPipelines• Oil/Gas/LiquefiedNaturalGas
(LNG)storagefacility• Gaspipelines
3. Water and Sanitation
• Solidwastemanagement• Watersupplypipelines• Watertreatmentplants• Sewagecollection,treatment
and disposal system• Irrigation(dams,channels,
embankments,etc.)• Stormwaterdrainagesystem• Slurrypipelines
4. Communication • Telecommunication(fixednetwork)
• Telecommunicationtowers• Telecommunication&Telecom
services
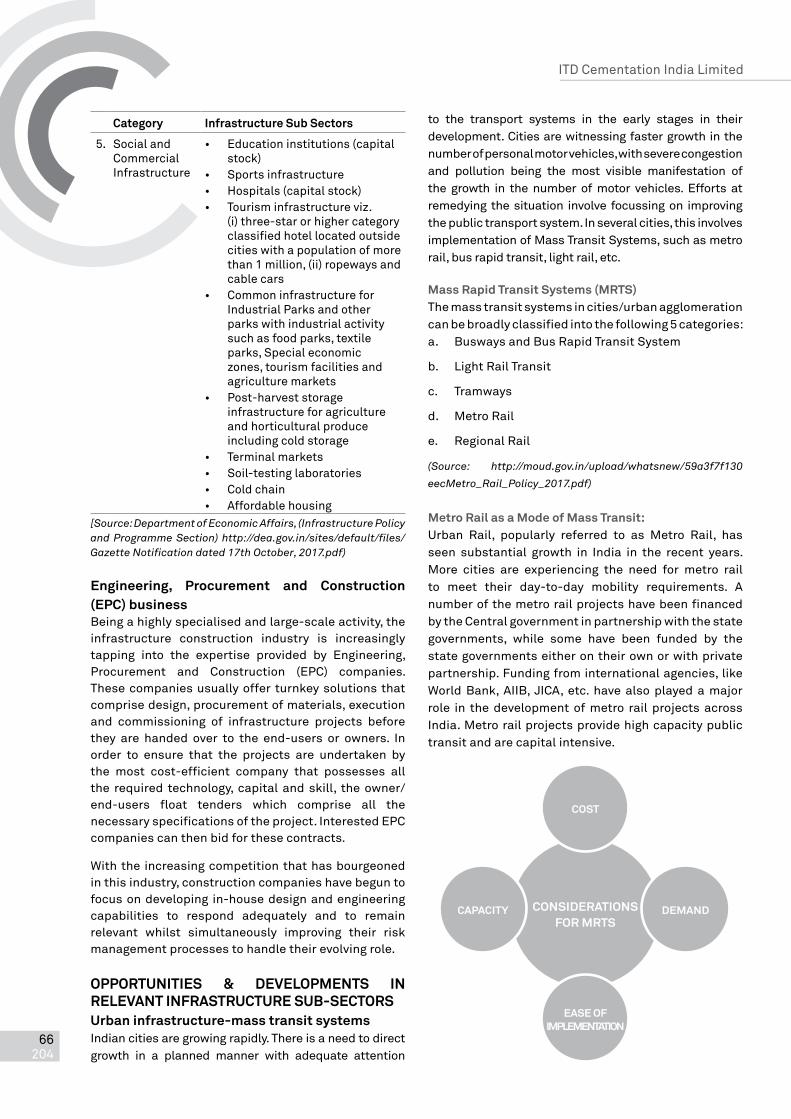
ITD Cementation India Limited
66 204
Category infrastructure Sub Sectors
5. SocialandCommercial Infrastructure
• Educationinstitutions(capitalstock)
• Sportsinfrastructure• Hospitals(capitalstock)• Tourisminfrastructureviz.
(i) three-star or higher category classifiedhotellocatedoutsidecitieswithapopulationofmorethan1million,(ii)ropewaysandcablecars
• CommoninfrastructureforIndustrial Parks and other parkswithindustrialactivitysuchasfoodparks,textileparks,Specialeconomiczones,tourismfacilitiesandagriculture markets
• Post-harveststorageinfrastructure for agriculture and horticultural produce including cold storage
• Terminalmarkets• Soil-testinglaboratories• Coldchain• Affordablehousing
[Source: Department of Economic Affairs, (Infrastructure Policy and Programme Section) http://dea.gov.in/sites/default/files/Gazette Notification dated 17th October, 2017.pdf)
engineering, procurement and Construction (epC) businessBeingahighlyspecialisedandlarge-scaleactivity,theinfrastructure construction industry is increasingly tapping into the expertise provided by Engineering,Procurement and Construction (EPC) companies. These companies usually offer turnkey solutions that comprisedesign,procurementofmaterials,executionand commissioning of infrastructure projects beforethey are handed over to the end-users or owners. Inorder to ensure that the projects are undertaken bythe most cost-efficient company that possesses allthe required technology, capitalandskill, theowner/end-users float tenders which comprise all thenecessaryspecificationsoftheproject.InterestedEPCcompaniescanthenbidforthesecontracts.
Withthe increasingcompetitionthathasbourgeonedinthisindustry,constructioncompanieshavebeguntofocus on developing in-house design and engineering capabilities to respond adequately and to remainrelevant whilst simultaneously improving their riskmanagement processes to handle their evolving role.
opporTuniTieS & DevelopmenTS in relevanT infraSTruCTure SuB-SeCTorSurban infrastructure-mass transit systemsIndiancitiesaregrowingrapidly.Thereisaneedtodirectgrowth in a planned manner with adequate attention
to the transport systems in the early stages in their development.Citiesarewitnessingfastergrowthinthenumberofpersonalmotorvehicles,withseverecongestionand pollution being the most visible manifestation ofthe growth in the number ofmotor vehicles. Efforts atremedying the situation involve focussing on improving thepublictransportsystem.Inseveralcities,thisinvolvesimplementationofMassTransitSystems,suchasmetrorail,busrapidtransit,lightrail,etc.
mass rapid Transit Systems (mrTS)Themasstransitsystemsincities/urbanagglomerationcanbebroadlyclassifiedintothefollowing5categories:a. BuswaysandBusRapidTransitSystem
b. LightRailTransit
c. Tramways
d. MetroRail
e. Regional Rail
(Source: http://moud.gov.in/upload/whatsnew/59a3f7f130
eecMetro_Rail_Policy_2017.pdf)
metro rail as a mode of mass Transit: Urban Rail, popularly referred to as Metro Rail, hasseen substantial growth in India in the recent years.More cities are experiencing the need for metro railto meet their day-to-day mobility requirements. AnumberofthemetrorailprojectshavebeenfinancedbytheCentralgovernmentinpartnershipwiththestategovernments, while some have been funded by thestategovernmentseitherontheirownorwithprivatepartnership.Fundingfrominternationalagencies,likeWorldBank,AIIB,JICA, etc. havealsoplayedamajorrole in the development of metro rail projects across India.Metrorailprojectsprovidehighcapacitypublictransit and are capital intensive.
ConSiDeraTionS for mrTS
CoST
eaSe of implemenTaTion
DemanDCapaCiTy

Annual Report 2017
Boa
rd’s
Rep
ort -
MD
& A
Fina
ncia
l Sta
tem
ents
Sta
tuto
ry R
epor
tsC
orpo
rate
Ove
rvie
w
67 204
MRTSformats
BusRapidTransitSystem(BRTS)
Typicalcapacity:10,000-15,000PPHPDonasinglelanebutcanbeenhancedwithadditionallanes
TypicalCapacity:60,000PPHPDandcangoupto80,000PPHPD
Light Rail Transit System(LRTS)
MetroRail
(Source: http://moud.gov.in/upload/whatsnew/59a3f7f130eecMetro_Rail_Policy_2017.pdf)
• Mayrequirealinearpathwaytobecarvedoutoftheexistingland
• Ifadditionalspacecannotbemadeavailableonthesideways,rail-basedsystemswillreducethespaceforothertraffic,dependingonthewidthofexistingroads
• LRTsandTramwayswithouthorizontalseparationwillhavereducedspeed and hence reduced capacity
• Rail-basedsystemsgenerallyproviderapidservice,ahigherqualityride and service regularity due to grade separation
Considering the rapid urbanisation and the imminentneed for enhancing mobility in cities, alternativesand innovative sources of funds are being exploredto supplement the budgetary resources. At the sametime, it is also important to ensure that proposals are prepared and appraised in a comprehensive manner to enhanceurbanmobilityaswellasthespeedandqualityofimplementationofmetroprojects.Itisinthiscontextthat the need for a policy onmetro rail has been feltnecessary to ensure that such systems are decided upon andimplementedinthemostsustainablemannerfromthe social, economic and environmental perspectives.
ModelsoffinancingmetrorailinIndia:
1 50:50JointVentureModel• DelhiMetroRailCorporation• OthermetroslikeMumbaiLine-3,Chennai,Bengaluru,Nagpur,Lucknow,KochiandAhmedabad
2 CompleteFundingbyCentralGovernment• FirstmetrointhecityofCalcutta(nowKolkata)bytheIndianRailways
• East-WestcorridorinKolkata(74%fundingbyMinistryofRailwaysand26%byMinistryofHousingandUrbanAffairs)
3 CompleteFundingbyStateGovernment• MetrorailinJaipur• MonorailinMumbai
4 PublicPrivatePartnership(PPP)• MumbaiMetroLine-1(ViabilityGapFunding(VGF)fromGoI)
• Hyderabadmetrorail(ViabilityGapFunding(VGF)fromGoI)
• RapidMetroinGurugram(Completefundingisbytheprivateconcessionaire)
5 InternationalAgencyFunding• JiCAfundingforChennaiMetroRail(Official
Development Assistance Loan)• MumbaiUrbanTransportProject-IIIjointlyfinancedbyAsianInfrastructureInvestmentBank(AIIB)andWorldBankin40:60ratio
• IFCwastheleadTransactionAdvisorfortheChennaiMetroRailProject
(Source: http://moud.gov.in/upload/whatsnew/59a3f7f130
eecMetro_Rail_Policy_2017.pdf)
ports / marineIndia’sCargoCapacitywasslatedtoincreaseto2,493.1MMTinFY17.TheMaritimeAgenda2010-20hasa2020targetof3,200MTofportcapacity.ByFY17,thecargo
advantages
Disadvantages

ITD Cementation India Limited
68 204
capacityatmajorportsgrewto1,065MMTfrom965.36MMTinFY16,indicatingayear-on-year(y-o-y)growthof10.32percent.
Indiahas12majorportsandover200non-majorportswith cargo traffic on the rise at both kinds of ports.In H1FY18, major ports in India have handled 326.4MillionTonnes (MMT) of cargo traffic. InFY17, the12majorports in Indiahandled647.43MMTofcargoascompared to 606.37 MMT in FY16, showing a y-o-ygrowthof6.77percent.
1000
500
0
FY16 FY17 FY18*
606.4647.4
326.4
Cargo Traffic at major ports (mmT)
(FY18*: Till September 2017)
600
400
200
0
FY16 FY17
465.9 485.2
Cargo Traffic at non-major ports (mmT)
(Source: http://ipa.nic.in/WriteReadData/Links/State-
wise%20traffic%20handled%20at%20portsea7965ce-8715-
4924-8b9a-f3fd6e9d7a1a.pdf)
national maritime agendaThe National Maritime Agenda 2010-20 is aimed atall-round development of the Indian maritime sector. Followingaresomeofthehighlightsoftheagenda:
• focus on increasing capacity: To create a port capacity of around 3,200 MT to handle theexpectedtrafficofabout2,500MTby2020
• Proposedinvestmentsinmajorportsby2020areexpectedtototalUSD18.6billion,whilethoseinnon-majorportswouldbeUSD28.5billion
• world-class infrastructure: To implement full mechanisation of cargo handling and movement at
ports,therebybringingIndianportsonparwiththebest internationalports in termsofperformanceand capacity
• Strategically building ports: To develop twomajor ports (one each on East and West coast) to promotetradeaswellastwohubports(oneeachontheWestcoastandtheEastcoast)–Mumbai(JNPT),Kochi,ChennaiandVisakhapatnam
notable trends in the port sector in india:increasing private participation: Strong growthpotential, favourable investment climate and sopsprovided by state governments have encourageddomestic and foreign private players to enter the Indian ports sector. In addition to the development of portsandterminals,theprivatesectorhasextensivelyparticipated in port logistics services.
Setting up of port-based SeZs: SEZs are beingdevelopedincloseproximitytoseveralports,therebyproviding strategic advantage to industries withinthesezones.Plantsbeingsetupinclude:
• Coal-based power plants to take advantage ofimported coal
• Steelplantsandedibleoilrefineries
Specialist terminal-based ports: Focus on terminalsthatdealwithaparticulartypeofcargo.ThisisusefulforhandlingspecificcargosuchasLNGthatrequiresspecific equipment and hence high capital costs.Formingspecialistterminalsforsuchcargoresultsinoptimal use of resources and increased efficiencies.Examplesofspecialistterminals: ICTTinCochin,LNGterminal in Dahej Port.
landlord port model: To promote private investments, the government has reformed the organisational model of seaports-
• From: A ‘service port’ model where the portauthority offers all the services
• To:A‘landlordport’modelwheretheportauthorityacts as a regulator and landlord while portoperationsarecarriedoutbyprivatecompanies
ports to operate on Green energy: GovernmentofIndiaaimstomakethecountrythefirstintheworldtooperateall12majordomesticgovernmentportsonrenewableenergy.Thegovernmentplanstoinstalalmost200MWwindandsolarpowergenerationcapacityby2019attheports.Theenergycapacitycouldberampedupto500MWinfutureyears.
(Source: https://www.ibef.org/download/Ports-October-2017.pdf)

Annual Report 2017
Boa
rd’s
Rep
ort -
MD
& A
Fina
ncia
l Sta
tem
ents
Sta
tuto
ry R
epor
tsC
orpo
rate
Ove
rvie
w
69 204
irrigationSustainabledevelopmentandefficientmanagementofwaterisanincreasinglycomplexchallengeinIndia.Theincreasingpopulation,growingurbanisationandrapidindustrialisation combined with the need for raisingagricultural production generates competing claims forwaterandgoodirrigationsystems.Additionally,asaresultofuncertainrainfallandagrowingsenseofanimpending water crisis in the country, irrigation hasbecomeessentialinIndia.
An amount of ` 638,866.52 lakhs was provided forMajorIrrigationprojectsand 67,762.20lakhsforMinorIrrigationprojectsintheBudgetfortheyear2016-17.
plan outlay for the irrigation and flood control
850,000.00
800,000.00
750,000.00
700,000.00
650,000.00
FY16 FY17
831,434.06
730,784.00
` in
lakh
s
(Source: http://www.apsdps.ap.gov.in/dp/downloads/Annual_
Plan_2016_17.pdf)
Irrigation Projects
MajorProjectsCultivableCommandArea(CCA)of
over10,000ha.
CCAoflessthan10,000ha.butmore than 2,000 ha.
CCA of 2,000 ha. or less
MediumProjects
MinorProjects
aviationThe aviation industry’s potential in India is massive.Indiaissettobecomethe3rdlargestaviationmarketby2020.
Thegovernmenthasbeenencouragingprivatesectorparticipation. The foreign equity cap of activities ofRegional Air Transport Service and Scheduled AirTransport Service/Domestic Scheduled PassengerAirline has been increased from 49% to 100%, with49%underautomaticroute,andbeyondthatthroughgovernmentapprovalroute.Further,theforeignequitycap on activities of Non-Scheduled Air TransportService,GroundHandlingServiceshasbeenincreasedfrom74%to100%undertheautomaticroute.
passenger Traffic at indian airports
500
400
300
200
100
0
FY16 FY20(E)
265
421
Million
investments in the airport sector in the 12th five year plan (e) (uSD Billion)
Private Investment
PublicInvestment
2.1
9.3
airport traffic
UnderPPPmodel
ManagedbyAAI
60%
40%

ITD Cementation India Limited
70 204
Some Trends in aviationrising private participation: Currently,five internationalairports have been completed successfully under PPPmode. Investment made by private sector during the12thFiveYearPlan (2012-17) isexpectedto increaseby69.1percenttoUSD9.3billionoverthatduringthe11thFiveYearPlan.FourexistingairportsandtwoGreenfieldprojectswillbeofferedonPPPbasiswhichisexpectedtoattract investments from private players.
Greater use of non-scheduled airlines: Rising businessactivity has led to higher demand for non-scheduled airlines.AsofJuly2017,therewere112operators(NSOP).
focus on non-aeronautical revenue: Indian airports areemulatingtheSEZ-aerotropolismodeltoenhancerevenues; the focus will be on revenues from retail,advertising, vehicle parking, etc.
policy initiativesGreater focus on infrastructure: The Indian government is planning to investUSD1.83billion forthe development of airport infrastructure along withaviationnavigationservicesby2026.
liberalisation, open sky policy: With the opening of the airportsectortoprivateparticipation,sixairportsacrossmajorcitiesarebeingdevelopedunderthePPPmodel.
Taxes and duties: 100% tax exemption for airportprojectsforaperiodof10yearsisgiven.IndianaircraftManufacture, Repair and Overhaul (MRO) serviceprovidersareexemptedcompletelyfromcustomsandcountervailing duties.
(Source: https://www.ibef.org/download/Aviation-
October-20171.pdf)
road TransportRoad transport is a critical infrastructure for the economicdevelopmentofacountry. It influencesthepace, structure and pattern of development
India’sroadnetworkconsistof5.21millionkilometresof national highways, expressways, state highways,major district roads, other district roads and village roadswiththefollowingdistribution
indian roads• Secondlargestroadnetworkintheworld• 5.21 million kilometres (km) consisting of
nationalhighways,expressways• Transportsover64.5%oftotalgoods• Transports90%oftotalpassengertraffic• National highways comprise only 1.9% of
networkbutcarry40%oftraffic
NationalHighways/Expressways 103,933kms
StateHighways 161,487kms
Other Roads 5,207,044kms
Thefollowingtablestatesthedistributionofnationalhighwaysintermsofwidth:
Singlelane/Intermediatelane 19,330kms
Doublelane 40,658kms
Fourlane/sixlane/eightlane 19,128kms
TheMinistryofRoadTransportandHighwayshasbeenentrustedwiththeresponsibilityforconstructionandmaintenance of national highways. All roads otherthan national highways in the states fall within thejurisdiction of respective state governments.
(Source: https://www.ibef.org/download/Roads-October-2017.pdf)
Governmentinitiativetodevelop83,677kmsofroadsby2022
Towards improving transport infrastructure, boostingeconomic activity and creating employment, the government has proposed a plan for construction of roadsandhighwaysacrossthecountry,including:
• 34,800kmsofhighwaysundertheBharatmalascheme
• 9,000kmsofeconomiccorridors
• 6,000kmsofinter-corridorandfeederroutes
• 2,000kmsofborderandinternationalconnectivityroutes
• 5,000kmstobeupgradedunderthenationalcorridorefficiencyprogramme
• 800kmsofgreenfieldexpressways
• 10,000kmsunderthenationalhighwaydevelopmentprogramme
• 2,000kmsofcoastalandportconnectivityroads
rail Transport The Indian Railways has delivered robust revenueovertheyears.Duringthefinancialyears2007-17,therevenuehadincreasedataCAGRof9.8%.
indian railways • Fourthlargestrailnetworkintheworld• 12,617passengertrainscarryingover23million
passengers daily• 1,107.1milliontonnesoffreightwastransported
viatrainsinFY17• UptoAugust2017,freighttrafficstoodat466.82
million tonnes

Annual Report 2017
Boa
rd’s
Rep
ort -
MD
& A
Fina
ncia
l Sta
tem
ents
Sta
tuto
ry R
epor
tsC
orpo
rate
Ove
rvie
w
71 204
indian railways revenue
50
40
30
20
10
0
FY17 FY20(E)
25.62
44.50
USDBillion
Overall,revenuesareexpectedtoexpandataCAGRof12.12percentduringFY07-20.
TheIndianRailwayshasattractedincreasingforeigninvestmentthroughstrategicallianceswithvariouscountriesoverthelastfewyears.
Gross revenue trends over the years (uSD billion)
504540353025201510
50
FY07
FY08
FY09
FY10
FY11
FY12
FY13
FY14
FY15
FY16
FY17
FY20
E
10.0611.4412.6713.8516.49
19.5822.2325.42
15.01
24.99
44.50CAGR12.12%
25.62
notable Trends in the railways Sector Demand for urban transport: There is a rapid increase indemandforurbanmasstransportationsystemsinthecountry. Several metro rail projects are in progress toimprove connectivity within cities; the Delhi Metro hasemerged as an internationally-acclaimed venture.
international investment: IndianRailwayshasattractedincreasing foreign investments through strategic alliances with various countries over the last few years. IndianRailways received foreign investments worth ` 42,000 crore (USD6.59billion) inMay 2016 over two contractswithoneEuropeanandoneAmericancompany.6majorglobal players have shown keen interest in developingultra-high-speed trains in India.
High speed rails: In coordination with the Japanesegovernment, a high speed passenger train corridor, betweenAhmedabadandMumbaiisbeingundertaken.AspartoftheRailwayBudget2016-17,thegovernmentlaunchedanewtrain“MahamanaExpress”connectingVaranasi andDelhi and is considering increasing the
averagespeedoffreighttrainsto50km/handmailorexpresstrainsto80km/hbytheendof2020.InApril2017,thegovernmentannouncedintentionstodevelop180KmsDelhi-Rewari-AlwarRegionalRapidTransportSystemwithaninvestmentofaroundUSD5.5billion.The project would enable passengers to travel fromDelhitoAlwarinjust104mins.
modernisation/Technology:InOctober2017,theIndianRailways decided to modernise 20 train stations byinstalling infrastructure and passenger facilities. Indian Railways is planning to launch an integrated mobileapplication for availing all travel-related services such as hiring taxis, pre-ordering a meal, requestingfor porter services, lodging at a retiring room, etc. Indian Railways is also considering introduction oflightweight aluminium coaches in the rail networkto reduce the travelling time between metropolis by2018.ManufacturingofModernLinkeHofmannBuschcoaches has started in 2017 in India. These coachesareequippedwithmoderntechnologyandcanpreventcapsising during derailment.
expanding Scope of public private partnership: In December2012,theCabinetapprovedthenewpolicyof ‘participative models for rail-connectivity and capacityaugmentedprojects’.Thepolicyaddressedtheissuesofownershipoftherailwaylineandrepaymentof investment.Since the launchof thepolicy, railwayauthorities have received various proposals from private investors and have already given approval (can nowacquirelandandbeginconstruction)forfourportconnectivity projects, to ease congestion.
(Source: https://www.ibef.org/download/Railways_-_
October-2017.pdf)
power SectorPowergenerationinIndiahasgrownrapidlyovertheyears.While electricity production stood at 1,160.1 BU in FY17,it witnessed a growth of around 4.72% over the previousfiscal year. Over FY10- FY17, electricity production grewataCAGRof7.03%.The12thFiveYearPlanprojects thattotaldomesticenergyproductionwould reach844milliontonnesofoilequivalent(MTOE)by2021-22.Atotalof13,872villages out of 18,452 un-electrified villages in India havebeenelectrifieduptoJune30,2017aspartofthetargettoelectrifyallvillagesbyMay1,2018.
india’s power Sector• Thirdlargestproducerofelectricityintheworld• Fourth largest consumer of electricity in the
world• Fifthlargestinstalledcapacityintheworld• Installed power capacity at 330.86 GW in
November2017

ITD Cementation India Limited
72 204
PowerisoneofthekeysectorsattractingFDIinflowsintoIndia.FromApril2000toJune2017,IndiarecordedFDI of USD 5.85 billion in non-conventional energysector. New and renewable energy sector witnessedmaximum power generation capacity addition, since2000.Powersectoraccountedfor3.44percentoftotalFDIinflowstillMarch2017.CumulativeFDIinflowsintothe power sector from April 2000 to June 2017wereUSD11.77billion.
An increase in industrial activity coupled withincreasing penetration, per capita consumption and agrowingmiddleclassandconsumerbasehasledtoa growth indemand for power.This growthhasbeensupportedbyvariousgovernmentpolicies.
Hydroelectric powerHydropower is a renewable, economic and non-pollutingsourceofenergy.Hydropowerstationshavethe inherent ability of quick starting, stopping andload variations. These advantages offer operational flexibilityandhelpinimprovingthereliabilityofpowersupply. The generation cost is not only inflation-freebutreduceswithtime.Inadditiontoconservingscarcefossil fuels, hydroelectric projects have a long useful life,extendingtoover50years.Theyalsohelpinopeningavenues for development of remote and backwardareas.Indiahasanestimatedhydropotentialofabout176,990MW,outofwhichonly21.5%thatis38,160MWis commissioned.
(Source: http://www.eai.in/ref/ae/hyd/hyd.html)
industrial Civil worksIndustrialcivilworkslargelyconsistofplant,building,chimneys, silos, conveyers, furnace and administrator buildings which form an integral part of themanufacturing capacities.
The last fewyearshavebeenoneof the toughest forthe Indian manufacturing sector. The slowdown wasvisiblethroughdramaticfallinthecumulativegrowthrateofeightcoreindustriesandofIndexofIndustrialProduction (IIP) over the last three years. The IIP registered a growth of 3.8% in September 2017, overtheIndexofSeptember2016.Thegrowthfor IndexofManufacturing,MiningandElectricitywas3.4%,7.9%and3.4%respectively,duringSeptember2017.
(Source: http://www.eaindustry.nic.in/iip/IIP_Highlights.pdf)
ouTlooKInfrastructure is a key enabler of growth in India;estimates suggest that every rupee invested in infrastructure development has a ripple effect and helps the GDP grow by ~2. According to S&PGlobal Rankings (August 2016), the country’s poorinfrastructure is the biggest hurdle to government’sflagship Make in India programme. Yet despite allthe policies and promotion by the government andthe initiatives undertaken by the private sector, theinfrastructuredeficitcontinuestobecolossal.Apaper
installed capacity for different sources of power - fy 18* (Gw)
250
200
150
100
50
0
Thermal Hydro Renewables Nuclear
220.58
44.61
58.30
6.78
Notes: GW-Gigawatt; FY18*-Data up to June 2017Source: Ministry of Coal, NHPC, Central Electricity Authority (CEA), Corporate Catalyst India
ThefollowingtablestatestheallIndiainstalledcapacity(inMW)ofpowerstationsasonNovember30,2017:
ownership Thermal nuclear Hydro reS (mnre)
Total
Coal Gas Diesel Total
State 63,780.50 7,078.95 363.93 71,223.38 0.00 29,858.00 1,976.90 103,058.27
Private 74,496.00 10,580.60 473.70 85,550.30 0.00 3,394.00 58,180.76 147,125.06
Central 54,695.00 7,490.83 0.00 62,185.83 6,780.00 11,711.42 0.00 80,677.25
Total 192,971.50 25,150.38 837.63 218,959.51 6,780.00 44,963.42 60,157.66 330,860.58
(Source: http://www.cea.nic.in/reports/monthly/installedcapacity/2017/installed_capacity-11.pdf)

Annual Report 2017
Boa
rd’s
Rep
ort -
MD
& A
Fina
ncia
l Sta
tem
ents
Sta
tuto
ry R
epor
tsC
orpo
rate
Ove
rvie
w
73 204
presented at the India Infra Summit2017quoted,“Indianeedsabout$1.5trillioninvestmentintheinfrastructuresectorinthecoming10years.ThefigureisroughlyequaltothenominalGDPofthesecondlargestcountry intheworldintermsoflandmass–Canada.”
Yet it is this very disadvantage that poses an immenseopportunity tovariousstakeholders.Dueto India’s fast-paced growth and its consistent role as a forerunneramong emerging markets, it has become an attractivedestination for global investment. At the same time,it gives the government and the EPC community the opportunity to provide environment-friendly, state-of-the-artinfrastructurethatmeetstheuniquelocalneedsof the end users.
Against this backdrop, the Company is advantageouslyplaced to harness this opportunity. With its pedigree parentage and the expertise that it has developed overtheyears,whileexecutingvariouscomplexandintricateprojects, the Company maintains its focus on project selection for bidding after due evaluation of risks,profitabilityandprojectcashflow.
Onceagain,ithasbeenabletobuildastronganddiverseorder bookworth ` 751,320 lakhs as on 31st December,2017.TheCompanylooksforwardtohoningitscapabilitiesin the future,anddeliverprojectexecutions thatprovideimmense utility to end-users, pride to its people and economic gains to its shareholders.
riSKS anD ConCernSexternal risks• Business environment risk: Economic cycles,
changes in government policies and spending and the development of the infrastructure sector directly impact the demand for the Company’sservices. Any change in policies or downturn inthe economy which result in lower spending onconstruction projects (including privately-funded infrastructure projects) could affect revenues.
Mitigation: Infrastructure is the core of any government’s agenda due to the stage ofdevelopment at which India currently is. Theremaybesomeshiftinallocationsbetweensectors,depending on the priority of the government. The Companyhascapabilitiestoserviceawiderangeof infrastructure activities and, as a result, is abletoshiftitsresourcesfromoneinfrastructuresub-sector toanother,dependingontheexistingprospects. This gives the Company an inherent hedge against this risk.
• price escalation risk: Multi-year infrastructureprojects are subject to the possibility of price
escalation, in the event of design changes, increasingcostofmaterials,machineryandlabour,aswellasclientdelays.Thiscanpotentiallycausetimeandcostoverruns,impactingprofitability.
Mitigation: The Company utilises the contract escalation provisions and also provides for costs in contracts to protect it from volatile externalconditions. The Company also has the potential for contractual remedy. Further, the Company’sstrong parentage and seamless access to appropriate technology andequipment, helps itto engage in value engineering as a partial hedge against rising costs.
• Competition risk: Infrastructure project are usuallysubjecttobidding.Pricecompetitivenessdetermines the allocation of projects. If the Companyisunabletobidfor,andwinconstructionprojects, it could fail to increase or maintain its orderbook.
Mitigation: The Company is present in multiple sectorswithintheinfrastructureindustry,helpingmitigate concentration risks arising out of an excessivedependenceonafewareas.Further,theCompany enters into joint ventureswith playersfor large and complex projects. The Company’spromoter group enjoys an international reputation in handling complex challenging projects andthisprovidestheCompanywithacrediblebrandwith strong project execution skills, therebycontinuouslyworkingoncostefficiency.
• Qualification risk: Bidding for governmenttenders can take long and complexqualificationrequirements.
Mitigation: The Company has the backing ofparent company with robust and renownedcapabilities. It also enters into joint venturesand consortium partnerships if a project calls for additionalcapabilities.TheCompanypre-qualifiesfor large government and private projects across many industries. All these stratagem allowsthe Company to enhance its civil engineering competenceandbidforprojects,withreasonablecompetitive environment.
internal risks• operational risk: Any operational inefficiency,
internal failures, lack of adequate regulatoryapprovalsandseveralhazards(riskofequipmentfailureandworkaccidentsthatmaycauseinjuryand loss of life) could result in sub-optimaloperation levels.

ITD Cementation India Limited
74 204
Mitigation: Topre-emptprojecthazards,theCompanyengages in careful project screening and evaluation. The Company has also made arrangements for appropriate insurance coverage or provisions of assessed costs that enable it to complywith suchobligations.Most importantly, the keypersonnel ofthe Company and professional project managers have adequate industry experience. The Companyhasaccesstosuperiorequipmentandtechnologies,due to its internationally-acclaimed parent Company. All this facilitates in reduction in operational risks. TheCompanyoperatesthroughQualityManagementSystems (QMS) to participate in governmentprojectsbackedbyappropriate/requisiteregulatoryapprovals, ensuring uninterrupted execution andsecuredcashflows.
• Delay in receipt of outstanding receivables: There aretimeswhenEPCcompaniesexperiencedelaysin the collection of receivables from clients forvarious reasons.This upsets theworking capitalschedules, especially in the event that claims cannotberecoveredforlongperiodsoftime.
Mitigation: The Company chooses its partners very carefully, ensuring they have sound credibility androbust track record and funding arrangementsthrough domestic/international agencies in projectexecution and payment. In the event of paymentdelays, the Company has access to short-term borrowingstotideoveritsworkingcapitalneeds.
• Design risks: The Company is involved in large projects,wherechangeorinadequaciesindesign,construction or systems failures can result in injury or damage to third parties. The Company could face claims for damages if a project suffers fromdefectsinthequalityofdesign,engineeringor construction.
Mitigation: The Company engages reputed consulting organisation for design of EPC Project. This, in addition to, in-house Technical Team ensures the mitigation process. The Company also takes insuranceinaccordancewithindustrystandards.
• equipment failure: There could be breakdowns inequipment.Thiscouldimpacttheprojectintermsoftime and cost overruns if not attended to promptly.
Mitigation: The Company regularly conducts maintenanceoperationsonitsequipmenttominimisethe scope for any equipment failure. The Companyhasalargeequipmentbasewhichcanbedeployedatdifferentsites.Inaddition,ithasbuiltuplastingandloyalrelationswithreputedvendorswhocouldmakeavailablesuitableequipment,incasenecessary.
inTernal ConTrol SySTemS anD THeir aDeQuaCyThe Company has implemented internal control systems that are commensurate with its size andthe nature of its business. Following processesdocumentedinamanual,theCompanycomplieswithwell-definedsystemsandoperatingprocedures(SOP).Delegationof authority is prudently exercisedacrossvariousmanageriallevelsbasedonthemanual.
Toensureconstantvigilanceintheareasofadequacyofinternal systems and improvements, an internal audit cell conducts audits around the year. These internal audit reports and adequacy of internal controls areregularlyreviewedbytheBoard’sAuditCommittee.
review of finanCial performanCeDespite the difficult economic and operationalenvironment prevailing in the economy and stresses and pressuresthattheconstructionindustryhasbeenfacedwith, theCompany, througha selectivebiddingstrategythatwasadoptedandemphasisonexecution,wasabletobuildastronganddiversifiedorderbookwhichstandsat` 751,320lakhsason31stDecember,2017.
Onastandalonebasis,theCompanyachievedrevenuefrom operations of ` 187,292.02 lakhs in 2017, adecreaseof35.80%overtherevenuesof`291,735.11lakhs reported in the last year, due to completion of somelargecontractsinthebeginningoftheyearanddelays in securing orders, resulting in delays in the executionofwork.
TheCompanymadeaprofitbeforeexceptional itemsandtaxof` 14,619.53lakhsin2017,incomparisontoprofit before exceptional items and tax of` 9,896.92lakhsachievedin2016,markinganincreaseof47.72%.
TheCompanymadeaprofitbeforetaxof` 12,435.59lakhs in 2017, in comparison to profit before tax of `9,896.92lakhsachievedin2016.

Annual Report 2017
Boa
rd’s
Rep
ort -
MD
& A
Fina
ncia
l Sta
tem
ents
Sta
tuto
ry R
epor
tsC
orpo
rate
Ove
rvie
w
75 204
Onaconsolidatedbasis,therevenuefromoperationsstood at ` 206,050.89 lakhs during the year 2017,against a revenue of ` 293,772.01 lakhs achieved in2016.
Theconsolidatedprofitbeforeexceptional itemsandtax was ` 14,758.08 lakhs in 2017, in comparison toprofitbeforeexceptional itemsand taxof` 9,908.29lakhsin2016.
The consolidated profit before tax was ` 12,574.14lakhs in 2017, in comparison to profit before tax of ` 9,908.29lakhsin2016,whichtranslatesintoagrowthof26.91%.
The Company’s consolidated order book as at 31st December, 2017 stood at ` 751,320 lakhs,representingagrowthof14.12%overtheorderbookof ` 658,346 lakhsasat31stDecember, 2016.Thisprovidesgoodvisibilityforthebusinessforthenext2-3 years.
Human resources Development and industrial relationsTheCompanypridesitselfinitsabilitytoretaintalentby empowering its people and equipping them withwell-tested systems and processes that facilitatedecision-making.
Taking the issue of safety very seriously, the Company offers its people a safe and environment-friendly workplace and constantly strives tomake its construction sites injury-free through safety supervision and audits and a grassroot feedbackmechanism.
Ason31stDecember,2017,therewere2,010employeesontheCompany’ssteadyrosterand3,138employeesengagedonaproject-to-projectbasis.
DiSCloSure of aCCounTinG TreaTmenTThe financial statements have been prepared inaccordancewithallapplicableaccountingstandards.

ITD Cementation India Limited
76 204
Report on Corporate Governance 1. Company’s philosophy on Code of GovernanCe Your Company believes that good corporate governance is an important constituent in enhancing stakeholder
value. The corporate governance framework oversees business strategies and ensures fiscal accountability, ethical corporate behaviour and fairness to all stakeholders comprising regulators, employees, customers, vendors, investors and the society at large. The Company’s corporate governance structure plays a pivotal role in realising this long term goal.
Your Company has in place processes and systems whereby the Company complies with the requirements of Corporate Governance under the Securities and Exchange Board of India (Listing Obligations and Disclosure Requirements) Regulations, 2015 (Listing Regulations, 2015). Your Company is committed in its responsibility towards the community and environment in which it operates, towards its employees and business partners and towards society in general.
2. Board of direCtors (i) Composition The Board has an optimum combination of Executive and Non-Executive Directors. The composition of
the Board is in conformity with Regulation 17 of the Listing Regulations, 2015. As on date the Company has eight (8) Directors with a Non- Executive Chairman. Of the eight (8) Directors, seven (7) are Non- Executive Directors of which four (4) are Independent Directors.
(ii) the names and categories of the directors on the Board, their attendance at Board meetings and at the annual General meeting held during the year and the number of directorships and Committee Chairmanships/ memberships held by them in other companies are given below: name of the director
Category no. of Board meetings held during
the year 2017
last aGm attended
no. of directorships held in other indian public
limited companies including as an
alternate director
total no. of memberships/ Chairmanships
of Committees of directors held in
other indian public limited companies
held attended
Mr. Premchai Karnasuta (Chairman)
Non- Independent, Non- Executive
9 2 Yes Nil Nil
Mr. Pathai Chakornbundit(Vice Chairman)
Non- Independent, Non– Executive
9 6 Yes Nil Nil
Mr. D. E. Udwadia Independent, Non– Executive
9 9 Yes 6 7 (includes 1
Chairmanship)
Mr. Per Hofvander Independent, Non– Executive
9 5 Yes Nil Nil
Mr. D. P. Roy Independent, Non– Executive
9 9 Yes 2 2
Mrs. Ramola Mahajani
Independent, Non– Executive
9 9 Yes 3 3
Mr. Piyachai Karnasuta
Non- Independent, Non– Executive
9 5 Yes Nil Nil
Mr. Adun Saraban(Managing Director)
Executive 9 9 Yes 1 Nil
anneXUre 9

Annual Report 2017
Boa
rd’s
Rep
ort -
CG
Rep
ort
Fina
ncia
l Sta
tem
ents
Sta
tuto
ry R
epor
tsC
orpo
rate
Ove
rvie
w
77 204
(iii) number of Board meetings held, dates on which held
Nine (9) meetings of the Board were held during the financial year ended 31st December, 2017. The dates on which the meetings were held are 27th January, 21st February, 10th April, 11th May, 3rd July, 9th August, 21st September, 12th October, 8th November and 10th November, 2017 (adjourned meeting of 8th November, 2017).
(iv) during the year, information as required by regulation 17(7) read with part a of schedule ii of the listing regulations, 2015, was placed before the Board.
(v) There are no relationships between Directors inter-se.
(vi) Non-Executive Directors do not hold any shares in the paid-up share capital of the Company.
(vii) Familiarisation Programme imparted to the Independent Directors is disclosed on the Company’s website: www.itdcem.co.in
3. aUdit Committee Audit Committee of the Directors was constituted
by the Company in March 1994. The terms of reference of the Audit Committee were last amended on 6th August, 2014.
(i) Composition, number of meetings held and attendance of directors thereat
The Audit Committee comprises four (4) Non-Executive Directors of which three (3), namely Mr Per Hofvander, Mr D. E. Udwadia and Mr D. P. Roy are Independent Directors. During the financial year ended 31st December, 2017 the Audit Committee held Six (6) meetings on 21st February, 10th April, 11th May, 15th June, 9th August, and 8th November, 2017. Attendance of the Directors was as under:
name of the director
no. of meetings held
no. of meetings attended
Mr. Per Hofvander 6 4
Mr. D.E. Udwadia 6 6
Mr. Pathai Chakornbundit
6 5
Mr. D. P. Roy 6 6
Mr Per Hofvander, the Chairman of Audit Committee, was present at the last Annual General Meeting held on 11th May, 2017.
Mr Rahul Neogi, who was appointed as the Company Secretary w.e.f. 1st February, 2017, attended all the meetings of the Audit Committee held during the financial year 2017.
(ii) terms of reference, role and scope of the audit Committee are in line with regulation 18(3) read with part C of schedule ii of the listing regulations, 2015. the Company has also complied with the provisions of section 177 of the Companies act, 2013 (the ‘act’) and rules framed thereunder pertaining to the audit Committee and its functioning.
Minutes of the Audit Committee meetings are placed before the meeting of the Board of Directors immediately following the Audit Committee meeting.
4. nomination and remUneration Committee
The erstwhile Remuneration Committee of Directors was renamed as the Nomination and Remuneration Committee (NRC) on 8th May, 2014.
Terms of reference of the NRC were last amended on 24th February, 2016.
(i) Composition, number of meetings held and attandance of directors thereat
The NRC comprises four (4) Non-Executive Directors namely Mr D.E. Udwadia, Mr Premchai Karnasuta, Mr Pathai Chakornbundit and Mr Per Hofvander. Mr D.E. Udwadia and Mr Per Hofvander are the Independent Directors of the Committee. The Committee held four (4) meetings during the financial year ended 31st December, 2017 on 27th January, 21st February, 11th May, and 8th November, 2017. Attendance of the Directors was as under:
name of the director
no. of meetings held
no. of meetings attended
Mr. D.E. Udwadia 4 4
Mr. Premchai Karnasuta
4 1
Mr. Pathai Chakornbundit
4 4
Mr. Per Hofvander 4 3
Mr. D.E. Udwadia, the Chairman of NRC was present at the last Annual General Meeting held on 11th May, 2017.
ITD Cementation India Limited
78 204
Mr. R.C. Daga, Company Secretary attended NRC meeting held on 27th January, 2017 before his retirement on 31st January, 2017.
Mr Rahul Neogi, who was appointed as the Company Secretary w.e.f. 1st February, 2017, attended the rest of the meetings of the NRC held during the financial year 2017.
(ii) Terms of reference of the NRC are in line with Regulation 19(4) read with Part D of Schedule II of the Listing Regulations, 2015. The Company has complied with the provisions of Section 178 of the Companies Act, 2013 and the Rules framed thereunder pertaining to NRC and its functioning.
Minutes of the NRC meetings are placed before the meeting of the Board of Directors immediately following the NRC meeting.
(iii) During the year, NRC evaluated performance of every Director, Chairperson and Board as a whole based on their roles, functions and duties and their contribution to the Board/Committees of the Board.
Further, two meetings of the Independent Directors of the Company were held on 21st February and 8th November, 2017. The performance evaluation of the Chairman and Non – Independent Directors was carried out by them.
The Board of Directors evaluated performance of the Independent Directors based on the time spent, input and guidance given from time to time by the Independent Directors to the Board and Management of the Company.
5. remUneration of direCtors a) None of the Non-Executive Directors had any
pecuniary relationship or transaction with the Company other than the sitting fees and commission received by the Non-Executive Directors resident in India.
b) Criteria for making payments to non-executive directors
Non-Executive Directors resident in India are paid remuneration by way of sitting fees for attending the meetings of the Board and Committees thereof. In addition to sitting fees, they are also entitled to commission not exceeding in the aggregate 1% of the net profits of the Company computed in the manner laid down in Section 198 of the Act, subject to a maximum of 500,000/- (Rupees Five Lakhs only) per annum to each such Director. The Members of the Company at their Annual General Meeting held on 12th May, 2016, approved payment of commission only to resident non-executive directors for each of the five financial years of the Company commencing on and from 1st January, 2016, based on the number of Board / Committee Meetings attended by them and input given at the meetings.
During the financial year 1st January, 2017 to 31st December, 2017, the Company paid ` 1,301,100/- to M/s Udwadia & Co., Solicitors & Advocates, Mumbai, of which Mr D. E. Udwadia, Independent Director is the Proprietor, by way of fees for professional services rendered to the Company on specific legal matters that were entrusted by the Company from time to time. The Board does not consider the above association with the Company to be of a material nature so as to affect or impair the independence and objectivity of judgement of Mr D. E. Udwadia as an Independent Director of the Company.
c) disclosure with respect to remuneration Executive Director is paid remuneration by
way of salary, commission, perquisites and retirement benefits as recommended by the NRC and approved by the Board and shareholders of the Company.
Notice period is six months and no severance pay is payable on termination of appointment.
The Company does not have any Stock Option Scheme.

Annual Report 2017
Boa
rd’s
Rep
ort -
CG
Rep
ort
Fina
ncia
l Sta
tem
ents
Sta
tuto
ry R
epor
tsC
orpo
rate
Ove
rvie
w
79 204
details of remuneration payable to executive and non - executive directors of the Company for the financial year ended 31st december, 2017 are given below:
sl.no.
name of the director
service Contract
years/ months
salary Commission perquisites and cost of providing
furnished residential accommodation
retirement Benefits(pf and
Gratuity)*
total sitting
fees
` ` ` ` `
(a) Executive Director
1. Mr. Adun Saraban, Managing Director
3 years 01.01.2016
to 31.12.2018
9,855,000 1,750,000 2,132,360 1,182,600 NIL
* As the future liability for gratuity and leave encashment is provided on an actuarial basis for the Company as a whole,
the amount pertaining to the director is not ascertainable and therefore, not included above.
(b) Non-Executive Directors
1. Mr. D.E.Udwadia
- NIL 500,000 NIL NIL 510,000
2. Mr. D. P. Roy - NIL 500,000 NIL NIL 360,000
3. Mrs. Ramola Mahajani
- NIL 500,000 NIL NIL 230,000
Total 9,855,000 3,250,000 2,132,360 1,182,600 1,100,000 Note: Sitting fees are paid only to the Non- Executive Directors resident in India for attending meetings of the Board and the
Committees of the Board.
6a. stakeholders relationship Committee The erstwhile Shareholders/Investors’ Grievance
Committee was renamed as Stakeholders Relationship Committee (SRC) on 8th May, 2014.
Terms of reference of the SRC were adopted on 6th August, 2014 and are in line with Regulation 13(3) of the Listing Regulations, 2015.
(i) Composition, number of meetings held and attendance of directors thereat
The SRC comprises two (2) Non-Independent Directors viz. Mr. Adun Saraban- Managing Director and Mr. Pathai Chakornbundit, Non-Executive Director. The Committee held four (4) meetings during the financial year ended 31st December, 2017 on 21st February, 11th May, 9th August and 8th November, 2017. Attendance of the Directors was as under:
name of the director
no. of meetings held
no. of meetings attended
Mr. Pathai Chakornbundit
4 4
Mr. Adun Saraban
4 4
Mr. Pathai Chakornbundit is the Chairman of SRC.
Mr. Rahul Neogi, Company Secretary, attended all the meetings of the SRC held during the year 2017.
(ii) Brief description of terms of reference SRC considers and resolves the grievances,
if any, of all the security holders of the Company.
Minutes of the SRC meetings are placed before the meeting of the Board of Directors immediately following the SRC meeting.
(iii) number of shareholders’ complaints received and resolved to the satisfaction of the shareholders
During the financial year ended 31st December, 2017, Seventy Seven (77) complaint letters were received from the shareholders which were replied / resolved to the satisfaction of the shareholders. No complaints remained unresolved at the end of the year.
(iv) name and designation of Compliance officer
Mr. Rahul Neogi is the Company Secretary and Compliance Officer with effect from 1st February, 2017.
Mr. R.C.Daga who retired from the services of the Company was the Company Secretary and Compliance Officer till 31st January, 2017.
ITD Cementation India Limited
80 204
6B. share transfer Committee Share Transfer Committee was constituted in
1980. The terms of reference of Share Transfer Committee were last amended on 11th January, 2010. During the financial year ended 31st December, 2017, the Committee had twenty eight (28) meetings.
Pursuant to Regulation 40 (2) of the Listing Regulations, 2015, Share Transfer Committee Meetings are regularly held at least once a fortnight.
(i) terms of reference (a) The Committee is authorised to approve
share transfers and transmissions, change and transposition of names, demat / remat of shares, rectification of entries, renewal/split/consolidation of share certificates and issue of duplicate share certificates and also to issue share certificates in respect thereof under the Common Seal of the Company.
(b) Quorum for a meeting shall be any two members present, except that the quorum
for the purpose of authorising issue of duplicate certificates shall be any three (3) members present at the meeting.
(ii) number of pending share transfers As on 31st December, 2017, there was no pending
request/letter involving transfer/transmission of shares.
(iii) Pursuant to Regulation 36 (3) of the Listing Regulations, 2015, the particulars of Directors who are proposed to be appointed/re-appointed at the 40th Annual General Meeting (‘AGM’) have been provided in the annexure to the Notice of the AGM.
7. sUBsidiary Company As on 31st December, 2017, the Company has
one wholly owned, non-material and unlisted subsidiary, namely ITD Cementation Projects India Limited. The Financial Statements of the subsidiary are reviewed by the Audit Committee. All minutes of the meetings of the subsidiary are placed before the Company’s Board regularly.
8. General Body meetinGs (i) last three annual general meetings were held as under:
for financial year ended
date, time and location special resolutions passed
no. nature
31.12.2016 11th May, 20173.00 p.m.
Rama Watumull Auditorium, Mumbai
1 Approval for conversion of loan into equity shares of the Company on the occurrence of
default by the Company, if any, in repayment of loan and/or interest thereon.
31.12.2015 12th May, 20163.00 p.m.
Rama Watumull Auditorium, Mumbai.
1 Reappointment of Mr. Adun Saraban, Managing Director.
31.12.2014 13th May, 20153.00 p.m.
Rama Watumull Auditorium, Mumbai.
1 Alteration of Articles of Association under Section 61 and Section 14 of the Companies Act,
2013.
(ii) details of special resolution passed last year through postal Ballot During the financial year ended 31st December, 2017, the Company passed a Special Resolution through Postal
Ballot relating to issue of further shares/ securities under Sections 42 and 62(1)(c) of the Act, as under:
“To authorise the Board of Directors to raise funds by way of issue of equity shares or financial instruments convertible into equity shares including warrants or securities convertible into equity shares in one or more tranches to institutions, corporate bodies, mutual funds, individuals, pension funds and / or any other category of investors through Private Placement or Qualified Institutional Placement (QIP) or on preferential allotment basis upto an amount not exceeding ` 350 crore.”
Electronic Voting (E:voting/Remote e-Voting) facility was also made available to the shareholders. The Board of Directors of the Company had appointed Mr. P.N. Parikh or failing him Ms. Sarvari Shah of M/s. Parikh & Associates, Practicing Company Secretaries, as Scrutiniser for conducting the Postal Ballot voting process in a fair and transparent manner.

Annual Report 2017
Boa
rd’s
Rep
ort -
CG
Rep
ort
Fina
ncia
l Sta
tem
ents
Sta
tuto
ry R
epor
tsC
orpo
rate
Ove
rvie
w
81 204
result of the postal Ballot – voting pattern was as under:
particulars total votes total valid votes Cast
total valid votes cast in favour of the resolution
total valid votes cast against the resolution
Special Resolution
107,510,949 107,504,426 107,503,450 (99.99%)
976(0.01%)
There is no business proposed to be transacted at the ensuing Annual General Meeting which requires passing of a Special Resolution through Postal Ballot.
9. means of CommUniCation (i) The extracts of the quarterly Consolidated
Unaudited Financial Results and Consolidated Audited Financial Results are published in prominent daily newspapers. Such Financial Results were published in the Free Press Journal and/ or Financial Express and Navshakti and/ or Mumbai Lakshdeep. Quarterly Standalone and Consolidated Unaudited Financial Results and Annual Standalone and Consolidated Audited Financial Results are available on Company’s website: www.itdcem.co.in.
(ii) Codes of Ethical Conduct for (a) Directors and Senior Management Personnel and (b) Executive Directors and Employees of the Company, Whistle-Blowing and Prevention of Sexual Harassment Policy and Procedures; Corporate Social Responsibility Policy; Nomination and Remuneration Policy; Related Party Transactions Policy; Board Diversity Policy; Prevention of Insider Trading Policy; Preservation of Documents Policy; Policy on Determination and Materiality of an Event/ Information; Archival Policy and Dividend Distribution Policy are available on the Company’s website: www.itdcem.co.in.
(iii) Copy of the Chairman’s Statement circulated to the members of the Company at the Annual General Meeting of the shareholders is sent to all shareholders after the meeting for information.
(iv) Presentations on Quarterly Business Operations Overview were disseminated to the Stock Exchanges and were made available on the Company’s website: www.itdcem.co.in. These presentations were also shared with the Institutional Investors/Analysts.
(v) management discussion and analysis (md&a)
The statement on Management Discussion and Analysis forms part of the Annual Report to the shareholders of the Company.
10. General shareholders’ information
(i) annual General meeting
Date: 10th May, 2018 Time: 4.00 p.m. Venue: Rama and Sundri Watumull
Auditorium, Kishinchand Chellaram College, Vidyasagar Principal K.M. Kundnani Chowk, 124, Dinshaw Wachha Road, Churchgate, Mumbai- 400 020
(ii) financial year of the Company
1st January to 31st December
(iii) dividend payment date
The dividend, if declared at the ensuing AGM, will be paid on 16th May, 2018
(iv) stock exchanges
The equity shares of the Company are listed on:
BSE LimitedPhiroze Jeejeebhoy Towers, Dalal Street,Mumbai 400 023
National Stock Exchange of India LimitedExchange Plaza, C-1, Block ‘G’Bandra-Kurla Complex, Bandra (East),Mumbai 400 051
The listing fees for the financial year 2017-2018 (upto 31.03.2018) of the above mentioned stock exchanges have been paid.
(v) stock Code
BSE Limited (BSE): 509496
The National Stock Exchange of India Limited (NSE): ITDCEM

ITD Cementation India Limited
82 204
(vi) market price data Tables given below are the monthly highs and lows of the Company’s shares with corresponding Sensex at BSE
and NSE showing performance of Company’s share prices vis-a-vis BSE Sensex (closing) and Nifty (closing):
high and low prices of the Company’s shares at Bse with corresponding Bse sensex January to december 2017
months high low Close
itd Cem price`
Bse sensex itd Cem price`
Bse sensex itd Cem price`
Bse sensex
January 176.00 27980.39 149.05 26447.06 160.50 27655.96
February 167.90 29065.31 144.75 27590.10 151.15 28743.32
March 173.95 29824.62 147.60 28716.21 171.15 29620.50
April 191.35 30184.22 167.00 29241.48 190.00 29918.40
May 193.35 31255.28 164.00 29804.12 171.90 31145.80
June 188.40 31522.87 164.50 30680.66 169.25 30921.61
July 179.30 32672.66 160.40 31017.11 164.35 32514.94
August 167.00 32686.48 146.55 31128.02 161.10 31730.49
September 181.40 32524.11 160.10 31081.83 170.80 31283.72
October 183.00 33340.17 164.00 31440.48 181.75 33213.13
November 234.90 33865.95 179.35 32683.59 206.00 33149.35
December 221.85 34137.97 186.95 32565.16 217.85 34056.83
high and low prices of the Company’s shares at nse with corresponding nifty January to december 2017
months high low Close
itd Cem price`
nifty itd Cem price`
nifty itd Cem price`
nifty
January 169.70 8672.70 149.50 8133.80 161.25 8561.30
February 168.50 8982.15 145.00 8537.50 151.40 8879.60
March 173.80 9218.40 147.70 8860.10 171.30 9173.75
April 193.00 9367.15 166.65 9075.15 190.60 9304.05
May 193.90 9649.60 163.85 9269.90 173.40 9621.25
June 188.50 9709.30 164.00 9448.75 169.75 9520.90
July 179.95 10114.85 160.45 9543.55 165.00 10077.10
August 168.00 10137.85 146.50 9685.55 161.70 9917.90
September 182.50 10178.95 159.50 9687.55 171.65 9788.60
October 182.75 10384.50 164.50 9831.05 181.35 10335.30
November 235.20 10490.45 179.50 10094.00 206.90 10226.55
December 223.30 10552.40 183.95 10033.35 217.95 10530.70
(vii) registrars and share transfer agents M/s. Karvy Computershare Private Limited, Karvy Selenium Tower B, Plot 31-32, Gachibowli, Financial District,
Nanakramguda, Hyderabad - 500 032, Tel: +91 40 67162222, Fax : +91 40 23420814, Email ID : [email protected] are the Registrars and Share Transfer Agents of the Company.
(viii) share transfer systems Shares lodged for transfers are registered and duly transferred Share Certificates are despatched to the
lodger within a period of fifteen days from the date of receipt, if the documents are otherwise in order.
The Share Transfer Committee meets as often as is necessary to approve transfers and related matters as may be required by the Registrars and Share Transfer Agents.

Annual Report 2017
Boa
rd’s
Rep
ort -
CG
Rep
ort
Fina
ncia
l Sta
tem
ents
Sta
tuto
ry R
epor
tsC
orpo
rate
Ove
rvie
w
83 204
(ix) shareholding pattern as on 31st december, 2017
sl no.
particulars no. of shares held percentage to total share capital
(i) Promoter – Italian-Thai Development Public Company Limited 80113180 51.63
(ii) General Public 29402012 18.96
(iii) Banks/IFI 161930 0.10
(iv) Mutual Funds 34432886 22.19
(v) Corporate Bodies 5336962 3.44
(vi) NRI/OCB/FII/FOREIGN /BANK/FPB/FPI 5308001 3.42
(vii) Clearing Members 102268 0.07
(viii) NBFC 3150 0.00
(ix) Trust 3951 0.00
(x) IEPF 293560 0.19
total 155157900 100.00
(x) distribution of shareholding as on 31st december, 2017
sl no.
Category (shares) no. of holders % to holders no. of shares % to equity
1 1-500 20718 66.92 4719388 3.04
2 501-1000 5909 19.09 4340588 2.80
3 1001-2000 2291 7.40 3448561 2.22
4 2001-3000 712 2.30 1812160 1.17
5 3001-4000 383 1.24 1380340 0.89
6 4001-5000 253 0.82 1184534 0.76
7 5001-10000 357 1.15 2583635 1.67
8 10001 & above 335 1.08 135688694 87.45
total: 30958 100.00 155157900 100.00
(xi) dematerialisation of shares The shares of the Company are in compulsory demat segment and are available for trading in the Depository
System. Under the Depository System, the International Securities Identification Number (ISIN) allotted to the Company is INE686A01026.
As on 31st December, 2017, out of the 30,958 shareholders 29,748 shareholders have dematerialised their shares aggregating to 154,093,795 shares i.e. around 99.31% of the total paid-up capital of the Company.
(xii) dates of Book Closure The Company’s Register of Members and Share Transfer Books will remain closed from Friday, 4th May, 2018,
to Thursday, 10th May, 2018 (both days inclusive).

ITD Cementation India Limited
84 204
(xiii) investor correspondence All enquiries, clarifications and correspondence should be addressed to the Registrars and Share Transfer
Agents or to the Compliance Officer at the following addresses:
registrars and share transfer agentsKarvy Computershare Private LimitedUnit: ITD Cementation India LimitedKarvy Selenium Tower B, Plot 31-32, Gachibowli, Financial District, Nanakramguda, Hyderabad – 500 032.Tel: +91 40 67162222 | Fax: +91 40 23420814Emails: [email protected]
and / or
Branch office at 24-B Raja Bahadur Mansion, Ground Floor, Ambalal Doshi Marg, Behind BSE, Fort, Mumbai – 400 023 Tel: +91 22 66235454 Email: [email protected]
Compliance officerMr Rahul NeogiCompany SecretaryITD Cementation India LimitedNational Plastic Building, A- Subhash Road, Paranjape B Scheme, Vile Parle (East), Mumbai - 400 057.Tel : + 91 22 66931600/67680600Fax: + 91 22 66931628/67680841 Emails: [email protected]
11. other disClosUres (i) disclosures on materially significant
related party transactions that may have potential conflict with the interests of the Company at large
There were no materially significant related
party transactions having potential conflict
with the interests of the Company at
large during the financial year ended 31st
December, 2017.
(ii) details of non-compliance by the Company, penalties, strictures imposed on the Company by stock exchange(s) or seBi or any statutory authority on any matter related to capital markets, during the last three years - There were none.
(iii) Whistle Blower policy The Company has in place a Whistle-Blowing
and Prevention of Sexual Harassment Policy
and Procedures that no personnel has been
denied access to the Audit Committee.
(iv) (a) the Company has complied with the mandatory requirements of the listing regulations, 2015
(b) as regards non-mandatory requirment, the Company has constituted a risk management Committee on 24th february, 2015.
(v) policy dealing with related party transactions is displayed on the Company’s website: www.itdcem.co.in.
(vi) Ceo/Cfo Certification A Certificate from the CEO/CFO of the
Company in terms of Regulation 17 (8) of Listing Regulations, 2015 read with Part B of Schedule II was placed before the Board at its meeting held on 22nd February, 2018 to approve the Audited Financial Statements for the financial year ended 31st December, 2017.
12. disCretionary reqUirements (i) The Chairman of the Company is a Non-
Executive Director.
(ii) Shareholders’ Rights The quarterly and yearly financial results are
published in the newspapers and they are also available on the website of the Company and that of the Stock Exchanges where the shares of the Company are listed i.e. BSE

Annual Report 2017
Boa
rd’s
Rep
ort -
CG
Rep
ort
Fina
ncia
l Sta
tem
ents
Sta
tuto
ry R
epor
tsC
orpo
rate
Ove
rvie
w
85 204
Limited and National Stock Exchange of India Limited. The Company has not sent any half yearly declaration of financial performance including summary of significant events in the last six months to each household of shareholders of the Company.
(iii) Audit Qualifications: The Auditors opinion on the Financial Statements is unmodified.
(iv) Separate posts of Chairman and CEO: The positions of the Chairman and the Managing Director /CEO in the Company are separate.
(v) Internal Auditor reports directly to the Audit Committee.
13. The Company has complied with the corporate governance requirements as specified in Regulations 17 to 27 of the Listing Regulations, 2015 regarding Board of Directors, Audit Committee, Nomination & Remuneration Committee, Stakeholders Relationship Committee, etc. and clauses (b) to (i) of sub-regulation (2)
of Regulation 46 of Listing Regulations, 2015 pertaining to dissemination of certain information on the Company’s website.
14. Code of CondUCt The Company has in place Code of Ethical
Conduct for (a) Directors and Senior Management Personnel and (b) Executive Directors and Employees of the Company. As per Regulation 46 of the Listing Regulations, 2015, the same have been posted on the website of the Company. The Managing Director of the Company has given a declaration to the effect that all the Directors and Senior Management personnel of the Company have given their affirmation of compliance with the Codes of Ethical Conduct.
15. None of the shareholder’s shares is lying in the suspense account and hence no disclosure is required under Schedule V of Part F of Listing Regulations, 2015.
16. Other Items which are not applicable to the Company have not been separately commented upon.

ITD Cementation India Limited
86 204
aUditor’s CertifiCate on Corporate GovernanCe
To the Members of ITD Cementation India Limited
We have examined the compliance of conditions of corporate governance by ITD Cementation India Limited (“the Company”) for the year ended on 31st December, 2017, as stipulated in Regulations 17 to 27, clauses (b) to (i) of regulation 46(2) and paragraphs C, D and E of Schedule V of the Securities and Exchange Board of India (Listing Obligations and Disclosure Requirements) Regulations, 2015 (‘Listing Regulations’).
The compliance of conditions of corporate governance is the responsibility of the management. Our examination was limited to procedures and implementation thereof, adopted by the Company for ensuring the compliance of the conditions of corporate governance. It is neither an audit nor an expression of opinion on the financial statements of the Company.
We have examined the relevant records of the Company in accordance with the Generally Accepted Auditing Standards in India, to the extent relevant, and as per the Guidance Note on Certification of Corporate Governance issued by the Institute of Chartered Accountants of India.
In our opinion and to the best of our information and according to our examination of the relevant records and the explanations given to us, we certify that the Company has complied with the conditions of corporate governance as stipulated in the above mentioned Listing Regulations.
We state that such compliance is neither an assurance as to the future viability of the Company nor the efficiency or effectiveness with which the management has conducted the affairs of the Company.
restriction on useThis certificate is issued solely for the purpose of complying with the aforesaid regulations and may not be suitable for any other purpose.
For Walker Chandiok & Co llpChartered AccountantsFirm Registration No. 001076N/N500013
per rakesh r. agrawalPartnerMembership No: 109632
Place: Mumbai Date: 22 February 2018

Annual Report 2017
Bus
ines
s R
espo
nsib
ility
Rep
ort
Fina
ncia
l Sta
tem
ents
Sta
tuto
ry R
epor
tsC
orpo
rate
Ove
rvie
w
87 204
(Pursuant to Regulation 34(2)(f) of the Securities and Exchange Board of India (Listing Obligations and Disclosure Requirements) Regulation, 2015.
Section A: GenerAl informAtion About the compAny
1. Corporate Identity (CIN) of the Company L61000MH1978PLC020435
2. Name of the Company ITD Cementation India Limited
3. Registered address National Plastic Building, A - Subhash Road, Paranjape B Scheme, Vile Parle (East),Mumbai- 400057
4. Website www.itdcem.co.in
5. E-mail id [email protected]
6. Financial Year reported 2017
7. Sector(s) that the Company is engaged in (industrial
activity code-wise)
Construction and Civil Engineering (4290).
8. List three key products/services that the Company
manufactures/provides (as in balance sheet)
(a) Maritime structures.
(b) Urban infrastructure projects/ mass rapid transit
systems/ airports.
(c) Highways, Bridges and Flyovers.
9. Total number of locations where business activity is
under taken by the Company
• NumberofInternationalLocations(provide
details of major 5)
• Numberofnationallocations
Nil.
60 sites across 14 Indian states.
10. Markets served by the Company-Local/State/
National/ International
At National level.
Section b: finAnciAl DetAilS of the compAny
1. Paid up capital (as at 31st December, 2017) ` 1,551.58 lakhs.
2. Total turnover (for the year ended 31st December,
2017): Revenue from standalone operations
` 187,292.02 lakh.
3. Total profit after taxes (for the year ended 31st
December, 2017): On standalone basis ` 7,281.64 lakhs.
4. Total spending on Corporate Social Responsibility
(CSR) as a percentage of profit after tax (%)
On account of losses incurred by the Company, there
was no average net profit in the 3 immediately preceding
financial years. (Amount spent in 2017 - Nil).
5. List of activities in which expenditure in 4 above has
been incurred
Not Applicable.
Business Responsibility Report

ITD Cementation India Limited
88 204
Section c: other DetAilS
1. Does the Company have any subsidiary company/
companies?
Yes - ITD Cementation Projects India Ltd.
2. Do the subsidiary company/companies participate in
the business responsibility initiatives of the parent
company? If yes, then indicate the number of such
subsidiary company(s)
No.
3. Do any other entity/entities (e.g. suppliers,
distributors etc.) that the Company does business
with, participate in the BR initiatives of the
Company? If yes, then indicate the percentage of
such entity/entities? [Less than 30%, 30-60%, More
than 60%]
Currently less than 30% of value chain entities participate in the Company’s BR initiatives and there is a constant effort by the Company to extend the initiatives to a larger base. The suppliers and vendors are provided awareness on environmental and social issues. Vendor/sub-contractor meets are used as a platform to raise awareness on health, safety and environmental initiatives of the Company.
Section D: br informAtion
1. Details of Director/Directors responsible for br(a) Details of Director/Directors responsible for
implementation of the BR policy/policies
1.
2.3.
Director Identification NumberNameDesignation
01312769
Mr. Adun SarabanManaging Director
(b) Details of the BR Head 1.
2.3.4.5.
Director Identification NumberNameDesignationTelephone No.e-mail id
Not Applicable
Mr. Prasad PatwardhanChief Financial Officer022 [email protected]
2. principle – wise (as per nVGs) br policy/policies
(a) Details of compliance (Reply in Y/N)
no. Questions p1 p2 p3 p4 p5 p6 p7 p8 p9
1. Do you have a policy/ policies for? Y Y Y Y Y Y No Y Y
2. Has the policy been formulated in consultation with the relevant stakeholders?
Yes.
3. Does the policy conform to any national / international standards? If yes, specify? (50 words)
Yes, all the policies conform to national standards. The Company has an established Integrated Management System comprising Quality Management System (QMS) conforming to ISO 9001:2015, Environmental Management System (EMS) conforming to ISO 14001:2015 and Occupational Health and Safety Management System conforming to OHSAS 18001:2007 at all offices, project sites and depots.
4. Has the policy been approved by the Board?If yes, has it been signed by MD/ owner/ CEO/ appropriate Board Director?
Some policies have been approved by the Board and these have been signed by the MD.
5. Does the Company have a specified committee of the Board/ Director/ Official to oversee the implementation of the policy?
The Company has in place a CSR Committee of the Board with powers to oversee the implementation of the CSR activities. For other policies, the Company has in place adequate internal control mechanism to oversee their implementation.

Annual Report 2017
Bus
ines
s R
espo
nsib
ility
Rep
ort
Fina
ncia
l Sta
tem
ents
Sta
tuto
ry R
epor
tsC
orpo
rate
Ove
rvie
w
89 204
no. Questions p1 p2 p3 p4 p5 p6 p7 p8 p9
6. Indicate the link for the policy to be viewed online?
Whistle Blowing and Prevention of Sexual Harassment Policy and Procedures http://www.itdcem.co.in/upload/Whistle_Blower_Policy.pdf
Dividend Distribution Policy:http://www.itdcem.co.in/upload/Dividend_Distribution_Policy.pdf
IMS Policy:http://www.itdcem.co.in/about-us/ims-policy/
Corporate Social Responsibility:http://www.itdcem.co.in/about-us/csr/ Code of Conduct • http://www.itdcem.co.in/upload/ITD_Code_of_Ethical_
Conduct_Directors.pdf• http://www.itdcem.co.in/upload/ITD_Code_of_Ethical_
Conduct_for_Ex_Dirs_and_Emplys.pdf
7. Has the policy been formally communicated to all relevant internal and external stakeholders?
Yes. Policies relevant to the internal and external stakeholders have been communicated accordingly.
8. Does the Company have in-house structure to implement the policy/policies
Yes. Policies themselves contain methodology of implementation of the policies.
9. Does the Company have a grievance redressal mechanism related to the policy/ policies to address stakeholders’ grievances related to the policy/ policies?
Yes, the Company has provided a mechanism for grievance redressal by setting up a Stakeholders Relationship Committee and by putting in place Whistle Blowing and Prevention of Sexual Harassment Policy and Procedures.
10. Has the Company carried out independent audit/ evaluation of the working of this policy by an internal or external agency?
Yes. Some of the policies in place have been evaluated internally and some have been evaluated externally.
(b) If answer to the question at serial number 1 against any principle, is ‘No’, please explain why:(Tick up to 2 options)
no. Questions p1 p2 p3 p4 p5 p6 p7 p8 p9
1. The Company has not understood the Principles Not applicable.
2. The Company is not at a stage where it finds itself in a position to formulate and implement the policies on specified principles
Not applicable.
3. The Company does not have financial or manpower resources available for the task
Not applicable.
4. It is planned to be done within next 6 months Not applicable.
5. It is planned to be done within the next 1 year Not applicable.
6. Any other reason (please specify) Policy not required.
3. Governance related to br
(a) Indicate the frequency with which the Board of Directors, Committee of the Board or CEO to assess the BR performance of the Company. Within 3 months, 3-6 months, Annually, More than 1 year
6 monthly.
(b) Does the Company publish a BR or a Sustainability Report? What is the hyperlink for viewing this report? How frequently it is published?
Yes, link is http://www.itdcem.co.in/investors/financial/annual-reports/ Annually

ITD Cementation India Limited
90 204
Section e: principle-WiSe performAnce
principle 1 businesses should conduct and govern themselves with ethics, transparency and Accountability.
1. Does the policy relating to ethics, bribery and corruption cover only the Company? Yes/ No. Does it extend to the Group/Joint Ventures/ Suppliers/Contractors/NGOs /Others?
Yes, it covers the Company and also extends to suppliers and contractors.
2. How many stakeholder complaints have been received in the past financial year and what percentage was satisfactorily resolved by the management? If so, provide details thereof, in about 50 words or so
The Company received 77 complaints in the financial year ended 31st December, 2017 and all the complaints have been resolved satisfactorily.
principle 2businesses should provide goods and services that are safe and contribute to sustainability throughout their life cycle.
1. List up to 3 of your products or services whose design has incorporated social or environmental concerns, risks and/or opportunities
The Company’s services cover the following areas:
(a) Maritime structures(b) Urban infrastructure projects/ mass rapid transit
systems/ airports(c) Highways, Bridges and Flyovers
The Company has in place an Integrated Management System Policy covering aspects on quality, environment, safety and health.
2. For each such product, provide the following details in respect of resource use (energy, water, raw material etc.) per unit of product (optional)(a) Reduction during sourcing/production/
distribution achieved since the previous year throughout the value chain?
Not applicable since the Company does not manufacture any product.
(b) Reduction during usage by consumers (energy, water) has been achieved since the previous year?
Not applicable
3. Does the Company have procedures in place for sustainable sourcing (including transportation)?
Yes.
If yes, what percentage of your inputs was sourced sustainably? Also, provide details thereof, in about 50 words or so
The Company continually works with its vendors and suppliers to reduce the environmental impact of sourcing.
4. Has the Company taken any steps to procure goods and services from local & small producers, including communities surrounding their place of work?
Yes, wherever feasible.
If yes, what steps have been taken to improve their capacity and capability of local and small vendors?
The Company provides support to local and small vendors by way of supply of machinery items and financial assistance including free issue of material.
5. Does the Company have a mechanism to recycle products and waste? If yes what is the percentage of recycling of products and waste (separately as <5%, 5-10%, >10%). Also, provide details thereof, in about 50 words or so
Not applicable.

Annual Report 2017
Bus
ines
s R
espo
nsib
ility
Rep
ort
Fina
ncia
l Sta
tem
ents
Sta
tuto
ry R
epor
tsC
orpo
rate
Ove
rvie
w
91 204
principle 3businesses should recognise that over consumption results in unsustainable exploitation of our planet’s resources and should therefore promote sustainable consumption including recycling of resources.
1. Please indicate the total number of employees 5,148
2. Please indicate the total number of employees hired on temporary/ contractual/casual basis
3,138
3. Please indicate the number of permanent women employees
37
4. Please indicate the number of permanent employees with disabilities
1
5. Do you have an employee association that is recognised by management
Yes, the Company has two Employee associations i.e. Engineering Mazdoor Sabha, Mumbai and ITD Cementation India Workers’ Union, Kolkata.
6. What percentage of your permanent employees is members of this recognised employee association?
1.55%
7. Please indicate the number of complaints relating to child labour, forced labour, involuntary labour, sexual harassment in the last financial year and pending, as on the end of the financial year
Category No. of complaints filed during the financial year
No. of complaints pending as at the end of the financial year
Child labour/forced labour/involuntary labour
Nil Nil
Sexual harassment Nil Nil
Discriminatory employment
Nil Nil
8. What percentage of your under mentioned employees were given safety & skill up-gradation training in the last year?(a) Permanent Employees(b) Permanent Women Employees(c) Casual/Temporary/Contractual Employees(d) Employees with Disabilities
Yes. On a continuous basis.
principle 4businesses should respect the interests of, and be responsive towards all stakeholders, especially those who are disadvantaged, vulnerable and marginalised.
1. Has the Company mapped its internal and external stakeholders? Yes/No
Yes.
2. Out of the above, has the Company identified the disadvantaged, vulnerable & marginalised stakeholders
Yes.
3. Are there any special initiatives taken by the Company to engage with the disadvantaged, vulnerable and marginalised stakeholders. If so, provide details thereof, in about 50 words or so
The Company’s CSR Policy has been designed to cater to the physically challenged or differently abled, socially and economically backward groups.
principle 5businesses should respect and promote human rights.
1. Does the policy of the Company on human rights cover only the Company or extend to the Group/Joint Ventures/Suppliers/ Contractors/ NGOs/Others?
Yes, it covers the Company and also extends to suppliers and contractors.
2. How many stakeholder complaints have been received in the past financial year and what percent was satisfactorily resolved by the management?
The Company has not received any complaints in the area of human rights.

ITD Cementation India Limited
92 204
principle 6business should respect, protect and make efforts to restore the environment.
1. Does the policy related to Principle 6 cover only the Company or extends to the Group/Joint Ventures/Suppliers/Contractors/NGOs/ Others.
Yes, it covers the Company and also extends to suppliers and contractors.
2. Does the Company have strategies/ initiatives to address global environmental issues such as climate change, global warming, etc? Y/N. If yes, please give hyperlink for webpage etc.
No
3. Does the Company identify and assess potential environmental risks? Y/N
Yes
4. Does the Company have any project related to Clean Development Mechanism? If so, provide details thereof, in about 50 words or so. Also, if Yes, whether any environmental compliance report is filed?
No
5. Has the Company undertaken any other initiatives on – clean technology, energy efficiency, renewable energy, etc. Y/N. If yes, please give hyperlink for web page etc.
No
6. Are the Emissions/Waste generated by the Company within the permissible limits given by CPCB/SPCB for the financial year being reported?
Yes
7. Number of show cause/ legal notices received from CPCB/SPCB which are pending (i.e. not resolved to satisfaction) as on end of Financial Year
Nil
principle 7businesses, when engaged in influencing public and regulatory policy, should do so in a responsible manner.
1. Is your Company a member of any trade and chamber or association? If Yes, Name only those major ones that your business deals with
Yes• BombayChamberofCommerce• ConstructionFederationofIndia• NationalHighwayBuilders’Association
2. Have you advocated/lobbied through above associations for the advancement or improvement of public good? Yes/No; if yes specify the broad areas (drop box: Governance and Administration, Economic Reforms, Inclusive Development Policies, Energy Security, Water, Food Security, Sustainable Business Principles, Others)
No

Annual Report 2017
Bus
ines
s R
espo
nsib
ility
Rep
ort
Fina
ncia
l Sta
tem
ents
Sta
tuto
ry R
epor
tsC
orpo
rate
Ove
rvie
w
93 204
principle 8businesses should support inclusive growth and equitable development.
1. Does the Company have specified programmes/initiatives/projects in pursuit of the policy related to Principle 8? If yes details thereof
Yes. The Company has a CSR policy and the activities laid down in the policy pertain to the 8 focal areas for its social development projects/activities.
2. Are the programmes/projects undertaken through in-house team/ own foundation/external NGO/government structures/any other organisation?
Yes, through in-house team.
3. Have you done any impact assessment of your initiative?
Not yet.
4. What is your Company’s direct contribution to community development projects- Amount in and the details of the projects undertaken
Nil for the year ended 31st December, 2017.
5. Have you taken steps to ensure that this community development initiative is successfully adopted by the community? Please explain in 50 words, or so
CSR activities are being pursued in line with the Company’s policy and framework. The Company identifies communities that require the Company’s direct intervention for community development in or near about the Company’s project sites.
principle 9businesses should engage with and provide value to their customers and consumers in a responsible manner.
1. What percentage of customer complaints/consumer cases are pending as on the end of financial year
• Customer complaints are regularly addressed at project sites.
• Percentage of Customer complaints pending as at the end of the financial year (31st December, 2017): Nil
• There are no consumer cases pending as at the end of the financial year (31st December, 2017)
2. Does the Company display product information on the product label, over and above what is mandated as per local laws? Yes/No/N.A. / Remarks (additional information)
Not Applicable.
3. Is there any case filed by any stakeholder against the Company regarding unfair trade practices, irresponsible advertising and/or anti-competitive behaviour during the last five years and pending as on end of financial year. If so, provide details thereof, in about 50 words or so
Not to the Company’s knowledge.
4. Did your Company carry out any consumer survey/ consumer satisfaction trends?
Yes.

ITD Cementation India Limited
94 204
Independent Auditor’s Report
ToThe Members of ITD Cementation India Limited
RepoRT on The STanDaLone FInanCIaL STaTemenTS1. We have audited the accompanying standalone
financial statements of ITD Cementation India Limited (‘the Company’), which comprise the Balance Sheet as at 31 December 2017, the Statement of Profit and Loss (including Other Comprehensive Income), the Cash Flow Statement and the Statement of Changes in Equity for the year then ended, and a summary of the significant accounting policies and other explanatory information.
managemenT’S ReSponSIbILITy FoR The STanDaLone FInanCIaL STaTemenTS2. The Company’s Board of Directors is responsible for
the matters stated in Section 134(5) of the Companies Act, 2013 (‘the Act’) with respect to the preparation of these standalone financial statements that give a true and fair view of the state of affairs (financial position), profit or loss (financial performance including other comprehensive income), cash flows and changes in equity of the Company in accordance with the accounting principles generally accepted in India, including the Indian Accounting Standards (‘Ind AS’) specified under Section 133 of the Act. This responsibility also includes maintenance of adequate accounting records in accordance with the provisions of the Act for safeguarding the assets of the Company and for preventing and detecting frauds and other irregularities; selection and application of appropriate accounting policies; making judgments and estimates that are reasonable and prudent; and design, implementation and maintenance of adequate internal financial controls, that were operating effectively for ensuring the accuracy and completeness of the accounting records, relevant to the preparation and presentation of the standalone financial statements that give a true and fair view and are free from material misstatement, whether due to fraud or error.
auDIToR’S ReSponSIbILITy3. Our responsibility is to express an opinion on these
standalone financial statements based on our audit.
4. We have taken into account the provisions of the Act, the accounting and auditing standards and matters which are required to be included in the audit report under the provisions of the Act and the Rules made thereunder.
5. We conducted our audit in accordance with the Standards on Auditing specified under Section 143(10) of the Act. Those Standards require that we comply with ethical requirements and plan and perform the audit to obtain reasonable assurance about whether these standalone financial statements are free from material misstatement.
6. An audit involves performing procedures to obtain audit evidence about the amounts and the disclosures in the financial statements. The procedures selected depend on the auditor’s judgment, including the assessment of the risks of material misstatement of the financial statements, whether due to fraud or error. In making those risk assessments, the auditor considers internal financial controls relevant to the Company’s preparation of the financial statements that give a true and fair view in order to design audit procedures that are appropriate in the circumstances. An audit also includes evaluating the appropriateness of the accounting policies used and the reasonableness of the accounting estimates made by the Company’s Directors, as well as evaluating the overall presentation of the financial statements.
7. We believe that the audit evidence we have obtained is sufficient and appropriate to provide a basis for our audit opinion on these standalone financial statements.
opInIon 8. In our opinion and to the best of our information
and according to the explanations given to us, the aforesaid standalone financial statements give the information required by the Act in the manner so required and give a true and fair view in conformity with the accounting principles generally accepted in India including Ind AS specified under Section 133 of the Act, of the state of affairs (financial position) of the Company as at 31 December 2017, and its profit (financial performance including other comprehensive income), its cash flows and the changes in equity for the year ended on that date.

Annual Report 2017
Sta
ndal
one
Fina
ncia
l Sta
tem
ents
Sta
tuto
ry R
epor
tsC
orpo
rate
Ove
rvie
w
95 204
oTheR maTTeR9. The Company had prepared separate sets of
statutory financial statements for the years ended 31 December 2016 and 31 December 2015 in accordance with Accounting Standards prescribed under Section 133 of the Act, read with Rule 7 of the Companies (Accounts) Rules, 2014 (as amended) on which we issued auditor’s reports to the shareholders of the Company dated 21 February 2017 and 24 February 2016, respectively. These financial statements have been adjusted for the differences in the accounting principles adopted by the Company on transition to Ind AS, which have also been audited by us. Our opinion is not modified in respect of this matter.
RepoRT on oTheR LegaL anD ReguLaToRy RequIRemenTS10. As required by the Companies (Auditor’s Report)
Order, 2016 (‘the Order’) issued by the Central Government of India in terms of Section 143(11) of the Act, we give in the Annexure I a statement on the matters specified in paragraphs 3 and 4 of the Order.
11. Further to our comments in Annexure I, as required by Section 143(3) of the Act, we report that:
a) we have sought and obtained all the information and explanations which to the best of our knowledge and belief were necessary for the purpose of our audit;
b) in our opinion, proper books of account as required by law have been kept by the Company so far as it appears from our examination of those books;
c) the standalone financial statements dealt with by this report are in agreement with the books of account;
d) in our opinion, the aforesaid standalone financial statements comply with Ind AS specified under Section 133 of the Act;
e) on the basis of the written representations received from the directors and taken on record by the Board of Directors, none of the directors
is disqualified as at 31 December 2017 from being appointed as a director in terms of Section 164(2) of the Act;
f) we have also audited the internal financial controls over financial reporting (IFCoFR) of the Company as at 31 December 2017 in conjunction with our audit of the standalone financial statements of the Company for the year ended on that date and our report dated 22 February 2018 as per Annexure II expressed an unmodified opinion;
g) with respect to the other matters to be included in the Auditor’s Report in accordance with Rule 11 of the Companies (Audit and Auditors) Rules, 2014 (as amended), in our opinion and to the best of our information and according to the explanations given to us:
i. the Company, as detailed in Note 29 (iv) to 29 (vii) to the standalone financial statements, has disclosed the impact of pending litigations on its financial position;
ii. the Company has made provisions for material foreseeable losses, if any, on long-term contracts including derivative contracts; and
iii. there has been no delay in transferring amounts, required to be transferred, to the Investor Education and Protection Fund by the Company.
For Walker Chandiok & Co LLpChartered AccountantsFirm’s Registration No.: 001076N/N500013
Per Rakesh R. agarwalPartnerMembership No.: 109632
Place: Mumbai Date: 22 February 2018

ITD Cementation India Limited
96 204
annexure I to the Independent auditor’s Report of even date to the members of ITD Cementation India Limited, on the standalone financial statements for the year ended 31 December 2017
annexure IBased on the audit procedures performed for the purpose of reporting a true and fair view on the standalone financial statements of the Company and taking into consideration the information and explanations given to us and the books of account and other records examined by us in the normal course of audit, and to the best of our knowledge and belief, we report that:
(i) (a) The Company has maintained proper records showing full particulars, including quantitative details and situation of property, plant and equipment.
(b) The property, plant and equipment have been physically verified by the management during the year and no material discrepancies were noticed on such verification. In our opinion, the frequency of verification of the fixed assets is reasonable having regard to the size of the Company and the nature of its assets.
(c) The title deeds of all the immovable properties are held in the name of the Company.
(ii) In our opinion, the management has conducted physical verification of inventory at reasonable intervals during the year and no material discrepancies between physical inventory and book records were noticed on physical verification.
(iii) The Company has not granted any loan, secured or unsecured to companies, firms, Limited Liability Partnerships (LLPs) or other parties covered in the register maintained under Section 189 of the Act. Accordingly, the provisions of clauses 3(iii)(a), 3(iii)(b) and 3(iii)(c) of the Order are not applicable.
(iv) In our opinion, the Company has complied with the provisions of Sections 185 and 186 of the
Act in respect of loans, investments, guarantees and security.
(v) In our opinion, the Company has not accepted any deposits within the meaning of Sections 73 to 76 of the Act and the Companies (Acceptance of Deposits) Rules, 2014 (as amended). Accordingly, the provisions of clause 3(v) of the Order are not applicable.
(vi) We have broadly reviewed the books of account maintained by the Company pursuant to the Rules made by the Central Government for the maintenance of cost records under sub-section (1) of Section 148 of the Act in respect of Company’s services and are of the opinion that, prima facie, the prescribed accounts and records have been made and maintained. However, we have not made a detailed examination of the cost records with a view to determine whether they are accurate or complete.
(vii) (a) Undisputed statutory dues including provident fund, employees’ state insurance, income-tax, sales-tax, service tax, duty of customs, duty of excise, value added tax, cess and other material statutory dues, as applicable, have generally been regularly deposited to the appropriate authorities, though there has been a slight delay in a few cases. Further, no undisputed amounts payable in respect thereof were outstanding at the year-end for a period of more than six months from the date they became payable.
(b) There are no dues in respect of service tax and duty of customs that have not been deposited with the appropriate authorities on account of any dispute.
The dues outstanding in respect of income-tax, sales-tax, duty of excise and value added tax on account of any dispute, are as follows:
Statement of Disputed Dues
name of statue
nature of dues
amount (` in Lakhs)
amount paid under protest
(` in Lakhs)
period to which the amount relates
Forum where dispute is pending
Sales Tax Act/Works Contract Tax Act/Value Added Tax
Value Added Tax
478.17 70.00 2012-2013 The West Bengal Taxation Tribunal, Salt Lake Kolkata
279.05 37.06 2009-10 and 2010-11
Joint Commissioner of Commercial Taxes, Rajkot
511.61 35.00 2011-12 Deputy Commissioner of Commercial Taxes, Gujarat
307.59 - 2013-14 Senior Joint Commissioner Appeals, West Bengal
44.09 - 2008-09 West Bengal Taxation Tribunal

Annual Report 2017
Sta
ndal
one
Fina
ncia
l Sta
tem
ents
Sta
tuto
ry R
epor
tsC
orpo
rate
Ove
rvie
w
97 204
name of statue
nature of dues
amount (` in Lakhs)
amount paid under protest
(` in Lakhs)
period to which the amount relates
Forum where dispute is pending
412.02 - 2011-12 and 2012-13
Additional Commercial Tax Officer, Goa
10.38 2.70 2005-06 The Joint Commissioner, Sales Tax, Mumbai
263.25 - 2007-08 Appellate and Revisional board, West Bengal
Sales Tax 16.60 - 1994-95 Revision Board (Tribunal) Kolkata31.97 - 2004-05 Deputy Commissioner of
Commercial Taxes, Bihar202.05 101.41 2011-12 Maharashtra Sales Tax Tribunal105.80 - 2010-11 Commissioner, Commercial Taxes,
Kolkata265.81 - 2011-12 Joint Commissioner sales tax, West
Bengal79.23 - 2004-05 and
2006-07Appellate and Revisional Board, West Bengal
78.51 19.63 2007-08 and 2008-09
Madras High Court
21.78 5.44 2006-07 and 2009-10
Deputy Commissioner of Commercial Taxes, Tamil Nadu
Central Excise Act,1944
Excise Duty 51.70 - May 1998 to January 1999
Commissioner of Central Excise
Income Tax Act, 1961
Income Tax 210.75 - A.Y. 2004-05 High Court, Mumbai
286.85 - A.Y. 2010-11, 2011-12 and 2012-13
Income Tax Appellate Tribunal, Kolkata
153.64 - A.Y. 2013-14 Commissioner of Income Tax (Appeals), Kolkata
161.30 - A.Y.2012-13 and 2013-14
Commissioner of Income Tax (Appeals), Mumbai
(viii) The Company has not defaulted in repayment of loans or borrowings to any financial institution or a bank or government or any dues to debenture-holders during the year.
(ix) The Company did not raise moneys by way of initial public offer or further public offer (including debt instruments). In our opinion, the term loans were applied for the purpose for which the loans were obtained.
(x) Except for the matter referred to in Note 37 to the standalone financial statements relating to certain allegations against an employee of the Company, in our opinion, no material fraud by the Company or on the Company by its officers or employees has been noticed or reported during the period covered by our audit.
(xi) In our opinion, managerial remuneration has been paid by the Company in accordance with the requisite approvals mandated by the provisions of Section 197 of the Act read with Schedule V to the Act.
(xii) In our opinion, the Company is not a Nidhi Company. Accordingly, provisions of clause 3(xii) of the Order are not applicable.
(xiii) In our opinion, all transactions with the related parties are in compliance with Sections 177 and 188 of Act, where applicable, and the requisite details have been disclosed in the financial statements etc., as required by the applicable Ind AS.
(xiv) During the year, the Company has not made any preferential allotment or private placement of shares or fully or partly convertible debentures.
(xv) In our opinion, the Company has not entered into any non-cash transactions with the directors or persons connected with them covered under Section 192 of the Act.
(xvi) The Company is not required to be registered under Section 45-IA of the Reserve Bank of India Act, 1934.
For Walker Chandiok & Co LLp Chartered AccountantsFirm’s Registration No.: 001076N/N500013
Per Rakesh R. agarwalPartnerMembership No.: 109632
Place: Mumbai Date: 22 February 2018

ITD Cementation India Limited
98 204
annexure II to the Independent auditor’s Report of even date to the members of ITD Cementation India limited on the standalone financial statements for the year ended 31 December 2017
annexure II
Independent auditor’s Report on the Internal Financial Controls under Clause (i) of Sub-section 3 of Section 143 of the Companies act, 2013 (‘the act’)1. In conjunction with our audit of the standalone
financial statements of ITD Cementation India Limited (‘the Company’) as at and for the year ended 31 December 2017, we have audited the internal financial controls over financial reporting (‘IFCoFR’) of the Company as at that date.
managemenT’S ReSponSIbILITy FoR InTeRnaL FInanCIaL ConTRoLS2. The Company’s Board of Directors is responsible
for establishing and maintaining internal financial controls based on the internal control over financial reporting criteria established by the Company considering the essential components of internal control stated in the Guidance Note on Audit of Internal Financial Controls over Financial Reporting (the “Guidance Note”) issued by the Institute of Chartered Accountants of India (“ICAI”). These responsibilities include the design, implementation and maintenance of adequate internal financial controls that were operating effectively for ensuring the orderly and efficient conduct of the Company’s business, including adherence to the Company’s policies, the safeguarding of its assets, the prevention and detection of frauds and errors, the accuracy and completeness of the accounting records, and the timely preparation of reliable financial information, as required under the Act.
auDIToR’S ReSponSIbILITy3. Our responsibility is to express an opinion on the
Company’s IFCoFR based on our audit. We conducted our audit in accordance with the Standards on Auditing issued by the ICAI and deemed to be prescribed under Section 143(10) of the Act, to the extent applicable to an audit of IFCoFR, and the Guidance Note issued by the ICAI. Those Standards and the Guidance Note require that we comply with ethical requirements and plan and perform the
audit to obtain reasonable assurance about whether adequate IFCoFR were established and maintained and if such controls operated effectively in all material respects.
4. Our audit involves performing procedures to obtain audit evidence about the adequacy of the IFCoFR and their operating effectiveness. Our audit of IFCoFR includes obtaining an understanding of IFCoFR, assessing the risk that a material weakness exists, and testing and evaluating the design and operating effectiveness of internal control based on the assessed risk. The procedures selected depend on the auditor’s judgement, including the assessment of the risks of material misstatement of the financial statements, whether due to fraud or error.
5. We believe that the audit evidence we have obtained is sufficient and appropriate to provide a basis for our audit opinion on the Company’s IFCoFR.
meanIng oF InTeRnaL FInanCIaL ConTRoLS oveR FInanCIaL RepoRTIng6. A company’s IFCoFR is a process designed to provide
reasonable assurance regarding the reliability of financial reporting and the preparation of financial statements for external purposes in accordance with generally accepted accounting principles. A company’s IFCoFR include those policies and procedures that (1) pertain to the maintenance of records that, in reasonable detail, accurately and fairly reflect the transactions and dispositions of the assets of the company; (2) provide reasonable assurance that transactions are recorded as necessary to permit preparation of financial statements in accordance with generally accepted accounting principles, and that receipts and expenditures of the company are being made only in accordance with authorisations of management and directors of the company; and (3) provide reasonable assurance regarding prevention or timely detection of unauthorised acquisition, use, or disposition of the company’s assets that could have a material effect on the financial statements.

Annual Report 2017
Sta
ndal
one
Fina
ncia
l Sta
tem
ents
Sta
tuto
ry R
epor
tsC
orpo
rate
Ove
rvie
w
99 204
InheRenT LImITaTIonS oF InTeRnaL FInanCIaL ConTRoLS oveR FInanCIaL RepoRTIng7. Because of the inherent limitations of IFCoFR,
including the possibility of collusion or improper management override of controls, material misstatements due to error or fraud may occur and not be detected. Also, projections of any evaluation of the IFCoFR to future periods are subject to the risk that the IFCoFR may become inadequate because of changes in conditions, or that the degree of compliance with the policies or procedures may deteriorate.
opInIon8. In our opinion, the Company has, in all material
respects, adequate internal financial controls over financial reporting and such controls were operating
effectively as at 31 December 2017, based on the internal control over financial reporting criteria established by the Company considering the essential components of internal control stated in the Guidance Note issued by the ICAI.
For Walker Chandiok & Co LLp Chartered AccountantsFirm’s Registration No.: 001076N/N500013
Per Rakesh R. agarwalPartnerMembership No.: 109632
Place: Mumbai Date: 22 February 2018
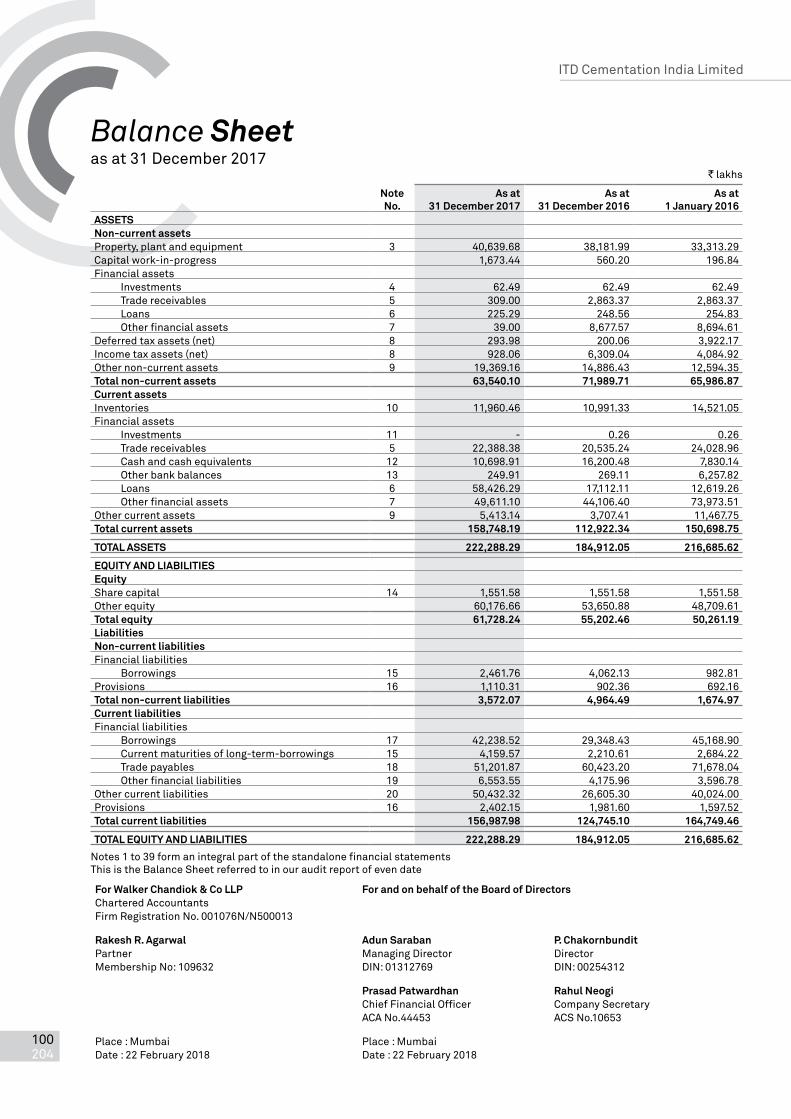
ITD Cementation India Limited
100 204
Balance Sheetas at 31 December 2017
` lakhs
note no.
as at 31 December 2017
as at 31 December 2016
as at 1 January 2016
aSSeTSnon-current assetsProperty, plant and equipment 3 40,639.68 38,181.99 33,313.29Capital work-in-progress 1,673.44 560.20 196.84Financial assets
Investments 4 62.49 62.49 62.49Trade receivables 5 309.00 2,863.37 2,863.37Loans 6 225.29 248.56 254.83Other financial assets 7 39.00 8,677.57 8,694.61
Deferred tax assets (net) 8 293.98 200.06 3,922.17Income tax assets (net) 8 928.06 6,309.04 4,084.92Other non-current assets 9 19,369.16 14,886.43 12,594.35Total non-current assets 63,540.10 71,989.71 65,986.87Current assetsInventories 10 11,960.46 10,991.33 14,521.05Financial assets
Investments 11 - 0.26 0.26Trade receivables 5 22,388.38 20,535.24 24,028.96Cash and cash equivalents 12 10,698.91 16,200.48 7,830.14Other bank balances 13 249.91 269.11 6,257.82Loans 6 58,426.29 17,112.11 12,619.26Other financial assets 7 49,611.10 44,106.40 73,973.51
Other current assets 9 5,413.14 3,707.41 11,467.75Total current assets 158,748.19 112,922.34 150,698.75
ToTaL aSSeTS 222,288.29 184,912.05 216,685.62
equITy anD LIabILITIeSequityShare capital 14 1,551.58 1,551.58 1,551.58Other equity 60,176.66 53,650.88 48,709.61Total equity 61,728.24 55,202.46 50,261.19Liabilitiesnon-current liabilitiesFinancial liabilities
Borrowings 15 2,461.76 4,062.13 982.81Provisions 16 1,110.31 902.36 692.16Total non-current liabilities 3,572.07 4,964.49 1,674.97Current liabilitiesFinancial liabilities
Borrowings 17 42,238.52 29,348.43 45,168.90Current maturities of long-term-borrowings 15 4,159.57 2,210.61 2,684.22Trade payables 18 51,201.87 60,423.20 71,678.04Other financial liabilities 19 6,553.55 4,175.96 3,596.78
Other current liabilities 20 50,432.32 26,605.30 40,024.00Provisions 16 2,402.15 1,981.60 1,597.52Total current liabilities 156,987.98 124,745.10 164,749.46
ToTaL equITy anD LIabILITIeS 222,288.29 184,912.05 216,685.62
Notes 1 to 39 form an integral part of the standalone financial statementsThis is the Balance Sheet referred to in our audit report of even date
For Walker Chandiok & Co LLp For and on behalf of the board of Directors Chartered AccountantsFirm Registration No. 001076N/N500013
Rakesh R. agarwal adun Saraban p. ChakornbunditPartner Managing Director DirectorMembership No: 109632 DIN: 01312769 DIN: 00254312
prasad patwardhan Rahul neogiChief Financial Officer Company SecretaryACA No.44453 ACS No.10653
Place : Mumbai Place : MumbaiDate : 22 February 2018 Date : 22 February 2018

Annual Report 2017
Sta
ndal
one
Fina
ncia
l Sta
tem
ents
Sta
tuto
ry R
epor
tsC
orpo
rate
Ove
rvie
w
101 204
For Walker Chandiok & Co LLp For and on behalf of the board of Directors Chartered AccountantsFirm Registration No. 001076N/N500013
Rakesh R. agarwal adun Saraban p. ChakornbunditPartner Managing Director DirectorMembership No: 109632 DIN: 01312769 DIN: 00254312
prasad patwardhan Rahul neogiChief Financial Officer Company SecretaryACA No.44453 ACS No.10653
Place : Mumbai Place : MumbaiDate : 22 February 2018 Date : 22 February 2018
Statement of Profit and Lossfor the year ended 31 December 2017
` lakhs
note no.
year ended 31 December 2017
year ended 31 December 2016
Income
Revenue from operations 21 187,292.02 291,735.11
Other income 22 3,423.69 2,661.92
Total income 190,715.71 294,397.03
expenses
Cost of construction materials consumed 23 54,351.72 65,536.17
Subcontracting expenses 42,597.64 128,612.76
Employee benefits expense 24 23,614.78 21,921.76
Finance costs 25 8,553.80 8,878.32
Depreciation expense 3 5,520.30 4,583.49
Other expenses 26 41,457.94 54,967.61
Total expenses 176,096.18 284,500.11
profit before exceptional items and tax 14,619.53 9,896.92
Exceptional items 27 (2,183.94) -
profit before tax 12,435.59 9,896.92
Tax expense 8
Current income tax 5,144.47 1,014.31
Deferred income tax 9.48 3,797.99
5,153.95 4,812.30
profit for the year (a) 7,281.64 5,084.62
other comprehensive income (oCI)
Items that will not be reclassified subsequently to profit or loss
- Loss on fair value of defined benefit plans as per actuarial valuation (317.16) (219.23)
- Tax effect on above 109.77 75.88
Items that will be reclassified subsequently to profit or loss
- Fair value change on designated cash flow hedges, net 18.38 -
- Impairment of investment carried at fair value (0.26) -
- Income tax effect on above (6.36) -
other comprehensive loss for the year, net of tax (b) (195.63) (143.35)
Total comprehensive income for the year, net of tax (a+b) 7,086.01 4,941.27
Earnings per equity share of nominal value ` 1 each
Basic and diluted (in `) 28 4.69 3.28
Notes 1 to 39 form an integral part of the standalone financial statements
This is the statement of profit and loss referred to in our audit report of even date

ITD Cementation India Limited
102 204
Cash Flow Statementfor the year ended 31 December 2017
` lakhs
year ended 31 December 2017
year ended 31 December 2016
a. CaSh FLoW FRom opeRaTIng aCTIvITIeS
Net profit before tax 12,435.59 9,896.92
adjustments for
Depreciation expense 5,520.30 4,583.49
Finance cost 8,553.80 8,878.32
Interest income (2,276.92) (2,024.65)
Impairment allowance on financial assets 11,709.23 1,784.87
Share of loss from unincorporated entities (net) 1,337.16 5,579.60
Loss on disposal of property, plant and equipment (net) 657.80 416.27
Excess provision no longer required written back (9,393.43) (206.93)
Exchange loss/(gain) (net) 5.00 (25.64)
operating profit before working capital changes 28,548.53 28,882.25
adjustment for change in working capital
(Increase)/decrease in Inventories (969.13) 3,529.72
(Increase)/decrease in trade receivables (2,611.49) 1,470.62
(Increase)/decrease in loans and advances (43,682.30) 25,382.51
Increase/(decrease) in trade and other payables 16,966.94 (23,565.07)
Cash (used in)/generated from operations (1,747.44) 35,700.03
Direct taxes paid/(refund) [net] 236.51 (3,238.43)
net cash (used in)/generated from operating activities (a) (1,510.93) 32,461.60
b. CaSh FLoW FRom InveSTIng aCTIvITIeS
Purchase of property, plant and equipment (including capital work in progress, capital advances and creditors for capital expenses)
(9,808.98) (9,422.11)
Proceeds from disposal of property, plant and equipment 351.23 82.04
Proceeds from fixed deposit with bank (maturity beyond three months) 21.20 6,000.00
Interest received 1,284.52 1,442.45
net cash used in investing activities (b) (8,152.03) (1,897.62)
C. CaSh FLoW FRom FInanCIng aCTIvITIeS
Proceeds from long-term borrowings 2,672.00 5,812.63
Repayment of long-term borrowings (2,323.42) (3,206.92)
Proceeds from short term borrowings (net) 12,890.10 (15,820.47)
Interest and other finance costs (8,517.06) (8,978.89)
Dividend paid (465.46) -
Tax on distributed profits (94.77) -
net cash generated/(used) in financing activities (C) 4,161.39 (22,193.65)
net (decrease)/increase in cash and cash equivalents (a + b + C) (5,501.57) 8,370.33
Cash and cash equivalents at the beginning of year 16,200.48 7,830.15
Cash and cash equivalents at the end of year 10,698.91 16,200.48

Annual Report 2017
Sta
ndal
one
Fina
ncia
l Sta
tem
ents
Sta
tuto
ry R
epor
tsC
orpo
rate
Ove
rvie
w
103 204
` lakhs
year ended 31 December 2017
year ended 31 December 2016
Components of cash and cash equivalents (Refer note 12)
Cash on hand 65.94 56.59
Balance with banks
- current accounts 2,532.97 2,943.89
- deposit account (with original maturity upto 3 months) 8,100.00 13,200.00
10,698.91 16,200.48
Notes 1 to 39 form an integral part of the standalone financial statements
This is the cash flow statement referred to in our audit report of even date
Cash Flow Statementfor the year ended 31 December 2017
For Walker Chandiok & Co LLp For and on behalf of the board of Directors Chartered AccountantsFirm Registration No. 001076N/N500013
Rakesh R. agarwal adun Saraban p. ChakornbunditPartner Managing Director DirectorMembership No: 109632 DIN: 01312769 DIN: 00254312
prasad patwardhan Rahul neogiChief Financial Officer Company SecretaryACA No.44453 ACS No.10653
Place : Mumbai Place : MumbaiDate : 22 February 2018 Date : 22 February 2018

ITD Cementation India Limited
104 204
Statement of Changes in Equity
a) equity share capital
number of equity shares ` lakhsEquity shares of ` 1 each issued, subscribed and paidAs at 1 January 2016 155,157,900 1,551.58 Changes in equity share capital - -as at 31 December 2016 155,157,900 1,551.58 Changes in equity share capital - -as at 31 December 2017 155,157,900 1,551.58
b) other equity` lakhs
Reserves and surplus other comprehensive income Total equity attributable
to equity holders
Securities premium
reserve
general reserve
Retained earnings
Loss on fair value
of defined benefit
plans
hedge reserve
Impairment of
investment carried at fair value
as at 1 January 2016 45,556.44 676.48 2,476.69 - - - 48,709.61Profit for the year - - 5,084.62 - - - 5,084.62Other comprehensive income for the year - - - (143.35) - - (143.35)
as at 31 December 2016 45,556.44 676.48 7,561.31 (143.35) - - 53,650.88Payment of dividend and dividend distribution tax - - (560.23) - - - (560.23)
Profit for the year - - 7,281.64 - - - 7,281.64Other comprehensive income for the year - - - (207.39) 12.02 (0.26) (195.63)
as at 31 December 2017 45,556.44 676.48 14,282.72 (350.74) 12.02 (0.26) 60,176.66
nature and purpose of reserves i. Securities premium reserve Securities premium reserve is used to record the premium on issue of shares. The reserve will be utilised in
accordance with the provisions of the Act.
ii. Loss on fair value of defined benefit plans The Company has recognised remeasurement loss (net of tax) on defined benefit plans in OCI. These changes
are accumulated within the OCI reserve within other equity. The Company transfers amounts from this reserve to retained earnings when the relevant obligations are derecognised.
iii. hedge reserve The Company has recognised changes in the fair value of forward contracts that are designated and effective
as hedges of future cash flows in OCI under hedge reserve, net of applicable deferred income taxes. Amounts accumulated under the hedging cash flow hedge reserve are reclassified to the statement of profit and loss in the same period during which the forecasted transaction affects to the statement of profit and loss.
Notes 1 to 39 form an integral part of the standalone financial statements This is the Statement of Changes in Equity referred to in our audit report of even date
for the year ended 31 December 2017
For Walker Chandiok & Co LLp For and on behalf of the board of Directors Chartered AccountantsFirm Registration No. 001076N/N500013
Rakesh R. agarwal adun Saraban p. ChakornbunditPartner Managing Director DirectorMembership No: 109632 DIN: 01312769 DIN: 00254312
prasad patwardhan Rahul neogiChief Financial Officer Company SecretaryACA No.44453 ACS No.10653
Place : Mumbai Place : MumbaiDate : 22 February 2018 Date : 22 February 2018

Summary of significant accounting policies and other explanatory information to the standalone financial statements as at and for the year ended 31 December 2017
Annual Report 2017
Sta
ndal
one
Fina
ncia
l Sta
tem
ents
Sta
tuto
ry R
epor
tsC
orpo
rate
Ove
rvie
w
105 204
noTe 1 - CoRpoRaTe InFoRmaTIonITD Cementation India Limited (‘ITD Cem’ or ‘the Company’) is a public company domiciled in India and was incorporated in 1978 under the provisions of the erstwhile Companies Act, 1956. The Company having CIN L61000MH1978PLC020435, is engaged in construction of a wide variety of structures like maritime structures, mass rapid transport systems (MRTS), dams & tunnels, airports, highways, bridges & flyovers and other foundations and specialised engineering work. The activities of the Company comprise only one business segment viz Construction. Its shares are listed on two recognised stock exchanges in India - the BSE Limited and the National Stock Exchange of India Limited. The registered office of the Company is located at National Plastic Building, A Subhash Road, Paranjape B Scheme, Vile Parle (East), Mumbai 400057, India.
The standalone financial statements were authorised for issue in accordance with a resolution of the Board of Directors on 22 February 2018.
noTe 2.1 - SIgnIFICanT aCCounTIng poLICIeSi basis of preparation The financial statements of the Company have been prepared to comply in all material respects with the Indian
Accounting Standards (“Ind AS”) notified under the Companies (Accounting Standards) Rules, 2015.
The financial statements for all periods upto and including year ended 31 December 2016 were prepared in accordance with the Companies (Accounting Standards) Rules, 2006 notified under Section 133 of the Companies Act, 2013 (“the Act”), read with Rule 7 of the Companies (Accounts) Rules, 2014 (as amended) (“previous GAAP”). The financial statements for the year ended 31 December 2017 are the first financial statements prepared by the Company in accordance with Ind AS. Refer note 2.3 for information on how the Company adopted Ind AS.
The financial statements have been prepared under the historical cost convention, with the exception of certain financial assets and liabilities which have been measured at fair value, on an accrual basis.
The Company’s financial statements are reported in Indian Rupees, which is also the Company’s functional currency, and all values are rounded to the nearest lakhs (` 00,000), except when otherwise indicated.
ii operating cycle for current and non-current classification: All the assets and liabilities have been classified as current or non-current, wherever applicable, as per the
operating cycle of the Company as per the guidance set out in Schedule III to the Act. Operating cycle for the business activities of the Company covers the duration of the project/ contract/ service including the defect liability period, wherever applicable, and extends upto the realisation of receivables (including retention monies) within the credit period normally applicable to the respective project.
iii accounting estimates The preparation of the financial statements, in conformity with the recognition and measurement principles of Ind
AS, requires the management to make estimates and assumptions that affect the reported amounts of assets and liabilities and disclosure of contingent liabilities as at the date of financial statements and the results of operation during the reported period. Although these estimates are based upon management’s best knowledge of current events and actions, actual results could differ from these estimates which are recognised in the period in which they are determined.
estimates and assumptions The key assumptions concerning the future and other key sources of estimation uncertainty at the reporting date,
that have a significant risk of causing a material adjustment to the carrying amounts of assets and liabilities within the next financial year, are described below. The Company based its assumptions and estimates on parameters available when the financial statements were prepared. Existing circumstances and assumptions about future developments, however, may change due to market changes or circumstances arising that are beyond the control

Summary of significant accounting policies and other explanatory information to the standalone financial statements as at and for the year ended 31 December 2017
ITD Cementation India Limited
106 204
of the Company. Such changes are reflected in the financial statements in the period in which changes are made and, if material, their effects are disclosed in the notes to the financial statements.
Contract estimates The Company, being a part of construction industry, prepares budgets in respect of each project to compute
project profitability. The two major components of contract estimate are ‘claims arising during construction period’ (described below) and ‘budgeted costs to complete the contract’. While estimating these components various assumptions are considered by the management such as (i) Work will be executed in the manner expected so that the project is completed timely (ii) consumption norms will remain same (iii) Assets will operate at the same level of productivity as determined (iv) Wastage will not exceed the normal % as determined etc. (v) Estimates for contingencies (vi) No change in design and the geological factors will be same as communicated; and (vii) Price escalations etc. Due to such complexities involved in the budgeting process, contract estimates are highly sensitive to changes in these assumptions. All assumptions are reviewed at each reporting date.
Recoverability of claims The Company has claims in respect of cost over-run arising due to client caused delays, suspension of projects,
deviation in design and change in scope of work etc., which are at various stages of negotiation/discussion with the clients or under arbitration. The realisability of these claims are estimated based on contractual terms, historical experience with similar claims as well as legal opinion obtained from internal and external experts, wherever necessary. Changes in facts of the case or the legal framework may impact ultimate realisability of these claims.
Defined benefit plans The cost and present value of the gratuity obligation and compensated absences are determined using actuarial
valuations. An actuarial valuation involves making various assumptions that may differ from actual developments in the future. These include the determination of the discount rate, future salary increases, attrition rate and mortality rates. Due to the complexities involved in the valuation and its long-term nature, a defined benefit obligation is highly sensitive to changes in these assumptions. All assumptions are reviewed at each reporting date.
Deferred tax assets In assessing the realisability of deferred income tax assets, management considers whether some portion or all
of the deferred income tax assets will not be realized. The ultimate realization of deferred income tax assets is dependent upon the generation of future taxable income during the periods in which the temporary differences become deductible. Management considers the scheduled reversals of deferred income tax liabilities, projected future taxable income, and tax planning strategies in making this assessment. Based on the level of historical taxable income and projections for future taxable income over the periods in which the deferred income tax assets are deductible, management believes that the Company will realize the benefits of those deductible differences. The amount of the deferred income tax assets considered realizable, however, could be reduced in the near term if estimates of future taxable income during the carry forward period are reduced.
iv Fair value measurement The Company measures financial instruments, at fair value at each balance sheet date. (Refer Note 34)
Fair value is the price that would be received to sell an asset or paid to transfer a liability in an orderly transaction between market participants at the measurement date. The fair value measurement is based on the presumption that the transaction to sell the asset or transfer the liability takes place either:
- In the principal market for the asset or liability, or
- In the absence of a principal market, In the most advantageous market for the asset or liability.
The principal or the most advantageous market must be accessible by the Company.

Summary of significant accounting policies and other explanatory information to the standalone financial statements as at and for the year ended 31 December 2017
Annual Report 2017
Sta
ndal
one
Fina
ncia
l Sta
tem
ents
Sta
tuto
ry R
epor
tsC
orpo
rate
Ove
rvie
w
107 204
The fair value of an asset or a liability is measured using the assumptions that market participants would use when pricing the asset or liability, assuming that market participants act in their economic best interest.
A fair value measurement of a non-financial asset takes into account a market participant’s ability to generate economic benefits by using the asset in its highest and best use or by selling it to another market participant that would use the asset in its highest and best use.
The Company uses valuation techniques that are appropriate in the circumstances and for which sufficient data is available to measure fair value, maximising the use of relevant observable inputs and minimising the use of unobservable inputs. All assets and liabilities for which fair value is measured or disclosed in the financial statements are categorized within the fair value hierarchy, described as follows, based on the lowest level input that is significant to the fair value measurement as a whole:
Level 1 - Quoted prices (unadjusted) in active markets for identical assets or liabilities.
Level 2 - Inputs other than quoted prices included within Level 1 that are observable for the asset or liability, either directly (i.e. as prices) or indirectly (i.e., derived from prices).
Level 3 - Inputs for the assets or liabilities that are not based on observable market data (unobservable inputs).
For assets and liabilities that are recognised in the financial statements on a recurring basis, the Company determines whether transfers have occurred between levels in the hierarchy by re-assessing categorisation (based on the lowest level input that is significant to the fair value measurement as a whole) at the end of each reporting period.
At each reporting date, the Management analyses the movements in the values of assets and liabilities which are required to be remeasured or re-assessed as per the Company’s accounting policies. For this analysis, the Management verifies the major inputs applied in the latest valuation by agreeing the information in the valuation computation to contracts and other relevant documents.
The Management also compares the change in the fair value of each asset and liability with relevant external sources to determine whether the change is reasonable.
v property, plant and equipment Property, Plant and Equipment are stated at cost of acquisition till the date of acquisition/ installation of the assets
less accumulated depreciation and accumulated impairment losses, if any. Subsequent expenditure relating to Property, Plant and Equipment is capitalised only when it is probable that future economic benefits associated with the item will flow to the Company and the cost of the item can be measured reliably. All other repairs and maintenance costs are charged to the Statement of Profit and Loss as incurred. The cost and related accumulated depreciation are eliminated from the financial statements, either on disposal or when retired from active use and the resultant gain or loss are recognised in the Statement of Profit and Loss.
Capital work-in-progress, representing expenditure incurred in respect of assets under development and not ready for their intended use, are carried at cost. Cost includes related acquisition expenses, construction cost and other direct expenditure.
Pursuant to transition to Indian Accounting Standard, on the date of transition i.e. 1 January 2016; the Tools and equipment as at 31 December 2015 hitherto included under inventories have been reclassified to Property, Plant and Equipment.

Summary of significant accounting policies and other explanatory information to the standalone financial statements as at and for the year ended 31 December 2017
ITD Cementation India Limited
108 204
On transition to Ind AS, the Company has opted to continue with the carrying values measured under the previous GAAP as at 1 January 2016 of its Property, Plant and Equipment and use that carrying value as the deemed cost of the Property, Plant and Equipment on the date of transition i.e. 1 January 2016.
vi Depreciation expenses Depreciation is calculated on a straight line method using the useful lives as prescribed in Schedule II to the Act or
in case of assets where useful lives were determined by technical evaluation and management’s experience of use of those assets, over the useful life so determined. Depreciation on additions to/deductions from owned assets is calculated pro-rata to the period of use.
Depreciation method is reviewed at each financial year end to reflect the expected pattern of consumption of the future economic benefits embodied in the asset. The estimated useful life and residual values are also reviewed at each financial year end and the effect of any change in the estimates of useful life/residual value is accounted on prospective basis.
An asset’s carrying value is written down immediately to its recoverable amount if the asset’s carrying value is greater than the estimated recoverable amount.
The estimated useful lives of items of Property, Plant and Equipment for current and comparative periods are as follows:
asset Class useful lives
Leasehold improvements Lease period or 5 years, whichever is lower
Buildings 60 years
Leasehold buildings Lease period or 60 years, whichever is lower
Plant and equipment (including tools and equipment) 3 - 21 years
Vehicles 8 years
Office equipment 5 years
Furniture and fixtures 10 years
Computer equipment 3 - 6 years
Freehold land is carried at historical costs
vii Financial Instruments A financial instrument is any contract that gives rise to a financial asset of one entity and a financial liability or
equity instrument of another entity.
a Financial assets (i) Initial Recognition In the case of financial assets, not recorded at fair value through profit or loss (FVPL), financial assets are
recognised initially at fair value plus transaction costs that are directly attributable to the acquisition of the financial asset. Purchases or sales of financial assets that require delivery of assets within a time frame established by regulation or convention in the market place (regular way trades) are recognised on the trade date i.e., the date that the Company commits to purchase or sell the asset.

Summary of significant accounting policies and other explanatory information to the standalone financial statements as at and for the year ended 31 December 2017
Annual Report 2017
Sta
ndal
one
Fina
ncia
l Sta
tem
ents
Sta
tuto
ry R
epor
tsC
orpo
rate
Ove
rvie
w
109 204
(ii) Subsequent Measurement For purposes of subsequent measurement, financial assets are classified in following categories:
- Financial Assets at Amortised Cost Financial assets are subsequently measured at amortised cost if these financial assets are held within a
business model with an objective to hold these assets in order to collect contractual cash flows and the contractual terms of the financial asset give rise on specified dates to cash flows that are solely payments of principal and interest on the principal amount outstanding. Interest income from these financial assets is included in finance income using the effective interest rate (“EIR”) method. Impairment gains or losses arising on these assets are recognised in the Statement of Profit and Loss.
- Financial Assets Measured at Fair Value Financial assets are subsequently measured at fair value through OCI if these financial assets are held
within a business model with an objective to hold these assets in order to collect contractual cash flows and to sell these financial assets and the contractual terms of the financial asset give rise on specified dates to cash flows that are solely payments of principal and interest on the principal amount outstanding. Movements in the carrying amount are taken through OCI, except for the recognition of impairment gains or losses, interest revenue and foreign exchange gains and losses which are recognised in the Statement of Profit and Loss.
Financial asset not measured at amortised cost or at fair value through OCI is carried at FVPL.
On transition to Ind AS, the Company has opted to continue with the carrying values measured under the previous GAAP as at 1 January 2016 of its equity investments in subsidiary and used that carrying value as the deemed cost of these investments on the date of transition i.e. 1 January 2016.
(iii) Impairment of Financial Assets In accordance with Ind AS 109, the Company applies the Expected Credit Loss (“ECL”) model for measurement
and recognition of impairment loss on financial assets and credit risk exposures.
The Company follows ‘simplified approach’ for recognition of impairment loss allowance on trade receivables. Simplified approach does not require the Company to track changes in credit risk. Rather, it recognises impairment loss allowance based on lifetime ECL at each reporting date, right from its initial recognition.
For recognition of impairment loss on other financial assets and risk exposure, the Company determines that whether there has been a significant increase in the credit risk since initial recognition. If credit risk has not increased significantly, 12-month ECL is used to provide for impairment loss. However, if credit risk has increased significantly, lifetime ECL is used. If, in a subsequent period, credit quality of the instrument improves such that there is no longer a significant increase in credit risk since initial recognition, then the entity reverts to recognising impairment loss allowance based on 12-month ECL.
ECL is the difference between all contractual cash flows that are due to the Company in accordance with the contract and all the cash flows that the entity expects to receive (i.e., all cash shortfalls), discounted at the original EIR. Lifetime ECL are the expected credit losses resulting from all possible default events over the expected life of a financial instrument. The 12-month ECL is a portion of the lifetime ECL which results from default events that are possible within 12 months after the reporting date.
ECL impairment loss allowance (or reversal) during the period is recognised as income/expense in the Statement of Profit and Loss.

Summary of significant accounting policies and other explanatory information to the standalone financial statements as at and for the year ended 31 December 2017
ITD Cementation India Limited
110 204
(iv) De-recognition of Financial Assets The Company de-recognises a financial asset only when the contractual rights to the cash flows from the
asset expire, or it transfers the financial asset and substantially all risks and rewards of ownership of the asset to another entity.
If the Company neither transfers nor retains substantially all the risks and rewards of ownership and continues to control the transferred asset, the Company recognizes its retained interest in the assets and an associated liability for amounts it may have to pay.
If the Company retains substantially all the risks and rewards of ownership of a transferred financial asset, the Company continues to recognise the financial asset and also recognises a collateralised borrowing for the proceeds received.
b equity Instruments and Financial Liabilities Financial liabilities and equity instruments issued by the Company are classified according to the substance of
the contractual arrangements entered into and the definitions of a financial liability and an equity instrument.
Equity Instruments An equity instrument is any contract that evidences a residual interest in the assets of the Company after
deducting all of its liabilities. Equity instruments which are issued for cash are recorded at the proceeds received, net of direct issue costs. Equity instruments which are issued for consideration other than cash are recorded at fair value of the equity instrument.
Financial Liabilities (i) Initial Recognition Financial liabilities are classified, at initial recognition, as financial liabilities at FVPL, loans and
borrowings and payables as appropriate. All financial liabilities are recognised initially at fair value and, in the case of loans and borrowings and payables, net of directly attributable transaction costs.
(ii) Subsequent Measurement
Non-derivative financial instruments The measurement of financial liabilities depends on their classification, as described below :
- Financial liabilities at FVPL Financial liabilities at FVPL include financial liabilities held for trading and financial liabilities
designated upon initial recognition as at FVPL. Financial liabilities are classified as held for trading if they are incurred for the purpose of repurchasing in the near term. Gains or losses on liabilities held for trading are recognised in the Statement of Profit and Loss.
Financial guarantee contracts issued by the Company are those contracts that require a payment to be made to reimburse the holder for a loss it incurs because the specified debtor fails to make a payment when due in accordance with the terms of a debt instrument. Financial guarantee contracts are recognised initially as a liability at fair value, adjusted for transaction costs that are directly attributable to the issuance of the guarantee. Subsequently, the liability is measured at the higher of the amount of loss allowance determined as per impairment requirements of Ind AS 109 and the amount recognised less cumulative amortisation. Amortisation is recognised as finance income in the Statement of Profit and Loss.
- Financial liabilities at amortised cost After initial recognition, interest-bearing loans and borrowings are subsequently measured at
amortised cost using the EIR method. Any difference between the proceeds (net of transaction costs) and the settlement or redemption of borrowings is recognised over the term of the borrowings in the Statement of Profit and Loss.

Summary of significant accounting policies and other explanatory information to the standalone financial statements as at and for the year ended 31 December 2017
Annual Report 2017
Sta
ndal
one
Fina
ncia
l Sta
tem
ents
Sta
tuto
ry R
epor
tsC
orpo
rate
Ove
rvie
w
111 204
Amortised cost is calculated by taking into account any discount or premium on acquisition and fees or costs that are an integral part of the EIR. The EIR amortisation is included as finance costs in the Statement of Profit and Loss.
Derivative financial instruments The Company uses derivative financial instruments i.e. foreign exchange forward and options contracts
to manage its exposure to foreign exchange risks. Such derivative financial instruments are initially recognized at fair value on the date on which a derivative contract is entered into and are subsequently re-measured at fair value. The Company uses hedging instruments that are governed by the policies of the Company.
Hedge Accounting The Company uses foreign currency forward and options contracts to hedge its risks associated with
foreign currency fluctuations relating to highly probable forecast transactions. The Company designates such forward contracts in a cash flow hedging relationship by applying the hedge accounting principles. These forward contracts are stated at fair value at each reporting date. Changes in the fair value of these forward contracts that are designated and effective as hedges of future cash flows are recognized directly in OCI and accumulated under the hedging cash flow hedge reserve, net of applicable deferred income taxes and the ineffective portion is recognized immediately to the statement of profit and loss. Amounts accumulated under the hedging cash flow hedge reserve are reclassified to the statement of profit and loss in the same period during which the forecasted transaction affects to the statement of profit and loss. For forecasted transactions, any cumulative gain or loss on the hedging instrument recognized under the hedging cash flow hedge reserve is retained until the forecasted transaction occurs. If the forecasted transaction is no longer expected to occur, the net cumulative gain or loss recognized under the hedging cash flow hedge reserve is immediately transferred to the statement of profit and loss.
(iii) De-recognition of Financial Liabilities Financial liabilities are de-recognised when the obligation specified in the contract is discharged,
cancelled or expired. When an existing financial liability is replaced by another from the same lender on substantially different terms, or the terms of an existing liability are substantially modified, such an exchange or modification is treated as de-recognition of the original liability and recognition of a new liability. The difference in the respective carrying amounts is recognised in the Statement of Profit and Loss.
c offsetting Financial Instruments Financial assets and financial liabilities are offset and the net amount is reported in the Balance Sheet if there
is a currently enforceable legal right to offset the recognised amounts and there is an intention to settle on a net basis to realise the assets and settle the liabilities simultaneously.
viii employee benefits a Defined Contribution plan Contributions to defined contribution schemes such as supperannuation plan, employees’ state insurance,
labour welfare are charged as an expense based on the amount of contribution required to be made as and when services are rendered by the employees. The above benefits are classified as Defined Contribution Schemes as the Company has no further obligations beyond the monthly contributions.
b Defined benefit plan The Provident Fund set up by the Company is administered through trusts of the Company. Interest rate
payable to the members of the trust shall not be lower than the statutory rate of interest declared by Central Goverment under Employees Provident Fund and Miscellaneous Proivisions Act, 1952 and shortfall, if any, shall be made good by the Company. The contribution paid or payable including the interest shortfall, if any, is recognised as an expense in the period in which services are rendered by the employee. Accordingly the Provident Fund is treated as a defined benefit plan. Further, the pattern of investments for investible funds is

Summary of significant accounting policies and other explanatory information to the standalone financial statements as at and for the year ended 31 December 2017
ITD Cementation India Limited
112 204
as prescribed by the Government. Accordingly, other related disclosures in respect of provident fund have not been made.
The Company also provides for gratuity which is a defined benefit plan, the liabilities of which is determined based on valuations, as at the balance sheet date, made by an independent actuary using the projected unit credit method. Re-measurement, comprising of actuarial gains and losses, in respect of gratuity are recognised in the OCI, in the period in which they occur. Re-measurement recognised in OCI are not reclassified to the Statement of Profit and Loss in subsequent periods. Past service cost is recognised in the Statement of Profit and Loss in the year of plan amendment or curtailment. The classification of the Company’s obligation into current and non-current is as per the actuarial valuation report.
c Leave entitlement and compensated absences Accumulated leave which is expected to be utilised within next twelve months, is treated as short-term
employee benefit. Leave entitlement, other than short term compensated absences, are provided based on a actuarial valuation, similar to that of gratuity benefit. Re-measurement, comprising of actuarial gains and losses, in respect of leave entitlement are recognised in the Statement of Profit and Loss in the period in which they occur.
d Short-term benefits Short-term employee benefits such as salaries, wages, performance incentives etc. are recognised as
expenses at the undiscounted amounts in the Statement of Profit and Loss of the period in which the related service is rendered. Expenses on non-accumulating compensated absences is recognised in the period in which the absences occur.
ix Inventories i. Construction materials are valued at lower of cost and net realisable value. Cost is determined on a first-in,
first-out method and comprises the purchase price including duties and taxes (other than those subsequently recoverable by the Company from the taxing authorities). Net Realisable value is the estimated selling price in the ordinary course of business less the estimated cost necessary to make the sale.
ii. Spares that are of regular use are charged to the statement of profit and loss as and when consumed.
x Cash and Cash equivalents Cash and cash equivalents in the Balance Sheet comprises of cash at banks and on hand and short-term deposits
with an original maturity of three month or less, which are subject to an insignificant risk of changes in value.
xi Segment Reporting Operating segments are reported in a manner consistent with the internal reporting provided to the chief operating
decision maker. The chief operating decision maker regularly monitors and reviews the operating result of the whole Company as one segment of “Construction”. Thus, as defined in Ind AS 108 “Operating Segments”, the Company’s entire business falls under this one operational segment and hence the necessary information has already been disclosed in the Balance Sheet and the Statement of Profit and Loss.
xii Foreign exchange Translation of Foreign projects and accounting of Foreign exchange Transaction a Initial Recognition Foreign currency transactions are initially recorded in the reporting currency, by applying to the foreign
currency amount the exchange rate between the reporting currency and the foreign currency at the date of the transaction.

Summary of significant accounting policies and other explanatory information to the standalone financial statements as at and for the year ended 31 December 2017
Annual Report 2017
Sta
ndal
one
Fina
ncia
l Sta
tem
ents
Sta
tuto
ry R
epor
tsC
orpo
rate
Ove
rvie
w
113 204
b Conversion Monetary assets and liabilities denominated in foreign currencies are reported using the closing rate at the
reporting date. Non-monetary items which are carried in terms of historical cost denominated in a foreign currency are reported using the exchange rate at the date of the transaction.
c Treatment of exchange Difference Exchange differences arising on settlement/ restatement of foreign currency monetary assets and liabilities
of the Company are recognised as income or expense in the Statement of Profit and Loss.
xiii Revenue Recognition a accounting of Construction Contracts Revenue from construction contracts is recognised on the basis of percentage completion method. The stage
of completion of a contract is determined by the proportion that contract costs incurred for work performed upto the reporting date bear to the estimated total contract costs. Contract revenue earned in excess of certification has been classified as “Unbilled revenue” under Other Financial Asset and certification in excess of contract revenue has been classified as “Amount due to customer” under Other Current Liabilities in the financial statements.
In addition, if it is expected that the contract will make a loss, the estimated loss is immediately provided for in the books of account.
Advance payments received from contractee for which no services are rendered are presented as ‘Advances from contractee’.
b Share of profit and loss from unincorporated entities in the nature of Subsidiary, Joint venture or Joint operations
In case of Unincorporated Entities in the nature of subsidiary / joint venture, share of profit and loss are recognised in the Statement of Profit and Loss as and when the right to receive the profit share or obligation to settle the loss is established.
In case of Unincorporated Entities in the nature of a Joint Operation; the Company recognises its direct right to the assets, liabilities, contingent liabilities, revenues and expenses of joint operations and its share of any jointly held or incurred assets, liabilities, revenues and expenses. These have been incorporated in the financial statements under the appropriate headings.
c accounting for Claims Amounts recoverable in respect of the price and other escalation, bonus claims adjudication and variation in
contract work required for performance of the contract to the extent that it is probable that they will result in revenue.
d Finance and other Income Finance income is accrued on a time proportion basis, by reference to the principal outstanding and the
applicable effective interest rate. Other income is accounted for on accrual basis. Where the receipt of income is uncertain, it is accounted for on receipt basis.
xiv Income Tax Income tax comprises of current and deferred income tax. Income tax is recognised as an expense or income in the
Statement of Profit and Loss, except to the extent it relates to items directly recognised in equity or in OCI.

Summary of significant accounting policies and other explanatory information to the standalone financial statements as at and for the year ended 31 December 2017
ITD Cementation India Limited
114 204
a Current Income Tax Current income tax is recognised based on the estimated tax liability computed after taking credit for
allowances and exemptions in accordance with the Income Tax Act, 1961. Current income tax assets and liabilities are measured at the amount expected to be recovered from or paid to the taxation authorities. The tax rates and tax laws used to compute the amount are those that are enacted or substantively enacted, at the reporting date.
b Deferred Income Tax Deferred tax is determined by applying the Balance Sheet approach. Deferred tax assets and liabilities are
recognised for all deductible temporary differences between the financial statements’ carrying amount of existing assets and liabilities and their respective tax base. Deferred tax assets and liabilities are measured using the enacted tax rates or tax rates that are substantively enacted at the Balance Sheet date. The effect on deferred tax assets and liabilities of a change in tax rates is recognised in the period that includes the enactment date. Deferred tax assets are only recognised to the extent that it is probable that future taxable profits will be available against which the temporary differences can be utilised. Such assets are reviewed at each Balance Sheet date to reassess realisation.
Deferred tax assets and liabilities are offset when there is a legally enforceable right to offset current tax assets and liabilities. Current tax assets and tax liabilities are offset where the entity has a legally enforceable right to offset and intends either to settle on a net basis, or to realise the asset and settle the liability simultaneously.
Minimum Alternate Tax (MAT) paid as per Indian Income Tax Act, 1961 is in the nature of unused tax credit which can be carried forward and utilised when the Company will pay normal income tax during the specified period. Deferred tax assets on such tax credit is recognised to the extent that it is probable that the unused tax credit can be utilised in the specified future period.
xv Leases Leases, where the lessor effectively retains substantially all the risks and benefits of ownership over the leased
term, are classified as operating leases. Operating lease payments are recognised as an expense in the Statement of Profit and Loss on a straight-line basis over the lease term except where the lease payments are structured to increase in line with expected general inflation.
Assets acquired on finance lease are capitalised at fair value or present value of minimum lease payment at the inception of the lease, whichever is lower.
xvi Impairment of non-Financial assets As at each Balance Sheet date, the Company assesses whether there is an indication that a non-financial asset
may be impaired and also whether there is an indication of reversal of impairment loss recognised in the previous periods. If any indication exists, or when annual impairment testing for an asset is required, the Company determines the recoverable amount and impairment loss is recognised when the carrying amount of an asset exceeds its recoverable amount.
Recoverable amount is determined: - In case of an individual asset, at the higher of the assets’ fair value less cost to sell and value in use; and
- In case of cash generating unit (a group of assets that generates identified, independent cash flows), at the higher of cash generating unit’s fair value less cost to sell and value in use.
In assessing value in use, the estimated future cash flows are discounted to their present value using pre-tax discount rate that reflects current market assessments of the time value of money and risk specified to the asset. In determining fair value less cost to sell, recent market transaction are taken into account. If no such transaction can be identified, an appropriate valuation model is used.

Summary of significant accounting policies and other explanatory information to the standalone financial statements as at and for the year ended 31 December 2017
Annual Report 2017
Sta
ndal
one
Fina
ncia
l Sta
tem
ents
Sta
tuto
ry R
epor
tsC
orpo
rate
Ove
rvie
w
115 204
Impairment losses of continuing operations, including impairment on inventories, are recognised in the Statement of Profit and Loss, except for properties previously revalued with the revaluation taken to OCI. For such properties, the impairment is recognised in OCI up to the amount of any previous revaluation.
When the Company considers that there are no realistic prospects of recovery of the asset, the relevant amounts are written off. If the amount of impairment loss subsequently decreases and the decrease can be related objectively to an event occurring after the impairment was recognised, then the previously recognised impairment loss is reversed through the Statement of Profit and Loss.
xvii Trade receivables A receivable is classified as a ‘trade receivable’ if it is in respect of the amount due on account of goods sold or
services rendered in the normal course of business. Trade receivables are recognised initially at fair value and subsequently measured at amortised cost using the EIR method, less provision for impairment.
xviii Trade payables A payable is classified as a ‘trade payable’ if it is in respect of the amount due on account of goods purchased or
services received in the normal course of business. These amounts represent liabilities for goods and services provided to the Company prior to the end of the financial year which are unpaid. These amounts are unsecured and are usually settled as per the payment terms stated in the contract. Trade and other payables are presented as current liabilities unless payment is not due within 12 months after the reporting period. They are recognised initially at their fair value and subsequently measured at amortised cost using the EIR method.
xix earnings per Share Basic earnings per share is computed by dividing the net profit or loss for the period attributable to the equity
shareholders of the Company by the weighted average number of equity shares outstanding during the period. The weighted average number of equity shares outstanding during the period and for all periods presented is adjusted for events, such as bonus shares, other than the conversion of potential equity shares, that have changed the number of equity shares outstanding, without a corresponding change in resources.
Diluted earnings per share is computed by dividing the net profit or loss for the period attributable to the equity shareholders of the Company and weighted average number of equity shares considered for deriving basic earnings per equity share and also the weighted average number of equity shares that could have been issued upon conversion of all dilutive potential equity shares. The dilutive potential equity shares are adjusted for the proceeds receivable had the equity shares been actually issued at fair value (i.e. the average market value of the outstanding equity shares).
xx provisions, Contingent Liabilities and Contingent assets A provision is recognised when the Company has a present obligation (legal or constructive) as a result of past
events and it is probable that an outflow of resources embodying economic benefits will be required to settle the obligation, in respect of which a reliable estimate can be made of the amount of obligation. Provisions (excluding gratuity and compensated absences) are determined based on management’s estimate required to settle the obligation at the Balance Sheet date. In case the time value of money is material, provisions are discounted using a current pre-tax rate that reflects the risks specific to the liability. When discounting is used, the increase in the provision due to the passage of time is recognised as a finance cost. These are reviewed at each Balance Sheet date and adjusted to reflect the current management estimates.
Contingent liabilities are disclosed in respect of possible obligations that arise from past events, whose existence would be confirmed by the occurrence or non-occurrence of one or more uncertain future events not wholly within the control of the Company. A contingent liability also arises, in rare cases, where a liability cannot be recognised because it cannot be measured reliably.
Contingent assets are neither recognised nor disclosed in the financial statements.

Summary of significant accounting policies and other explanatory information to the standalone financial statements as at and for the year ended 31 December 2017
ITD Cementation India Limited
116 204
xxi exceptional Items When items of income and expense within profit or loss from ordinary activities are of such size, nature or incidence
that their disclosure is relevant to explain the performance of the enterprise for the period, the nature and amount of such material items are disclosed separately as exceptional items.
noTe 2.2 - ReCenT aCCounTIng pRonounCemenTSStandards issued but not yet effectiveIn March 2017, the Ministry of Corporate Affairs issued the Companies (Indian Accounting Standards) (Amendments) Rules, 2017, notifying amendments to Ind AS 7, ‘Statement of cash flows’. These amendments are in accordance with the recent amendments made by International Accounting Standards Board (IASB) to IAS 7, ‘Statement of cash flows’. The amendments are applicable to the Company from 1 January 2018.
amendment to Ind aS 7:The amendment to Ind AS 7 requires the entities to provide disclosures that enable users of financial statements to evaluate changes in liabilities arising from financing activities, including both changes arising from cash flows and non-cash changes, suggesting inclusion of a reconciliation between the opening and closing balances in the balance sheet for liabilities arising from financing activities, to meet the disclosure requirement.
The Company is evaluating the requirements of the amendment and the effect on the financial statements is being evaluated.
noTe 2.3 - DISCLoSuReS aS RequIReD by InDIan aCCounTIng STanDaRD (InD aS) 101 FIRST TIme aDopTIon oF InDIan aCCounTIng STanDaRDThe Company has adopted Ind AS with effect from 1 January 2017 with comparatives being restated. Accordingly the impact of transition has been provided in the Opening Reserves as at 1 January 2016 and all the periods presented have been restated accordingly.
i exemptions availed on first time adoption of Ind aS 101: On first time adoption of Ind AS, Ind AS 101 allows certain exemptions from the retrospective application of certain
requirements under Ind AS. The Company has availed the following exemptions:
a Since, there is no change in the functional currency of the Company, it has opted to continue with the carrying values measured under the previous GAAP and use that carrying value as the deemed cost for property, plant and equipment and intangible assets on the date of transition.
b The Company has opted to continue with the carrying values measured under the previous GAAP and use that carrying value as the deemed cost for equity investments on the date of transition to Ind AS.
c Fair value measurement of financial assets or liabilities at initial recognition: The Company has not applied the provision of Ind AS 109, Financial Instruments, upon the initial recognition of the financial instruments where there is no active market.
d Designation of previously recognised financial instruments: The Company does not have any financial assets or liabilities as of the transition dates which were required to be designated, and which met the required criteria given in Ind AS 101, as a financial asset or financial liability at FVPL.

Summary of significant accounting policies and other explanatory information to the standalone financial statements as at and for the year ended 31 December 2017
Annual Report 2017
Sta
ndal
one
Fina
ncia
l Sta
tem
ents
Sta
tuto
ry R
epor
tsC
orpo
rate
Ove
rvie
w
117 204
ii exceptions The following mandatory exceptions have been applied in accordance with Ind AS 101 in preparing the
financial statements:
a estimates The estimates as at 1 January 2016 and 31 December 2016 are consistent with those made for the same dates
in accordance with previous GAAP (after adjustment to reflect and differences if any, in accounting policies) apart from the following items where the application of previous GAAP did not require estimation:
(i) Impairment of financial assets based on the expected credit loss model; and
(ii) Investments in equity instruments carried as FVPL or FVOCI.
The estimates used by the Company to present the amounts in accordance with the Ind AS reflect conditions that existed at the date on transition to Ind AS.
b Classification and movement of financial assets and liabilities The Company has classified the financial assets and liabilities in accordance with Ind AS 109 on the basis of
facts and circumstances that existed at the date on transition to Ind AS.
iii Reconciliation of equity as previously reported under previous gaap to Ind aS:` lakhs
Refer note
balance sheet as at 31 December 2016
opening balance sheet as at 1 January 2016
previous gaap
effects of transition
to Ind aS
Ind aS previous gaap
effects of transition
to Ind aS
Ind aS
aSSeTS
non-current assets
Property, plant and equipment
2.3 (iii) 1 33,560.87 4,621.12 38,181.99 29,312.93 4,000.36 33,313.29
Capital work-in-progress 560.20 - 560.20 196.84 - 196.84
Financial assets
Investments 2.3 (iii) 2 5.00 57.49 62.49 5.00 57.49 62.49
Trade receivables 2,863.37 - 2,863.37 2,863.37 - 2,863.37
Loans 2.3 (iii) 3 266.21 (17.65) 248.56 295.26 (40.43) 254.83
Other financial assets
8,677.57 - 8,677.57 8,694.61 - 8,694.61
Deferred tax assets (net) 2.3 (iii) 7 3.06 197.00 200.06 3,622.20 299.97 3,922.17
Income tax assets (net) 6,309.04 - 6,309.04 4,084.92 - 4,084.92
Other non-current assets 2.3 (iii) 3 14,883.74 2.69 14,886.43 12,581.95 12.40 12,594.35
Total non-current assets 67,129.06 4,860.65 71,989.71 61,657.08 4,329.79 65,986.87

Summary of significant accounting policies and other explanatory information to the standalone financial statements as at and for the year ended 31 December 2017
ITD Cementation India Limited
118 204
` lakhs
Refer note
balance sheet as at 31 December 2016
opening balance sheet as at 1 January 2016
previous gaap
effects of transition
to Ind aS
Ind aS previous gaap
effects of transition
to Ind aS
Ind aS
Current assets
Inventories 2.3 (iii) 1 15,612.45 (4,621.12) 10,991.33 18,521.41 (4,000.36) 14,521.05
Financial assets
Investments 0.26 - 0.26 0.26 - 0.26
Trade receivables 2.3 (iii) 4 22,744.76 (2,209.52) 20,535.24 26,116.29 (2,087.33) 24,028.96
Cash and cash equivalents
16,200.48 - 16,200.48 7,830.14 - 7,830.14
Other bank balances 269.11 - 269.11 6,257.82 - 6,257.82
Loans 2.3 (iii) 2 17,109.41 2.70 17,112.11 12,613.14 6.12 12,619.26
Other financial assets 2.3 (iii) 4 42,571.28 1,535.12 44,106.40 72,767.68 1,205.83 73,973.51
Other current assets 2.3 (iii) 3 3,693.36 14.05 3,707.41 11,439.72 28.03 11,467.75
Total current assets 118,201.11 (5,278.77) 112,922.34 155,546.46 (4,847.71) 150,698.75
ToTaL aSSeTS 185,330.17 (418.12) 184,912.05 217,203.54 (517.92) 216,685.62
equITy anD LIabILITIeS
equity
Equity share capital 1,551.58 - 1,551.58 1,551.58 - 1,551.58
Other equity 2.3 (iii) 8 53,520.95 129.93 53,650.88 49,270.23 (560.62) 48,709.61
Total equity 55,072.53 129.93 55,202.46 50,821.81 (560.62) 50,261.19
Liabilities
non-current liabilities
Financial liabilities
Borrowings 4,062.13 - 4,062.13 982.81 - 982.81
Provisions 902.36 - 902.36 692.16 - 692.16
Total non-current liabilities 4,964.49 - 4,964.49 1,674.97 - 1,674.97
Current liabilities
Financial liabilities
Borrowings 29,348.43 - 29,348.43 45,168.90 - 45,168.90
Current maturities of long-term-borrowings
2,210.61 - 2,210.61 2,684.22 - 2,684.22
Trade payables 60,423.20 - 60,423.20 71,678.04 - 71,678.04
Other financial liabilities 2.3 (iii) 2 4,163.78 12.18 4,175.96 3,554.08 42.70 3,596.78
Other current liabilities 26,605.30 - 26,605.30 40,024.00 - 40,024.00
Provisions 2.3 (iii) 5 and 8
2,541.83 (560.23) 1,981.60 1,597.52 - 1,597.52
Total current liabilities 125,293.15 (548.05) 124,745.10 164,706.76 42.70 164,749.46
ToTaL equITy anD LIabILITIeS
185,330.17 (418.12) 184,912.05 217,203.54 (517.92) 216,685.62

Summary of significant accounting policies and other explanatory information to the standalone financial statements as at and for the year ended 31 December 2017
Annual Report 2017
Sta
ndal
one
Fina
ncia
l Sta
tem
ents
Sta
tuto
ry R
epor
tsC
orpo
rate
Ove
rvie
w
119 204
Reconciliation of net profit as previously reported under previous gaap to Ind aS
` lakhs
Refer note year ended 31 December 2016
previous gaap
effects of transition
to Ind aS
Ind aS
Income
Revenue from operations - 291,735.11 - 291,735.11
Other income 2.3 (iii) 2, 3 1,975.78 686.14 2,661.92
Total income 293,710.89 686.14 294,397.03
expenses
Cost of construction materials consumed 65,536.17 - 65,536.17
Subcontracting expenses 128,612.76 - 128,612.76
Employee benefits expense 2.3 (iii) 5 22,140.99 (219.23) 21,921.76
Finance costs 2.3 (iii) 2 and 3 8,874.36 3.96 8,878.32
Depreciation expense 2.3 (iii) 1 3,230.78 1,352.71 4,583.49
Other expenses 2.3 (iii) 1, 3, 4 56,868.78 (1,901.17) 54,967.61
Total expenses 285,263.84 (763.73) 284,500.11
profit before tax 8,447.05 1,449.87 9,896.92
Tax expense
Current income tax 1,014.31 - 1,014.31
Deferred income tax 2.3 (iii) 7 3,619.14 178.85 3,797.99
4,633.45 178.85 4,812.30
profit for the year (a) 3,813.60 1,271.02 5,084.62
other comprehensive income 2.3 (iii) 6
Items not to be reclassified subsequently to profit or loss
- Loss on fair value of defined benefit plans as per actuarial valuation
2.3 (iii) 5 - (219.23) (219.23)
- Tax effect on above - 75.88 75.88
other comprehensive loss for the year, net of tax (b) - (143.35) (143.35)
Total comprehensive income for the year, net of tax (a+b)
3,813.60 1,127.67 4,941.27

Summary of significant accounting policies and other explanatory information to the standalone financial statements as at and for the year ended 31 December 2017
ITD Cementation India Limited
120 204
explanation for reconciliation 1. Property, Plant and Equipment The Company has elected to continue with the carrying value for all of its property, plant and equipment (PPE)
as recognised in its previous GAAP financial as deemed cost at the transition date.
Pursuant to transition to Indian Accounting Standard, on the date of transition i.e. 1 January 2016; the written down value of tools and equipment as at 31 December 2015 hitherto included under inventories have been reclassified to Property, plant and equipment.
2. Financial guarantees Under Ind AS, financial guarantees given by the Company for its unincorporated entities is initially recognised
as an investment and guarantee liability at fair value which is subsequently amortised as an interest income to the Statement of Profit and Loss. This transaction was not recorded under the previous GAAP.
3. Loans and other current assets Security deposits paid are recognised at fair value on initial recognition. Fair value of the deposits is arrived
at by discounting the future cash flows at incremental borrowing rate or market rate on the date of deposits. Subsequently these deposits are measured at amortised costs.
4. Trade receivables and other financial assets The Company recognizes loss allowances using the expected credit loss (ECL) model for trade receivables
and unbilled work-in-progress which are not fair valued through profit or loss. The amount of expected credit losses (or reversal) that is required to adjust the loss allowance at the reporting date to the amount that is required to be recognised is recognised as an impairment gain or loss in statement of profit or loss.
5. Employee benefits Under Ind AS, actuarial gains and losses are recognised in the other comprehensive income (“OCI”) as
compared to being recognised in the Statement of Profit and Loss under the previous GAAP.
6. Other comprehensive income Under the previous GAAP, the Company has not presented OCI separately. Hence, it has reconciled previous
GAAP profit or loss to profit or loss as per Ind AS. Further, previous GAAP profit or loss is reconciled to total comprehensive income as per Ind AS.
7. Tax expenses Deferred income tax
Deferred tax have been recognised on the adjustments made on transition to Ind AS.
8. Other equity Adjustments to retained earnings and OCI have been made in accordance with Ind AS, for the above mentioned
transition items.
In previous GAAP, dividend payable is recorded as a liability in the period to which it relates. Under Ind AS, dividend to holders of equity instruments is recognized as a liability in the period in which the obligation to pay is established. Accordingly, proposed dividends and the related tax have increased the retained earnings by ` 560.23 lakhs, as on 31 December 2016.
iv Statement of cash flows There were no significant reconciliation items between cash flows prepared under previous GAAP and those
prepared under Ind AS.

Summary of significant accounting policies and other explanatory information to the standalone financial statements as at and for the year ended 31 December 2017
Annual Report 2017
Sta
ndal
one
Fina
ncia
l Sta
tem
ents
Sta
tuto
ry R
epor
tsC
orpo
rate
Ove
rvie
w
121 204
noTe 3 - pRopeRTy, pLanT anD equIpmenT (TangIbLe aSSeTS)gross carrying value
` lakhs
Freehold land
Leasehold improvements
Leasehold buildings
buildings
plant and equipment
Furniture and
fixtures
vehicles office equipment
Computer equipment
Total
balance as at 1 January 2016 (deemed cost)
548.71 155.72 - 962.64 31,031.98 39.72 242.17 163.04 169.31 33,313.29
Additions 1.21 39.86 528.18 170.39 9,019.36 4.55 50.82 22.63 113.50 9,950.50
Disposals - - - - (1,401.45) (1.53) (5.68) (9.63) (81.18) (1,499.47)
balance as at 31 December 2016
549.92 195.58 528.18 1,133.03 38,649.89 42.74 287.31 176.04 201.63 41,764.32
Additions - 66.22 623.68 - 7,980.04 12.86 75.95 34.77 193.50 8,987.02
Disposals - - - - (1,993.84) (12.38) (26.67) (13.59) (10.76) (2,057.24)
balance as at 31 December 2017
549.92 261.80 1,151.86 1,133.03 44,636.09 43.22 336.59 197.22 384.37 48,694.10
accumulated depreciation
balance as at 1 January 2016
- - - - - - - - - -
Depreciation charge - 32.47 0.23 18.86 4,334.02 9.83 45.63 65.68 76.77 4,583.49
Accumulated depreciation on disposals
- - - - (907.83) (1.49) (5.44) (9.63) (76.77) (1,001.16)
balance as at 31 December 2016
- 32.47 0.23 18.86 3,426.19 8.34 40.19 56.05 - 3,582.33
Depreciation charge - 40.79 15.06 19.39 5,201.37 5.87 68.85 67.63 101.34 5,520.30
Accumulated depreciation on disposals
- - - - (1,019.83) - (17.81) - (10.57) (1,048.21)
balance as at 31 December 2017
- 73.26 15.29 38.25 7,607.73 14.21 91.23 123.68 90.77 8,054.42
net carrying value
Balance as at 1 January 2016 (deemed cost)
548.71 155.72 - 962.64 31,031.98 39.72 242.17 163.04 169.31 33,313.29
Balance as at 31 December 2016
549.92 163.11 527.95 1,114.17 35,223.70 34.40 247.12 119.99 201.63 38,181.99
balance as at 31 December 2017
549.92 188.54 1,136.57 1,093.78 37,028.36 29.01 245.36 73.54 293.60 40,639.68

Summary of significant accounting policies and other explanatory information to the standalone financial statements as at and for the year ended 31 December 2017
ITD Cementation India Limited
122 204
noTe 4 - non-CuRRenT InveSTmenTS` lakhs
as at 31 December 2017
as at 31 December 2016
as at 1 January 2016
Investments valued at deemed cost (Trade)
Investment in equity shares 5.00 5.00 5.00
Investment in unincorporated entity 57.49 57.49 57.49
Total non-current investments 62.49 62.49 62.49
note 4.1 Detailed list of non-current investmentsInvestments valued at deemed cost, unquoted
a) Investments in equity shares, fully paid:
In subsidiary
ITD Cementation Projects India Limited 5.00 5.00 5.00
50,000 equity shares of ` 10 each (31 December 2016: 50,000, 1 January 2016: 50,000)
5.00 5.00 5.00
b) Investments in unincorporated entities
i) In subsidiaries *
ITD Cemindia JV - - -
ITD Cem-Maytas Consortium - - -
ii) In Joint ventures *
ITD - ITDCem JV ^ 57.49 57.49 57.49
ITD - ITDCem JV (Consortium of ITD - ITD Cementation)
- - -
CEC-ITD Cem-TPL JV - - -
* Being unincorporated entities, the Company does not require to have any investment in these entities as per the JV agreement.
^Represents fair value of financial guarantee
57.49 57.49 57.49
Total non-current investments 62.49 62.49 62.49
Details:
aggregate of non-current investments:
(i) Carrying value of investments 62.49 62.49 62.49
(ii) Market value of investments - - -
(iii) Impairment allowances - - -
(i) Investments carried at deemed cost 62.49 62.49 62.49
(ii) Investments carried at amortised cost - - -
(iii) Investments carried at fair value through profit and loss
- - -
62.49 62.49 62.49

Summary of significant accounting policies and other explanatory information to the standalone financial statements as at and for the year ended 31 December 2017
Annual Report 2017
Sta
ndal
one
Fina
ncia
l Sta
tem
ents
Sta
tuto
ry R
epor
tsC
orpo
rate
Ove
rvie
w
123 204
noTe 5 - TRaDe ReCeIvabLeS(unsecured, considered good unless stated otherwise)
` lakhs
as at 31 December 2017
as at 31 December 2016
as at 1 January 2016
non-current
Trade receivables 309.00 2,863.37 2,863.37
[Including retention Nil (31 December 2016 : ` 571.41 lakhs, 1 January 2016 : ` 571.41 lakhs)]
Total non-current trade receivables 309.00 2,863.37 2,863.37
Current
Trade receivables
- considered good [(Refer note 35 (c)] 22,388.38 20,535.24 24,028.96
- considered doubtful 4,816.95 6,149.78 4,469.56
[Including retention ` 13,348.98 lakhs (31 December 2016: ` 11,946.64 lakhs, 1 January 2016 : ` 12,728.13 lakhs)]
27,205.33 26,685.02 28,498.52
Impairment allowance for doubtful debts (4,816.95) (6,149.78) (4,469.56)
Total current trade receivables 22,388.38 20,535.24 24,028.96
Total trade receivables 22,697.38 23,398.61 26,892.33
Note: Trade Receivables are non-interest bearing and are generally on credit terms of 30-90 days.
noTe 6 - LoanS(unsecured, considered good unless stated otherwise)
` lakhs
as at 31 December 2017
as at 31 December 2016
as at 1 January 2016
non-current
Security deposits 225.29 248.56 254.83
Total non-current loans 225.29 248.56 254.83
Current
Security deposits
- considered good 2,403.30 2,314.83 1,452.88
- considered doubtful 63.36 55.83 97.55
Receivable from unincorporated entities (Refer note 35) 56,022.99 14,797.28 11,166.38
Total 58,489.65 17,167.94 12,716.81
Less : Impairment allowance (63.36) (55.83) (97.55)
Total current loans 58,426.29 17,112.11 12,619.26
Total loans 58,651.58 17,360.67 12,874.09

Summary of significant accounting policies and other explanatory information to the standalone financial statements as at and for the year ended 31 December 2017
ITD Cementation India Limited
124 204
noTe 7 - oTheR FInanCIaL aSSeTS(unsecured, considered good unless stated otherwise)
` lakhs
as at 31 December 2017
as at 31 December 2016
as at 1 January 2016
non-current
Unbilled revenue - 8,677.57 8,677.57
Bank deposits with original maturity of more than 12 months
39.00 - 12.00
Interest accrued on bank deposits - - 5.04
Total non-current financial assets 39.00 8,677.57 8,694.61
Current
Unbilled revenue
- considered good 48,067.54 43,945.98 73,737.33
- considered doubtful 119.21 408.71 649.67
Interest accrued on deposits 27.27 28.81 115.06
Employee advances 12.86 11.32 18.29
Foreign currency forward contract ^ 1,478.73 - -
Others 24.70 120.29 102.83
49,730.31 44,515.11 74,623.18
Less: Impairment allowance (119.21) (408.71) (649.67)
Total current financial assets 49,611.10 44,106.40 73,973.51
Total other financial assets 49,650.10 52,783.97 82,668.12
^ Financial assets carried at fair value through other comprehensive income
noTe 8 - InCome Tax aSSeTS (neT)i. The following table provides the details of income tax assets and liabilities:
` lakhs
as at 31 December 2017
as at 31 December 2016
as at 1 January 2016
a) Income tax assets 8,148.52 8,766.02 5,146.81
b) Current income tax liabilities (7,220.46) (2,456.98) (1,061.89)
net income tax assets 928.06 6,309.04 4,084.92
ii. The gross movement in the current tax asset:` lakhs
as at 31 December 2017
as at 31 December 2016
Net current income tax assets at the beginning 6,309.04 4,084.92
Income tax paid/(refund), net (236.51) 3,238.43
Current Income tax expense (5,144.47) (1,014.31)
net current income tax assets/liabilities at the end 928.06 6,309.04

Summary of significant accounting policies and other explanatory information to the standalone financial statements as at and for the year ended 31 December 2017
Annual Report 2017
Sta
ndal
one
Fina
ncia
l Sta
tem
ents
Sta
tuto
ry R
epor
tsC
orpo
rate
Ove
rvie
w
125 204
iii. Income tax expense in the Statement of profit and Loss comprises:
` lakhs
as at 31 December 2017
as at 31 December 2016
Current income taxes 5,144.47 1,014.31
Deferred income taxes 9.48 3,797.99
Income tax expenses (net) 5,153.95 4,812.30
iv. a reconciliation of the income tax provision to the amount computed by applying the statutory income tax rate to the profit before income taxes is as below:
` lakhs
as at 31 December 2017
as at 31 December 2016
Profit before income tax 12,435.59 9,896.92
Applicable income tax rate 34.61% 34.61%
Computed expected tax expense 4,303.96 3,425.32
Effect of expenses not allowed for tax purpose 690.80 1,938.49
Tax adjustments for earlier years 159.19 (137.90)
Effect of change in tax rate - (413.61)
Income tax expense charged to the Statement of profit and Loss 5,153.95 4,812.30
v. Components of deferred income tax assets and liabilities arising on account of temporary differences are:
` lakhs
as at 31 December 2017
as at 31 December 2016
as at 1 January 2016
Impairment allowance for doubtful debts, deposits and unbilled revenue
1,730.22 2,289.09 1,644.69
Provision for employee benefits 1,719.09 1,471.44 981.76
Disallowance for forseeable losses as per Income Computation and Disclosure Standards (ICDS)
- 163.59 356.54
Brought forward business loss - - 4,211.57
Others 229.04 0.36 11.01
Deferred tax assets 3,678.35 3,924.48 7,205.57
Deferred income tax liability
Timing difference on amount of depreciation on tangible assets
3,384.37 3,708.74 3,278.28
Others - 15.68 5.12
Deferred tax liability 3,384.37 3,724.42 3,283.40
Deferred tax assets (net) 293.98 200.06 3,922.17
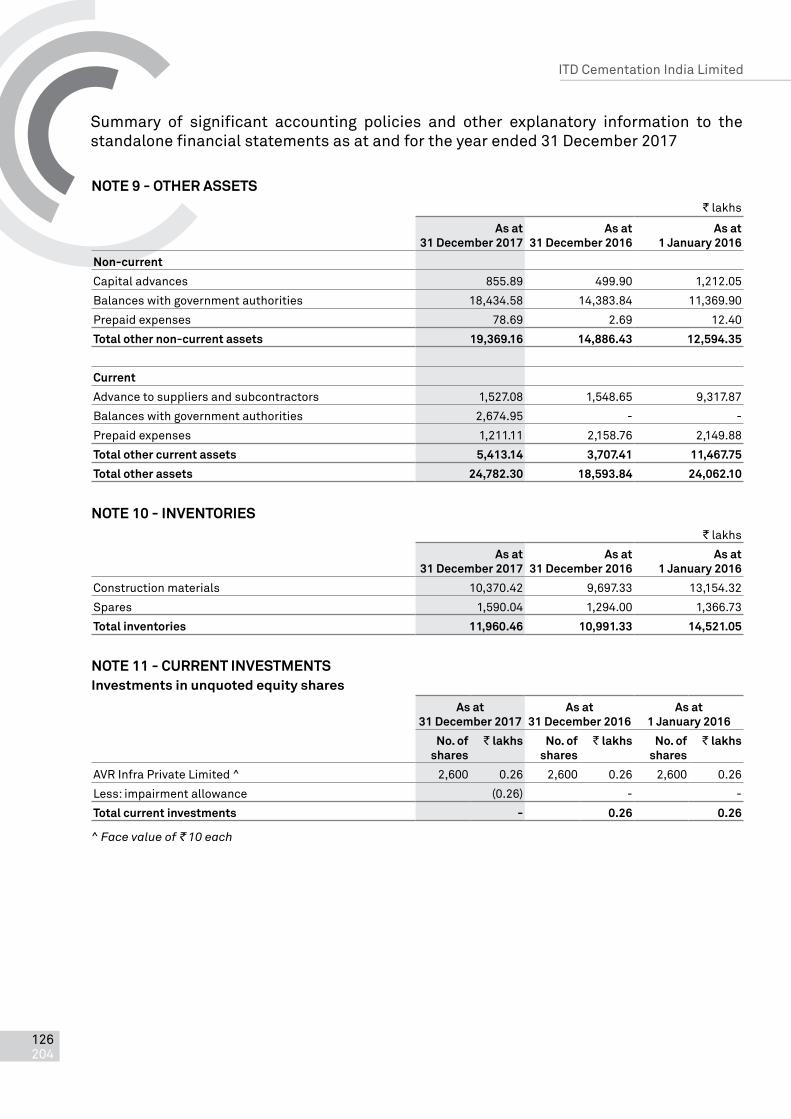
Summary of significant accounting policies and other explanatory information to the standalone financial statements as at and for the year ended 31 December 2017
ITD Cementation India Limited
126 204
noTe 9 - oTheR aSSeTS` lakhs
as at 31 December 2017
as at 31 December 2016
as at 1 January 2016
non-current
Capital advances 855.89 499.90 1,212.05
Balances with government authorities 18,434.58 14,383.84 11,369.90
Prepaid expenses 78.69 2.69 12.40
Total other non-current assets 19,369.16 14,886.43 12,594.35
Current
Advance to suppliers and subcontractors 1,527.08 1,548.65 9,317.87
Balances with government authorities 2,674.95 - -
Prepaid expenses 1,211.11 2,158.76 2,149.88
Total other current assets 5,413.14 3,707.41 11,467.75
Total other assets 24,782.30 18,593.84 24,062.10
noTe 10 - InvenToRIeS` lakhs
as at 31 December 2017
as at 31 December 2016
as at 1 January 2016
Construction materials 10,370.42 9,697.33 13,154.32
Spares 1,590.04 1,294.00 1,366.73
Total inventories 11,960.46 10,991.33 14,521.05
noTe 11 - CuRRenT InveSTmenTSInvestments in unquoted equity shares
as at 31 December 2017
as at 31 December 2016
as at 1 January 2016
no. of shares
` lakhs no. of shares
` lakhs no. of shares
` lakhs
AVR Infra Private Limited ^ 2,600 0.26 2,600 0.26 2,600 0.26
Less: impairment allowance (0.26) - -
Total current investments - 0.26 0.26
^ Face value of ` 10 each

Summary of significant accounting policies and other explanatory information to the standalone financial statements as at and for the year ended 31 December 2017
Annual Report 2017
Sta
ndal
one
Fina
ncia
l Sta
tem
ents
Sta
tuto
ry R
epor
tsC
orpo
rate
Ove
rvie
w
127 204
noTe 12 - CaSh anD CaSh equIvaLenTS` lakhs
as at 31 December 2017
as at 31 December 2016
as at 1 January 2016
Balances with banks
- in current accounts 2,532.97 2,943.89 3,395.16
- in deposit account (with original maturity upto 3 months)
8,100.00 13,200.00 4,300.00
Cash on hand 65.94 56.59 134.98
Total cash and cash equivalents 10,698.91 16,200.48 7,830.14
noTe 13 - oTheR bank baLanCeS` lakhs
as at 31 December 2017
as at 31 December 2016
as at 1 January 2016
earmarked balances with banks for:
Bank deposits with maturity of more than 3 months but less than 12 months (Refer note 13.1 below)
242.45 263.65 6,251.65
Balances with bank for unclaimed dividend (Refer note 13.2 below)
7.46 5.46 6.17
Total other bank balances 249.91 269.11 6,257.82
note 13.1 Includes ` 242.45 lakhs (31 December 2016 ` 241.65 lakhs, 1 January 2016 ` 241.65 lakhs) earmarked against bank guarantees taken by the Company and Nil (31 December 2016 ` 22 lakhs, 1 January 2016 ` 10 lakhs) placed as earnest money deposit.
note 13.2 There are no amounts due and outstanding to be credited to the Investor Education and Protection Fund as at each reporting period.

Summary of significant accounting policies and other explanatory information to the standalone financial statements as at and for the year ended 31 December 2017
ITD Cementation India Limited
128 204
noTe 14 - ShaRe CapITaL` lakhs
as at 31 December 2017
as at 31 December 2016
as at 1 January 2016
authorised share capital
300,000,000 Equity shares of ` 1 each 3,000.00 3,000.00 3,000.00
(31 December 2016: 300,000,000; 1 January 2016: 300,000,000)
45,000,000 Redeemable preference shares of ` 10 each
4,500.00 4,500.00 4,500.00
(31 December 2016: 45,000,000; 1 January 2016: 45,000,000)
Total authorised share capital 7,500.00 7,500.00 7,500.00
Issued equity share capital:
155,183,160 Equity shares of ` 1 each 1,551.83 1,551.83 1,551.83
(31 December 2016:155,183,160; 1 January 2016:155,183,160)
Total issued equity share capital 1,551.83 1,551.83 1,551.83
Subscribed and fully paid-up equity share capital:
155,157,900 Equity shares of ` 1 each fully paid up 1,551.58 1,551.58 1,551.58
(31 December 2016:155,157,900; 1 January 2016: 155,157,900)
Total Subscribed and fully paid-up equity share capital 1,551.58 1,551.58 1,551.58
a. Reconciliation of the equity shares outstanding at the beginning and at the end of the reporting year
number ` lakhs
as at 1 January 2016 155,157,900 1,551.58
Changes in equity share capital - -
as at 31 December 2016 155,157,900 1,551.58
Changes in equity share capital - -
as at 31 December 2017 155,157,900 1,551.58
b. Terms/rights attached to equity shares: The Company has only one class of equity shares having a par value of ` 1 per share. Each holder of equity share is
entitled to one vote per share. The Company declares and pays dividends in Indian Rupees. The dividend proposed if any by the Board of Directors is subject to the approval of the shareholders in the ensuing Annual General Meeting, except interim dividend.
In the event of liquidation of the Company, the holders of equity shares will be entitled to receive remaining assets of the Company, after distribution of all preferential amounts,if any. The distribution will be in proportion to the number of equity shares held by the shareholders.

Summary of significant accounting policies and other explanatory information to the standalone financial statements as at and for the year ended 31 December 2017
Annual Report 2017
Sta
ndal
one
Fina
ncia
l Sta
tem
ents
Sta
tuto
ry R
epor
tsC
orpo
rate
Ove
rvie
w
129 204
c. Shares held by holding Company
31 December 2017 31 December 2016 1 January 2016
% held no. of shares
% held no. of shares
% held no. of shares
Equity shares of ` 1 each
Italian-Thai Development Public Company Limited, Thailand
51.63% 80,113,180 51.63% 80,113,180 51.63% 80,113,180
d. Shareholding of more than 5%:
name of the Shareholder % held no. of shares
% held no. of shares
% held no. of shares
promoter
Italian-Thai Development Public Company Limited, Thailand
51.63% 80,113,180 51.63% 80,113,180 51.63% 80,113,180
non-promoter
HDFC Trustee Company Limited - - 6.82% 10,576,780 7.11% 11,033,180
Reliance Capital Trustee Co. Limited 6.04% 9,376,105 - - - -
As per records of the Company, including its register of shareholders/members and other declarations received from shareholders regarding beneficial interest, the above shareholding represents both legal and beneficial ownership of shares.
e. bonus shares/ buy back/shares for consideration other than cash issued during past five years: (i) Aggregate number and class of shares allotted as fully paid up pursuant to contracts without payment being
received in cash - nil
(ii) Aggregate number and class of shares allotted as fully paid up by way of bonus shares - nil
(iii) Aggregate number and class of shares bought back - nil
f. Out of the total issued capital, 25,260 (31 December 2016: 25,260; 1 January 2016 25,260) equity shares of ` 1 each have been kept in abeyance pending final settlement of rights issues.
g. Subsequent to 31 December 2017, pursuant to the approval of the QIP Committee of Directors of the Board of the Company at its meeting held on 30 January 2018, the Company issued 16,629,684 equity shares of ` 1 each, at an issue price of ` 202.55 per equity share (of which ` 201.55 per share is towards securities premium) aggregating ` 33,683.42 lakhs to Qualified Institutionals Buyers in accordance with Chapter VIII of Securities and Exchange Board of India (Issue of Capital and Disclosure Requirements) Regulations, 2009 as amended and Section 42 of the Companies Act, 2013, as amended, and the rules made thereunder.
h. The Board of Directors of the Company has recommended Equity dividend of ` 0.40 per share (Previous Year: ` 0.30) for the year ended 31 December 2017.

Summary of significant accounting policies and other explanatory information to the standalone financial statements as at and for the year ended 31 December 2017
ITD Cementation India Limited
130 204
noTe 15 - boRRoWIngSnon-current portion:
effective interest rate as at31 December
2017
as at31 December
2016
as at 1 January
2016
31 December 2017
31 December 2016
` lakhs ` lakhs ` lakhs
Secured
(a) Rupee term loans
(i) From Banks 10.15% 10.15% - 2,650.00 -
(ii) From Others 13.50% 13.50% - - 315.04
(b) plant loans
(i) From Banks 9.65%-11.03% 9.65%-11.03% 1,205.30 484.56 212.91
(ii) From Others 11.00%-12.50%
11.00%-12.50%
1,144.74 843.61 364.77
(C) vehicle loans from banks 9.50%-10.50%
9.50%-10.50%
111.72 83.96 90.09
Total non-current borrowings 2,461.76 4,062.13 982.81
Current maturities of long-term borrowings
effective interest rate as at31 December
2017
as at31 December
2016
as at 1 January
2016
31 December 2017
31 December 2016
` lakhs ` lakhs ` lakhs
Secured
(a) Rupee term loans
(i) From Banks 10.15% 10.15% 2,650.00 1,350.00 1,989.04
(ii) From Others 13.50% 13.50% - - 273.94
(b) plant loans
(i) From Banks 9.65%-11.03%
9.65%-11.03%
752.10 361.94 100.76
(ii) From Others 11.00%-12.50%
11.00%-12.50%
699.42 435.32 281.04
(C) vehicle loans from banks 9.50%-10.50%
9.50%-10.50%
58.05 63.35 39.44
Total current maturities of long-term borrowings
4,159.57 2,210.61 2,684.22
Total borrowings 6,621.33 6,272.74 3,667.03

Summary of significant accounting policies and other explanatory information to the standalone financial statements as at and for the year ended 31 December 2017
Annual Report 2017
Sta
ndal
one
Fina
ncia
l Sta
tem
ents
Sta
tuto
ry R
epor
tsC
orpo
rate
Ove
rvie
w
131 204
Terms of repayment and details of securitynote 15.1: Rupee term loan - from banksTerm loans from banks are repayable in 3 equal quaterly installments starting from November 2017. These loans are secured by hypothecation of Kolkata area depot land.
note 15.2 - Rupee term loans from othersTerm Loan from others has been fully repaid during the year. This loan was secured by hypothecation of Kolkata office premises.
note 15.3 - plant loans from banksLoans obtained for purchase of construction equipments are repayble in 36 to 58 monthly structured installments. These loans are secured by first and exclusive charge on specific equipments financed by the bank.
note 15.4 - plant loans from othersLoans obtained for purchase of construction equipment are repayable in 29 to 60 monthly structured installments. These loans are secured by first and exclusive charge on specific equipments financed by the financial institution.
note 15.5 - vehicle loans from banksLoans obtained for purchase of vehicles are repayble in 60 monthly structured installments. These loans are secured by hypothecation of the vehicles purchased out of these loans.
noTe 16 - pRovISIonS` lakhs
as at 31 December 2017
as at 31 December 2016
as at 1 January 2016
non-current
Provision for employee benefits (Refer note 33)
- Leave entitlement and compensated absences 1,110.31 902.36 692.16
Total non-current provisions 1,110.31 902.36 692.16
Current
Provision for employee benefits (Refer note 33)
- Gratuity 2,051.00 1,653.81 1,315.03
- Leave entitlement and compensated absences 144.44 131.13 100.38
- Provident fund 206.71 196.66 182.11
Total current provisions 2,402.15 1,981.60 1,597.52
Total provisions 3,512.46 2,883.96 2,289.68

Summary of significant accounting policies and other explanatory information to the standalone financial statements as at and for the year ended 31 December 2017
ITD Cementation India Limited
132 204
noTe 17 - CuRRenT boRRoWIngS ` lakhs
as at 31 December 2017
as at 31 December 2016
as at 1 January 2016
I. Secured
Rupee loan from banks (Repayable on demand)
Cash credit facilities 12,977.26 3,361.23 19,181.70
Working capital demand loan 11,761.26 8,487.20 8,487.20
24,738.52 11,848.43 27,668.90
II. unsecured
Commercial paper from others 17,500.00 17,500.00 17,500.00
Total current borrowings (I+II) 42,238.52 29,348.43 45,168.90
note 17.1 - Cash credit facilities (secured) :Cash credit facilities are availed from consortium bankers carries various effective interest rates ranging from 11.02 to 14.50 percent per annum and are secured by first pari passu charge on the current assets and movable plant and machinery other than those charged in favour of Plant loans. These facilities are payable on demand.
note 17.2 - Working capital demand loan :Working capital demand loans carry an effective interest rate ranging from 9.70 to 12.00 percent per annum and are secured by first pari passu charge on the current assets and movable plant and machinery other than those charged in favour of Plant loans. This facility is payable on demand.
note 17.3 - Commercial paper (unsecured) :Commercial Paper carry effective interest rate ranging between 10.00 to 10.50 percent per annum.
noTe 18 - TRaDe payabLeS ` lakhs
as at 31 December 2017
as at 31 December 2016
as at 1 January 2016
- Total outstanding dues of Micro Enterprises and Small Enterprises (Refer note 18.1)
77.80 709.27 -
- Total outstanding dues of creditors other than Micro Enterprises and Small Enterprises
51,124.07 59,713.93 71,678.04
Total trade payables 51,201.87 60,423.20 71,678.04
note 18.1 The Company has amounts due to micro and small suppliers registered under the Micro, Small and Medium Enterprises Development Act 2006 (MSMED Act), as at 31 December 2017.
` lakhs
as at 31 December 2017
as at 31 December 2016
as at 1 January 2016
The disclosure pursuant to the said Act is as under:
Principal amount due to suppliers under MSMED Act 77.80 709.27 -
Interest accrued and due to suppliers under MSMED Act on the above amount
2.47 6.78 -
Payment made to suppliers (other than interest) beyond appointed day during the year
916.04 632.89 -

Summary of significant accounting policies and other explanatory information to the standalone financial statements as at and for the year ended 31 December 2017
Annual Report 2017
Sta
ndal
one
Fina
ncia
l Sta
tem
ents
Sta
tuto
ry R
epor
tsC
orpo
rate
Ove
rvie
w
133 204
` lakhs
as at 31 December 2017
as at 31 December 2016
as at 1 January 2016
Interest paid to suppliers under MSMED Act - - -
Interest due and payable to suppliers under MSMED Act towards payments already made
18.57 5.10 -
Interest accrued and remaining unpaid at the end of the accounting year
21.04 6.78 -
The amount of further interest remaining due and payable even in the succeeding years, until such date when the interest dues as above are actually paid to the small enterprise for the purpose of disallowance as a deductible expenditure under section 23 of the MSMED Act.
21.04 6.78 -
Note: This information, as required to be disclosed under the MSMED Act, has been determined to the extent such parties have
been identified on the basis of information available with the Company.
note 18.2 Trade payables are normally non-interest bearing and settled as per the payment terms stated in the contract.
noTe 19 - oTheR FInanCIaL LIabILITIeS` lakhs
as at 31 December 2017
as at 31 December 2016
as at 1 January 2016
Current
Interest accrued but not due 73.93 37.20 137.77
Unpaid dividends ^ 7.46 5.46 6.17
Amount due to parent company (Refer note 35(c)) 246.66 - -
Creditors for capital expenses 1,006.26 358.99 179.39
Employee related dues 3,263.03 3,149.48 2,541.04
Financial guarantees - 12.18 42.69
Foreign currency forward contract ^^ 1,497.60 - -
Others 458.61 612.65 689.72
Total other financial liabilities 6,553.55 4,175.96 3,596.78
^ Not due for credit to Investor Education and Protection Fund
^^ Financial liability carried at fair value through profit and loss
noTe 20 - oTheR CuRRenT LIabILITIeS` lakhs
as at 31 December 2017
as at 31 December 2016
as at 1 January 2016
Advances from contractee 29,989.63 12,786.32 37,269.90
Amount due to customers 19,838.60 13,169.84 1,892.66
Statutory dues payable 309.27 328.49 587.33
Others 294.82 320.65 274.11
Total other current liabilities 50,432.32 26,605.30 40,024.00

Summary of significant accounting policies and other explanatory information to the standalone financial statements as at and for the year ended 31 December 2017
ITD Cementation India Limited
134 204
noTe 21 - Revenue FRom opeRaTIonS` lakhs
year ended 31 December 2017
year ended 31 December 2016
Contract revenue 1,86,629.79 2,91,529.43
Other operating revenues - Service income from unincorporated entities 662.23 205.68
Total revenue from operations 1,87,292.02 2,91,735.11
noTe 22 - oTheR InCome` lakhs
year ended 31 December 2017
year ended 31 December 2016
Interest income
- on bank deposits 1,015.51 1,157.92
- on financial assets carried at amortised cost 890.38 651.67
- on income tax refund 244.43 183.28
- on sales tax refund 103.56 21.82
- others 23.04 9.96
Other non-operating income
- Excess provision no longer required written back 345.20 206.93
- Insurance claim 387.85 34.87
- Exchange gain (net) - 25.64
- Miscellaneous income 413.72 369.83
Total other income 3,423.69 2,661.92
noTe 23 - CoST oF ConSTRuCTIon maTeRIaLS ConSumeD` lakhs
year ended 31 December 2017
year ended 31 December 2016
Stock at beginning of the year 9,697.33 13,702.35
Add: Purchases 55,024.81 61,531.15
64,722.14 75,233.50
Less: Stock at the end of the year 10,370.42 9,697.33
Total cost of construction materials consumed 54,351.72 65,536.17
noTe 24 - empLoyee beneFITS expenSe` lakhs
year ended 31 December 2017
year ended 31 December 2016
Salaries and wages 21,481.67 19,964.22
Contribution to provident and other funds (Refer note 33) 1,685.33 1,531.58
Gratuity (Refer note 33) 380.02 369.69
Staff welfare 67.76 56.27
Total employee benefits expense 23,614.78 21,921.76

Summary of significant accounting policies and other explanatory information to the standalone financial statements as at and for the year ended 31 December 2017
Annual Report 2017
Sta
ndal
one
Fina
ncia
l Sta
tem
ents
Sta
tuto
ry R
epor
tsC
orpo
rate
Ove
rvie
w
135 204
noTe 25 - FInanCe CoSTS` lakhs
year ended 31 December 2017
year ended 31 December 2016
Interest on:
- Cash credit facilities 3,318.56 3,233.13
- Term loans 665.67 333.68
- Commercial papers 1,313.04 1,668.62
- Advances from customers 414.88 772.93
- Letter of credit 255.88 367.25
- Others 26.40 35.17
Other borrowing costs
- Bank charges and guarantee commission 2,559.37 2,467.54
Total finance costs 8,553.80 8,878.32
noTe 26 - oTheR expenSeS` lakhs
year ended 31 December 2017
year ended 31 December 2016
Plant hire expenses 5,159.38 5,466.13 Power and fuel 8,235.82 7,666.65 Rates and taxes 8,554.12 17,791.01 Travelling expenses 1,108.13 930.32 Site transport and conveyance 2,140.20 2,507.61 Repairs and maintenance:
- Plant and machinery 1,015.41 1,218.21 - Others 195.70 177.62
Insurance 1,005.34 1,082.45 Professional fees 2,118.53 1,088.13 Rent (Refer note 26.2) 2,458.76 2,591.98 Share of loss from unincorporated entities (net) [(Refer note 35(b)] 1,337.16 5,579.60 Consumption of spares 1,868.01 2,104.66 Security charges 779.11 830.73 Temporary site installations 384.82 397.93 Postage, telephone and telegram 185.32 209.71 Auditor remuneration (Refer note 26.1) 81.32 73.98 Impairment allowance on financial assets (net) 477.06 1,784.87 Water charges 597.07 791.69 Printing and stationery 154.46 159.19 Infotech expenses 237.68 259.89 Royalty expense [(Refer note 35(b)] 933.15 -Exchange loss (net) 5.00 -Directors’ sitting fees [(Refer note 35(b)] 11.00 8.90 CSR expenses ^ - 2.25 Loss on disposal of property, plant and equipment (net) 657.80 416.27 Miscellaneous expenses 1,757.59 1,827.83 Total other expenses 41,457.94 54,967.61
^ The Company is not liable to incur any expenses on CSR as per section 135 of the Companies Act, 2013

Summary of significant accounting policies and other explanatory information to the standalone financial statements as at and for the year ended 31 December 2017
ITD Cementation India Limited
136 204
note 26.1: - auditor Remuneration` lakhs
year ended 31 December 2017
year ended 31 December 2016
- Audit fees 38.10 39.68
- Tax audit fee (including tax accounts) 11.00 12.65
- Limited review 15.78 17.23
- Certification fees 14.39 3.10
- Reimbursement of out of pocket expenses 2.05 1.32
81.32 73.98
note 26.2 - The Company has taken various residential/commercial premises and construction equipment on cancellable operating lease. These lease agreements are normally renewed on expiry. Rental expenses in the Statement of Profit and Loss for the year includes lease payments towards premises ` 1,906.76 lakhs (31 December 2016 - ` 2,010.60 lakhs).
The Company, in addition to above, has taken commercial premises on leases (non-cancellable operating leases). The future minimum lease payments in respect of which as at 31 December 2017 are as follows:
` lakhs
as at 31 December 2017
as at 31 December 2016
as at 1 January 2016
minimum lease rental payments- Payable not later than one year 600.30 230.00 552.00 - Payable later than one year and not later than five years 2,264.18 - 230.00
2,864.48 230.00 782.00
These leases have no escalation clauses.
Rental expenses in the Statement of Profit and Loss for the year includes ` 552.00 lakhs (31 December 2016 - ` 552.00 lakhs) towards such non-cancellable leases.
General descriptions of non-cancellable lease terms :- Lease rentals are charged on the basis of agreed terms.- Assets are taken on lease over a period of 3-5 years.- The Company did not sublease any of its assets and hence did not receive any sub lease payments during the current
or previous year.
noTe 27 - exCepTIonaL ITem` lakhs
year ended 31 December 2017
year ended 31 December 2016
Non-current trade receivables and non-current other financial assets written off 11,232.17 -
Provisions no longer required written back (9,048.23) -
2,183.94 -
noTe 28 - eaRnIngS peR ShaRe (epS)basic and diluted epS
year ended 31 December 2017
year ended 31 December 2016
Profit computation for basic earnings per share of ` 1 eachNet profit as per the Statement of Profit and Loss available for equity shareholders (` lakhs) 7,281.64 5,084.62
Weighted average number of equity shares for EPS computation (Nos.) 15,51,57,900 15,51,57,900 EPS - Basic and Diluted EPS (`) 4.69 3.28

Summary of significant accounting policies and other explanatory information to the standalone financial statements as at and for the year ended 31 December 2017
Annual Report 2017
Sta
ndal
one
Fina
ncia
l Sta
tem
ents
Sta
tuto
ry R
epor
tsC
orpo
rate
Ove
rvie
w
137 204
noTe 29 - ConTIngenT LIabILITIeS anD CommITmenTS a. Contingent liabilities
` lakhs
as at 31 December 2017
as at 31 December 2016
as at 1 January 2016
(i) Guarantees given by banks in respect of contracting commitments in the normal course of business
- for the Company 41,742.08 39,241.31 28,521.08 - for subsidiary 513.79 513.79 1,027.57 - for Joint Venture 1,128.79 2,728.16 5,527.79(ii) Corporate Guarantee given to bank on behalf of
unincorporated entities 138,500.00 48,651.00 48,651.00
(iii) Letter of credit limit utilized by unincorporated entities 760.53 610.77 63.81 (iv) Claims against the Company not acknowledged as
debts (Refer notes below) 11,945.77 13,116.77 12,016.77
(v) Sales Tax matters pending in appeals 3,525.28 4,006.27 2,006.88 (vi) Income Tax matters pending in appeal 813.16 1,480.38 1,319.08 (vii) Excise matter pending in appeal 51.70 51.70 51.70 Notes-1. The Company has a number of claims on customers for price escalation and / or variation in contract work. In
certain cases which are currently under arbitration, the customers have raised counter-claims. The Company has received legal advice that none of the counter-claims are legally tenable. Accordingly no provision is considered necessary in respect of these counter claims.
2. It is not practicable for the Company to estimate the timings of cash outflows, if any, in respect of the above pending resolution of the respective proceedings. The Company does not expect any reimbursements in respect of the above contingent liabilities other than stated therein above. Future cash outflows in respect of the above are determinable only on receipt of judgments/ decisions pending with various forums/ authorities. The Company does not expect any outflow of economic resources in respect of the above and therefore no provision is made in respect thereof.
b. Commitments` lakhs
as at 31 December 2017
as at 31 December 2016
as at 1 January 2016
Estimated amount of contracts remaining to be executed and not provided for (net of advances)
639.92 1,362.36 310.28
noTe 30 - DISCLoSuRe In aCCoRDanCe WITh InD aS 11 - ConSTRuCTIon ConTRaCTS` lakhs
as at31 December 2017
as at31 December 2016
Contract revenue for the year 186,629.79 291,529.43
Aggregate amount of cost incurred and recognized profits less recognized losses up to the reporting date on contract under progress
669,487.63 599,818.35
Advances received from customers 29,989.63 12,786.32
Retention money 13,348.98 12,518.05
Gross amount due from customers for contract work (net of retention) 57,415.94 63,504.11
Gross amount due to customers for contract work 19,838.60 13,169.84
noTe 31 - SegmenT RepoRTIngThe Company is principally engaged in a single business segment viz. Construction. Also refer note 36 for information on revenue from major customers.

Summary of significant accounting policies and other explanatory information to the standalone financial statements as at and for the year ended 31 December 2017
ITD Cementation India Limited
138 204
noTe 32 - InTeReSTS In oTheR enTITIeS Joint ventures
` lakhs
name of the Joint venture proportion of effective interest Description of interest
principal activities 31 December
201731 December
2016 1 January
2016 ITD - ITD Cem JV 49% 49% 49% Co-venturer ConstructionITD - ITDCem JV (Consortium of ITD - ITD Cementation)
40% 40% 40% Co-venturer Construction
CEC-ITD Cem-TPL JV 60%^ 60%^ - Co-venturer Construction
Though the Company’s effective interest in the joint venture exceeds 50%, the entity has been classified as a joint venture. The management has assessed whether or not the Company has control over the entity based on whether the Company has practical ability to direct relevant activities unilaterally. In this case, based on specific joint venture agreement, the management concluded that the Company does not have practical ability to direct the relevant activities unilaterally but has such ability along with the other co-venturer.
noTe 33 - DISCLoSuRe ReLaTIng To empLoyee beneFITS aS peR InD aS 19 ‘empLoyee beneFITS’
a Defined benefit obligations - gratuity The gratuity plan is governed by the Payment of Gratuity Act, 1972 under which an employee who has completed
five years of service is entitled to specific benefits. The level of benefits provided depends on the member’s length
of service and salary at retirement age.
` lakhs
year ended 31 December 2017
year ended 31 December 2016
a) Changes in defined benefit obligationspresent value of obligation as at the beginning of the year 3,272.28 2,681.54 Interest cost 238.88 207.61 Current service cost 258.81 274.49 Past service cost 0.48 -Remeasurements - Net actuarial (gains)/ losses 331.01 281.37 Benefits paid (265.10) (172.73)present value of obligation as at the end of the year 3,836.36 3,272.28
b) Changes in fair value of the plan assets of the gratuity planplan assets at the beginning of the period 1,618.47 1,366.51 Interest income 118.15 112.41 Contribution by employer 299.99 250.00 Benefit paid (265.10) (172.73)Return on plan assets (incl. interest income) 13.85 62.28 Fair value of the plan assets at the end of the year 1,785.36 1,618.47
c) expenses recognised in the Statement of profit and LossInterest cost 120.73 95.20 Current service cost 258.81 274.49 Past service cost 0.48 -Total 380.02 369.69
d) Remeasurement losses recognised in oCIActuarial changes arising from changes in financial assumptions 331.01 281.37 Return on plan assets (excluding interest income) (13.85) (62.14)Total 317.16 219.23

Summary of significant accounting policies and other explanatory information to the standalone financial statements as at and for the year ended 31 December 2017
Annual Report 2017
Sta
ndal
one
Fina
ncia
l Sta
tem
ents
Sta
tuto
ry R
epor
tsC
orpo
rate
Ove
rvie
w
139 204
31 December 2017 31 December 2016 1 January 2016 e) actuarial assumptions
Discount rate 7.85% 7.30% 8.00%Salary escalation rate - over a long-term 6.00% 5.00% 5.00%Mortality rate Indian assured
lives mortality (2006-08) ultimate
Indian assured lives mortality
(2006-08) ultimate
Indian assured lives mortality
(2006-08) ultimate
The attrition rate is 5% - for ages 44 years and below, 2.5% - for ages 45 years and above in year 31 December 2017 (31 December 2016 - 5% for ages 44 years and below, 2.5% for ages 45 years and above)
The estimates of future salary increases, considered in actuarial valuation, take account of inflation, seniority, promotion and other relevant factors, such as supply and demand in the employment market.
f) quantities sensitivity analysis for significant assumption is as below: Sensitivity for significant actuarial assumptions is computed by varying one actuarial assumption used for the
valuation of the defined benefit obligation, keeping all other actuarial assumptions constant. The significant
actuarial assumptions are discount rate and salary escalation rate.
` lakhs 31 December 2017 31 December 2016
1% increase
i. Discount rate (258.72) (198.48)
ii. Salary escalation rate - over a long-term 303.04 208.84
1% decrease
i. Discount rate 300.46 224.67
ii. Salary escalation rate - over a long-term (265.24) (192.28)
The sensitivity analysis presented above may not be representative of the actual charge in the defined benefit obligation as it is unlikely that the change in assumption would occur in isolation of one another as the assumptions may be correlated.
g) maturity analysis of defined benefit obligation: The defined benefit obligation shall mature after 31 December 2017 as follows:
` lakhsWithin the next 12 months 429.81
Between 2 and 5 years 602.60
Between 6 and 10 years 618.36
Total expected payments 1,650.77
b provident Fund The Company’s expense for the provident fund aggregates 1,107.63 lakhs during the year ended 31 December 2017
(31 December 2016 ` 966.47 lakhs).
Provident fund of employees is managed by the Company through trust “ITD Cementation India Limited Workmen Provident Fund”, in line with the Provident Fund and Miscellaneous Provision Act, 1952. The plan guarantees interest at the rate notified by the Provident Fund Authorities. The contribution by the employer and employee together with the interest accumulated thereon are payable to employees at the time of separation from the Company or retirement, whichever is earlier. The benefits vests immediately on rendering of the services by the employee.
In terms of the guidance note issued by the Accounting Standards Board (ASB) of the Institute of Chartered Accountants of India for measurement of provident fund liabilities, the valuer has certified that there is no shortfall as at each reporting period.

Summary of significant accounting policies and other explanatory information to the standalone financial statements as at and for the year ended 31 December 2017
ITD Cementation India Limited
140 204
C Superannuation The Company’s expense for the superannuation, a defined contribution plan aggregates ` 577.70 lakhs during the
year ended 31 December 2017 (31 December 2016 ` 565.11 lakhs).
D Current/ non-current classification` lakhs
31 December 2017 31 December 2016 1 January 2016 gratuityCurrent 2,051.00 1,653.81 1,315.03
2,051.00 1,653.81 1,315.03
The expenses for leave entitlement and compensated absences is recognized in the same manner as gratuity and provision of ` 1,254.75 lakhs (31 December 2016: ` 1,033.49 lakhs; 1 January 2016: ` 792.54 lakhs) has been made as at 31 December 2017.
Leave entitlement (including sick leave)Current 144.44 131.13 100.38 Non-current 1,110.31 902.36 692.16
1,254.75 1,033.49 792.54
noTe 34 - FInanCIaL InSTRumenTS The fair value of the financial assets are included at amounts at which the instruments could be exchanged in a current transaction between willing parties other than in a forced or liquidation sale.
The following methods and assumptions were used to estimate the fair value:(a) Fair value of cash and short term deposits, trade and other short term receivables, trade payables, other current
liabilities, approximate their carrying amounts largely due to the short-term maturities of these instruments.
(b) Financial instruments with fixed and variable interest rates are evaluated by the Company based on parameters such as interest rates and individual credit worthiness of the counterparty. Based on this evaluation, allowances are taken to account for the expected losses of these receivables.
a Financial instruments by category The carrying value and fair value of financial instruments by categories as at 31 December 2017 were as follows:
` lakhs
Refer note
amortised cost
Financial assets/ liabilities at fair value through profit or loss
Financial assets/ liabilities at fair value
through oCI
Total carrying
value
Total fair value
Designated upon initial recognition
mandatory Designated upon initial recognition
mandatory
assets:Investments
Investments in equity shares (unquoted)
4 - - - 62.49 - 62.49 62.49
Trade receivables 5 22,697.38 - - - - 22,697.38 22,697.38 Loans 6 58,651.58 - - - - 58,651.58 58,651.58 Other financial assets 7 48,171.37 - - 1,478.73 - 49,650.10 49,650.10 Cash and cash equivalents 12 10,698.91 - - - - 10,698.91 10,698.91 Other bank balances 13 249.91 - - - - 249.91 249.91
Liabilities:Borrowings 15,17 48,859.85 - - - - 48,859.85 48,859.85Trade payables 18 51,201.87 - - - - 51,201.87 51,201.87 Other financial liabilities 19 6,553.55 - - - - 6,553.55 6,553.55

Summary of significant accounting policies and other explanatory information to the standalone financial statements as at and for the year ended 31 December 2017
Annual Report 2017
Sta
ndal
one
Fina
ncia
l Sta
tem
ents
Sta
tuto
ry R
epor
tsC
orpo
rate
Ove
rvie
w
141 204
The carrying value and fair value of financial instruments by categories as at 31 December 2016 were as follows:
` lakhsRefer note
amortised cost
Financial assets/ liabilities at fair value through profit or loss
Financial assets/ liabilities at fair value
through oCI
Total carrying
value
Total fair value
Designated upon initial recognition
mandatory Designated upon initial recognition
mandatory
assets:
Investments
Investments in equity shares (unquoted)
4,11 - - - 62.75 - 62.75 62.75
Trade receivables 5 23,398.61 - - - - 23,398.61 23,398.61
Loans 6 17,360.67 - - - - 17,360.67 17,360.67
Other financial assets 7 52,783.97 - - - - 52,783.97 52,783.97
Cash and cash equivalents 12 16,200.48 - - - - 16,200.48 16,200.48
Other bank balances 13 269.11 - - - - 269.11 269.11
Liabilities:
Borrowings 15,17 35,621.17 - - - - 35,621.17 35,621.17
Trade payables 18 60,423.20 - - - - 60,423.20 60,423.20
Other financial liabilities 19 4,175.96 - - - - 4,175.96 4,175.96
The carrying value and fair value of financial instruments by categories as at 1 January 2016 were as follows
` lakhs
Refer note
amortised cost
Financial assets/ liabilities at fair value through profit or loss
Financial assets/ liabilities at fair value
through oCI
Total carrying
value
Total fair value
Designated upon initial recognition
mandatory Designated upon initial recognition
mandatory
assets:
Investments
Investments in equity shares (unquoted)
4,11 - - - 62.75 - 62.75 62.75
Trade receivables 5 26,892.33 - - - - 26,892.33 26,892.33
Loans 6 12,874.09 - - - - 12,874.09 12,874.09
Other financial assets 7 82,668.12 - - - - 82,668.12 82,668.12
Cash and cash equivalents 12 7,830.14 - - - - 7,830.14 7,830.14
Other bank balances 13 6,257.82 - - - - 6,257.82 6,257.82
Liabilities:
Borrowings 15,17 48,835.93 - - - - 48,835.93 48,835.93
Trade payables 18 71,678.04 - - - - 71,678.04 71,678.04
Other financial liabilities 19 3,596.78 - - - - 3,596.78 3,596.78

Summary of significant accounting policies and other explanatory information to the standalone financial statements as at and for the year ended 31 December 2017
ITD Cementation India Limited
142 204
b Fair value hierarchy Level 1 - Quoted prices (unadjusted) in active markets for identical assets or liabilities
Level 2 - Inputs other than quoted prices included within Level 1 that are observable for the asset or liability, either directly (i.e. as prices) or indirectly (i.e. derived from prices)
Level 3 - Inputs for the assets or liabilities that are not based on observable market data (unobservable inputs)
The following table presents fair value hierarchy of assets and liabilities measured at fair value on a recurring basis:
` lakhs
31 December 2017 31 December 2016 1 January 2016
Level 1 Level 2 Level 3 Level 1 Level 2 Level 3 Level 1 Level 2 Level 3
assets
Investments in Equity shares (unquoted)
- - 62.49 - - 62.75 - - 62.75
Foreign currency forward contract
- 1,478.73 - - - - - - -
noTe 35 - DISCLoSuRe In aCCoRDanCe WITh InD-aS 24 ReLaTeD paRTy TRanSaCTIonSa) names of related parties and description of relationship a) enterprise where control exists i) holding Company Italian-Thai Development Public Company Limited
ii) Subsidiary Company ITD Cementation Projects India Limited
b) other related parties with whom the Company had transactions i) unincorporated entities - Subsidiary ITD Cemindia JV ITD Cem-Maytas Consortium
ii) unincorporated entities - Joint venture ITD - ITD Cem JV ITD - ITDCem JV (Consortium of ITD - ITD Cementation) CEC-ITD Cem-TPL JV
iii) key managerial personnel (kmp) Mr. Adun Saraban – Managing Director Mr. S. Ramnath – Chief Financial Officer (retired on 15 July 2017) Mr. Prasad Patwardhan – Chief Financial Officer (appointed w.e.f. 16 July 2017) Mr. Rahul Neogi - Company Secretary (appointed w.e.f. 1 February 2017) Mr. R C Daga – Company Secretary (retired on 31 January 2017) Mr. D.E.Udwadia - Independent Director Mr. D.P. Roy - Independent Director Mrs. Ramola Mahajani - Independent Director
iv) entities where kmp has significant influence Udwadia & Co.

Summary of significant accounting policies and other explanatory information to the standalone financial statements as at and for the year ended 31 December 2017
Annual Report 2017
Sta
ndal
one
Fina
ncia
l Sta
tem
ents
Sta
tuto
ry R
epor
tsC
orpo
rate
Ove
rvie
w
143 204
noTe 35 - DISCLoSuRe In aCCoRDanCe WITh InD aS 24 ReLaTeD paRTy TRanSaCTIonSb) nature of Transactions Transactions with related parties:
` lakhs
year ended 31 December 2017
year ended 31 December 2016
Contract Revenue
Italian-Thai Development Public Company Limited
Holding Company - 131.61
CEC-ITDCEM-TPL JV Unincorporated entity (joint venture)
2,179.06 -
2,179.06 131.61
Royalty expense
Italian-Thai Development Public Company Limited
Holding Company 933.15 -
plant and tools hire income (net of expenses)
ITD Cemindia JV Unincorporated entity (subsidiary)
534.76 2.96
ITD-ITDCem JV Unincorporated entity (joint venture)
127.47 202.72
662.23 205.68
purchases of property, plant and equipment
ITD-ITDCem JV Unincorporated entity (joint venture)
412.69 -
Sale of Construction materials and spares
ITD Cemindia JV Unincorporated entity (joint venture)
4.72 29.88
purchases of Construction materials and spares
ITD-ITDCem JV Unincorporated entity (joint venture)
- 71.61
Remuneration
Mr. Adun Saraban KMP 146.37 132.55
Mr. S. Ramnath KMP 54.86 62.16
Mr. Prasad Patwardhan KMP 39.60 -
Mr. Rahul Neogi KMP 45.60 -
Mr. R. C. Daga KMP 4.73 54.02
291.16 248.73
Director sitting fees
Mr. D. E. Udwadia KMP 5.10 4.50
Mr. D. P. Roy KMP 3.60 2.80
Mrs. Ramola Mahajani KMP 2.30 1.60
11.00 8.90
professional fees
Udwadia & Co. Entities where KMP has significant influence
15.16 23.59

Summary of significant accounting policies and other explanatory information to the standalone financial statements as at and for the year ended 31 December 2017
ITD Cementation India Limited
144 204
` lakhs
year ended 31 December 2017
year ended 31 December 2016
Share of profit/(loss) after tax in unincorporated entity
ITD Cemindia JV Unincorporated entity (subsidiary)
43.81 156.95
ITD-ITDCem JV Unincorporated entity (joint venture)
(1,382.23) (5,517.53)
ITD-ITDCem JV (Consortium of ITD-ITD Cementation)
Unincorporated entity (joint venture)
(0.43) (184.69)
ITD Cem-Maytas Consortium Unincorporated entity (subsidiary)
1.69 (34.33)
(1,337.16) (5,579.60)
All the transactions have been undertaken at arm’s length price
C) outstanding balances:` lakhs
as at31 December 2017
as at31 December 2016
as at1 January 2016
Trade receivables
Italian-Thai Development Public Company Limited
Holding Company - 2.26 25.89
Creditors for capital expenses
ITD-ITDCem JV Unincorporated entity (joint venture)
79.70 70.02 70.02
balances - payable
Italian-Thai Development Public Company Limited
Holding Company 246.66 - -
balances - receivable
ITD Cemindia JV Unincorporated entity (subsidiary)
19,305.97 1,290.67 996.68
ITD-ITDCem JV Unincorporated entity (joint venture)
35,888.17 12,586.30 9,554.37
ITD-ITDCem JV (Consortium of ITD-ITD Cementation)
Unincorporated entity (joint venture)
671.20 831.65 566.33
ITD Cem-Maytas Consortium Unincorporated entity (subsidiary)
76.44 20.55 49.00
CEC-ITDCEM-TPL JV Unincorporated entity (joint venture)
81.21 68.11 -
56,022.99 14,797.28 11,166.38
Corporate guarantee issued on behalf of
ITD-ITD Cem JV Unincorporated entity (joint venture)
77,500.00 48,651.00 48,651.00
CEC -ITD Cem-TPL JV Unincorporated entity (joint venture)
51,000.00 - -
ITD Cemindia JV Unincorporated entity (subsidiary)
10,000.00 - -
138,500.00 48,651.00 48,651.00

Summary of significant accounting policies and other explanatory information to the standalone financial statements as at and for the year ended 31 December 2017
Annual Report 2017
Sta
ndal
one
Fina
ncia
l Sta
tem
ents
Sta
tuto
ry R
epor
tsC
orpo
rate
Ove
rvie
w
145 204
` lakhs
as at31 December 2017
as at31 December 2016
as at1 January 2016
Letter of credit limit utilized
ITD-ITDCem JV Unincorporated entity (joint venture)
760.53 610.77 63.81
bank guarantee issued on behalf of
ITD Cemindia JV Unincorporated entity (subsidiary)
30,478.97 513.79 1,027.57
ITD Cem-Maytas Consortium Unincorporated entity (subsidiary)
1,140.86 - -
ITD-ITDCem JV Unincorporated entity (joint venture)
32,051.13 2,728.16 5,327.79
ITD-ITDCem JV (Consortium of ITD-ITD Cementation)
Unincorporated entity (joint venture)
196.43 - 200.00
CEC-ITDCEM-TPL JV Unincorporated entity (joint venture)
16,980.60 - -
80,847.99 3,241.95 6,555.36
noTe 36 - FInanCIaL RISk managemenT obJeCTIveS anD poLICIeS The Company’s activities expose it to a variety of financial risks: market risk, credit risk and liquidity risk. The Company’s focus is to foresee the unpredictability of financial markets and seek to minimize potential adverse effects on its financial performance.
i market risk Market risk is the risk that the fair value of future cash flows of a financial instrument will fluctuate because of
changes in market prices. Market risk comprises three types of risk: interest rate risk, currency risk and other price risk, such as equity price risk. Major financial instruments affected by market risk includes loans and borrowings.
a Interest rate risk Interest rate risk is the risk that the fair value or future cash flows of a financial instrument will fluctuate
because of changes in market interest rates. The Company’s exposure to the risk of changes in market interest rates relates primarily to the Company’s total debt obligations with floating interest rates.
Interest rate sensitivity The following table demonstrates the sensitivity to a reasonably possible change in interest rates on that
portion of loans and borrowings affected. With all other variables held constant, the Company’s profit before tax is affected through the impact on floating rate borrowings, as follows:
` lakhs
31 December 2017 31 December 2016
Increase in basis points 50 basis points 50 basis points
Effect on profit before tax, increase by 245.16 241.01
Decrease in basis points 50 basis points 50 basis points
Effect on profit before tax, decrease by 245.16 241.01
The assumed movement in basis points for the interest rate sensitivity analysis is based on the currently observable market environment, showing a significantly higher volatility than in prior years.

Summary of significant accounting policies and other explanatory information to the standalone financial statements as at and for the year ended 31 December 2017
ITD Cementation India Limited
146 204
b Foreign currency risk The following table analyses foreign currency risk from financial instruments as at 31 December 2017:
In lakhs
euro Total
Trade payables 19.15 19.15
The following table analyses foreign currency risk from financial instruments as at 31 December 2016:
In lakhs
uSD euro Total
Trade payables 0.65 2.31 2.96
The following table analyses foreign currency risk from financial instruments as of 1 January 2016:
In lakhs
uSD euro Total
Trade payables 0.15 0.14 0.29
During the current year to mitigate the Company’s exposure to foreign currency risk, non-INR cash flows are monitored and forward exchange contracts are entered into in accordance with the Company’s risk management policies. Generally, the Company’s risk management procedures distinguish short-term foreign currency cash flows (due within 6 months) from longer-term cash flows (due after 6 months).
The following table gives details in respect of outstanding foreign exchange forward contracts:
as at 31 December 2017
as at 31 December 2016
as at 1 January 2016
In euro lakhs
` lakhs In lakhs ` lakhs In lakhs ` lakhs
Forward contracts 19.15 1,497.60 - - - -
The foreign exchange forward contracts mature within 6 months. The table below analyses the derivative financial instruments into relevant maturity groupings based on the remaining period as of the balance sheet date:
(Euro in lakhs)
as at 31 December 2017
as at 31 December 2016
as at 1 January 2016
Not later than one month 8.88 - -
Later than one month and not later than three months
10.27 - -
Sensitivity analysis The Company’s exposure in foreign currency is not material and hence the impact of any significant fluctuation in
the exchange rates is not expected to have a material impact on the operating profits of the Company.
c equity price risk The Company’s exposure in equity securities as at 31 December 2017 is ` 5 lakhs (31 December 2016 ` 5 lakhs,
1 January 2016 ` 5 lakhs) and as a result the impact of any price change will not have a material effect on the profit or loss of the Company.

Summary of significant accounting policies and other explanatory information to the standalone financial statements as at and for the year ended 31 December 2017
Annual Report 2017
Sta
ndal
one
Fina
ncia
l Sta
tem
ents
Sta
tuto
ry R
epor
tsC
orpo
rate
Ove
rvie
w
147 204
ii Credit risk Credit risk refers to the risk of default on its obligation by the counterparty resulting in a financial loss. The maximum
exposure of the financial assets are contributed by trade receivables, unbilled revenue, cash and cash equivalents and receivable from related parties.
a Credit risk on trade receivables and unbilled revenue is limited as the customers of the Company mainly consists of the government promoted entities having a strong credit worthiness. For other customers, the Company uses a provision matrix to compute the expected credit loss allowance for trade receivables and unbilled revenue. The provision matrix takes into account available external and internal credit risk factors such as credit ratings from credit rating agencies, financial condition, ageing of accounts receivable and the Company’s historical experience for customers.
The following table gives details in respect of percentage of revenues generated from government promoted agencies and others;
31 December 2017 31 December 2016
% %
Revenue from government promoted agencies 40.74% 31.42%
Revenue from others 59.26% 68.58%
100.00% 100.00%
The following table gives details in respect of contract revenues generated from the top customer and top 5 customers for the year ended:
31 December 2017 31 December 2016
` lakhs % of Revenue
` lakhs % of Revenue
Revenue from top customer 25,617 13.7% 99,654 34.2%
Revenue from top five customers 68,325 36.6% 164,694 56.5%
For the year ended 31 December 2017, One (31 December 2016: One) customer, individually, accounted for more than 10% of the revenue.
The movement of the allowance for lifetime expected credit loss is stated below: ^
` lakhs
31 December 2017 31 December 2016
Balance at the beginning of the year 613.57 881.51
Balance at the end of the year 182.12 613.57
The Company has written off ` 13,323.35 lakhs and ` 342.89 lakhs towards amounts not recoverable from trade
receivables and unbilled revenue during the years ended 31 December 2017 and 31 December 2016, respectively.
b. Credit risk on cash and cash equivalents is limited as the Company generally invest in deposits with banks and financial institutions with high credit ratings.

Summary of significant accounting policies and other explanatory information to the standalone financial statements as at and for the year ended 31 December 2017
ITD Cementation India Limited
148 204
iii Liquidity risk Liquidity is defined as the risk that the Company will not be able to settle or meet its obligations on time or at a
reasonable price. The Company’s treasury department is responsible for liquidity, funding as well as settlement management. In addition, processes and policies related to such risks are overseen by senior management. Management monitors the Company’s net liquidity position through rolling forecasts on the basis of expected cash flows.
The table below provides details regarding the contractual maturities of significant financial liabilities:
` lakhs
on demand Less than 1 year
1 - 5 years more than 5 years
Total
as at 31 December 2017
Borrowings 24,738.52 21,659.57 2,461.76 - 48,859.85
Trade payables - 51,201.87 - - 51,201.87
Interest accrued - 73.93 - - 73.93
Other financial liabilities - 6,479.62 - - 6,479.62
Total 24,738.52 79,414.99 2,461.76 - 106,615.27
as at 31 December 2016
Borrowings 11,848.43 19,710.61 4,062.13 - 35,621.17
Trade payables - 60,423.20 - - 60,423.20
Interest accrued - 37.20 - - 37.20
Other financial liabilities - 4,138.76 - - 4,138.76
Total 11,848.43 84,309.77 4,062.13 - 100,220.33
as at 1 January 2016
Borrowings 27,668.90 20,184.22 982.81 - 48,835.93
Trade payables - 71,678.04 - - 71,678.04
Interest accrued - 137.77 - - 137.77
Other financial liabilities - 3,459.01 - - 3,459.01
Total 27,668.90 95,459.04 982.81 - 124,110.75
noTe 37Subsequent to the year ended 31 December 2017, a case has been registered by the Anti-Corruption Bureau against some officers at the State Tax Enforcement Wing at Vijayawada and an employee of the Company along with a representative of the Company on the allegation of an attempt to bribe an Additional Commissioner of Commercial Taxes, Andhra Pradesh. While investigation process is on, the employee has been suspended.

Summary of significant accounting policies and other explanatory information to the standalone financial statements as at and for the year ended 31 December 2017
Annual Report 2017
Sta
ndal
one
Fina
ncia
l Sta
tem
ents
Sta
tuto
ry R
epor
tsC
orpo
rate
Ove
rvie
w
149 204
For Walker Chandiok & Co LLp For and on behalf of the board of Directors Chartered AccountantsFirm Registration No. 001076N/N500013
Rakesh R. agarwal adun Saraban p. ChakornbunditPartner Managing Director DirectorMembership No: 109632 DIN: 01312769 DIN: 00254312
prasad patwardhan Rahul neogiChief Financial Officer Company SecretaryACA No.44453 ACS No.10653
Place : Mumbai Place : MumbaiDate : 22 February 2018 Date : 22 February 2018
noTe 38 - CapITaL managemenT For the purpose of the Company’s capital management, capital includes issued equity capital and all other equity reserves attributable to the equity holders of the Company. The Company strives to safeguard its ability to continue as a going concern so that they can maximise returns for the shareholders and benefits for other stake holders. The aim to maintain an optimal capital structure and minimise cost of capital.
The Company manages its capital structure and makes adjustments in light of changes in economic conditions and the requirements of the financial covenants. To maintain or adjust the capital structure, the Company may return capital to shareholders, issue new shares or adjust the dividend payment to shareholders (if permitted). Consistent with others in the industry, the Company monitors its capital using the gearing ratio which is total debt divided by total capital.
` lakhs
as at 31 December 2017
as at 31 December 2016
as at 1 January 2016
Total debts 48,859.85 35,621.17 48,835.93
Total equity 61,728.24 55,202.46 50,261.19
Total debts to equity ratio (gearing ratio) 0.79 0.65 0.97
In the long run, the Company’s strategy is to maintain a gearing ratio less than 0.5.
noTe 39 - Disclosure of unhedged foreign currency exposure as at 31 December 2017
Currency 31 December 2017 31 December 2016 1 January 2016
Foreign currency
` lakhs Foreign currency
` lakhs Foreign currency
` lakhs
Liabilities
Acceptances USD - - 64,755.00 44.48 14,526.00 9.67
EURO - - 231,409.00 168.10 13,811.00 13.73
Liabilities - 212.58 23.40
This is a summary of significant accounting policies and other explanatory information referred to in our audit report of even date.

ITD Cementation India Limited
150 204
Independent Auditor’s Report
To The Members of ITD Cementation India Limited
RepoRT on The ConsoLIDaTeD FInanCIaL sTaTemenTs1. We have audited the accompanying consolidated
financial statements of ITD Cementation India Limited (‘the Holding Company’) and its subsidiaries (the Holding Company and its subsidiaries together referred to as ‘the Group’) and it’s joint ventures which comprise the Consolidated Balance Sheet as at 31 December 2017, the Consolidated Statement of Profit and Loss (including Other Comprehensive Income), the Consolidated Cash Flow Statement and the Consolidated Statement of Changes in Equity for the year then ended, and a summary of the significant accounting policies and other explanatory information.
managemenT’s ResponsIbILITy FoR The ConsoLIDaTeD FInanCIaL sTaTemenTs2. The Holding Company’s Board of Directors is
responsible for the preparation of these consolidated financial statements in terms of the requirements of the Companies Act, 2013 (“the Act”) that give a true and fair view of the consolidated financial position, consolidated financial performance and consolidated cash flows of the Group and it’s joint ventures, in accordance with the accounting principles generally accepted in India including the Indian Accounting Standards (‘Ind AS’) specified under Section 133 of the Act. The Holding Company’s Board of Directors, and the respective Board of Directors/management of the subsidiaries included in the Group and it’s joint ventures are responsible for the design, implementation and maintenance of internal control relevant to the preparation and presentation of the financial statements that give a true and fair view and are free from material misstatement, whether due to fraud or error. Further, in terms with the provisions of the Act, the respective Board of Directors/management of the Holding Company and its subsidiary which is incorporated in India, are responsible for maintenance of adequate accounting records; safeguarding the assets; preventing and detecting frauds and other irregularities; selection and application of appropriate accounting policies; making judgments and estimates that are reasonable and prudent; and design, implementation and maintenance of adequate internal financial controls, that were
operating effectively for ensuring the accuracy and completeness of the accounting records, relevant to the preparation and presentation of the financial statements, that give a true and fair view and are free from material misstatement, whether due to fraud or error. These financial statements have been used for the purpose of preparation of the consolidated financial statements by the directors of the Holding Company, as aforesaid.
auDIToR’s ResponsIbILITy3. Our responsibility is to express an opinion on
these consolidated financial statements based on our audit.
4. While conducting the audit, we have taken into account the provisions of the Act, the accounting and auditing standards and matters which are required to be included in the audit report under the provisions of the Act and the Rules made thereunder.
5. We conducted our audit in accordance with the Standards on Auditing specified under Section 143(10) of the Act. Those Standards require that we comply with ethical requirements and plan and perform the audit to obtain reasonable assurance about whether these consolidated financial statements are free from material misstatement.
6. An audit involves performing procedures to obtain audit evidence about the amounts and the disclosures in the consolidated financial statements. The procedures selected depend on the auditor’s judgment, including the assessment of the risks of material misstatement of the consolidated financial statements, whether due to fraud or error. In making those risk assessments, the auditor considers internal financial controls relevant to the Holding Company’s preparation of the consolidated financial statements that give a true and fair view in order to design audit procedures that are appropriate in the circumstances. An audit also includes evaluating the appropriateness of the accounting policies used and the reasonableness of the accounting estimates made by the Holding Company’s Board of Directors, as well as evaluating the overall presentation of the consolidated financial statements.
7. We believe that the audit evidence obtained by us is sufficient and appropriate to provide a basis for our audit opinion on these consolidated financial statements.

Annual Report 2017
Con
solid
ated
Fina
ncia
l Sta
tem
ents
Sta
tuto
ry R
epor
tsC
orpo
rate
Ove
rvie
w
151 204
opInIon8. In our opinion and to the best of our information
and according to the explanations given to us the aforesaid consolidated financial statements give the information required by the Act in the manner so required and give a true and fair view in conformity with the accounting principles generally accepted in India, of the consolidated state of affairs (consolidated financial position) of the Group and it’s joint ventures as at 31 December 2017 and their consolidated profit (consolidated financial performance including other comprehensive income), their consolidated cash flows and consolidated changes in equity for the year ended on that date.
oTheR maTTeR9. The Company had prepared separate sets of
consolidated financial statements for the years ended 31 December 2016 and 31 December 2015 in accordance with Accounting Standards prescribed under Section 133 of the Act, read with Rule 7 of the Companies (Accounts) Rules, 2014 (as amended) on which we issued auditor’s reports dated 21 February 2017 and 24 February 2016, respectively. These separate sets of consolidated financial statements have been adjusted for the differences in the accounting principles adopted by the Group on transition to Ind AS, which have also been audited by us. Our opinion is not modified in respect of this matter.
RepoRT on oTheR LegaL anD ReguLaToRy RequIRemenTs10. As required by Section 143(3) of the Act, based on
our audit and on the consideration of the report of other auditor on the separate financial statements and other financial information of the subsidiary, we report, to the extent applicable, that:
a) We have sought and obtained all the information and explanations which to the best of our knowledge and belief were necessary for the purpose of our audit of the aforesaid consolidated financial statements;
b) In our opinion, proper books of account as required by law relating to preparation of the aforesaid consolidated financial statements have been kept so far as it appears from our examination of those books and the reports of the other auditors,
c) The consolidated financial statements dealt with by this report are in agreement with the relevant books of account maintained for the purpose of preparation of the consolidated financial statements;
d) In our opinion, the aforesaid consolidated financial statements comply with Ind AS specified under Section 133 of the Act;
e) On the basis of the written representations received from the directors of the Holding Company and taken on record by the Board of Directors of the Holding Company and the report of the other statutory auditor of its subsidiary company, none of directors of group companies covered under the Act are disqualified as at 31 December 2017 from being appointed as a director in terms of Section 164(2) of the Act.
f) With respect to the adequacy of the internal financial controls over financial reporting of the Holding Company and its subsidiary company covered under the Act and the operating effectiveness of such controls, refer to our separate report in ‘Annexure I’;
g) With respect to the other matters to be included in the Auditor’s Report in accordance with Rule 11 of the Companies (Audit and Auditor’s) Rules, 2014 (as amended), in our opinion and to the best of our information and according to the explanations given to us:
(i) The consolidated financial statements disclose the impact of pending litigations on the consolidated financial position of the Group and it’s joint ventures as detailed in Note 29 to the consolidated financial statements.
(ii) the Group did not have any long-term contracts including derivative contracts for which there were any material foreseeable losses; and
(iii) There has been no delay in transferring amounts, required to be transferred, to the Investor Education and Protection Fund by the Holding Company and its subsidiary company covered under the Act;
For Walker Chandiok & Co LLp Chartered AccountantsFirm’s Registration No.: 001076N/N500013
Per Rakesh R. agarwalPartnerMembership No.: 109632
Place: Mumbai Date: 22 February 2018

ITD Cementation India Limited
152 204
annexure I to the Independent auditor’s Report of even date to the members of ITD Cementation India Limited on the consolidated financial statements for the year ended 31 December 2017
annexure I
Independent auditor’s Report on the Internal Financial Controls under Clause (i) of sub-section 3 of section 143 of the Companies act, 2013 (‘the act’)1. In conjunction with our audit of the consolidated
financial statements of ITD Cementation India Limited (‘the Holding Company’) and its subsidiaries (the Holding Company and its subsidiaries together referred to as ‘the Group’), and it’s joint ventures, as at and for the year ended 31 December 2017, we have audited the internal financial controls over financial reporting (‘IFCoFR’) of the Holding Company and it’s subsidiaries as at that date.
managemenT’s ResponsIbILITy FoR InTeRnaL FInanCIaL ConTRoLs2. The Board of Directors of the Holding Company are
responsible for establishing and maintaining internal financial controls based on the internal control over financial reporting criteria established by the Company considering the essential components of internal control stated in the Guidance Note on Audit of Internal Financial Controls over Financial Reporting (the “Guidance Note”) issued by the Institute of Chartered Accountants of India (“ICAI”). These responsibilities include the design, implementation and maintenance of adequate internal financial controls that were operating effectively for ensuring the orderly and efficient conduct of the company’s business, including adherence to the company’s policies, the safeguarding of its assets, the prevention and detection of frauds and errors, the accuracy and completeness of the accounting records, and the timely preparation of reliable financial information, as required under the Act.
auDIToR’s ResponsIbILITy3. Our responsibility is to express an opinion on the
IFCoFR of the Holding Company and it’s subsidiaries, as aforesaid, based on our audit. We conducted our audit in accordance with the Standards on Auditing issued by the ICAI and deemed to be prescribed under Section 143(10) of the Act, to the extent applicable to an audit of IFCoFR, and the Guidance Note issued by the ICAI. Those Standards and the Guidance Note require that we comply with ethical requirements
and plan and perform the audit to obtain reasonable assurance about whether adequate IFCoFR were established and maintained and if such controls operated effectively in all material respects.
4. Our audit involves performing procedures to obtain audit evidence about the adequacy of the IFCoFR and their operating effectiveness. Our audit of IFCoFR includes obtaining an understanding of IFCoFR, assessing the risk that a material weakness exists, and testing and evaluating the design and operating effectiveness of internal control based on the assessed risk. The procedures selected depend on the auditor’s judgement, including the assessment of the risks of material misstatement of the financial statements, whether due to fraud or error.
5. We believe that the audit evidence we have obtained is sufficient and appropriate to provide a basis for our audit opinion on the IFCoFR of the Holding Company and it’s subsidiaries, as aforesaid.
meanIng oF InTeRnaL FInanCIaL ConTRoLs oveR FInanCIaL RepoRTIng6. A company’s IFCoFR is a process designed to provide
reasonable assurance regarding the reliability of financial reporting and the preparation of financial statements for external purposes in accordance with generally accepted accounting principles. A company’s IFCoFR include those policies and procedures that (1) pertain to the maintenance of records that, in reasonable detail, accurately and fairly reflect the transactions and dispositions of the assets of the company; (2) provide reasonable assurance that transactions are recorded as necessary to permit preparation of financial statements in accordance with generally accepted accounting principles, and that receipts and expenditures of the company are being made only in accordance with authorisations of management and directors of the company; and (3) provide reasonable assurance regarding prevention or timely detection of unauthorised acquisition, use, or disposition of the company’s assets that could have a material effect on the financial statements.

Annual Report 2017
Con
solid
ated
Fina
ncia
l Sta
tem
ents
Sta
tuto
ry R
epor
tsC
orpo
rate
Ove
rvie
w
153 204
InheRenT LImITaTIons oF InTeRnaL FInanCIaL ConTRoLs oveR FInanCIaL RepoRTIng7. Because of the inherent limitations of IFCoFR,
including the possibility of collusion or improper management override of controls, material misstatements due to error or fraud may occur and not be detected. Also, projections of any evaluation of the IFCoFR to future periods are subject to the risk that the IFCoFR may become inadequate because of changes in conditions, or that the degree of compliance with the policies or procedures may deteriorate.
opInIon8. In our opinion the Holding Company and it’s
subsidiaries has in all material respects, adequate internal financial controls over financial reporting and such controls were operating effectively as at 31
December 2017, based on the internal control over financial reporting criteria established by the Group considering the essential components of internal control stated in the Guidance Note issued by the ICAI.
For Walker Chandiok & Co LLp Chartered AccountantsFirm’s Registration No.: 001076N/N500013
Per Rakesh R. agarwalPartnerMembership No.: 109632
Place: Mumbai Date: 22 February 2018

ITD Cementation India Limited
154 204
Consolidated Balance Sheetas at 31 December 2017
` lakhs
notes as at 31 December 2017
as at 31 December 2016
as at 1 January 2016
asseTsnon-current assetsProperty, plant and equipment 3 46,175.25 38,534.25 33,564.35 Capital work-in-progress 3,849.03 560.20 196.84 Financial assets
Investments 4 57.49 57.49 57.49 Trade receivables 5 309.00 2,863.37 2,863.37 Loans 6 225.29 248.56 254.83 Other financial assets 7 39.00 8,677.57 8,694.61
Deferred tax assets (net) 8 293.98 199.42 3,918.35 Income tax assets (net) 8 1,108.26 6,672.90 4,393.65 Other non-current assets 9 22,440.67 15,039.38 12,725.17 Total non-current assets 74,497.97 72,853.14 66,668.66 Current assetsInventories 10 15,741.70 11,057.78 14,580.11 Financial assets
Investments 11 - 0.26 0.26 Trade receivables 5 23,985.01 21,464.86 24,670.21 Cash and cash equivalents 12 11,324.89 16,255.46 7,916.78 Other bank balances 13 253.41 272.48 6,257.82 Loans 6 40,025.29 16,211.93 11,984.62 Other financial assets 7 66,804.53 45,318.21 75,321.16
Other current assets 9 6,248.30 4,642.71 12,454.50 Total current assets 164,383.13 115,223.69 153,185.46
ToTaL asseTs 238,881.10 188,076.83 219,854.12
equITy anD LIabILITIesequityShare capital 14 1,551.58 1,551.58 1,551.58 Other equity 60,176.02 53,650.33 48,709.24 Total equity attributable to equity holders of the Company
61,727.60 55,201.91 50,260.82
Non-controlling interests 88.31 77.26 39.84 Total equity 61,815.91 55,279.17 50,300.66 Liabilitiesnon-current liabilitiesFinancial liabilities
Borrowings 15 2,461.76 4,062.13 982.81 Provisions 16 1,110.31 902.36 692.16 Deferred tax liabilities (net) 8 123.37 - -Total non-current liabilities 3,695.44 4,964.49 1,674.97 Current liabilitiesFinancial liabilities
Borrowings 17 42,238.52 29,348.43 45,168.90 Current maturities of long-term-borrowings 15 4,159.57 2,210.61 2,684.22 Trade payables 18 61,966.96 61,398.12 72,418.46 Other financial liabilities 19 7,085.97 4,205.04 3,658.09
Other current liabilities 20 55,516.58 28,689.37 42,351.30 Provisions 16 2,402.15 1,981.60 1,597.52 Total current liabilities 173,369.75 127,833.17 167,878.49
ToTaL equITy anD LIabILITIes 238,881.10 188,076.83 219,854.12
Notes 1 to 38 form an integral part of the consolidated financial statementsThis is the consolidated balance sheet referred to in our audit report of even date
For Walker Chandiok & Co LLp For and on behalf of the board of DirectorsChartered AccountantsFirm Registration No. 001076N/N500013
Rakesh R. agarwal adun saraban p. ChakornbunditPartner Managing Director DirectorMembership No: 109632 DIN: 01312769 DIN: 00254312
prasad patwardhan Rahul neogiChief Financial Officer Company SecretaryACA No.44453 ACS No.10653
Place : Mumbai Place : MumbaiDate : 22 February 2018 Date : 22 February 2018

Annual Report 2017
Con
solid
ated
Fina
ncia
l Sta
tem
ents
Sta
tuto
ry R
epor
tsC
orpo
rate
Ove
rvie
w
155 204
Statement of Consolidated Profit and Lossfor the year ended 31 December 2017
` lakhs
notes year ended 31 December 2017
year ended 31 December 2016
IncomeRevenue from operations 21 206,050.89 293,772.01
Other income 22 3,526.06 2,724.12
Total income 209,576.95 296,496.13 expenses
Cost of construction materials consumed 23 62,241.54 65,910.54
Subcontracting expenses 46,336.03 129,568.80
Employee benefits expense 24 25,737.01 22,185.93
Finance costs 25 8,757.67 8,914.76
Depreciation expense 3 5,774.33 4,631.00
Other expenses 26 44,589.63 49,674.60
Total expenses 193,436.21 280,885.63 profit before exceptional items, tax and share of loss of joint ventures 16,140.74 15,610.50 Share of loss from joint ventures (1,382.66) (5,702.21)
profit before exceptional items and tax 14,758.08 9,908.29 Exceptional items 27 (2,183.94) -
profit before tax 12,574.14 9,908.29 Tax expense 8
Current income tax 5,149.34 991.62
Deferred income tax 132.21 3,794.80
5,281.55 4,786.42 profit for the year (a) 7,292.59 5,121.87 other comprehensive income (oCI)Items that will not be reclassified subsequently to profit or loss
- Loss on fair value of defined benefit plans as per actuarial valuation (317.16) (219.23)
- Tax effect on above 109.77 75.88
Items that will be reclassified subsequently to profit or loss
- Fair value change on designated cash flow hedges, net 18.38 -
- Impairment of investment carried at fair value (0.26) -
- Tax effect on above (6.36) -
other comprehensive loss for the year, net of tax (b) (195.63) (143.35)Total comprehensive income for the year, net of tax (a+b) 7,096.96 4,978.52 Total comprehensive income attributable to:
Owners of the parent 7,085.92 4,941.09
Non-controlling interests 11.04 37.43
7,096.96 4,978.52 Earnings per equity share of nominal value ` 1 each
Basic and diluted (in `) 28 4.69 3.28
Notes 1 to 38 form an integral part of the consolidated financial statementsThis is the consolidated statement of profit and loss referred to in our audit report of even date
For Walker Chandiok & Co LLp For and on behalf of the board of Directors Chartered AccountantsFirm Registration No. 001076N/N500013
Rakesh R. agarwal adun saraban p. ChakornbunditPartner Managing Director DirectorMembership No: 109632 DIN: 01312769 DIN: 00254312
prasad patwardhan Rahul neogiChief Financial Officer Company SecretaryACA No.44453 ACS No.10653
Place : Mumbai Place : MumbaiDate : 22 February 2018 Date : 22 February 2018

ITD Cementation India Limited
156 204
Consolidated Cash flow statementfor the year ended 31 December 2017
` lakhs
year ended 31 December 2017
year ended 31 December 2016
a. Cash FLoW FRom opeRaTIng aCTIvITIes
Net profit before tax 12,574.14 9,908.29
adjustments for
Depreciation expense 5,774.33 4,631.00
Finance costs 8,757.67 8,914.76
Interest income (2,333.45) (2,060.81)
Impairment allowance on financial assets 11,709.23 1,784.87
Share of loss from unincorporated entities (net) 1,382.66 5,702.21
Loss on disposal of property, plant and equipment (net) 657.57 432.08
Excess provision no longer required written back (9,393.43) (253.73)
Exchange gain (net) (15.95) (25.64)
operating profit before working capital changes 29,112.77 29,033.03
adjustment for change in working capital
(Increase)/decrease in Inventories (4,683.92) 3,522.33
(Increase)/decrease in trade receivables (3,278.50) 1,182.25
(Increase)/decrease in loans and advances (45,027.25) 25,690.86
Increase/(decrease) in trade and other payables 30,281.60 (23,559.22)
Cash (used in)/generated from operations 6,404.70 35,869.25
Direct taxes paid (net of refunds received) 415.30 (3,270.87)
net cash generated from operating activities (a) 6,820.00 32,598.38
b. Cash FLoW FRom InvesTIng aCTIvITIes
Purchase of property, plant and equipment (including capital work in progress, capital advances and creditors for capital expenses)
(17,422.76) (9,591.19)
Proceeds from disposal of property, plant and equipment 352.31 86.60
Proceeds from fixed deposit with bank (maturity beyond three months) 21.07 5,996.63
Interest received 1,341.31 1,478.35
net cash used in investing activities (b) (15,708.07) (2,029.61)
C. Cash FLoW FRom FInanCIng aCTIvITIes
Proceeds from long-term borrowings 2,672.00 5,812.63
Repayment of long-term borrowings (2,323.42) (3,206.92)
Proceeds from short term borrowings (net) 12,890.10 (15,820.47)
Interest and other finance costs (8,720.95) (9,015.33)
Dividend paid (465.46) -
Tax on distributed profits (94.77) -
net cash generated/(used) in financing activities (C) 3,957.50 (22,230.09)
net (decrease)/increase in cash and cash equivalents (a + b + C) (4,930.57) 8,338.68
Cash and cash equivalents at the beginning of year 16,255.46 7,916.78
Cash and cash equivalents at the end of year 11,324.89 16,255.46
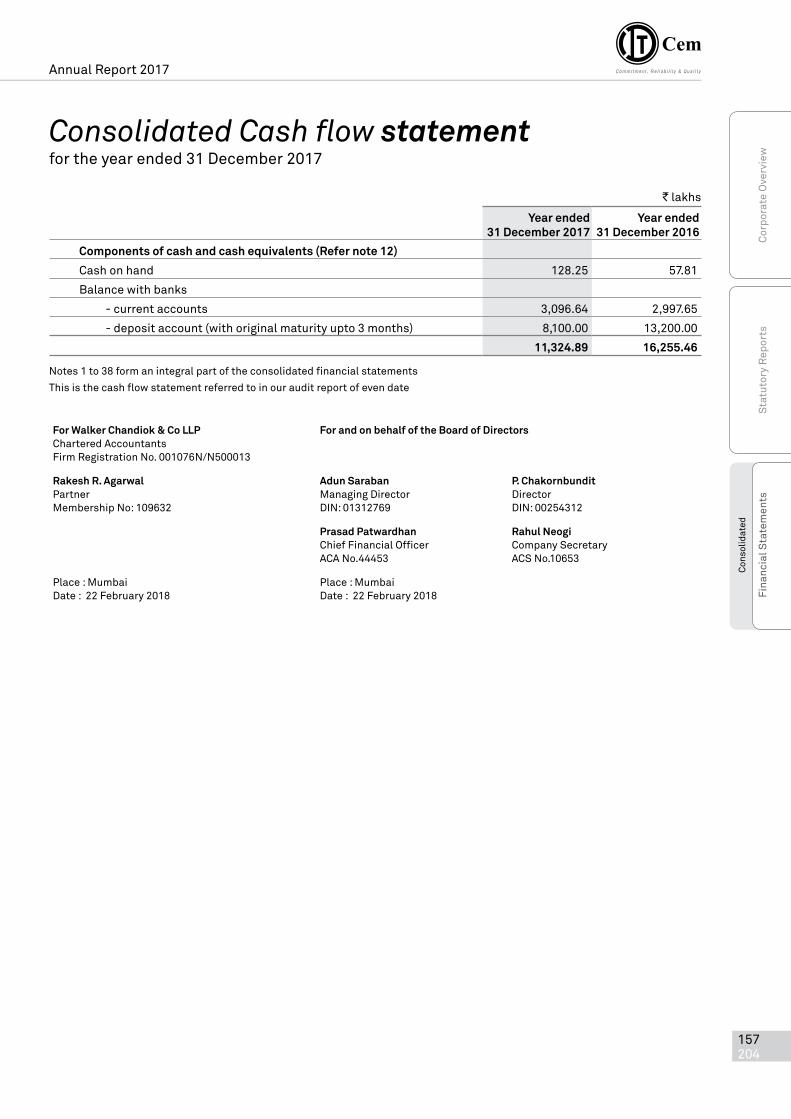
Annual Report 2017
Con
solid
ated
Fina
ncia
l Sta
tem
ents
Sta
tuto
ry R
epor
tsC
orpo
rate
Ove
rvie
w
157 204
Consolidated Cash flow statementfor the year ended 31 December 2017
` lakhs
year ended 31 December 2017
year ended 31 December 2016
Components of cash and cash equivalents (Refer note 12)
Cash on hand 128.25 57.81
Balance with banks
- current accounts 3,096.64 2,997.65
- deposit account (with original maturity upto 3 months) 8,100.00 13,200.00
11,324.89 16,255.46
Notes 1 to 38 form an integral part of the consolidated financial statements
This is the cash flow statement referred to in our audit report of even date
For Walker Chandiok & Co LLp For and on behalf of the board of Directors Chartered AccountantsFirm Registration No. 001076N/N500013
Rakesh R. agarwal adun saraban p. ChakornbunditPartner Managing Director DirectorMembership No: 109632 DIN: 01312769 DIN: 00254312
prasad patwardhan Rahul neogiChief Financial Officer Company SecretaryACA No.44453 ACS No.10653
Place : Mumbai Place : MumbaiDate : 22 February 2018 Date : 22 February 2018

ITD Cementation India Limited
158 204
Consolidated Statement of Changes in Equity
a) equity share capital
number of equity shares ` lakhs
equity shares of ` 1 each issued, subscribed and paidAs at 1 January 2016 155,157,900 1,551.58 Changes in equity share capital - - as at 31 December 2016 155,157,900 1,551.58 Changes in equity share capital - - as at 31 December 2017 155,157,900 1,551.58
b) other equity` lakhs
Reserves and surplus other comprehensive income Total equity attributable
to equity holders
non-controlling
interests
Total equity securities
premium reserve
general reserve
Retained earnings
Loss on fair value
of defined benefit plans
hedge reserve
Impairment of investment carried at fair
value
as at 1 January 2016 45,556.44 676.48 2,476.32 - - - 48,709.24 39.84 48,749.08Profit for the year - - 5,084.44 - - - 5,084.44 37.43 5,121.87
Other comprehensive income for the year
- - - (143.35) - - (143.35) - (143.35)
as at 31 December 2016 45,556.44 676.48 7,560.76 (143.35) - - 53,650.33 77.27 53,727.60Payment of dividend and dividend distribution tax
- - (560.23) - - - (560.23) - (560.23)
Profit for the year - - 7,281.55 - - - 7,281.55 11.04 7,292.59
Other comprehensive income for the year
- - - (207.39) 12.02 (0.26) (195.63) - (195.63)
as at 31 December 2017 45,556.44 676.48 14,282.08 (350.74) 12.02 (0.26) 60,176.02 88.31 60,264.33
nature and purpose of reservesi. securities premium reserve Securities premium reserve is used to record the premium on issue of shares. The reserve will be utilised in
accordance with the provisions of the Act.
ii. Loss on fair value of defined benefit plans The Company has recognised remeasurement loss (net of tax) on defined benefit plans in OCI. These changes
are accumulated within the OCI reserve within other equity. The Company transfers amounts from this reserve to retained earnings when the relevant obligations are derecognised.
iii. hedge reserve The Company has recognised changes in the fair value of forward contracts that are designated and effective
as hedges of future cash flows in OCI under hedge reserve, net of applicable deferred income taxes. Amounts accumulated under the hedging cash flow hedge reserve are reclassified to the statement of profit and loss in the same period during which the forecasted transaction affects to the statement of profit and loss.
Notes 1 to 38 form an integral part of the consolidated financial statementsThis is the consolidated statement of changes in equity referred to in our audit report of even date
for the year ended 31 December 2017
For Walker Chandiok & Co LLp For and on behalf of the board of Directors Chartered AccountantsFirm Registration No. 001076N/N500013
Rakesh R. agarwal adun saraban p. ChakornbunditPartner Managing Director DirectorMembership No: 109632 DIN: 01312769 DIN: 00254312
prasad patwardhan Rahul neogiChief Financial Officer Company SecretaryACA No.44453 ACS No.10653
Place : Mumbai Place : MumbaiDate : 22 February 2018 Date : 22 February 2018

Summary of significant accounting policies and other explanatory information to the consolidated financial statements as at and for the year ended 31 December 2017
Annual Report 2017
Con
solid
ated
Fina
ncia
l Sta
tem
ents
Sta
tuto
ry R
epor
tsC
orpo
rate
Ove
rvie
w
159 204
noTe 1 - CoRpoRaTe InFoRmaTIonITD Cementation India Limited (‘ITD Cem’ or ‘the Group’) is a public Group domiciled in India and was incorporated in 1978 under the provisions of the erstwhile Companies Act, 1956. Its shares are listed on two recognised stock exchanges in India - the BSE Limited and the National Stock Exchange of India Limited. The registered office of the Company is located at National Plastic Building, A Subhash Road, Paranjape B Scheme, Vile Parle (East), Mumbai 400057, India.
The financial statements comprises the financial statements of the Company and its subsidiaries (the Company and its subsidiaries referred to as the “Group”) and unincorporated entities. The consolidated financial statements were authorised for issue in accordance with a resolution of the Board of Directors on 22 February 2018.
The Group is engaged in construction of a wide variety of structures like maritime structures, mass rapid transport systems (MRTS), dams & tunnels, airports, highways, bridges & flyovers and other foundations and specialised engineering work. The activities of the Group comprise only one business segment viz Construction.
noTe 2.1 - sIgnIFICanT aCCounTIng poLICIesi basis of preparation The financial statements of the Group have been prepared to comply in all material respects with the Indian
Accounting Standards (“Ind AS”) notified under the Companies (Accounting Standards) Rules, 2015.
The financial statements for all periods upto and including year ended 31 December 2016 were prepared in accordance with the Companies (Accounting Standards) Rules, 2006 notified under Section 133 of the Companies Act, 2013 (“the Act”), read with Rule 7 of the Companies (Accounts) Rules, 2014 (as amended) (“previous GAAP”). The financial statements for the year ended 31 December 2017 are the first financial statements prepared by the Group in accordance with Ind AS. Refer note 2.3 for information on how the Group adopted Ind AS.
The financial statements have been prepared under the historical cost convention, with the exception of certain financial assets and liabilities which have been measured at fair value, on an accrual basis.
The Group’s financial statements are reported in Indian Rupees, which is also the Group’s functional currency, and all values are rounded to the nearest lakhs (` 00,000), except when otherwise indicated.
ii operating cycle for current and non-current classification: All the assets and liabilities have been classified as current or non-current, wherever applicable, as per the
operating cycle of the Group as per the guidance set out in Schedule III to the Act. Operating cycle for the business activities of the Group covers the duration of the project/ contract/ service including the defect liability period, wherever applicable, and extends upto the realisation of receivables (including retention monies) within the credit period normally applicable to the respective project.
iii principles of Consolidation The financial statements have been prepared on the following basis:
(i) subsidiaries Subsidiaries are all entities over which the Group has control. The Group controls an entity when the Group
is exposed to, or has rights to, variable returns from its involvement with the entity and has the ability to affect those returns through its power to direct the relevant activities of the entity. Subsidiaries are fully consolidated from the date on which control is transferred to the Group. They are deconsolidated from the date the control ceases. The acquisition method of accounting is used to account for business combination by the Group. The Group combines the separate financial statements of the parent and its subsidiaries line by line adding together like items of assets, liabilities, Contingent liability, equity, income and expenses. Intercompany transactions, balances and unrealised gains on transactions between group companies are eliminated. Unrealised losses are also eliminated unless the transaction provides evidence of an impairment of the transferred asset. Accounting policies of subsidiaries have been changed where necessary and practicable to ensure consistency with the policies adopted by the Group.

Summary of significant accounting policies and other explanatory information to the consolidated financial statements as at and for the year ended 31 December 2017
ITD Cementation India Limited
160 204
Non-controlling interests in the results and equity of subsidiaries are shown separately in the consolidated statement of profit and loss, consolidated statement of changes in equity and balance sheet, respectively.
(ii) Joint arrangements Under Ind AS 111 Joint Arrangements, investments in joint arrangements are classified as either joint
operations or joint ventures. The classification depends on the contractual rights and obligations of each investor, rather than the legal structure of the joint arrangement.
Joint operations The Group recognises its direct right to the assets, liabilities, contingent liabilities, revenues and expenses of
joint operations and its share of any jointly held or incurred assets, liabilities, revenues and expenses. These have been incorporated in the financial statements under the appropriate headings.
Joint ventures Interests in joint ventures are accounted for using the equity method, after initially being recognised at cost in
the consolidated balance sheet.
(iii) equity method Under the equity method of accounting, the investments are initially recognised at cost and adjusted thereafter
to recognise the Group’s share of the post-acquisition profits or losses of the investee in profit and loss, and the Group’s share of other comprehensive income of the investee in other comprehensive income (“OCI”).
When the Group’s share of losses in an equity accounted investment equals or exceeds its interest in the entity, including any other unsecured long-term receivables, the Group does not recognise further losses, unless it has incurred obligations or made payments on behalf of the other entity.
Unrealised gains on transactions between the Group and its associates and joint ventures are eliminated to the extent of the Group’s interest in these entities. Unrealised losses are also eliminated unless the transaction provides evidence of an impairment of the asset transferred.
Accounting policies of equity accounted investees have been changed where necessary and practicable to ensure consistency with the policies adopted by the Group.
The carrying amount of the equity accounted investments are tested for impairment in accordance with the policy described in note viii(a)(iii)
(iv) Change in ownership interests The Group treats transactions with non-controlling transactions with equity owners of the Group. A change
in ownership interest results in an adjustment between the carrying amounts of the controlling and non-controlling interests or reflect their relative interests in the subsidiary. Any difference between the amount of the adjustment to non-controlling interests and any consideration paid or received is recognised within equity. When the Group ceases to consolidate or equity account for an investment because of a loss of control, joint control or significant influence any retained interest in the entity is remeasured to its fair value with the change in carrying amount recognised in profit and loss. The fair value becomes the initial carrying amount for the purposes of subsequent accounting for the retained interest as an associate, joint venture or financial asset. In addition, any amounts previously recognised in OCI in respect of that entity are reclassified to profit or loss as if the Group had directly disposed of the related assets and liabilities.
If the ownership interest in a joint venture or an associate is reduced but joint control or significant influence is retained, only a proportionate share of the amounts previously recognised in OCI are reclassified to profit or loss where appropriate.

Summary of significant accounting policies and other explanatory information to the consolidated financial statements as at and for the year ended 31 December 2017
Annual Report 2017
Con
solid
ated
Fina
ncia
l Sta
tem
ents
Sta
tuto
ry R
epor
tsC
orpo
rate
Ove
rvie
w
161 204
The financial statements are prepared using uniform accounting policies for like transactions and other events in similar circumstances. If a member of the Group uses accounting policies other than those adopted in the financial statements for like transactions and events in similar circumstances, appropriate adjustments are made to that Group member’s separate financial statements in preparing the financial statements to ensure conformity with the Group’s accounting policies, wherever necessary and practicable.
Notes to the financial statements represent notes involving items which are considered material and are accordingly disclosed. Materiality for the purpose is assessed in relation to the information contained in the financial statements. Further, additional statutory information disclosed in separate financial statements of the subsidiary and/or a parent having no bearing on the true and fair view of the financial statements has not been disclosed in these financial statements.
iv accounting estimates The preparation of the financial statements, in conformity with the recognition and measurement principles of Ind
AS, requires the management to make estimates and assumptions that affect the reported amounts of assets and liabilities and disclosure of contingent liabilities as at the date of financial statements and the results of operation during the reported period. Although these estimates are based upon management’s best knowledge of current events and actions, actual results could differ from these estimates which are recognised in the period in which they are determined.
estimates and assumptions The key assumptions concerning the future and other key sources of estimation uncertainty at the reporting date,
that have a significant risk of causing a material adjustment to the carrying amounts of assets and liabilities within the next financial year, are described below. The Group based its assumptions and estimates on parameters available when the financial statements were prepared. Existing circumstances and assumptions about future developments, however, may change due to market changes or circumstances arising that are beyond the control of the Group. Such changes are reflected in the financial statements in the period in which changes are made and, if material, their effects are disclosed in the notes to the financial statements.
Contract estimates The Group, being a part of construction industry, prepares budgets in respect of each project to compute project
profitability. The two major components of contract estimate are ‘claims arising during construction period’ (described below) and ‘budgeted costs to complete the contract’. While estimating these components various assumptions are considered by the management such as (i) Work will be executed in the manner expected so that the project is completed timely (ii) consumption norms will remain same (iii) Assets will operate at the same level of productivity as determined (iv) Wastage will not exceed the normal % as determined etc. (v) Estimates for contingencies (vi) No change in design and the geological factors will be same as communicated; and (vii) Price escalations etc. Due to such complexities involved in the budgeting process, contract estimates are highly sensitive to changes in these assumptions. All assumptions are reviewed at each reporting date.
Recoverability of claims The Group has claims in respect of cost over-run arising due to client caused delays, suspension of projects,
deviation in design and change in scope of work etc., which are at various stages of negotiation/discussion with the clients or under arbitration. The realisability of these claims are estimated based on contractual terms, historical experience with similar claims as well as legal opinion obtained from internal and external experts, wherever necessary. Changes in facts of the case or the legal framework may impact ultimate realisability of these claims.
Defined benefit plans The cost and present value of the gratuity obligation and compensated absences are determined using actuarial
valuations. An actuarial valuation involves making various assumptions that may differ from actual developments in the future. These include the determination of the discount rate, future salary increases, attrition rate and mortality rates. Due to the complexities involved in the valuation and its long-term nature, a defined benefit obligation is highly sensitive to changes in these assumptions. All assumptions are reviewed at each reporting date.

Summary of significant accounting policies and other explanatory information to the consolidated financial statements as at and for the year ended 31 December 2017
ITD Cementation India Limited
162 204
Deferred tax assets In assessing the realisability of deferred income tax assets, management considers whether some portion
or all of the deferred income tax assets will not be realized. The ultimate realization of deferred income tax assets is dependent upon the generation of future taxable income during the periods in which the temporary differences become deductible. Management considers the scheduled reversals of deferred income tax liabilities, projected future taxable income, and tax planning strategies in making this assessment. Based on the level of historical taxable income and projections for future taxable income over the periods in which the deferred income tax assets are deductible, management believes that the Group will realize the benefits of those deductible differences. The amount of the deferred income tax assets considered realizable, however, could be reduced in the near term if estimates of future taxable income during the carry forward period are reduced.
v Fair value measurement The Group measures financial instruments, at fair value at each balance sheet date. (Refer Note 32)
Fair value is the price that would be received to sell an asset or paid to transfer a liability in an orderly transaction between market participants at the measurement date. The fair value measurement is based on the presumption that the transaction to sell the asset or transfer the liability takes place either:
- In the principal market for the asset or liability, or
- In the absence of a principal market, In the most advantageous market for the asset or liability.
The principal or the most advantageous market must be accessible by the Group.
The fair value of an asset or a liability is measured using the assumptions that market participants would use when pricing the asset or liability, assuming that market participants act in their economic best interest.
A fair value measurement of a non-financial asset takes into account a market participant’s ability to generate economic benefits by using the asset in its highest and best use or by selling it to another market participant that would use the asset in its highest and best use.
The Group uses valuation techniques that are appropriate in the circumstances and for which sufficient data is available to measure fair value, maximising the use of relevant observable inputs and minimising the use of unobservable inputs. All assets and liabilities for which fair value is measured or disclosed in the financial statements are categorized within the fair value hierarchy, described as follows, based on the lowest level input that is significant to the fair value measurement as a whole:
Level 1 - Quoted prices (unadjusted) in active markets for identical assets or liabilities.
Level 2 - Inputs other than quoted prices included within Level 1 that are observable for the asset or liability, either directly (i.e. as prices) or indirectly (i.e. derived from prices).
Level 3 - Inputs for the assets or liabilities that are not based on observable market data (unobservable inputs).
For assets and liabilities that are recognised in the financial statements on a recurring basis, the Group determines whether transfers have occurred between levels in the hierarchy by re-assessing categorisation (based on the lowest level input that is significant to the fair value measurement as a whole) at the end of each reporting period.
At each reporting date, the Management analyses the movements in the values of assets and liabilities which are required to be remeasured or re-assessed as per the Group’s accounting policies. For this analysis, the Management verifies the major inputs applied in the latest valuation by agreeing the information in the valuation computation to contracts and other relevant documents.
The Management also compares the change in the fair value of each asset and liability with relevant external sources to determine whether the change is reasonable.

Summary of significant accounting policies and other explanatory information to the consolidated financial statements as at and for the year ended 31 December 2017
Annual Report 2017
Con
solid
ated
Fina
ncia
l Sta
tem
ents
Sta
tuto
ry R
epor
tsC
orpo
rate
Ove
rvie
w
163 204
vi property, plant and equipment Property, Plant and Equipment are stated at cost of acquisition till the date of acquisition/ installation of the assets
less accumulated depreciation and accumulated impairment losses, if any. Subsequent expenditure relating to Property, Plant and Equipment is capitalised only when it is probable that future economic benefits associated with the item will flow to the Group and the cost of the item can be measured reliably. All other repairs and maintenance costs are charged to the Statement of Profit and Loss as incurred. The cost and related accumulated depreciation are eliminated from the financial statements, either on disposal or when retired from active use and the resultant gain or loss are recognised in the Statement of Profit and Loss.
Capital work-in-progress, representing expenditure incurred in respect of assets under development and not ready for their intended use, are carried at cost. Cost includes related acquisition expenses, construction cost and other direct expenditure.
Pursuant to transition to Indian Accounting Standard, on the date of transition i.e. 1 January 2016; the Tools and equipment as at 31 December 2015 hitherto included under inventories have been reclassified to Property, Plant and Equipment.
On transition to Ind AS, the Group has opted to continue with the carrying values measured under the previous GAAP as at 1 January 2016 of its Property, Plant and Equipment and use that carrying value as the deemed cost of the Property, Plant and Equipment on the date of transition i.e. 1 January 2016.
vii Depreciation expenses Depreciation is calculated on a straight line method using the useful lives as prescribed in Schedule II to the Act or
in case of assets where useful lives were determined by technical evaluation and management’s experience of use of those assets, over the useful life so determined. Depreciation on additions to/deductions from owned assets is calculated pro-rata to the period of use.
Depreciation method is reviewed at each financial year end to reflect the expected pattern of consumption of the future economic benefits embodied in the asset. The estimated useful life and residual values are also reviewed at each financial year end and the effect of any change in the estimates of useful life/residual value is accounted on prospective basis.
An asset’s carrying value is written down immediately to its recoverable amount if the asset’s carrying value is greater than the estimated recoverable amount.
The estimated useful lives of items of Property, Plant and Equipment for current and comparative periods are as follows:
asset Class useful lives
Leasehold improvements Lease period or 5 years, whichever is lower
Buildings 60 years
Leasehold buildings Lease period or 60 years, whichever is lower
Plant and equipment (including tools and equipment) 3 - 21 years
Vehicles 8 years
Office equipment 5 years
Furniture and fixtures 10 years
Computer equipment 3 - 6 years
Freehold land is carried at historical costs

Summary of significant accounting policies and other explanatory information to the consolidated financial statements as at and for the year ended 31 December 2017
ITD Cementation India Limited
164 204
viii Financial Instruments A financial instrument is any contract that gives rise to a financial asset of one entity and a financial liability or
equity instrument of another entity.
a Financial assets (i) Initial Recognition In the case of financial assets, not recorded at fair value through profit or loss (FVPL), financial assets
are recognised initially at fair value plus transaction costs that are directly attributable to the acquisition of the financial asset. Purchases or sales of financial assets that require delivery of assets within a time frame established by regulation or convention in the market place (regular way trades) are recognised on the trade date i.e., the date that the Group commits to purchase or sell the asset.
(ii) Subsequent Measurement For purposes of subsequent measurement, financial assets are classified in following categories:
- Financial Assets at Amortised Cost Financial assets are subsequently measured at amortised cost if these financial assets are held within a
business model with an objective to hold these assets in order to collect contractual cash flows and the contractual terms of the financial asset give rise on specified dates to cash flows that are solely payments of principal and interest on the principal amount outstanding. Interest income from these financial assets is included in finance income using the effective interest rate (“EIR”) method. Impairment gains or losses arising on these assets are recognised in the Statement of Profit and Loss.
- Financial Assets Measured at Fair Value Financial assets are subsequently measured at fair value through OCI if these financial assets are held
within a business model with an objective to hold these assets in order to collect contractual cash flows and to sell these financial assets and the contractual terms of the financial asset give rise on specified dates to cash flows that are solely payments of principal and interest on the principal amount outstanding. Movements in the carrying amount are taken through OCI, except for the recognition of impairment gains or losses, interest revenue and foreign exchange gains and losses which are recognised in the Statement of Profit and Loss.
Financial asset not measured at amortised cost or at fair value through OCI is carried at FVPL.
On transition to Ind AS, the Group has opted to continue with the carrying values measured under the previous GAAP as at 1 January 2016 of its equity investments in subsidiary and used that carrying value as the deemed cost of these investments on the date of transition i.e. 1 January 2016.
(iii) Impairment of Financial Assets In accordance with Ind AS 109, the Group applies the Expected Credit Loss (“ECL”) model for measurement
and recognition of impairment loss on financial assets and credit risk exposures.
The Group follows ‘simplified approach’ for recognition of impairment loss allowance on trade receivables. Simplified approach does not require the Group to track changes in credit risk. Rather, it recognises impairment loss allowance based on lifetime ECL at each reporting date, right from its initial recognition.
For recognition of impairment loss on other financial assets and risk exposure, the Group determines that whether there has been a significant increase in the credit risk since initial recognition. If credit risk has not increased significantly, 12-month ECL is used to provide for impairment loss. However, if credit risk has increased significantly, lifetime ECL is used. If, in a subsequent period, credit quality of the instrument improves such that there is no longer a significant increase in credit risk since initial recognition, then the entity reverts to recognising impairment loss allowance based on 12-month ECL.

Summary of significant accounting policies and other explanatory information to the consolidated financial statements as at and for the year ended 31 December 2017
Annual Report 2017
Con
solid
ated
Fina
ncia
l Sta
tem
ents
Sta
tuto
ry R
epor
tsC
orpo
rate
Ove
rvie
w
165 204
ECL is the difference between all contractual cash flows that are due to the group in accordance with the contract and all the cash flows that the entity expects to receive (i.e., all cash shortfalls), discounted at the original EIR. Lifetime ECL are the expected credit losses resulting from all possible default events over the expected life of a financial instrument. The 12-month ECL is a portion of the lifetime ECL which results from default events that are possible within 12 months after the reporting date.
ECL impairment loss allowance (or reversal) during the period is recognised as income/expense in the Statement of Profit and Loss.
(iv) De-recognition of Financial Assets The Group de-recognises a financial asset only when the contractual rights to the cash flows from the
asset expire, or it transfers the financial asset and substantially all risks and rewards of ownership of the asset to another entity.
If the Group neither transfers nor retains substantially all the risks and rewards of ownership and continues to control the transferred asset, the Group recognizes its retained interest in the assets and an associated liability for amounts it may have to pay.
If the Group retains substantially all the risks and rewards of ownership of a transferred financial asset, the Group continues to recognise the financial asset and also recognises a collateralised borrowing for the proceeds received.
b equity Instruments and Financial Liabilities Financial liabilities and equity instruments issued by the Group are classified according to the substance of
the contractual arrangements entered into and the definitions of a financial liability and an equity instrument.
equity Instruments An equity instrument is any contract that evidences a residual interest in the assets of the Group after deducting
all of its liabilities. Equity instruments which are issued for cash are recorded at the proceeds received, net of direct issue costs. Equity instruments which are issued for consideration other than cash are recorded at fair value of the equity instrument.
Financial Liabilities (i) Initial Recognition Financial liabilities are classified, at initial recognition, as financial liabilities at FVPL, loans and
borrowings and payables as appropriate. All financial liabilities are recognised initially at fair value and, in the case of loans and borrowings and payables, net of directly attributable transaction costs.
(ii) Subsequent Measurement Non-derivative financial instruments The measurement of financial liabilities depends on their classification, as described below :
- Financial liabilities at FVPL Financial liabilities at FVPL include financial liabilities held for trading and financial liabilities designated
upon initial recognition as at FVPL. Financial liabilities are classified as held for trading if they are incurred for the purpose of repurchasing in the near term. Gains or losses on liabilities held for trading are recognised in the Statement of Profit and Loss.
Financial guarantee contracts issued by the Group are those contracts that require a payment to be made to reimburse the holder for a loss it incurs because the specified debtor fails to make a payment when due in accordance with the terms of a debt instrument. Financial guarantee contracts are recognised initially as a liability at fair value, adjusted for transaction costs that are directly attributable to the issuance

Summary of significant accounting policies and other explanatory information to the consolidated financial statements as at and for the year ended 31 December 2017
ITD Cementation India Limited
166 204
of the guarantee. Subsequently, the liability is measured at the higher of the amount of loss allowance determined as per impairment requirements of Ind AS 109 and the amount recognised less cumulative amortisation. Amortisation is recognised as finance income in the Statement of Profit and Loss.
- Financial liabilities at amortised cost After initial recognition, interest-bearing loans and borrowings are subsequently measured at amortised
cost using the EIR method. Any difference between the proceeds (net of transaction costs) and the settlement or redemption of borrowings is recognised over the term of the borrowings in the Statement of Profit and Loss.
Amortised cost is calculated by taking into account any discount or premium on acquisition and fees or costs that are an integral part of the EIR. The EIR amortisation is included as finance costs in the Statement of Profit and Loss.
Derivative financial instruments The Company uses derivative financial instruments i.e. foreign exchange forward and options contracts
to manage its exposure to foreign exchange risks. Such derivative financial instruments are initially recognized at fair value on the date on which a derivative contract is entered into and are subsequently re-measured at fair value. The Company uses hedging instruments that are governed by the policies of the Company.
Hedge Accounting The Company uses foreign currency forward and options contracts to hedge its risks associated with
foreign currency fluctuations relating to highly probable forecast transactions. The Company designates such forward contracts in a cash flow hedging relationship by applying the hedge accounting principles. These forward contracts are stated at fair value at each reporting date. Changes in the fair value of these forward contracts that are designated and effective as hedges of future cash flows are recognized directly in OCI and accumulated under the hedging cash flow hedge reserve, net of applicable deferred income taxes and the ineffective portion is recognized immediately to the statement of profit and loss. Amounts accumulated under the hedging cash flow hedge reserve are reclassified to the statement of profit and loss in the same period during which the forecasted transaction affects to the statement of profit and loss. For forecasted transactions, any cumulative gain or loss on the hedging instrument recognized under the hedging cash flow hedge reserve is retained until the forecasted transaction occurs. If the forecasted transaction is no longer expected to occur, the net cumulative gain or loss recognized under the hedging cash flow hedge reserve is immediately transferred to the statement of profit and loss.
(iii) De-recognition of Financial Liabilities Financial liabilities are de-recognised when the obligation specified in the contract is discharged,
cancelled or expired. When an existing financial liability is replaced by another from the same lender on substantially different terms, or the terms of an existing liability are substantially modified, such an exchange or modification is treated as de-recognition of the original liability and recognition of a new liability. The difference in the respective carrying amounts is recognised in the Statement of Profit and Loss.
c offsetting Financial Instruments Financial assets and financial liabilities are offset and the net amount is reported in the Balance Sheet if there
is a currently enforceable legal right to offset the recognised amounts and there is an intention to settle on a net basis to realise the assets and settle the liabilities simultaneously.

Summary of significant accounting policies and other explanatory information to the consolidated financial statements as at and for the year ended 31 December 2017
Annual Report 2017
Con
solid
ated
Fina
ncia
l Sta
tem
ents
Sta
tuto
ry R
epor
tsC
orpo
rate
Ove
rvie
w
167 204
ix employee benefits a Defined Contribution plan Contributions to defined contribution schemes such as supperannuation plan, employees’ state insurance,
labour welfare are charged as an expense based on the amount of contribution required to be made as and when services are rendered by the employees. The above benefits are classified as Defined Contribution Schemes as the Group has no further obligations beyond the monthly contributions.
b Defined benefit plan The Provident Fund set up by the Group is administered through trusts of the Group. Interest rate payable to
the members of the trust shall not be lower than the statutory rate of interest declared by Central Goverment under Employees Provident Fund and Miscellaneous Proivisions Act, 1952 and shortfall, if any, shall be made good by the Group. The contribution paid or payable including the interest shortfall, if any, is recognised as an expense in the period in which services are rendered by the employee. Accordingly the Provident Fund is treated as a defined benefit plan. Further, the pattern of investments for investible funds is as prescribed by the Government. Accordingly, other related disclosures in respect of provident fund have not been made.
The Group also provides for gratuity which is a defined benefit plan, the liabilities of which is determined based on valuations, as at the balance sheet date, made by an independent actuary using the projected unit credit method. Re-measurement, comprising of actuarial gains and losses, in respect of gratuity are recognised in the OCI, in the period in which they occur. Re-measurement recognised in OCI are not reclassified to the Statement of Profit and Loss in subsequent periods. Past service cost is recognised in the Statement of Profit and Loss in the year of plan amendment or curtailment. The classification of the Group’s obligation into current and non-current is as per the actuarial valuation report.
c Leave entitlement and compensated absences Accumulated leave which is expected to be utilised within next twelve months, is treated as short-term
employee benefit. Leave entitlement, other than short term compensated absences, are provided based on a actuarial valuation, similar to that of gratuity benefit. Re-measurement, comprising of actuarial gains and losses, in respect of leave entitlement are recognised in the Statement of Profit and Loss in the period in which they occur.
d short-term benefits Short-term employee benefits such as salaries, wages, performance incentives etc. are recognised as
expenses at the undiscounted amounts in the Statement of Profit and Loss of the period in which the related service is rendered. Expenses on non-accumulating compensated absences is recognised in the period in which the absences occur.
x Inventories i. Construction materials are valued at lower of cost and net realisable value. Cost is determined on a first-in,
first-out method and comprises the purchase price including duties and taxes (other than those subsequently recoverable by the Group from the taxing authorities). Net Realisable value is the estimated selling price in the ordinary course of business less the estimated cost necessary to make the sale.
ii. Spares that are of regular use are charged to the statement of profit and loss as and when consumed.
xi Cash and Cash equivalents Cash and cash equivalents in the Balance Sheet comprises of cash at banks and on hand and short-term deposits
with an original maturity of three month or less, which are subject to an insignificant risk of changes in value.
Summary of significant accounting policies and other explanatory information to the consolidated financial statements as at and for the year ended 31 December 2017
ITD Cementation India Limited
168 204
xii segment Reporting Operating segments are reported in a manner consistent with the internal reporting provided to the chief operating
decision maker. The chief operating decision maker regularly monitors and reviews the operating result of the whole Group as one segment of “Construction”. Thus, as defined in Ind AS 108 “Operating Segments”, the Group’s entire business falls under this one operational segment and hence the necessary information has already been disclosed in the Balance Sheet and the Statement of Profit and Loss.
xiii Foreign exchange Translation of Foreign projects and accounting of Foreign exchange Transaction a Initial Recognition Foreign currency transactions are initially recorded in the reporting currency, by applying to the foreign
currency amount the exchange rate between the reporting currency and the foreign currency at the date of the transaction.
b Conversion Monetary assets and liabilities denominated in foreign currencies are reported using the closing rate at the
reporting date. Non-monetary items which are carried in terms of historical cost denominated in a foreign currency are reported using the exchange rate at the date of the transaction.
c Treatment of exchange Difference Exchange differences arising on settlement/ restatement of foreign currency monetary assets and liabilities
of the Group are recognised as income or expense in the Statement of Profit and Loss.
xiv Revenue Recognition a accounting of Construction Contracts Revenue from construction contracts is recognised on the basis of percentage completion method. The stage
of completion of a contract is determined by the proportion that contract costs incurred for work performed upto the reporting date bear to the estimated total contract costs. Contract revenue earned in excess of certification has been classified as “Unbilled revenue” under Other Financial Asset and certification in excess of contract revenue has been classified as “Amount due to customer” under Other Current Liabilities in the financial statements.
In addition, if it is expected that the contract will make a loss, the estimated loss is immediately provided for in the books of account.
Advance payments received from contractee for which no services are rendered are presented as ‘Advances from contractee’.
b accounting for Claims Amounts recoverable in respect of the price and other escalation, bonus claims adjudication and variation in
contract work required for performance of the contract to the extent that it is probable that they will result in revenue.
c Finance and other Income Finance income is accrued on a time proportion basis, by reference to the principal outstanding and the
applicable effective interest rate. Other income is accounted for on accrual basis. Where the receipt of income is uncertain, it is accounted for on receipt basis.

Summary of significant accounting policies and other explanatory information to the consolidated financial statements as at and for the year ended 31 December 2017
Annual Report 2017
Con
solid
ated
Fina
ncia
l Sta
tem
ents
Sta
tuto
ry R
epor
tsC
orpo
rate
Ove
rvie
w
169 204
xv Income Tax Income tax comprises of current and deferred income tax. Income tax is recognised as an expense or income in the
Statement of Profit and Loss, except to the extent it relates to items directly recognised in equity or in OCI.
a Current Income Tax Current income tax is recognised based on the estimated tax liability computed after taking credit for
allowances and exemptions in accordance with the Income Tax Act, 1961. Current income tax assets and liabilities are measured at the amount expected to be recovered from or paid to the taxation authorities. The tax rates and tax laws used to compute the amount are those that are enacted or substantively enacted, at the reporting date.
b Deferred Income Tax Deferred tax is determined by applying the Balance Sheet approach. Deferred tax assets and liabilities are
recognised for all deductible temporary differences between the financial statements’ carrying amount of existing assets and liabilities and their respective tax base. Deferred tax assets and liabilities are measured using the enacted tax rates or tax rates that are substantively enacted at the Balance Sheet date. The effect on deferred tax assets and liabilities of a change in tax rates is recognised in the period that includes the enactment date. Deferred tax assets are only recognised to the extent that it is probable that future taxable profits will be available against which the temporary differences can be utilised. Such assets are reviewed at each Balance Sheet date to reassess realisation.
Deferred tax assets and liabilities are offset when there is a legally enforceable right to offset current tax assets and liabilities. Current tax assets and tax liabilities are offset where the entity has a legally enforceable right to offset and intends either to settle on a net basis, or to realise the asset and settle the liability simultaneously.
Minimum Alternate Tax (MAT) paid as per Indian Income Tax Act, 1961 is in the nature of unused tax credit which can be carried forward and utilised when the Group will pay normal income tax during the specified period. Deferred tax assets on such tax credit is recognised to the extent that it is probable that the unused tax credit can be utilised in the specified future period.
xvi Leases Leases, where the lessor effectively retains substantially all the risks and benefits of ownership over the leased
term, are classified as operating leases. Operating lease payments are recognised as an expense in the Statement of Profit and Loss on a straight-line basis over the lease term except where the lease payments are structured to increase in line with expected general inflation.
Assets acquired on finance lease are capitalised at fair value or present value of minimum lease payment at the inception of the lease, whichever is lower.
xvii Impairment of non-Financial assets As at each Balance Sheet date, the Group assesses whether there is an indication that a non-financial asset may
be impaired and also whether there is an indication of reversal of impairment loss recognised in the previous periods. If any indication exists, or when annual impairment testing for an asset is required, the Group determines the recoverable amount and impairment loss is recognised when the carrying amount of an asset exceeds its recoverable amount.
Recoverable amount is determined: - In case of an individual asset, at the higher of the assets’ fair value less cost to sell and value in use; and
- In case of cash generating unit (a group of assets that generates identified, independent cash flows), at the higher of cash generating unit’s fair value less cost to sell and value in use.

Summary of significant accounting policies and other explanatory information to the consolidated financial statements as at and for the year ended 31 December 2017
ITD Cementation India Limited
170 204
In assessing value in use, the estimated future cash flows are discounted to their present value using pre-tax discount rate that reflects current market assessments of the time value of money and risk specified to the asset. In determining fair value less cost to sell, recent market transaction are taken into account. If no such transaction can be identified, an appropriate valuation model is used.
Impairment losses of continuing operations, including impairment on inventories, are recognised in the Statement of Profit and Loss, except for properties previously revalued with the revaluation taken to OCI. For such properties, the impairment is recognised in OCI up to the amount of any previous revaluation.
When the Group considers that there are no realistic prospects of recovery of the asset, the relevant amounts are written off. If the amount of impairment loss subsequently decreases and the decrease can be related objectively to an event occurring after the impairment was recognised, then the previously recognised impairment loss is reversed through the Statement of Profit and Loss.
xviii Trade receivables A receivable is classified as a ‘trade receivable’ if it is in respect of the amount due on account of goods sold or
services rendered in the normal course of business. Trade receivables are recognised initially at fair value and subsequently measured at amortised cost using the EIR method, less provision for impairment.
xix Trade payables A payable is classified as a ‘trade payable’ if it is in respect of the amount due on account of goods purchased or
services received in the normal course of business. These amounts represent liabilities for goods and services provided to the Group prior to the end of the financial year which are unpaid. These amounts are unsecured and are usually settled as per the payment terms stated in the contract. Trade and other payables are presented as current liabilities unless payment is not due within 12 months after the reporting period. They are recognised initially at their fair value and subsequently measured at amortised cost using the EIR method.
xx earnings per share Basic earnings per share is computed by dividing the net profit or loss for the period attributable to the equity
shareholders of the Group by the weighted average number of equity shares outstanding during the period. The weighted average number of equity shares outstanding during the period and for all periods presented is adjusted for events, such as bonus shares, other than the conversion of potential equity shares, that have changed the number of equity shares outstanding, without a corresponding change in resources.
Diluted earnings per share is computed by dividing the net profit or loss for the period attributable to the equity shareholders of the Group and weighted average number of equity shares considered for deriving basic earnings per equity share and also the weighted average number of equity shares that could have been issued upon conversion of all dilutive potential equity shares. The dilutive potential equity shares are adjusted for the proceeds receivable had the equity shares been actually issued at fair value (i.e. the average market value of the outstanding equity shares).
xxi provisions, Contingent Liabilities and Contingent assets A provision is recognised when the Group has a present obligation (legal or constructive) as a result of past events
and it is probable that an outflow of resources embodying economic benefits will be required to settle the obligation, in respect of which a reliable estimate can be made of the amount of obligation. Provisions (excluding gratuity and compensated absences) are determined based on management’s estimate required to settle the obligation at the Balance Sheet date. In case the time value of money is material, provisions are discounted using a current pre-tax rate that reflects the risks specific to the liability. When discounting is used, the increase in the provision due to the passage of time is recognised as a finance cost. These are reviewed at each Balance Sheet date and adjusted to reflect the current management estimates.

Summary of significant accounting policies and other explanatory information to the consolidated financial statements as at and for the year ended 31 December 2017
Annual Report 2017
Con
solid
ated
Fina
ncia
l Sta
tem
ents
Sta
tuto
ry R
epor
tsC
orpo
rate
Ove
rvie
w
171 204
Contingent liabilities are disclosed in respect of possible obligations that arise from past events, whose existence would be confirmed by the occurrence or non-occurrence of one or more uncertain future events not wholly within the control of the Group. A contingent liability also arises, in rare cases, where a liability cannot be recognised because it cannot be measured reliably.
Contingent assets are neither recognised nor disclosed in the financial statements.
xxii exceptional Items When items of income and expense within profit or loss from ordinary activities are of such size, nature or incidence
that their disclosure is relevant to explain the performance of the enterprise for the period, the nature and amount of such material items are disclosed separately as exceptional items.
noTe 2.2 - ReCenT aCCounTIng pRonounCemenTsstandards issued but not yet effective In March 2017, the Ministry of Corporate Affairs issued the Companies (Indian Accounting Standards) (Amendments) Rules, 2017, notifying amendments to Ind AS 7, ‘Statement of cash flows’. These amendments are in accordance with the recent amendments made by International Accounting Standards Board (IASB) to IAS 7, ‘Statement of cash flows’. The amendments are applicable to the Group from 1 January 2018.
amendment to Ind as 7: The amendment to Ind AS 7 requires the entities to provide disclosures that enable users of financial statements to evaluate changes in liabilities arising from financing activities, including both changes arising from cash flows and non-cash changes, suggesting inclusion of a reconciliation between the opening and closing balances in the balance sheet for liabilities arising from financing activities, to meet the disclosure requirement.
The Group is evaluating the requirements of the amendment and the effect on the financial statements is being evaluated.
noTe 2.3 - DIsCLosuRes as RequIReD by InDIan aCCounTIng sTanDaRD (InD as) 101 FIRsT TIme aDopTIon oF InDIan aCCounTIng sTanDaRDThe Group has adopted Ind AS with effect from 1 January 2017 with comparatives being restated. Accordingly the impact of transition has been provided in the Opening Reserves as at 1 January 2016 and all the periods presented have been restated accordingly.
i exemptions availed on first time adoption of Ind as 101: On first time adoption of Ind AS, Ind AS 101 allows certain exemptions from the retrospective application of certain
requirements under Ind AS. The Group has availed the following exemptions:
a Since, there is no change in the functional currency of the Group, it has opted to continue with the carrying values measured under the previous GAAP and use that carrying value as the deemed cost for property, plant and equipment and intangible assets on the date of transition.
b The Group has opted to continue with the carrying values measured under the previous GAAP and use that carrying value as the deemed cost for equity investments on the date of transition to Ind AS.
c Fair value measurement of financial assets or liabilities at initial recognition: The Group has not applied the provision of Ind AS 109, Financial Instruments, upon the initial recognition of the financial instruments where there is no active market.

Summary of significant accounting policies and other explanatory information to the consolidated financial statements as at and for the year ended 31 December 2017
ITD Cementation India Limited
172 204
d Designation of previously recognised financial instruments: The Group does not have any financial assets or liabilities as of the transition dates which were required to be designated, and which met the required criteria given in Ind AS 101, as a financial asset or financial liability at FVPL.
ii exceptions The following mandatory exceptions have been applied in accordance with Ind AS 101 in preparing the
financial statements:
a estimates The estimates as at 1 January 2016 and 31 December 2016 are consistent with those made for the same dates
in accordance with previous GAAP (after adjustment to reflect and differences if any, in accounting policies) apart from the following items where the application of previous GAAP did not require estimation:
(i) Impairment of financial assets based on the expected credit loss model; and
(ii) Investments in equity instruments carried as FVPL or FVOCI.
The estimates used by the Group to present the amounts in accordance with the Ind AS reflect conditions that existed at the date on transition to Ind AS.
b Classification and movement of financial assets and liabilities The Group has classified the financial assets and liabilities in accordance with Ind AS 109 on the basis of facts
and circumstances that existed at the date on transition to Ind AS.
iii Reconciliation of equity as previously reported under previous gaap to Ind as:` lakhs
Refer note
balance sheet as at 31 December 2016
opening balance sheet as at 1 January 2016
previous gaap
effects of transition
to Ind as
Ind as previous gaap
effects of transition
to Ind as
Ind as
asseTs
non-current assets
Property, plant and equipment
2.3 (iii) 1, 9 38,184.36 349.89 38,534.25 34,898.52 (1,334.17) 33,564.35
Capital work-in-progress 560.20 - 560.20 267.22 (70.38) 196.84
Financial assets
Investments 2.3 (iii) 2 - 57.49 57.49 - 57.49 57.49
Trade receivables 2,863.37 - 2,863.37 2,863.37 - 2,863.37
Loans 2.3 (iii) 3 263.72 (15.16) 248.56 295.26 (40.43) 254.83
Other financial assets
8,677.57 - 8,677.57 8,699.51 (4.90) 8,694.61
Deferred tax assets (net) 2.3 (iii) 7, 9 2,756.42 (2,557.00) 199.42 4,423.39 (505.04) 3,918.35
Income tax assets (net) 2.3 (iii) 7, 9 7,619.23 (946.33) 6,672.90 4,836.14 (442.49) 4,393.65
Other non-current assets 2.3 (iii) 3, 9 19,635.78 (4,596.40) 15,039.38 17,016.84 (4,291.67) 12,725.17
Total non-current assets 80,560.65 (7,707.51) 72,853.14 73,300.25 (6,631.59) 66,668.66

Summary of significant accounting policies and other explanatory information to the consolidated financial statements as at and for the year ended 31 December 2017
Annual Report 2017
Con
solid
ated
Fina
ncia
l Sta
tem
ents
Sta
tuto
ry R
epor
tsC
orpo
rate
Ove
rvie
w
173 204
` lakhs
Refer note
balance sheet as at 31 December 2016
opening balance sheet as at 1 January 2016
previous gaap
effects of transition
to Ind as
Ind as previous gaap
effects of transition
to Ind as
Ind as
Current assets
Inventories 2.3 (iii) 1, 9 19,704.55 (8,646.77) 11,057.78 22,722.67 (8,142.56) 14,580.11
Financial assets
Investments 0.26 - 0.26 0.26 - 0.26
Trade receivables 2.3 (iii) 4, 9 26,482.29 (5,017.43) 21,464.86 30,917.17 (6,246.96) 24,670.21
Cash and cash equivalents
18,083.09 (1,827.63) 16,255.46 8,376.57 (459.79) 7,916.78
Other bank balances 426.73 (154.25) 272.48 6,383.69 (125.87) 6,257.82
Loans 2.3 (iii) 2, 9 9,143.47 7,068.46 16,211.93 3,592.19 8,392.43 11,984.62
Other financial assets 2.3 (iii) 4, 9 56,386.98 (11,068.77) 45,318.21 86,560.66 (11,239.50) 75,321.16
Other current assets 2.3 (iii) 3, 9 4,976.28 (333.57) 4,642.71 12,587.62 (133.12) 12,454.50
Total current assets 135,203.65 (19,979.96) 115,223.69 171,140.83 (17,955.37) 153,185.46
ToTaL asseTs 215,764.30 (27,687.47) 188,076.83 244,441.08 (24,586.96) 219,854.12
equITy anD LIabILITIes
equity
Equity share capital 1,551.58 - 1,551.58 1,551.58 - 1,551.58
Other equity 2.3 (iii) 8, 9 53,520.39 129.94 53,650.33 49,269.85 (560.61) 48,709.24
Non-controlling interests - 77.26 77.26 - 39.84 39.84
Total equity 55,071.97 207.20 55,279.17 50,821.43 (520.77) 50,300.66
Liabilities
non-current liabilities
Financial liabilities
Borrowings 2.3 (iii) 9 4,062.13 - 4,062.13 1,178.81 (196.00) 982.81
Provisions 2.3 (iii) 9 902.36 - 902.36 694.56 (2.40) 692.16
Total non-current liabilities 4,964.49 - 4,964.49 1,873.37 (198.40) 1,674.97
Current liabilities
Financial liabilities
Borrowings 2.3 (iii) 9 37,105.85 (7,757.42) 29,348.43 56,211.69 (11,042.79) 45,168.90
Current maturities of long-term-borrowings
2.3 (iii) 9 5,131.01 (2,920.40) 2,210.61 2,684.22 - 2,684.22
Trade payables 2.3 (iii) 9 63,966.93 (2,568.81) 61,398.12 75,429.28 (3,010.82) 72,418.46
Other financial liabilities 2.3 (iii) 2, 9 4,602.21 (397.17) 4,205.04 6,129.68 (2,471.59) 3,658.09
Other current liabilities 2.3 (iii) 9 42,377.80 (13,688.43) 28,689.37 49,690.95 (7,339.65) 42,351.30
Provisions 2.3 (iii) 5, 8 and 9
2,544.04 (562.44) 1,981.60 1,600.46 (2.94) 1,597.52
Total current liabilities 155,727.84 (27,894.67) 127,833.17 191,746.28 (23,867.79) 167,878.49
ToTaL equITy anD LIabILITIes
215,764.30 (27,687.47) 188,076.83 244,441.08 (24,586.96) 219,854.12
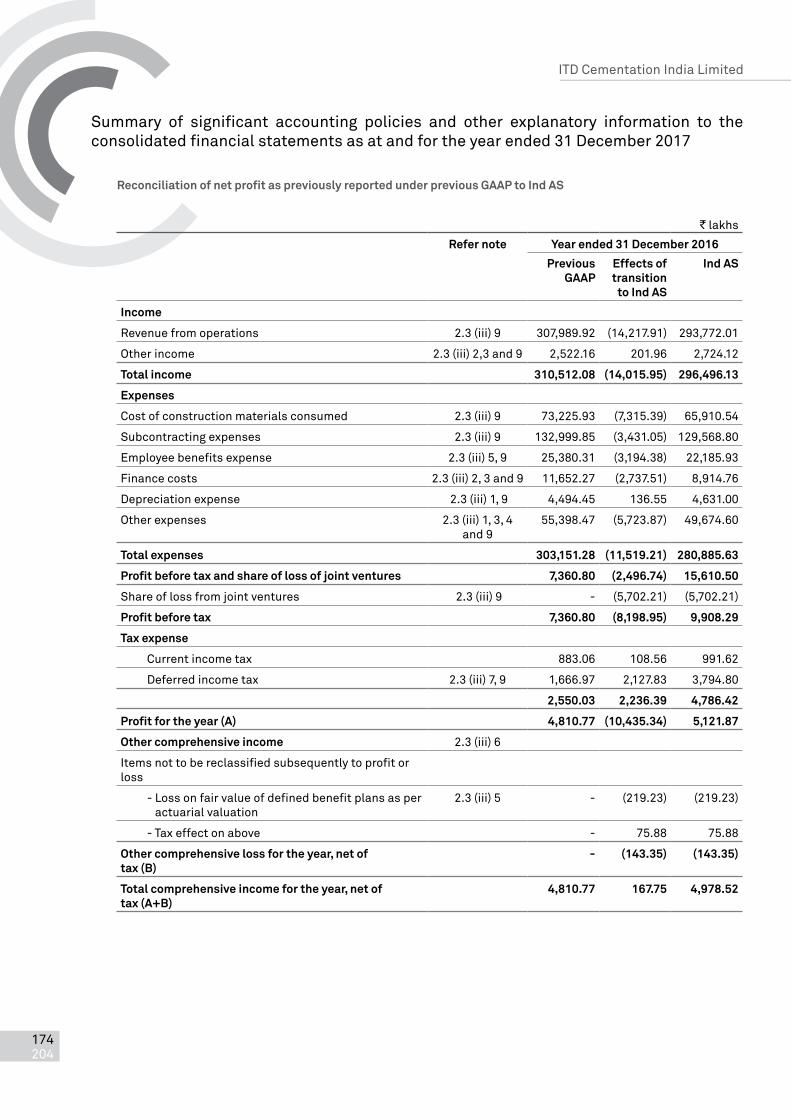
Summary of significant accounting policies and other explanatory information to the consolidated financial statements as at and for the year ended 31 December 2017
ITD Cementation India Limited
174 204
Reconciliation of net profit as previously reported under previous gaap to Ind as
` lakhs
Refer note year ended 31 December 2016
previous gaap
effects of transition
to Ind as
Ind as
Income
Revenue from operations 2.3 (iii) 9 307,989.92 (14,217.91) 293,772.01
Other income 2.3 (iii) 2,3 and 9 2,522.16 201.96 2,724.12
Total income 310,512.08 (14,015.95) 296,496.13
expenses
Cost of construction materials consumed 2.3 (iii) 9 73,225.93 (7,315.39) 65,910.54
Subcontracting expenses 2.3 (iii) 9 132,999.85 (3,431.05) 129,568.80
Employee benefits expense 2.3 (iii) 5, 9 25,380.31 (3,194.38) 22,185.93
Finance costs 2.3 (iii) 2, 3 and 9 11,652.27 (2,737.51) 8,914.76
Depreciation expense 2.3 (iii) 1, 9 4,494.45 136.55 4,631.00
Other expenses 2.3 (iii) 1, 3, 4 and 9
55,398.47 (5,723.87) 49,674.60
Total expenses 303,151.28 (11,519.21) 280,885.63
profit before tax and share of loss of joint ventures 7,360.80 (2,496.74) 15,610.50
Share of loss from joint ventures 2.3 (iii) 9 - (5,702.21) (5,702.21)
profit before tax 7,360.80 (8,198.95) 9,908.29
Tax expense
Current income tax 883.06 108.56 991.62
Deferred income tax 2.3 (iii) 7, 9 1,666.97 2,127.83 3,794.80
2,550.03 2,236.39 4,786.42
profit for the year (a) 4,810.77 (10,435.34) 5,121.87
other comprehensive income 2.3 (iii) 6
Items not to be reclassified subsequently to profit or loss
- Loss on fair value of defined benefit plans as per actuarial valuation
2.3 (iii) 5 - (219.23) (219.23)
- Tax effect on above - 75.88 75.88
other comprehensive loss for the year, net of tax (b)
- (143.35) (143.35)
Total comprehensive income for the year, net of tax (a+b)
4,810.77 167.75 4,978.52

Summary of significant accounting policies and other explanatory information to the consolidated financial statements as at and for the year ended 31 December 2017
Annual Report 2017
Con
solid
ated
Fina
ncia
l Sta
tem
ents
Sta
tuto
ry R
epor
tsC
orpo
rate
Ove
rvie
w
175 204
explanation for reconciliation 1. Property, Plant and Equipment The Group has elected to continue with the carrying value for all of its property, plant and equipment (PPE) as
recognised in its previous GAAP financial as deemed cost at the transition date.
Pursuant to transition to Indian Accounting Standard, on the date of transition i.e. 1 January 2016; the written down value of tools and equipment as at 31 December 2015 hitherto included under inventories have been reclassified to Property, plant and equipment.
2. Financial guarantees Under Ind AS, financial guarantees given by the Group for its unincorporated entities is initially recognised as
an investment and guarantee liability at fair value which is subsequently amortised as an interest income to the Statement of Profit and Loss. This transaction was not recorded under the previous GAAP.
3. Loans and other current assets Security deposits paid are recognised at fair value on initial recognition. Fair value of the deposits is arrived
at by discounting the future cash flows at incremental borrowing rate or market rate on the date of deposits. Subsequently these deposits are measured at amortised costs.
4. Trade receivables and other financial assets The Group recognizes loss allowances using the expected credit loss (ECL) model for trade receivables and
unbilled work-in-progress which are not fair valued through profit or loss. The amount of expected credit losses (or reversal) that is required to adjust the loss allowance at the reporting date to the amount that is required to be recognised is recognised as an impairment gain or loss in statement of profit or loss.
5. Employee benefits Under Ind AS, actuarial gains and losses are recognised in the other comprehensive income (“OCI”) as
compared to being recognised in the Statement of Profit and Loss under the previous GAAP.
6. Other comprehensive income Under the previous GAAP, the Group has not presented OCI separately. Hence, it has reconciled previous
GAAP profit or loss to profit or loss as per Ind AS. Further, previous GAAP profit or loss is reconciled to total comprehensive income as per Ind AS
7. Tax expenses Deferred income tax Deferred tax have been recognised on the adjustments made on transition to Ind AS.
8. Other equity Adjustments to retained earnings and OCI have been made in accordance with Ind AS, for the above mentioned
transition items.
In previous GAAP, dividend payable is recorded as a liability in the period to which it relates. Under Ind AS, dividend to holders of equity instruments is recognized as a liability in the period in which the obligation to pay is established. Accordingly, proposed dividends and the related tax have increased the retained earnings by ` 560.23 lakhs, as on 31 December 2016.
9. Classification of jointly controlled entities into subsidiaries and joint ventures based on evaluation of control The Group has assessed its power and exposure to variable returns in respect of its unincorporated entities
as per Ind AS 110. Based on the assessment, the Group concluded that it has joint control in respect of 3 unincorporated entities and hence equity method of accounting has been followed under Ind AS.
Further in respect of 2 unincorporated entities where the Group exercises control, the financials of these entities have been consolidated line by line.
iv statement of cash flows There were no significant reconciliation items between cash flows prepared under previous GAAP and those
prepared under Ind AS.
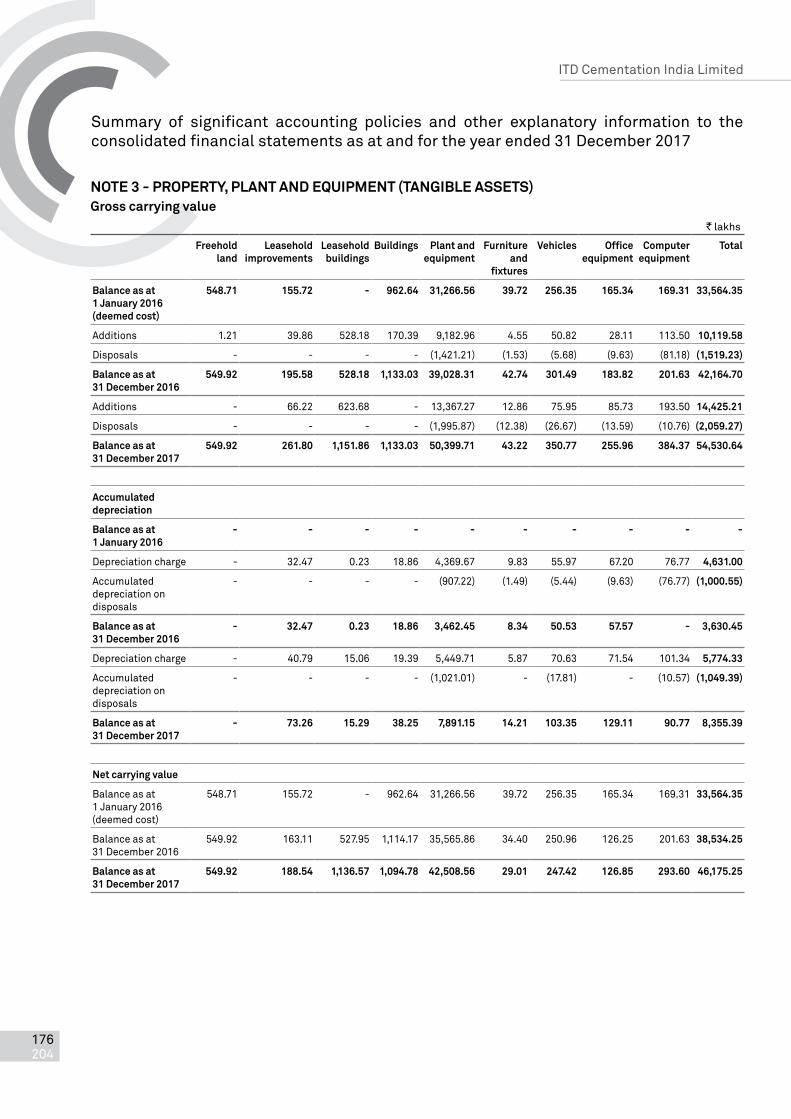
Summary of significant accounting policies and other explanatory information to the consolidated financial statements as at and for the year ended 31 December 2017
ITD Cementation India Limited
176 204
noTe 3 - pRopeRTy, pLanT anD equIpmenT (TangIbLe asseTs)gross carrying value
` lakhs
Freehold land
Leasehold improvements
Leasehold buildings
buildings plant and equipment
Furniture and
fixtures
vehicles office equipment
Computer equipment
Total
balance as at 1 January 2016 (deemed cost)
548.71 155.72 - 962.64 31,266.56 39.72 256.35 165.34 169.31 33,564.35
Additions 1.21 39.86 528.18 170.39 9,182.96 4.55 50.82 28.11 113.50 10,119.58
Disposals - - - - (1,421.21) (1.53) (5.68) (9.63) (81.18) (1,519.23)
balance as at 31 December 2016
549.92 195.58 528.18 1,133.03 39,028.31 42.74 301.49 183.82 201.63 42,164.70
Additions - 66.22 623.68 - 13,367.27 12.86 75.95 85.73 193.50 14,425.21
Disposals - - - - (1,995.87) (12.38) (26.67) (13.59) (10.76) (2,059.27)
balance as at 31 December 2017
549.92 261.80 1,151.86 1,133.03 50,399.71 43.22 350.77 255.96 384.37 54,530.64
accumulated depreciation
balance as at 1 January 2016
- - - - - - - - - -
Depreciation charge - 32.47 0.23 18.86 4,369.67 9.83 55.97 67.20 76.77 4,631.00
Accumulated depreciation on disposals
- - - - (907.22) (1.49) (5.44) (9.63) (76.77) (1,000.55)
balance as at 31 December 2016
- 32.47 0.23 18.86 3,462.45 8.34 50.53 57.57 - 3,630.45
Depreciation charge - 40.79 15.06 19.39 5,449.71 5.87 70.63 71.54 101.34 5,774.33
Accumulated depreciation on disposals
- - - - (1,021.01) - (17.81) - (10.57) (1,049.39)
balance as at 31 December 2017
- 73.26 15.29 38.25 7,891.15 14.21 103.35 129.11 90.77 8,355.39
net carrying value
Balance as at 1 January 2016 (deemed cost)
548.71 155.72 - 962.64 31,266.56 39.72 256.35 165.34 169.31 33,564.35
Balance as at 31 December 2016
549.92 163.11 527.95 1,114.17 35,565.86 34.40 250.96 126.25 201.63 38,534.25
balance as at 31 December 2017
549.92 188.54 1,136.57 1,094.78 42,508.56 29.01 247.42 126.85 293.60 46,175.25

Summary of significant accounting policies and other explanatory information to the consolidated financial statements as at and for the year ended 31 December 2017
Annual Report 2017
Con
solid
ated
Fina
ncia
l Sta
tem
ents
Sta
tuto
ry R
epor
tsC
orpo
rate
Ove
rvie
w
177 204
noTe 4 - non-CuRRenT InvesTmenTs` lakhs
as at 31 December 2017
as at 31 December 2016
as at 1 January 2016
Investments valued at deemed cost (Trade)
Investment in unincorporated entity 57.49 57.49 57.49
Total non-current investments 57.49 57.49 57.49
note 4.1 Detailed list of non-current investments
Investments valued at deemed cost, unquoted
Investments in unincorporated entities
In Joint ventures *
ITD - ITDCem JV ^ 57.49 57.49 57.49
ITD - ITDCem JV (Consortium of ITD - ITD Cementation)
- - -
CEC-ITD Cem-TPL JV - - -
57.49 57.49 57.49
* Being unincorporated entities, the Group does not require to have any investment in these entities as per the JV agreement.
^ Represents fair value of financial guarantee
Details:
aggregate of non-current investments:
(i) Carrying value of investments 57.49 57.49 57.49
(ii) Market value of investments - - -
(iii) Impairment allowances - - -
(i) Investments carried at deemed cost 57.49 57.49 57.49
(ii) Investments carried at amortised cost - - -
(iii) Investments carried at fair value through profit and loss
- - -
57.49 57.49 57.49

Summary of significant accounting policies and other explanatory information to the consolidated financial statements as at and for the year ended 31 December 2017
ITD Cementation India Limited
178 204
noTe 5 - TRaDe ReCeIvabLes(unsecured, considered good unless stated otherwise)
` lakhs
as at 31 December 2017
as at 31 December 2016
as at 1 January 2016
non-current
Trade receivables 309.00 2,863.37 2,863.37
[Including retention Nil (31 December 2016 : ` 571.41 lakhs, 1 January 2016 : ` 571.41 lakhs)]
Total non-current trade receivables 309.00 2,863.37 2,863.37
Current
Trade receivables
- considered good [Refer note 33(c)] 23,985.01 21,464.86 24,670.21
- considered doubtful 4,816.95 6,149.78 4,469.56
[Including retention ` 14,343.71 lakhs (31 December 2016 : ` 12,484.95 lakhs, 1 January 2016 : ` 13,168.41 lakhs)]
28,801.96 27,614.64 29,139.77
Impairment allowance for doubtful debts (4,816.95) (6,149.78) (4,469.56)
Total current trade receivables 23,985.01 21,464.86 24,670.21
Total trade receivables 24,294.01 24,328.23 27,533.58
Note: Trade Receivables are non-interest bearing and are generally on credit terms of 30-90 days.
noTe 6 - Loans(unsecured, considered good unless stated otherwise)
` lakhs
as at 31 December 2017
as at 31 December 2016
as at 1 January 2016
non-current
Security deposits 225.29 248.56 254.83
Total non-current loans 225.29 248.56 254.83
Current
Security deposits
- considered good 2,984.20 2,316.20 1,454.26
- considered doubtful 63.36 55.83 97.55
Receivable from unincorporated entities [Refer note 33(c)] 37,041.09 13,895.73 10,530.36
Total 40,088.65 16,267.76 12,082.17
Less : Impairment allowance (63.36) (55.83) (97.55)
Total current loans 40,025.29 16,211.93 11,984.62
Total loans 40,250.58 16,460.49 12,239.45

Summary of significant accounting policies and other explanatory information to the consolidated financial statements as at and for the year ended 31 December 2017
Annual Report 2017
Con
solid
ated
Fina
ncia
l Sta
tem
ents
Sta
tuto
ry R
epor
tsC
orpo
rate
Ove
rvie
w
179 204
noTe 7 - oTheR FInanCIaL asseTs(unsecured, considered good unless stated otherwise)
` lakhs
as at 31 December 2017
as at 31 December 2016
as at 1 January 2016
non-currentUnbilled revenue - 8,677.57 8,677.57Bank deposits with original maturity of more than 12 months
39.00 - 12.00
Interest accrued on bank deposits - - 5.04Total non-current financial assets 39.00 8,677.57 8,694.61CurrentUnbilled revenue
- considered good 65,260.72 45,157.23 75,084.83 - considered doubtful 119.21 408.71 649.67
Interest accrued on deposits 27.42 29.22 115.21Employee advances 12.96 11.47 18.29Foreign currency forward contract ^ 1,478.73 - -Others 24.70 120.29 102.83
66,923.74 45,726.92 75,970.83Less: impairment allowance (119.21) (408.71) (649.67)Total current financial assets 66,804.53 45,318.21 75,321.16Total other financial assets 66,843.53 53,995.78 84,015.77
^ Financial assets carried at fair value through other comprehensive income
noTe 8 - InCome Tax asseTs (neT)i. The following table provides the details of income tax assets and liabilities:
` lakhs
as at 31 December 2017
as at 31 December 2016
as at 1 January 2016
a) Income tax assets 8,148.52 8,766.02 5,477.76
b) Current income tax liabilities (7,040.26) (2,093.12) (1,084.11)
net income tax assets 1,108.26 6,672.90 4,393.65
ii. The gross movement in the current tax asset:` lakhs
as at 31 December 2017
as at 31 December 2016
Net current income tax assets at the beginning 6,672.90 4,393.65
Income tax (refund)/paid, [net] (415.30) 3,270.87
Current income tax expense (5,149.34) (991.62)
net current income tax assets at the end 1,108.26 6,672.90
iii. Income tax expense in the statement of profit and Loss comprises:
Current income taxes 5,149.34 991.62
Tax adjustment for earlier years - -
Deferred income taxes 132.21 3,794.80
Income tax expenses (net) 5,281.55 4,786.42
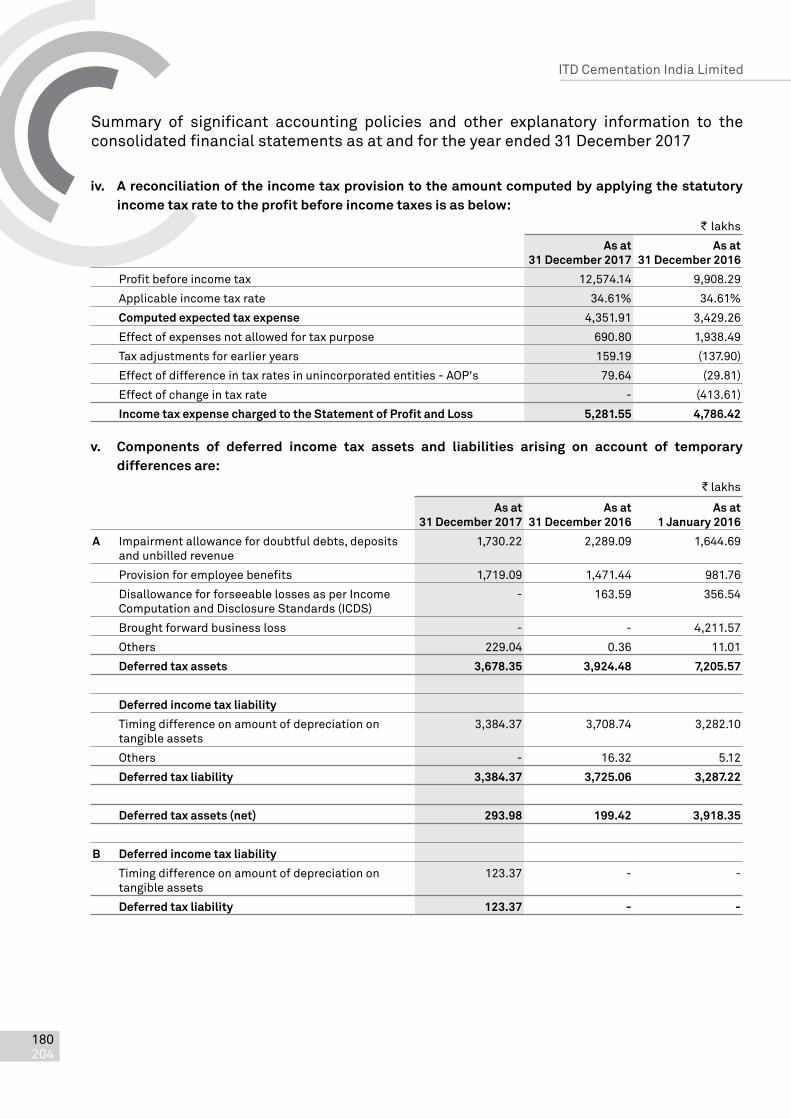
Summary of significant accounting policies and other explanatory information to the consolidated financial statements as at and for the year ended 31 December 2017
ITD Cementation India Limited
180 204
iv. a reconciliation of the income tax provision to the amount computed by applying the statutory income tax rate to the profit before income taxes is as below:
` lakhs
as at 31 December 2017
as at 31 December 2016
Profit before income tax 12,574.14 9,908.29
Applicable income tax rate 34.61% 34.61%
Computed expected tax expense 4,351.91 3,429.26
Effect of expenses not allowed for tax purpose 690.80 1,938.49
Tax adjustments for earlier years 159.19 (137.90)
Effect of difference in tax rates in unincorporated entities - AOP's 79.64 (29.81)
Effect of change in tax rate - (413.61)
Income tax expense charged to the statement of profit and Loss 5,281.55 4,786.42
v. Components of deferred income tax assets and liabilities arising on account of temporary differences are:
` lakhs
as at 31 December 2017
as at 31 December 2016
as at 1 January 2016
a Impairment allowance for doubtful debts, deposits and unbilled revenue
1,730.22 2,289.09 1,644.69
Provision for employee benefits 1,719.09 1,471.44 981.76
Disallowance for forseeable losses as per Income Computation and Disclosure Standards (ICDS)
- 163.59 356.54
Brought forward business loss - - 4,211.57
Others 229.04 0.36 11.01
Deferred tax assets 3,678.35 3,924.48 7,205.57
Deferred income tax liability
Timing difference on amount of depreciation on tangible assets
3,384.37 3,708.74 3,282.10
Others - 16.32 5.12
Deferred tax liability 3,384.37 3,725.06 3,287.22
Deferred tax assets (net) 293.98 199.42 3,918.35
b Deferred income tax liability
Timing difference on amount of depreciation on tangible assets
123.37 - -
Deferred tax liability 123.37 - -

Summary of significant accounting policies and other explanatory information to the consolidated financial statements as at and for the year ended 31 December 2017
Annual Report 2017
Con
solid
ated
Fina
ncia
l Sta
tem
ents
Sta
tuto
ry R
epor
tsC
orpo
rate
Ove
rvie
w
181 204
noTe 9 - oTheR asseTs
` lakhs
as at 31 December 2017
as at 31 December 2016
as at 1 January 2016
non-current
Capital advances 855.89 499.90 1,212.05
Balances with government authorities 21,506.09 14,536.79 11,500.72
Prepaid expenses 78.69 2.69 12.40
Total other non-current assets 22,440.67 15,039.38 12,725.17
Current
Advance to suppliers and subcontractors 1,996.24 2,467.47 10,304.62
Balances with government authorities 2,674.95 - -
Prepaid expenses 1,577.11 2,175.24 2,149.88
Total other current assets 6,248.30 4,642.71 12,454.50
Total other assets 28,688.97 19,682.09 25,179.67
noTe 10 - InvenToRIes` lakhs
as at 31 December 2017
as at 31 December 2016
as at 1 January 2016
Construction materials 14,105.64 9,763.57 13,213.38
Spares 1,636.06 1,294.21 1,366.73
Total inventories 15,741.70 11,057.78 14,580.11
noTe 11 - CuRRenT InvesTmenTsInvestments in unquoted equity shares
as at 31 December 2017
as at 31 December 2016
as at 1 January 2016
no. of shares
` lakhs no. of shares
` lakhs no. of shares
` lakhs
AVR Infra Private Limited ^ 2,600 0.26 2,600 0.26 2,600 0.26
Less: impairment allowance (0.26) - -
Total current investments - 0.26 0.26
^ Face value of ` 10 each

Summary of significant accounting policies and other explanatory information to the consolidated financial statements as at and for the year ended 31 December 2017
ITD Cementation India Limited
182 204
noTe 12 - Cash anD Cash equIvaLenTs` lakhs
as at 31 December 2017
as at 31 December 2016
as at 1 January 2016
Balances with banks
- in current accounts 3,096.64 2,997.65 3,473.28
- in deposit account (with original maturity upto 3 months)
8,100.00 13,200.00 4,303.37
Cash on hand 128.25 57.81 140.13
Total cash and cash equivalents 11,324.89 16,255.46 7,916.78
noTe 13 - oTheR bank baLanCes` lakhs
as at 31 December 2017
as at 31 December 2016
as at 1 January 2016
earmarked balances with banks for:
Bank deposits with maturity of more than 3 months but less than 12 months (Refer note 13.1 below)
245.95 267.02 6,251.65
Balances with bank for unclaimed dividend (Refer note 13.2 below)
7.46 5.46 6.17
Total other bank balances 253.41 272.48 6,257.82
note 13.1 Includes ` 242.45 lakhs (31 December 2016 ` 241.65 lakhs, 1 January 2016 ` 241.65 lakhs) earmarked against bank guarantees taken by the Group and Nil (31 December 2016 ` 22 lakhs, 1 January 2016 ` 10 lakhs) placed as earnest money deposit.
note 13.2 There are no amounts due and outstanding to be credited to the Investor Education and Protection Fund as at each reporting period.

Summary of significant accounting policies and other explanatory information to the consolidated financial statements as at and for the year ended 31 December 2017
Annual Report 2017
Con
solid
ated
Fina
ncia
l Sta
tem
ents
Sta
tuto
ry R
epor
tsC
orpo
rate
Ove
rvie
w
183 204
noTe 14 - shaRe CapITaL` lakhs
as at 31 December 2017
as at 31 December 2016
as at 1 January 2016
authorised share capital
300,000,000 Equity shares of ` 1 each 3,000.00 3,000.00 3,000.00
(31 December 2016: 300,000,000; 1 January 2016: 300,000,000)
45,000,000 Redeemable preference shares of ` 10 each
4,500.00 4,500.00 4,500.00
(31 December 2016: 45,000,000; 1 January 2016: 45,000,000)
Total authorised share capital 7,500.00 7,500.00 7,500.00
Issued equity share capital:
155,183,160 Equity shares of ` 1 each 1,551.83 1,551.83 1,551.83
(31 December 2016:155,183,160; 1 January 2016:155,183,160)
Total issued equity share capital 1,551.83 1,551.83 1,551.83
subscribed and fully paid-up equity share capital:
155,157,900 Equity shares of ` 1 each fully paid up 1,551.58 1,551.58 1,551.58
(31 December 2016:155,157,900; 1 January 2016: 155,157,900)
Total subscribed and fully paid-up equity share capital 1,551.58 1,551.58 1,551.58
a. Reconciliation of the equity shares outstanding at the beginning and at the end of the reporting year
number ` lakhs
as at 1 January 2016 155,157,900 1,551.58
Changes in equity share capital - -
as at 31 December 2016 155,157,900 1,551.58
Changes in equity share capital - -
as at 31 December 2017 155,157,900 1,551.58
b. Terms/rights attached to equity shares: The Company has only one class of equity shares having a par value of ` 1 per share. Each holder of equity share is
entitled to one vote per share. The Company declares and pays dividends in Indian Rupees. The dividend proposed if any by the Board of Directors is subject to the approval of the shareholders in the ensuing Annual General Meeting, except interim dividend.
In the event of liquidation of the Company, the holders of equity shares will be entitled to receive remaining assets of the Company, after distribution of all preferential amounts,if any. The distribution will be in proportion to the number of equity shares held by the shareholders.

Summary of significant accounting policies and other explanatory information to the consolidated financial statements as at and for the year ended 31 December 2017
ITD Cementation India Limited
184 204
c. shares held by holding Company
31 December 2017 31 December 2016 1 January 2016
% held no. of shares
% held no. of shares
% held no. of shares
equity shares of ` 1 each
Italian-Thai Development Public Company Limited, Thailand
51.63% 80,113,180 51.63% 80,113,180 51.63% 80,113,180
d. shareholding of more than 5%:
name of the shareholder % held no. of shares
% held no. of shares
% held no. of shares
promoter
Italian-Thai Development Public Company Limited, Thailand
51.63% 80,113,180 51.63% 80,113,180 51.63% 80,113,180
non-promoter
HDFC Trustee Company Limited - - 6.82% 10,576,780 7.11% 11,033,180
Reliance Capital Trustee Co. Limited 6.04% 9,376,105 - - - -
As per records of the Company, including its register of shareholders/members and other declarations received from shareholders regarding beneficial interest, the above shareholding represents both legal and beneficial ownership of shares.
e. bonus shares/ buy back/shares for consideration other than cash issued during past five years: (i) Aggregate number and class of shares allotted as fully paid up pursuant to contracts without payment being
received in cash - nil
(ii) Aggregate number and class of shares allotted as fully paid up by way of bonus shares - nil
(iii) Aggregate number and class of shares bought back - nil
f. Out of the total issued capital, 25,260 (31 December 2016: 25,260, 1 January 2016 25,260 equity shares of `1 each have been kept in abeyance pending final settlement of rights issues.
g. Subsequent to 31 December 2017, pursuant to the approval of the QIP Committee of Directors of the Board of the Company at its meeting held on 30 January 2018, the Company issued 16,629,684 equity shares of ` 1 each, at an issue price of ` 202.55 per equity share (of which ` 201.55 per share is towards securities premium) aggregating ` 33,683.42 lakhs to Qualified Institutionals Buyers in accordance with Chapter VIII of Securities and Exchange Board of India (Issue of Capital and Disclosure Requirements) Regulations, 2009 as amended and Section 42 of the Companies Act, 2013, as amended, and the rules made thereunder.
h. The Board of Directors of the Company has recommended Equity dividend of ` 0.40 per share (Previous Year: ` 0.30) for the year ended 31 December 2017.

Summary of significant accounting policies and other explanatory information to the consolidated financial statements as at and for the year ended 31 December 2017
Annual Report 2017
Con
solid
ated
Fina
ncia
l Sta
tem
ents
Sta
tuto
ry R
epor
tsC
orpo
rate
Ove
rvie
w
185 204
noTe 15 - boRRoWIngsnon-current portion:
effective interest rate as at31 December
2017
as at31 December
2016
as at 1 January
2016
31 December 2017
31 December 2016
` lakhs ` lakhs ` lakhs
secured
(a) Rupee term loans
(i) From Banks 10.15% 10.15% - 2,650.00 -
(ii) From Others 13.50% 13.50% - - 315.04
(b) plant loans
(i) From Banks 9.65%-11.03% 9.65%-11.03% 1,205.30 484.56 212.91
(ii) From Others 11.00%-12.50%
11.00%-12.50%
1,144.74 843.61 364.77
(C) vehicle loans from banks 9.50%-10.50%
9.50%-10.50%
111.72 83.96 90.09
Total non-current borrowings 2,461.76 4,062.13 982.81
Current maturities of long-term borrowings
effective interest rate as at31 December
2017
as at31 December
2016
as at 1 January
2016
31 December 2017
31 December 2016
` lakhs ` lakhs ` lakhs
secured
(a) Rupee term loans
(i) From Banks 10.15% 10.15% 2,650.00 1350.00 1,989.04
(ii) From Others 13.50% 13.50% - - 273.94
(b) plant loans
(i) From Banks 9.65%-11.03% 9.65%-11.03% 752.10 361.94 100.76
(ii) From Others 11.00%-12.50%
11.00%-12.50%
699.42 435.32 281.04
(C) vehicle loans from bank 9.50%-10.50%
9.50%-10.50%
58.05 63.35 39.44
Total current maturities of long-term borrowings
4,159.57 2,210.61 2,684.22
Total borrowings 6,621.33 6,272.74 3,667.03

Summary of significant accounting policies and other explanatory information to the consolidated financial statements as at and for the year ended 31 December 2017
ITD Cementation India Limited
186 204
Terms of repayment and details of securitynote 15.1 - Rupee term loan - from banksTerm loans are repayable in 3 equal quaterly installments starting from November 2017. These loans are secured by hypothecation of Kolkata area depot land.
note 15.2 - Rupee term loans from othersTerm Loan from others has been fully repaid during the year. This loan was secured by hypothecation of Kolkata office premises.
note 15.3 - plant loans from banksLoans obtained for purchase of construction equipments are repayble in 36 to 58 monthly structured installments. These loans are secured by first and exclusive charge on specific equipments financed by the bank.
note 15.4 - plant loans from othersLoans obtained for purchase of construction equipment are repayable in 29 to 60 monthly structured installments. These loans are secured by first and exclusive charge on specific equipments financed by the financial institution.
note 15.5 - vehicle loans from banksLoans obtained for purchase of vehicles are repayble in 60 monthly structured installments. These loans are secured by hypothecation of the vehicles purchased out of these loans.
noTe 16 - pRovIsIons` lakhs
as at 31 December 2017
as at 31 December 2016
as at 1 January 2016
non-current
Provision for employee benefits
- Leave entitlement and compensated absences 1,110.31 902.36 692.16
Total non-current provisions 1,110.31 902.36 692.16
Current
Provision for employee benefits
- Gratuity 2,051.00 1,653.81 1,315.03
- Leave entitlement and compensated absences 144.44 131.13 100.38
- Provident fund 206.71 196.66 182.11
Total current provisions 2,402.15 1,981.60 1,597.52
Total provisions 3,512.46 2,883.96 2,289.68

Summary of significant accounting policies and other explanatory information to the consolidated financial statements as at and for the year ended 31 December 2017
Annual Report 2017
Con
solid
ated
Fina
ncia
l Sta
tem
ents
Sta
tuto
ry R
epor
tsC
orpo
rate
Ove
rvie
w
187 204
noTe 17 - CuRRenT boRRoWIngs ` lakhs
as at 31 December 2017
as at 31 December 2016
as at 1 January 2016
I. secured
Rupee loan from banks (Repayable on demand)
Cash credit facilities 12,977.26 3,361.23 19,181.70
Working capital demand loan 11,761.26 8,487.20 8,487.20
24,738.52 11,848.43 27,668.90
II. unsecured
Commercial paper from others 17,500.00 17,500.00 17,500.00
Total current borrowings (I+II) 42,238.52 29,348.43 45,168.90
note 17.1 - Cash credit facilities (secured) : Cash credit facilities are availed from consortium bankers carries various effective interest rates ranging from 11.02 to 14.50 percent per annum and are secured by first pari passu charge on the current assets and movable plant and machinery other than those charged in favour of Plant loans. These facilities are payable on demand.
note 17.2 - Working capital demand loan :Working capital demand loans carry an effective interest rate ranging from 9.70 to 12.00 percent per annum and are secured by first pari passu charge on the current assets and movable plant and machinery other than those charged in favour of Plant loans. This facility is payable on demand.
note 17.3 - Commercial paper (unsecured) :Commercial Paper carry effective interest rate ranging between 10.00 to 10.50 percent per annum.
noTe 18 - TRaDe payabLes ` lakhs
as at 31 December 2017
as at 31 December 2016
as at 1 January 2016
- T otal outstanding dues of Micro Enterprises and Small Enterprises (Refer note 18.1)
77.80 709.27 -
- Total outstanding dues of creditors other than Micro Enterprises and Small Enterprises
61,889.16 60,688.85 72,418.46
Total trade payables 61,966.96 61,398.12 72,418.46
note 18.1 - The Group has amounts due to micro and small suppliers registered under the Micro, Small and Medium Enterprises Development Act 2006 (MSMED Act), as at 31 December 2017.
` lakhs
as at 31 December 2017
as at 31 December 2016
as at 1 January 2016
The disclosure pursuant to the said Act is as under:
Principal amount due to suppliers under MSMED Act 77.80 709.27 -
Interest accrued and due to suppliers under MSMED Act on the above amount
2.47 6.78 -
Payment made to suppliers (other than interest) beyond appointed day during the year
916.04 632.89 -

Summary of significant accounting policies and other explanatory information to the consolidated financial statements as at and for the year ended 31 December 2017
ITD Cementation India Limited
188 204
` lakhs
as at 31 December 2017
as at 31 December 2016
as at 1 January 2016
Interest paid to suppliers under MSMED Act - - -
Interest due and payable to suppliers under MSMED Act towards payments already made
18.57 5.10 -
Interest accrued and remaining unpaid at the end of the accounting year
21.04 6.78 -
The amount of further interest remaining due and payable even in the succeeding years, until such date when the interest dues as above are actually paid to the small enterprise for the purpose of disallowance as a deductible expenditure under section 23 of the MSMED Act.
21.04 6.78 -
Note: This information, as required to be disclosed under the MSMED Act, has been determined to the extent such parties have
been identified on the basis of information available with the Group.
note 18.2 - Trade payables are normally non-interest bearing and settled as per the payment terms stated in the contract.
noTe 19 - oTheR FInanCIaL LIabILITIes` lakhs
as at 31 December 2017
as at 31 December 2016
as at 1 January 2016
Current
Interest accrued but not due 73.93 37.20 137.77
Unpaid dividends ^ 7.46 5.46 6.17
Amount due to parent company (Refer note 33(c)) 246.66 - -
Creditors for capital expenses 1,006.26 358.99 179.39
Employee related dues 3,652.77 3,172.13 2,552.90
Financial guarantees - 12.18 42.69
Foreign currency forward contract ^^ 1,497.60 - -
Others 601.29 619.08 739.17
Total other financial liabilities 7,085.97 4,205.04 3,658.09
^ Not due for credit to Investor Education and Protection Fund
^^ Financial liability carried at fair value through profit and loss
noTe 20 - oTheR CuRRenT LIabILITIes` lakhs
as at 31 December 2017
as at 31 December 2016
as at 1 January 2016
Advances from contractee 34,443.12 14,864.76 39,594.91
Amount due to customers 19,838.60 13,169.84 1,892.66
Statutory dues payable 630.84 333.08 589.62
Others 604.02 321.69 274.11
Total other current liabilities 55,516.58 28,689.37 42,351.30

Summary of significant accounting policies and other explanatory information to the consolidated financial statements as at and for the year ended 31 December 2017
Annual Report 2017
Con
solid
ated
Fina
ncia
l Sta
tem
ents
Sta
tuto
ry R
epor
tsC
orpo
rate
Ove
rvie
w
189 204
noTe 21 - Revenue FRom opeRaTIons` lakhs
year ended 31 December 2017
year ended 31 December 2016
Contract revenue 205,923.42 293,566.33
Other operating revenues - Service income from unincorporated entities 127.47 205.68
Total revenue from operations 206,050.89 293,772.01
noTe 22 - oTheR InCome` lakhs
year ended 31 December 2017
year ended 31 December 2016
Interest income
- on bank deposits 1,023.07 1,158.23
- on financial assets carried at amortised cost 890.38 651.67
- on income tax refund 293.40 184.67
- on sales tax refund 103.56 21.82
- others 23.04 44.42
Other non-operating income
- Excess provision no longer required written back 345.20 253.73
- Insurance claim 387.86 34.87
- Exchange gain (net) 15.95 25.64
- Miscellaneous income 443.60 349.07
Total other income 3,526.06 2,724.12
noTe 23 - CosT oF ConsTRuCTIon maTeRIaLs ConsumeD` lakhs
year ended 31 December 2017
year ended 31 December 2016
Stock at beginning of the year 9,763.57 13,213.38
Add: Purchases 66,583.61 62,460.73
76,347.18 75,674.11
Less: Stock at the end of the year 14,105.64 9,763.57
Total cost of construction materials consumed 62,241.54 65,910.54
noTe 24 - empLoyee beneFITs expense` lakhs
year ended 31 December 2017
year ended 31 December 2016
Salaries and wages 22,977.56 19,995.03
Contribution to provident and other funds 1,952.67 598.82
Gratuity 722.17 1,533.62
Staff welfare 84.61 58.46
Total employee benefits expense 25,737.01 22,185.93

Summary of significant accounting policies and other explanatory information to the consolidated financial statements as at and for the year ended 31 December 2017
ITD Cementation India Limited
190 204
noTe 25 - FInanCe CosTs` lakhs
year ended 31 December 2017
year ended 31 December 2016
Interest on:
- Cash credit facilities 3,318.56 3,233.13
- Term loans 665.67 333.68
- Commercial papers 1,313.04 1,668.62
- Advances from customers 414.88 772.93
- Letter of credit 255.87 367.25
- Others 27.70 37.95
Other borrowing costs
- Bank charges and guarantee commission 2,761.95 2,501.20
Total finance costs 8,757.67 8,914.76
noTe 26 - oTheR expenses` lakhs
year ended 31 December 2017
year ended 31 December 2016
Plant hire expenses 6,543.07 5,529.73Power and fuel 8,250.16 7,669.22Rates and taxes 8,753.19 17,855.19Travelling expenses 1,169.81 941.73Site transport and conveyance 2,352.58 2,523.35Repairs and maintenance:
- Plant and machinery 1,028.94 1,218.35- Others 193.92 177.98
Insurance 1,099.67 1,087.90Professional fees 2,425.92 1,125.81Rent 2,917.20 2,600.97Consumption of spares 1,914.13 2,104.66Security charges 918.81 838.80Temporary site installations 1,560.97 402.17Postage, telephone and telegram 195.19 212.12Auditor remuneration (Refer note 26.1) 98.78 94.95Impairment allowance on financial assets (net) 477.06 1,784.87Water charges 630.85 791.74Printing and stationery 185.12 161.46Infotech expenses 267.11 259.90Royalty expense 933.15 -Directors’ sitting fees [Refer note 33(b)] 11.00 8.90CSR expenses ^ - 2.25Loss on disposal of property, plant and equipment (net) 657.57 432.08Miscellaneous expenses 2,005.43 1,850.47Total other expenses 44,589.63 49,674.60
^ The Company is not liable to incur any expenses on CSR as per section 135 of the Companies Act, 2013

Summary of significant accounting policies and other explanatory information to the consolidated financial statements as at and for the year ended 31 December 2017
Annual Report 2017
Con
solid
ated
Fina
ncia
l Sta
tem
ents
Sta
tuto
ry R
epor
tsC
orpo
rate
Ove
rvie
w
191 204
note 26.1 - auditor Remuneration` lakhs
year ended 31 December 2017
year ended 31 December 2016
- Audit fees 44.95 45.80
- Tax audit fee (including tax accounts) 14.62 19.36
- Limited review 22.57 24.98
- Certification fees 14.39 3.10
- Reimbursement of out of pocket expenses 2.25 1.71
98.78 94.95
noTe 27 - exCepTIonaL ITem` lakhs
year ended 31 December 2017
year ended 31 December 2016
Non-current trade receivables and non-current other financial assets written off
11,232.17 -
Provisions no longer required written back (9,048.23) -
2,183.94 -
noTe 28 - eaRnIngs peR shaRe (eps)basic and diluted eps
year ended 31 December 2017
year ended 31 December 2016
Profit computation for basic earnings per share of ` 1 each
Net profit as per the Statement of Profit and Loss available for equity shareholders (` lakhs)
7,281.55 5,084.44
Weighted average number of equity shares for EPS computation (Nos.) 155,157,900 155,157,900
EPS - Basic and Diluted EPS (`) 4.69 3.28

Summary of significant accounting policies and other explanatory information to the consolidated financial statements as at and for the year ended 31 December 2017
ITD Cementation India Limited
192 204
noTe 29 - ConTIngenT LIabILITIes anD CommITmenTs a. Contingent liabilities
` lakhs
as at 31 December 2017
as at 31 December 2016
as at 1 January 2016
(i) Guarantees given by banks in respect of contracting commitments in the normal course of business
- for the Group 42,255.87 39,755.10 29,548.65
- for Joint Venture 1,128.79 2,728.16 5,527.79
(ii) Corporate Guarantee given to bank on behalf of unincorporated entities
128,500.00 48,651.00 48,651.00
(iii) Letter of credit limit utilized by unincorporated entities 760.53 610.77 63.81
(iv) Claims against the Group not acknowledged as debts (Refer notes below)
11,945.77 13,116.77 12,016.77
(v) Sales Tax matters pending in appeals 5,809.55 5,277.39 3,278.00
(vi) Income Tax matters pending in appeal 1,473.72 1,938.59 1,680.12
(vii) Excise matter pending in appeal 51.70 51.70 51.70
Notes-
1. The Group has a number of claims on customers for price escalation and / or variation in contract work. In certain cases which are currently under arbitration, the customers have raised counter-claims. The Group has received legal advice that none of the counter-claims are legally tenable. Accordingly no provision is considered necessary in respect of these counter claims.
2. It is not practicable for the Group to estimate the timings of cash outflows, if any, in respect of the above pending resolution of the respective proceedings. The Group does not expect any reimbursements in respect of the above contingent liabilities other than stated therein above. Future cash outflows in respect of the above are determinable only on receipt of judgments/ decisions pending with various forums/ authorities. The Group does not expect any outflow of economic resources in respect of the above and therefore no provision is made in respect thereof.
b. Commitments` lakhs
as at 31 December 2017
as at 31 December 2016
as at 1 January 2016
Estimated amount of contracts remaining to be executed and not provided for (net of advances)
639.92 1,362.36 310.28
noTe 30 - DIsCLosuRe In aCCoRDanCe WITh InD as 11 - ConsTRuCTIon ConTRaCTs` lakhs
as at31 December 2017
as at31 December 2016
Contract revenue for the year 205,923.42 293,566.33
Aggregate amount of cost incurred and recognized profits less recognized losses up to the reporting date on contract under progress
696,186.32 610,555.15
Advances received from customers 34,443.12 14,864.76
Retention money 14,343.71 13,056.36
Gross amount due from customers for contract work (net of retention) 75,211.02 65,106.67
Gross amount due to customers for contract work 19,838.60 13,169.84

Summary of significant accounting policies and other explanatory information to the consolidated financial statements as at and for the year ended 31 December 2017
Annual Report 2017
Con
solid
ated
Fina
ncia
l Sta
tem
ents
Sta
tuto
ry R
epor
tsC
orpo
rate
Ove
rvie
w
193 204
noTe 31 - segmenT RepoRTIngThe Company is principally engaged in a single business segment viz. Construction. Also refer note 35 for information on revenue from major customers.
noTe 32 - FInanCIaL InsTRumenTs The fair value of the financial assets are included at amounts at which the instruments could be exchanged in a current transaction between willing parties other than in a forced or liquidation sale.
The following methods and assumptions were used to estimate the fair value:
(a) Fair value of cash and short term deposits, trade and other short term receivables, trade payables, other current liabilities, approximate their carrying amounts largely due to the short-term maturities of these instruments
(b) Financial instruments with fixed and variable interest rates are evaluated by the Company based on parameters such as interest rates and individual credit worthiness of the counter party. Based on this evaluation, allowances are taken to account for the expected losses of these receivables.
a Financial instruments by category The carrying value and fair value of financial instruments by categories as at 31 December 2017 were as follows:
` lakhs
Refer note
amortised cost
Financial assets/ liabilities at fair value through profit or loss
Financial assets/ liabilities at fair value
through oCI
Total carrying
value
Total fair value
Designated upon initial recognition
mandatory Designated upon initial recognition
mandatory
assets:
Investments
Investments in equity shares (unquoted)
4 - - - 57.49 - 57.49 57.49
Trade receivables 5 24,294.01 - - - - 24,294.01 24,294.01
Loans 6 40,250.58 - - - - 40,250.58 40,250.58
Other financial assets 7 65,364.80 - - 1,478.73 - 66,843.53 66,843.53
Cash and cash equivalents 12 11,324.89 - - - - 11,324.89 11,324.89
Other bank balances 13 253.41 - - - - 253.41 253.41
Liabilities:
Borrowings 15,17 48,859.85 - - - - 48,859.85 48,859.85
Trade payables 18 61,966.96 - - - - 61,966.96 61,966.96
Other financial liabilities 19 7,085.97 - - - - 7,085.97 7,085.97

Summary of significant accounting policies and other explanatory information to the consolidated financial statements as at and for the year ended 31 December 2017
ITD Cementation India Limited
194 204
The carrying value and fair value of financial instruments by categories as at 31 December 2016 were as follows:
` lakhs
Refer note
amortised cost
Financial assets/ liabilities at fair value through profit or loss
Financial assets/ liabilities at fair value
through oCI
Total carrying
value
Total fair value
Designated upon initial recognition
mandatory Designated upon initial recognition
mandatory
assets:
Investments
Investments in equity shares (unquoted)
4,11 - - - 57.75 - 57.75 57.75
Trade receivables 5 24,328.23 - - - - 24,328.23 24,328.23
Loans 6 16,460.49 - - - - 16,460.49 16,460.49
Other financial assets 7 53,995.78 - - - - 53,995.78 53,995.78
Cash and cash equivalents 12 16,255.46 - - - - 16,255.46 16,255.46
Other bank balances 13 272.48 - - - - 272.48 272.48
Liabilities:
Borrowings 15,17 35,621.17 - - - - 35,621.17 35,621.17
Trade payables 18 61,398.12 - - - - 61,398.12 61,398.12
Other financial liabilities 19 4,205.04 - - - - 4,205.04 4,205.04
The carrying value and fair value of financial instruments by categories as at 1 January 2016 were as follows
` lakhs
Refer note
amortised cost
Financial assets/ liabilities at fair value through profit or loss
Financial assets/ liabilities at fair value
through oCI
Total carrying
value
Total fair value
Designated upon initial recognition
mandatory Designated upon initial recognition
mandatory
assets:
Investments
Investments in equity shares (unquoted)
4,11 - - - 57.75 - 57.75 57.75
Trade receivables 5 27,533.58 - - - - 27,533.58 27,533.58
Loans 6 12,239.45 - - - - 12,239.45 12,239.45
Other financial assets 7 84,015.77 - - - - 84,015.77 84,015.77
Cash and cash equivalents 12 7,916.78 - - - - 7,916.78 7,916.78
Other bank balances 13 6,257.82 - - - - 6,257.82 6,257.82
Liabilities:
Borrowings 15,17 48,835.93 - - - - 48,835.93 48,835.93
Trade payables 18 72,418.46 - - - - 72,418.46 72,418.46
Other financial liabilities 19 3,658.09 - - - - 3,658.09 3,658.09
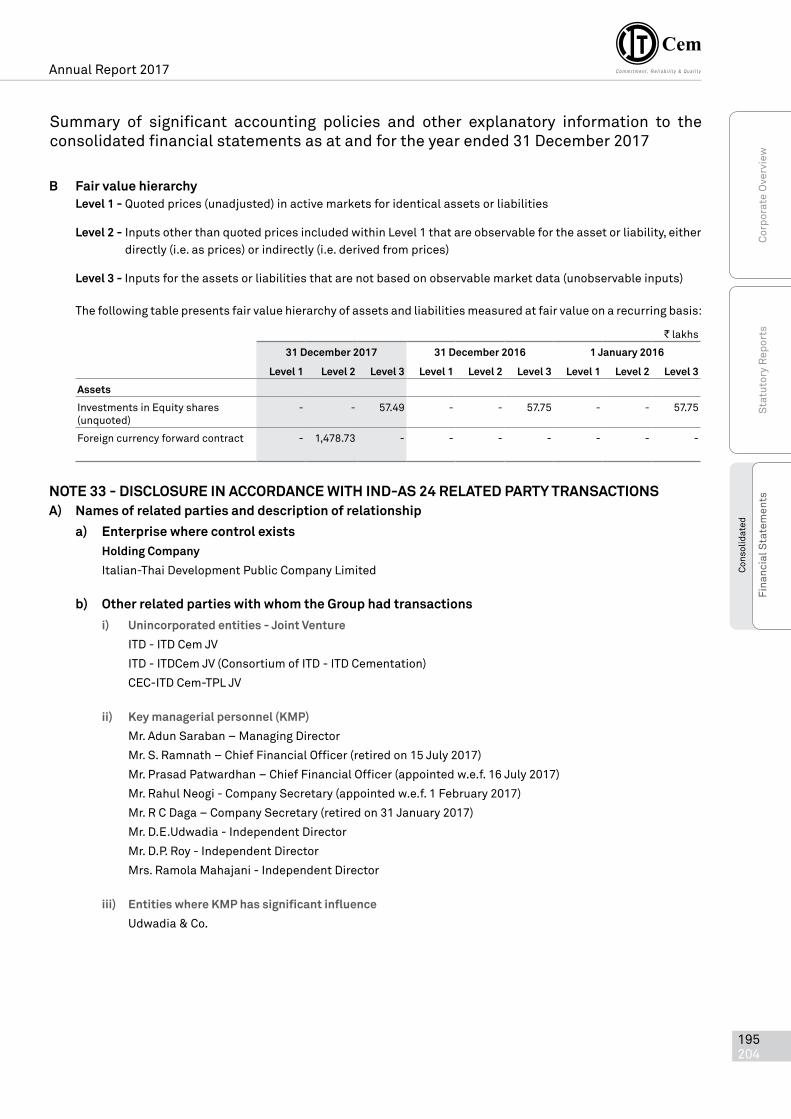
Summary of significant accounting policies and other explanatory information to the consolidated financial statements as at and for the year ended 31 December 2017
Annual Report 2017
Con
solid
ated
Fina
ncia
l Sta
tem
ents
Sta
tuto
ry R
epor
tsC
orpo
rate
Ove
rvie
w
195 204
b Fair value hierarchy Level 1 - Quoted prices (unadjusted) in active markets for identical assets or liabilities
Level 2 - Inputs other than quoted prices included within Level 1 that are observable for the asset or liability, either directly (i.e. as prices) or indirectly (i.e. derived from prices)
Level 3 - Inputs for the assets or liabilities that are not based on observable market data (unobservable inputs)
The following table presents fair value hierarchy of assets and liabilities measured at fair value on a recurring basis:
` lakhs
31 December 2017 31 December 2016 1 January 2016
Level 1 Level 2 Level 3 Level 1 Level 2 Level 3 Level 1 Level 2 Level 3
assets
Investments in Equity shares (unquoted)
- - 57.49 - - 57.75 - - 57.75
Foreign currency forward contract - 1,478.73 - - - - - - -
noTe 33 - DIsCLosuRe In aCCoRDanCe WITh InD-as 24 ReLaTeD paRTy TRansaCTIonsa) names of related parties and description of relationship a) enterprise where control exists holding Company
Italian-Thai Development Public Company Limited
b) other related parties with whom the group had transactions i) unincorporated entities - Joint venture
ITD - ITD Cem JV
ITD - ITDCem JV (Consortium of ITD - ITD Cementation)
CEC-ITD Cem-TPL JV
ii) key managerial personnel (kmp)
Mr. Adun Saraban – Managing Director
Mr. S. Ramnath – Chief Financial Officer (retired on 15 July 2017)
Mr. Prasad Patwardhan – Chief Financial Officer (appointed w.e.f. 16 July 2017)
Mr. Rahul Neogi - Company Secretary (appointed w.e.f. 1 February 2017)
Mr. R C Daga – Company Secretary (retired on 31 January 2017)
Mr. D.E.Udwadia - Independent Director
Mr. D.P. Roy - Independent Director
Mrs. Ramola Mahajani - Independent Director
iii) entities where kmp has significant influence
Udwadia & Co.

Summary of significant accounting policies and other explanatory information to the consolidated financial statements as at and for the year ended 31 December 2017
ITD Cementation India Limited
196 204
noTe 33 - DIsCLosuRe In aCCoRDanCe WITh InD as 24 ReLaTeD paRTy TRansaCTIons b) nature of Transactions Transactions with related parties:
` lakhs
year ended 31 December 2017
year ended 31 December 2016
Contract Revenue
Italian-Thai Development Public Company Limited
Holding Company - 131.61
CEC-ITDCEM-TPL JV Unincorporated entity (joint venture)
2,179.06 -
2,179.06 131.61
Royalty expense
Italian-Thai Development Public Company Limited
Holding Company 933.15 -
plant and tools hire income (net of expenses)
ITD-ITDCem JV Unincorporated entity (joint venture)
127.47 205.68
purchases of property, plant and equipment
ITD-ITDCem JV Unincorporated entity (joint venture)
412.69 -
purchases of construction materials and spares
ITD-ITDCem JV Unincorporated entity (joint venture)
- 71.61
Remuneration
Mr. Adun Saraban KMP 146.37 132.55
Mr. S. Ramnath KMP 54.86 62.16
Mr. Prasad Patwardhan KMP 39.48 -
Mr. Rahul Neogi KMP 45.60 -
Mr. R. C. Daga KMP 4.73 54.02
291.04 248.73
Director sitting fees
Mr. D. E. Udwadia KMP 5.10 4.50
Mr. D. P. Roy KMP 3.60 2.80
Mrs. Ramola Mahajani KMP 2.30 1.60
11.00 8.90
professional fees
Udwadia & Co. Entities where KMP has significant influence
15.16 23.59
share of profit/(loss) after tax in unincorporated entity
ITD-ITDCem JV Unincorporated entity (joint venture)
(1,382.23) (5,517.53)
ITD-ITDCem JV (Consortium of ITD-ITD Cementation)
Unincorporated entity (joint venture)
(0.43) (184.68)
(1,382.66) (5,702.21)

Summary of significant accounting policies and other explanatory information to the consolidated financial statements as at and for the year ended 31 December 2017
Annual Report 2017
Con
solid
ated
Fina
ncia
l Sta
tem
ents
Sta
tuto
ry R
epor
tsC
orpo
rate
Ove
rvie
w
197 204
C) outstanding balances:` lakhs
as at31 December 2017
as at31 December 2016
as at1 January 2016
Trade receivables
Italian-Thai Development Public Company Limited
Holding Company - 2.26 25.89
Creditors for capital expenses
ITD-ITDCem JV Unincorporated entity (joint venture)
79.70 70.02 70.02
balances - payable
Italian-Thai Development Public Company Limited
Holding Company 246.66 - -
balances - receivable
Italian-Thai Development Public Company Limited
Holding Company 400.51 409.67 409.66
ITD-ITDCem JV Unincorporated entity (joint venture)
35,888.17 12,586.30 9,554.37
ITD-ITDCem JV (Consortium of ITD-ITD Cementation)
Unincorporated entity (joint venture)
671.20 831.65 566.33
CEC-ITDCEM-TPL JV Unincorporated entity (joint venture)
81.21 68.11 -
37,041.09 13,895.73 10,530.36
Corporate guarantee issued on behalf of
ITD-ITD Cem JV Unincorporated entity (joint venture)
77,500.00 48,651.00 48,651.00
CEC -ITD Cem-TPL JV Unincorporated entity (joint venture)
51,000.00 - -
128,500.00 48,651.00 48,651.00
Letter of credit limit utilized
ITD-ITDCem JV Unincorporated entity (joint venture)
760.53 610.77 63.81
bank guarantee issued on behalf of
ITD-ITDCem JV Unincorporated entity (joint venture)
32,051.13 2,728.16 5,327.79
ITD-ITDCem JV (Consortium of ITD-ITD Cementation)
Unincorporated entity (joint venture)
196.43 - 200.00
CEC-ITDCEM-TPL JV Unincorporated entity (joint venture)
16,980.60 - -
49,228.16 2,728.16 5,527.79

Summary of significant accounting policies and other explanatory information to the consolidated financial statements as at and for the year ended 31 December 2017
ITD Cementation India Limited
198 204
noTe 34 - InTeResTs In oTheR enTITIesnote 34.1 - subsidiaries
name of the entity
Country of incorporation
ownership interest held by the group (%)
ownership interest held by non controlling interests (%)
principal activities
31 December 2017
31 December 2016
1 January 2016
31 December 2017
31 December 2016
1 January 2016
ITD Cementation Projects India Limited
India 100.00 100.00 100.00 - - - Construction
ITD Cemindia JV NA 80.00 80.00 80.00 20.00 20.00 20.00 ConstructionITD Cem-Maytas Consortium
NA 95.00 95.00 95.00 5.00 5.00 5.00 Construction
note 34.2 non-controlling interests (nCI)The following table summarises the information relating to each of the subsidiaries that has NCI. The amounts disclosed for each subsidiary are before intra-group eliminations
` lakhs
ITD Cemindia Jv ITD Cem-maytas Consortium
31 December 2017
31 December 2016
1 January 2016
31 December 2017
31 December 2016
1 January 2016
Non-current assets 10,962.85 869.05 702.62 - - -Current assets 22,527.98 1,015.90 866.68 2,514.08 2,516.27 2,601.12Non-current liabilities 123.37 0.64 3.82 - - -Current liabilities 33,019.62 1,591.24 1,468.59 2,139.35 2,143.32 2,192.03net assets 347.84 293.07 96.89 374.73 372.95 409.09net assets attributable to nCI 69.57 58.61 19.38 18.74 18.65 20.46Revenue 19,345.74 1,923.07 *^ 55.23 176.06 *^profit for the year 54.77 196.18 *^ 1.78 (36.14) *^Other comprehensive income - - *^ - - *^Total comprehensive income 54.77 196.18 *^ 1.78 (36.14) *^Profit/(loss) allocated to NCI 10.95 39.24 *^ 0.09 (1.81) *^OCI allocated to NCI - - *^ - - *^Total comprehensive income allocated to nCI
10.95 39.24 *^ 0.09 (1.81) *^
Cash flow from operating activities
(9,682.52) 42.52 *^ (49.47) (13.37) *^
Cash flow from investing activities
(7,520.10) (163.70) *^ - 6.18 *^
Cash flow from financing activities
17,776.89 100.61 *^ 54.09 (0.01) *^
Net increase/(decrease) in cash and cash equivalents
574.27 (20.57) *^ 4.62 (7.20) *^
*^ Indicates disclosures that are not required
note 34.3 unincorporated entities - Joint venturename of the entity ownership interest (%) Carrying amount as at * principal
activities31 December 2017
31 December 2016
1 January 2016
31 December 2017
31 December 2016
1 January 2016
ITD - ITD Cem JV 49.00 49.00 49.00 57.49 57.49 57.49 ConstructionITD - ITDCem JV (Consortium of ITD - ITD Cementation)
40.00 40.00 40.00 - - - Construction
CEC-ITD Cem-TPL JV 60.00^ 60.00^ - - - - Construction57.49 57.49 57.49
* Unlisted entity - no quoted price available
^ Though the Group’s effective interest in the joint venture exceeds 50%, the entity has been classified as a joint venture. The management has assessed whether or not the Group has control over the entity based on whether the Group has practical ability to direct relevant activities unilaterally. In this case, based on specific joint venture agreement, the management concluded that the Group does not have practical ability to direct the relevant activities unilaterally but has such ability along with the other co-venturer.

Summary of significant accounting policies and other explanatory information to the consolidated financial statements as at and for the year ended 31 December 2017
Annual Report 2017
Con
solid
ated
Fina
ncia
l Sta
tem
ents
Sta
tuto
ry R
epor
tsC
orpo
rate
Ove
rvie
w
199 204
note 34.4 Table below provide summarised financial information for unincorporated Joint ventures` lakhs
ITD - ITD Cem Jv ITD - ITDCem Jv (Consortium of ITD - ITD Cementation)
CeC-ITD Cem-TpL Jv
31 December
2017
31 December
2016
1 January 2016
31 December
2017
31 December
2016
1 January 2016
31 December
2017
31 December
2016
1 January 2016
Non-current assets 21,059.51 26,306.88 24,555.24 1,548.50 2,065.53 2378.48 15,514.10 2,049.33 -
Current assets
- Cash and cash equivalents 6,755.79 585.45 924.20 74.29 334.20 62.68 4,023.84 3,543.45 -
- Other assets 39,370.00 35,752.29 39,634.23 138.96 141.91 187.58 18,904.29 2,425.96 -
Current assets 46,125.79 36,337.74 40,558.43 213.25 476.11 250.26 22,928.13 5,969.41 -
non-current liabilities
- Financial liabilities (excluding trade payables)
- - - - 5.41 - - - -
- Other liabilities - - - - - 13.08 1.13 - -
non-current liabilities - - - - 5.41 13.08 1.13 - -
Current liabilities
- Financial liabilities (excluding trade payables)
13,954.05 25,278.42 28,125.42 2.70 7.64 8.74 1,468.64 45.98 -
- Other liabilities 12,707.23 24,326.44 21,309.67 86.98 455.42 520.57 36,953.45 7,841.80 -
Current liabilities 26,661.28 49,604.86 49,435.09 89.68 463.06 529.31 38,422.09 7,887.78 -
net assets 40,524.02 13,039.76 15,678.58 1,672.07 2,073.17 2,086.35 19.01 130.96 -
group share of net assets
Revenue 28,578.34 28,439.56 *^ 266.02 1.45 *^ 23,909.39 1,693.98 *^
Other income 6,602.94 1,438.03 *^ 69.89 23.64 *^ 568.25 14.52 *^
Cost of construction materials consumed
13,386.48 15,359.82 *^ - 0.10 *^ 5,411.90 120.23 *^
Subcontracting expenses 7,986.19 7,238.95 *^ 66.75 45.75 *^ 6,807.77 74.66 *^
Employee benefits expense 4,639.85 5,634.43 *^ 120.56 302.15 *^ 2,574.06 357.63 *^
Finance cost 3,130.92 5,544.32 *^ 20.31 2.58 *^ 331.93 90.92 *^
Depreciation expense 2,352.02 3,075.54 *^ - 1.02 *^ 610.06 2.28 *^
Other expense 5,498.75 8,509.45 *^ 129.37 110.45 *^ 8,744.01 1,062.78 *^
Loss for the year
before tax (1,812.93) (15,484.92) *^ (1.08) (436.96) *^ (2.09) - *^
Income tax expenses 1,007.94 (4,226.59) *^ - 24.54 *^ (2.41) - *^
Loss for the year (2,820.87) (11,258.33) *^ (1.08) (461.50) *^ 0.32 - *^
Other comprehensive income - - *^ - (0.22) *^ (0.32) - *^
Total comprehensive income (2,820.87) (11,258.33) *^ (1.08) (461.72) *^ - - *^
Group share of profit/ (Loss) (1,382.23) (5,516.58) *^ (0.43) (184.60) *^ 0.19 - *^
Group share of OCI - - *^ - (0.09) *^ (0.19) - *^
group share of total
comprehensive income (1,382.23) (5,516.58) *^ (0.43) (184.69) *^ - - *^

Summary of significant accounting policies and other explanatory information to the consolidated financial statements as at and for the year ended 31 December 2017
ITD Cementation India Limited
200 204
noTe 35 - FInanCIaL RIsk managemenT obJeCTIves anD poLICIes The Group’s activities expose it to a variety of financial risks: market risk, credit risk and liquidity risk. The Group’s focus is to foresee the unpredictability of financial markets and seek to minimize potential adverse effects on its financial performance.
i market risk Market risk is the risk that the fair value of future cash flows of a financial instrument will fluctuate because of
changes in market prices. Market risk comprises three types of risk: interest rate risk, currency risk and other price risk, such as equity price risk. Major financial instruments affected by market risk includes loans and borrowings.
a Interest rate risk Interest rate risk is the risk that the fair value or future cash flows of a financial instrument will fluctuate
because of changes in market interest rates. The Group’s exposure to the risk of changes in market interest rates relates primarily to the Group’s total debt obligations with floating interest rates.
Interest rate sensitivity The following table demonstrates the sensitivity to a reasonably possible change in interest rates on that
portion of loans and borrowings affected. With all other variables held constant, the Group’s profit before tax is affected through the impact on floating rate borrowings, as follows:
` lakhs
31 December 2017 31 December 2016
Increase in basis points 50 basis points 50 basis points
Effect on profit before tax, increase by 245.16 241.01
Decrease in basis points 50 basis points 50 basis points
Effect on profit before tax, decrease by 245.16 241.01
The assumed movement in basis points for the interest rate sensitivity analysis is based on the currently observable market environment, showing a significantly higher volatility than in prior years.
b Foreign currency risk The following table analyses foreign currency risk from financial instruments as at 31 December 2017:
In lakhs
euro Total
Trade payables 19.15 19.15
The following table analyses foreign currency risk from financial instruments as at 31 December 2016:
In lakhs
usD euro Total
Trade payables 0.65 2.31 2.96
The following table analyses foreign currency risk from financial instruments as of 1 January 2016:
In lakhs
usD euro Total
Trade payables 0.15 0.14 0.29
During the current year to mitigate the Group’s exposure to foreign currency risk, non-INR cash flows are monitored and forward exchange contracts are entered into in accordance with the Group’s risk management policies. Generally, the Group’s risk management procedures distinguish short-term foreign currency cash flows (due within 6 months) from longer-term cash flows (due after 6 months).

Summary of significant accounting policies and other explanatory information to the consolidated financial statements as at and for the year ended 31 December 2017
Annual Report 2017
Con
solid
ated
Fina
ncia
l Sta
tem
ents
Sta
tuto
ry R
epor
tsC
orpo
rate
Ove
rvie
w
201 204
The following table gives details in respect of outstanding foreign exchange forward contracts:
as at 31 December 2017
as at 31 December 2016
as at 1 January 2016
In euro lakhs
` lakhs In lakhs ` lakhs In lakhs ` lakhs
Forward contracts 19.15 1,497.60 - - - -
The foreign exchange forward contracts mature within 6 months. The table below analyses the derivative financial instruments into relevant maturity groupings based on the remaining period as of the balance sheet date:
(Euro in lakhs)
as at 31 December 2017
as at 31 December 2016
as at 1 January 2016
Not later than one month 8.88 - -
Later than one month and not later than three months
10.27 - -
sensitivity analysis The Group’s exposure in foreign currency is not material and hence the impact of any significant fluctuation in the
exchange rates is not expected to have a material impact on the operating profits of the Group.
ii Credit risk Credit risk refers to the risk of default on its obligation by the counterparty resulting in a financial loss. The maximum
exposure of the financial assets are contributed by trade receivables, unbilled revenue, cash and cash equivalents and receivable from related parties.
a Credit risk on trade receivables and unbilled revenue is limited as the customers of the Group mainly consists of the government promoted entities having a strong credit worthiness. For other customers, the Group uses a provision matrix to compute the expected credit loss allowance for trade receivables and unbilled revenue. The provision matrix takes into account available external and internal credit risk factors such as credit ratings from credit rating agencies, financial condition, ageing of accounts receivable and the Group’s historical experience for customers.
The following table gives details in respect of percentage of revenues generated from government promoted agencies and others
31 December 2017 31 December 2016
% %
Revenue from government promoted agencies 46.27% 31.58%
Revenue from others 53.73% 68.42%
100.00% 100.00%
The following table gives details in respect of contract revenues generated from the top customer and top 5 customers for the year ended:
31 December 2017 31 December 2016
` lakhs % of Revenue
` lakhs % of Revenue
Revenue from top customer 25,617 12.44% 99,654 33.95%
Revenue from top five customers 68,325 33.18% 164,694 56.10%
For the year ended 31 December 2017, One (31 December 2016: One) customer, individually, accounted for more than 10% of the revenue.

Summary of significant accounting policies and other explanatory information to the consolidated financial statements as at and for the year ended 31 December 2017
ITD Cementation India Limited
202 204
The movement of the allowance for lifetime expected credit loss is stated below: ^
` lakhs
31 December 2017 31 December 2016
Balance at the beginning of the year 613.57 881.51
Balance at the end of the year 182.12 613.57
^ The Company has written off ` 13,323.35 lakhs and ` 342.89 lakhs towards amounts not recoverable from trade
receivables and unbilled revenue during the years ended 31 December 2017 and 31 December 2016, respectively.
b. Credit risk on cash and cash equivalents is limited as the Group generally invest in deposits with banks and financial institutions with high credit ratings.
iii Liquidity risk Liquidity is defined as the risk that the Group will not be able to settle or meet its obligations on time or at a reasonable
price. The Group’s treasury department is responsible for liquidity, funding as well as settlement management. In addition, processes and policies related to such risks are overseen by senior management. Management monitors the Group’s net liquidity position through rolling forecasts on the basis of expected cash flows.
The table below provides details regarding the contractual maturities of significant financial liabilities:
` lakhs
on demand Less than 1 year
1 - 5 years more than 5 years
Total
as at 31 December 2017
Borrowings 24,738.52 21,659.57 2,461.76 - 48,859.85
Trade payables - 61,966.96 - - 61,966.96
Interest accrued - 73.93 - - 73.93
Other financial liabilities - 7,012.04 - - 7,012.04
Total 24,738.52 90,712.50 2,461.76 - 117,912.78
as at 31 December 2016
Borrowings 11,848.43 19,710.61 4,062.13 - 35,621.17
Trade payables - 61,398.12 - - 61,398.12
Interest accrued - 37.20 - - 37.20
Other financial liabilities - 4,167.84 - - 4,167.84
Total 11,848.43 85,313.77 4,062.13 - 101,224.33
as at 1 January 2016
Borrowings 27,668.90 20,184.22 982.81 - 48,835.93
Trade payables - 72,418.46 - - 72,418.46
Interest accrued - 137.77 - - 137.77
Other financial liabilities - 3,520.32 - - 3,520.32
Total 27,668.90 96,260.77 982.81 - 124,912.48
noTe 36Subsequent to the year ended 31 December 2017, a case has been registered by the Anti-Corruption Bureau against some officers at the State Tax Enforcement Wing at Vijayawada and an employee of the Company along with a representative of the Company on the allegation of an attempt to bribe an Additional Commissioner of Commercial Taxes, Andhra Pradesh. While investigation process is on, the employee has been suspended.

Summary of significant accounting policies and other explanatory information to the consolidated financial statements as at and for the year ended 31 December 2017
Annual Report 2017
Con
solid
ated
Fina
ncia
l Sta
tem
ents
Sta
tuto
ry R
epor
tsC
orpo
rate
Ove
rvie
w
203 204
noTe 37 - CapITaL managemenTFor the purpose of the Group’s capital management, capital includes issued equity capital and all other equity reserves attributable to the equity holders of the Group. The Group strives to safeguard its ability to continue as a going concern so that they can maximise returns for the shareholders and benefits for other stake holders. The aim to maintain an optimal capital structure and minimise cost of capital.
The Group manages its capital structure and makes adjustments in light of changes in economic conditions and the requirements of the financial covenants. To maintain or adjust the capital structure, the Group may return capital to shareholders, issue new shares or adjust the dividend payment to shareholders (if permitted). Consistent with others in the industry, the Group monitors its capital using the gearing ratio which is total debt divided by total capital.
` lakhs
as at 31 December 2017
as at 31 December 2016
as at 1 January 2016
Total debts 48,859.85 35,621.17 48,835.93
Total equity 61,815.90 55,279.17 50,300.65
Total debts to equity ratio (gearing ratio) 0.79 0.64 0.97
In the long run, the Group’s strategy is to maintain a gearing ratio less than 0.5.
noTe 38 - Disclosure of unhedged foreign currency exposure as at 31 December 2017
Currency 31 December 2017 31 December 2016 1 January 2016
Foreign currency
` lakhs Foreign currency
` lakhs Foreign currency
` lakhs
Liabilities
Acceptances USD - - 64,755.00 44.48 14,526.00 9.67
EURO - - 231,409.00 168.10 13,811.00 13.73
Liabilities - 212.58 23.40
This is a summary of significant accounting policies and other explanatory information referred to in our audit report of even date.
For Walker Chandiok & Co LLp For and on behalf of the board of Directors Chartered AccountantsFirm Registration No. 001076N/N500013
Rakesh R. agarwal adun saraban p. ChakornbunditPartner Managing Director DirectorMembership No: 109632 DIN: 01312769 DIN: 00254312
prasad patwardhan Rahul neogiChief Financial Officer Company SecretaryACA No.44453 ACS No.10653
Place : Mumbai Place : MumbaiDate : 22 February 2018 Date : 22 February 2018

ITD Cementation India Limited
204 204
Notes

Corporate Information
BOARD OF DIRECTORSP. Karnasuta, Chairman
P. Chakornbundit, Vice Chairman
A. Saraban, Managing Director
D. E. udwadiaPer Hofvander (Resigned w.e.f. 23rd February, 2018)
D. P. Roy
Ramola Mahajani
Piyachai KarnasutaSunil Shah Singh (Appointed as an Additional Director w.e.f. 22nd February, 2018)
COMMITTEES OF DIRECTORSAudit CommitteePer Hofvander (Resigned w.e.f. 23rd February, 2018)
D. E. udwadia
P. Chakornbundit
D. P. Roy
Stakeholders' Relationship CommitteeP. Chakornbundit
A. Saraban
Nomination And Remuneration CommitteeD. E. udwadia
P. Karnasuta
P. Chakornbundit
Per Hofvander (Resigned w.e.f. 23rd February, 2018)
Corporate Social Responsibility CommitteePer Hofvander (Resigned w.e.f. 23rd February, 2018)
P. Chakornbundit
A. Saraban
CHIEF FINANCIAL OFFICERPrasad Patwardhan
COMPANY SECRETARYRahul Neogi
AUDITORSWalker Chandiok & Co LLP, Mumbai
LEGAL ADVISERSudwadia & Co., Mumbai
BANKERSAllahabad BankAxis Bank LimitedBank of BarodaBank of IndiaBank of MaharashtraCentral Bank of IndiaExport-Import Bank of IndiaIDBI Bank LimitedPunjab National BankStandard Chartered BankState Bank of IndiaSyndicate BankThe Federal Bank Limitedunion Bank of India
REGISTERED OFFICENational Plastic Building,A-Subhash Road, Paranjape B Scheme,Vile Parle (East), Mumbai - 400 057.Phone No.: +91-22-6693 1600 Fax No.: +91-22-6693 1628Email: [email protected]: www.itdcem.co.in
AREA OFFICESMumbaiKolkataDelhiChennai
R & D LOCATIONKolkata
REGISTRARS AND SHARE TRANSFER AGENTSKarvy Computershare Private LimitedKarvy Selenium Tower B, Plot 31-32, Gachibowli, Financial District, Nanakramguda, Hyderabad - 500 032.Phone No.: +91 40 67162222 Fax No.: +91 40 23420814 Email: [email protected]
ANNUAL GENERAL MEETINGThursday, 10th May, 2018, 4.00 p.m.Rama and Sundri Watumull Auditorium, Kishinchand Chellaram College, Vidyasagar Principal K. M. Kundnani Chowk, 124, Dinshaw Wachha Road, Churchgate, Mumbai - 400 020.

ITD Cementation India LimitedCIN: L61000MH1978PLC020435National Plastic Building,A-Subhash Road, Paranjape B Scheme,Vile Parle (East), Mumbai 400 057
Tel: +91-22-6693 1600
Fax: +91-22-6693 1628
E-mail: [email protected]
Website: www.itdcem.co.in