making the business case for sustainable design in the
TRANSCRIPT

Air Force Institute of Technology Air Force Institute of Technology
AFIT Scholar AFIT Scholar
Theses and Dissertations Student Graduate Works
3-2004
Making the Business Case for Sustainable Design in the Making the Business Case for Sustainable Design in the
Department of Defense Department of Defense
David M. Warnke
Follow this and additional works at: https://scholar.afit.edu/etd
Part of the Environmental Design Commons, Environmental Engineering Commons, and the
Sustainability Commons
Recommended Citation Recommended Citation Warnke, David M., "Making the Business Case for Sustainable Design in the Department of Defense" (2004). Theses and Dissertations. 4078. https://scholar.afit.edu/etd/4078
This Thesis is brought to you for free and open access by the Student Graduate Works at AFIT Scholar. It has been accepted for inclusion in Theses and Dissertations by an authorized administrator of AFIT Scholar. For more information, please contact [email protected].

MAKING THE BUSINESS CASE FOR
SUSTAINABLE DESIGN IN THE DEPARTMENT OF DEFENSE
THESIS
David M. Warnke, Captain, USAF
AFIT/GEM/ENV/04M-20
DEPARTMENT OF THE AIR FORCE AIR UNIVERSITY
AIR FORCE INSTITUTE OF TECHNOLOGY
Wright-Patterson Air Force Base, Ohio
APPROVED FOR PUBLIC RELEASE; DISTRIBUTION UNLIMITED

The views expressed in this thesis are those of the author and do not reflect the official policy or position of the United States Air Force, Department of Defense, or the United States Government.

AFIT/GEM/ENV/04M-20
MAKING THE BUSINESS CASE FOR SUSTAINABLE DESIGN
IN THE DEPARTMENT OF DEFENSE
THESIS
Presented to the Faculty
Department of Systems and Engineering Management
Graduate School of Engineering and Management
Air Force Institute of Technology
Air University
Air Education and Training Command
In Partial Fulfillment of the Requirements for the
Degree of Master of Science in Engineering Management
David M. Warnke, BS
Captain, USAF
March 2004
APPROVED FOR PUBLIC RELEASE; DISTRIBUTION UNLIMITED

AFIT/GEM/ENV/04M-20
MAKING THE BUSINESS CASE FOR SUSTAINABLE DESIGN
IN THE DEPARTMENT OF DEFENSE
David M. Wamke, BS Captain, USAF
Approved:

iv
AFIT/GEM/ENV/04M-20
Abstract
Buildings are one of the largest consumers of natural resources, a major source of
ecological pollution, and occasionally toxic to human health. Sustainable design is the
common term associated with buildings which, during their construction, use, and
eventual disposal, seek to minimize these negative impacts. The U.S. Green Building
Council’s (USGBC) Leadership in Energy and Environmental Design (LEED™) rating
system helps to assess the level of a building’s sustainability.
In the Federal Government’s push to set the example for the rest of the nation,
nearly every Federal Agency has chosen to adopt the LEED™ assessment tool. Each of
Armed Services in the Department of Defense has set ambitious LEED™ certification
goals for future construction. Despite their stated goals and the clear environmental and
health benefits of LEED™, a common complaint is that LEED™ designed buildings are
simply too costly to construct. However, many proponents of LEED™ profess that
LEED™ designed buildings shouldn’t cost significantly more than conventionally
designed and constructed buildings and that the life-cycle cost savings should rapidly
compensate for any additional initial costs. Unfortunately, no comprehensive studies
have been performed on initial construction costs in the Department of Defense;
therefore, it continues to be the primary source of unit level resistance to LEED™ and
sustainable design. This research gathered historical cost data from 22 completed Federal
construction projects and used statistical analysis to explore whether a business case

v
could be made to support LEED™ using initial construction costs in the Department of
Defense.
Results from the analysis were mixed. Hypothesis testing deemed there was
statistically no difference in cost between LEED™ and conventionally designed facility
construction. On average, LEED™ buildings were only 1.9% more expensive to
construct than conventional facilities; however, the 9.2% standard deviation made it
difficult to make a strong supporting business case. The conclusion was the operational
life-cycle costs savings would currently have to bear the primary responsibility for
making a business case supporting LEED™ and sustainable design.

vi
Acknowledgements
I can’t begin to thank all the people who took their time and effort to talk or
correspond with me on the topic of LEED™ and sustainable design. Your words of
wisdom, interest, and encouragement helped to personally validate the merits of
sustainable design and this thesis. Additionally, I would like to express my gratitude to
my thesis and academic advisor Dr. Charles Bleckmann for knowing the optimum
amount of pressure, encouragement, and guidance to provide throughout this thesis
process. I would also like to thank Lt Col Alfred Thal for suffering with me on my initial
quest for a thesis topic and for being a member of my thesis committee. Your Air Force
Civil Engineer background and knowledge continually provided a sanity check on what I
was trying to accomplish. Additionally, I would like to give special thanks to my final
committee member, Lt Col Ellen England. I directly credit her knowledge, interest, and
enthusiasm in explaining the sustainability of the planet’s diverse ecosystems for
sparking an interest in me toward sustainable design. Of course, I am grateful, as always,
to my entire family for their continuous support and encouragement throughout this entire
academic process. Finally, special thanks to my wife for her patience and understanding.
I appreciate her attempts to maintain the perspective and balance we were so frequently
reminded about.

vii
Table of Contents
Page
Abstract............................................................................................................................. iv
Acknowledgements .......................................................................................................... vi
Table of Contents ............................................................................................................ vii
List of Figures.....................................................................................................................x
List of Tables .................................................................................................................... xi
I. Introduction ....................................................................................................................1
1.1 Sustainable Development Movement .....................................................................1
1.2 Sustainable Development Federal Policies ............................................................2
1.3 Natural Resource Consumption .............................................................................3
1.4 Sustainable Design Emergence in the Department of Defense ............................5
1.5 Sustainable Design Hurdles ....................................................................................6
1.6 Problem Statement...................................................................................................8
1.7 Research Objectives.................................................................................................8
1.8 Research Methodology ............................................................................................8
1.9 Relevance ..................................................................................................................9
1.10 Thesis Overview .....................................................................................................9
II. Background .................................................................................................................11
2.1 Presidential and Congressional Mandates for Sustainable Design ...................11
2.2 Federal Energy Reduction Progress.....................................................................15
2.3 Federal Government Implementation of Sustainable Design............................17
2.4 Leadership in Energy and Environmental Design Rating System....................22
2.5 Sustainable Project Rating Tool (SPiRiT)...........................................................25
2.6 LEED™ Integrated Project Team .......................................................................28

viii
Page
2.7 Sustainable Design Construction Costs ...............................................................29
2.8 Life-Cycle Costs of Sustainable Design................................................................30
2.9 Department of Defense Facility Procurement Decisions....................................32
2.10 Department of Defense Facility Acquisition Process........................................33
2.11 LEED™ Criticism................................................................................................38
III. Methodology ..............................................................................................................40
3.1 Data Sources ...........................................................................................................40
3.2 Data Collection.......................................................................................................41
3.3 Data Analysis..........................................................................................................42
IV. Results and Analysis..................................................................................................47
4.1 Data Set Investigation............................................................................................47
4.2 Expanded Data Collection.....................................................................................47
4.3 Data Presentation...................................................................................................49
4.4 Data Validation ......................................................................................................51
4.5 Statistical Analysis of Results ...............................................................................52
4.6 Potential Cost Drivers............................................................................................54
4.7 Evaluation of LEED™/SPiRiT in the Department of Defense ..........................57
V. Conclusions and Recommendations ..........................................................................59
5.1 Research Summary................................................................................................59
5.2 Research Results ....................................................................................................59
5.3 Research Limitations .............................................................................................60
5.4 Recommendations for Future Research ..............................................................61
5.5 Conclusions.............................................................................................................63

ix
Page Appendix A.......................................................................................................................64
Appendix B .......................................................................................................................67
Appendix C.......................................................................................................................70
Appendix D.......................................................................................................................88
Appendix E .......................................................................................................................93
References.........................................................................................................................99

x
List of Figures
Page
Figure 1 Progress Toward Federal Facility Energy Reduction Goals ........................16 Figure 2 Individual Agency Progress Toward Energy Reduction Goals for .............17 Figure 3 CER Development Process (Source: PCEI WG, 1999:3-5) ..........................74 Figure 4 Interpretation of Statistical Indicators (Source: PCEI WG, 1999:3-21).....78 Figure 5 PACES Estimating Process (Source: Earth Tech, 2003:67) .........................84

xi
List of Tables
Page
Table 1 LEED™ Certification Levels ............................................................................24 Table 2 LEED™ vs SPiRiT Point System Comparison ...............................................27 Table 3 LEED™ vs SPiRiT Rating Scale Comparison ................................................28 Table 4 DoD LEED™/SPiRiT Initial Project Cost Data..............................................50 Table 5 Other Federal Government Agencies LEED™ Initial Project Cost Data ....50 Table 6 CER Quality Review Matrix .............................................................................77

1
MAKING THE BUSINESS CASE FOR SUSTAINABLE DESIGN IN THE DEPARTMENT OF DEFENSE
I. Introduction
1.1 Sustainable Development Movement
The beginning of the environmental awareness movement in the United States is
often traced back to Rachel Carson’s 1962 groundbreaking book Silent Spring (Lewis,
1985). Silent Spring chronicled the long-term and far reaching effects of environmental
and ecological contamination. Specifically, the book told an apocalyptic story of the
environmental effects of chemical pesticides (Lear, 1997). Many people took note of her
stark vision of the future. Before Carson’s book, most commercial industries and
products of the era went unregulated with unknown long term impact on humans and the
natural environment. Carson’s inspired environmental movement was the catalyst for the
eventual formation of the Environmental Protection Agency in 1970 (Lewis, 1985).
At the same time the United States was beginning to embrace the environmental
movement, it was also taking root throughout the rest of the world. Not only were
pollution and toxic chemicals concerns, but the mass consumption of the world’s natural
resources was also drawing attention. The exponential population growth many nations
forecasted only exacerbated concern for long term environmental viability.
In 1983, in order to examine the world’s environmental problems and to propose a
global solution, the United Nations Secretary-General established the World Commission
on the Environment and Development. The commission, comprised of members from 21
different countries, was chaired by the former Prime Minister of Norway, Gro Harlem

2
Brundtland (Hart, 1998). The commission eventually became known as the Brundtland
Commission. The commission’s charter was to work towards an agreement on the
unique priorities each nation brought to the discussion. After three years of deliberation,
the Brundtland Commission published their findings and recommendations in the report
titled Our Common Future.
The main concern addressed in the report was for the long term viability and
sustainability of the environment and its inhabitants. Most notably, the Brundtland
Commission agreed on a common definition for sustainable development: “development
that meets the needs of the present without compromising the ability of future generations
to meet their own needs” (Brundtland, 1987). While this definition was purposefully
ambiguous, it paved the way for future discussions between nations.
The United Nations convened a conference in 1992 to further define the
sustainable development ideas presented by the Brundtland Commission. This widely
attended conference became known as the Rio de Janeiro Earth Summit. The Rio Earth
Summit produced an enormous 300-page document, Agenda 21, which was a plan for
achieving worldwide sustainable development into the 21st century. Agenda 21 covered
such diverse topics as air and water pollution, biodiversity, economic trade,
demographics, desertification, energy production and consumption, health, poverty,
technology, and tourism (United Nations, 1992).
1.2 Sustainable Development Federal Policies
Thoughts of sustainable development were not only occurring on the international
front, but also within the United States. In 1993, under Executive Order (EO) 12852,

3
President Clinton chartered the President’s Council for Sustainable Development (PCSD)
(Clinton, 1993b). PCSD was created to advise the President and promote a national
sustainable development agenda. Committee members were drawn from diverse
backgrounds to include science, the environment, and business. The PCSD agenda
focused on many of the social, economic, and environmental issues highlighted in the Rio
Earth Summit’s Agenda 21 and would continue to advise President Clinton through the
end of his second term of office (Clinton, 1995a, 1995b, 1997, 1999a, 1999c).
While President Clinton’s PCSD heavily promoted sustainable development
within industry and the private sector, most of the advancement in sustainable
development was seen in the Federal Government. During his two terms in office,
President Clinton signed many mandates directing the Federal Government to implement
his sustainable development vision. President Clinton believed the Federal Government,
as one of the primary natural resource consumers and polluters, should take the lead in
sustainable development and set an example for the rest of the nation. He also believed
this would help generate and promote markets for emerging sustainable technologies
(Clinton, 1999b).
1.3 Natural Resource Consumption
Justifiably, the majority of President Clinton’s sustainable development policies
focused directly or indirectly on Federal Government facilities. The Federal Government
is the single largest consumer of energy in the United States (Haskins, 2002). Over 40%
(0.404 quadrillion BTUs) of the energy consumed by the Federal Government goes to its
nearly 500,000 buildings (Howard, 2003b; Reicher, 2002). The floor space of these

4
buildings exceeds 3 billion square feet (Wilson, 2001). These facilities consumed an
average 60 billion kilowatt-hours of electricity each year at a cost of nearly $4 billion
dollars (Wilson, 2001; Haskins, 2002). In addition to the energy the Federal Government
consumes each year, it also uses approximately 250 billion gallons of water (Howard,
2003b). The Federal Government is not the only culprit of waste and environmental
degradation. Buildings in general across the nation use approximately 42% (41.6
quadrillion BTUs) of all energy, 25% of all freshwater, 25% of all harvested wood, 30%
of all raw materials, and 60% of all ozone-depleting substances. (O’Dell, 1999; Reicher,
2002; Buildings, 2001). Construction waste constitutes 40% of all material going to
landfills (O’Dell, 1999). Building construction and operation are also responsible for
36% of the carbon dioxide produced each year (Buildings, 2001). To make matter worse,
reports indicate nearly 30% of all buildings suffer from poor indoor air quality,
sometimes termed sick building syndrome (Roodman and Lenssen, 1995, EPA, 1991).
Statistics of this nature continue to legitimize the concerns from Silent Springs and help
drive the sustainable development movement.
The ultimate aspiration of sustainable development is to create and utilize
products which do not negatively impact the natural ecosystem. This entails “closing the
loop” on natural resource exploitation and materials usage. “Closing the loop” means
harvested natural resources should be continuously capable of being reused or fully
recycled into another product.

5
1.4 Sustainable Design Emergence in the Department of Defense
Increased awareness and acceptance of sustainable development ideals nationwide
prompted an organization of industry and construction professionals to come together in
1993 to develop and further promote what was now commonly called green building, or
synonymously, sustainable design. The organization was called the United States Green
Building Council (USGBC). Other similar organizations exist, but do not have the wide
acceptance and following of the USGBC. In 1995, the USGBC developed a
performance-based rating system to qualify the level of sustainability contained in a
facility. This rating system, known as Leadership in Energy and Environmental Design
(LEED™), evaluates the following categories: site selection, water and energy efficiency,
materials use, indoor environment and health, and design innovation. Points are awarded
in each category which total to become the building’s final rating. The final ratings
awarded are non-certified, certified (formerly bronze), silver, gold, and platinum.
USGBC has developed a rating system for both new buildings and renovated or existing
buildings.
One of the primary supporters and intellectual contributors to the USGBC is the
Department of Defense (DoD). DoD leadership believes it has an obligation to follow
sustainable practices since it consumes nearly twice the energy as the entire rest of the
Federal Government combined (Reicher, 2002). The annual energy bill for military
installations exceeds $2.4 billion (Steensma, 2002). In a 1994 display of support for
sustainable development, the Secretary of Defense made the following statement: “The
Department of Defense must improve its environmental performance by actively
implementing policies that embrace pollution prevention in all phases of the acquisition

6
process, the procurement of goods and services and in the life-cycle management of our
installations” (AFCEE, 1997:3). In 1999, the Secretary of Defense sponsored a Service-
wide study of sustainability and sustainable planning. The purpose of the study was to
give the services a common understanding of the policies, goals, opportunities, and
processes of implementing sustainable development. The report was formally titled
Sustainable Planning: A Multi Service Assessment 1999 (Lovins, 1999).
Each of the Armed Services have subsequently come out with their own
sustainable design guidance which provide LEED™ based goals, tools, and references to
aid in the implementation of sustainable design. Not only is there Service specific
guidance, but other Federal Agencies and private organizations are also available to
provide support. Despite the large amount of supporting information available,
sustainable design has yet to become universally accepted in the DoD and the
construction industry.
1.5 Sustainable Design Hurdles
While the lack of acceptance is likely due to a number of factors, the following
paragraph outlines a few of the typical reasons noted during a sustainable design training
session held by Air Force Reserve Command (AFRC) and Georgia Tech Research
Institute (GTRI) (Pearce and others, 2000). First is distrust for sustainable technologies.
Individuals are familiar with first generation sustainable technologies and construction
practices which were initially immature and therefore inefficient and maintenance
intensive. Examples include solar panels, sky lights, low/no-flow toilets, and variable air
volume (VAV) heating, ventilation and air conditioning (HVAC) systems.

7
Second, many planners, designers, and architects are unable to look holistically at
all the components of a successful sustainable building system. Sustainable features are
thrown piecemeal into a facility which either don’t complement each other or don’t have
their intended effect.
Third, sustainable design is considered “riskier” than conventional facility design
and construction practices because of the quantity of unknowns. With the exposure
military construction (MILCON) projects receive from DoD leadership and Congress,
most installations choose the security of the conventional route. It is difficult to explain
why a multi-million dollar facility doesn’t function properly or meet its mission
requirements after construction.
Fourth, sustainable design is also new to the construction industry. There are few
reputable and/or experienced construction contractors willing to take an economic risk to
build green buildings. Even with experienced contractors, construction bids are typically
extremely elevated.
Finally, there is a lack of historical data necessary to successfully sell the costs
and benefits of a sustainable building to leadership and Congress. This final explanation
is really a result of all the other resistance factors. Identifying the financial costs and
benefits as well as other consequences of an action or decision is often called a business
case (Schmidt, 2002). Presenting a convincing business case for sustainable design is
challenging and up to now has been largely unsuccessful.

8
1.6 Problem Statement
The primary source of resistance to sustainable design is the perceived additional
cost of “building green”. There have been no comprehensive Department of Defense
studies on the cost of sustainable design to dispel the monetary concerns. The lack of
historic data complicates the justification and approval process for future sustainable
design projects due to the level of uncertainty involved. The question remains, can a
business case be made for sustainable design in the DoD when considering initial
construction cost as the primary decision factor.
1.7 Research Objectives
The following research objectives were pursued:
1. Compile estimated and actual construction cost data for LEED™ or SPiRiT certified
Federal facilities to determine whether LEED™ or SPiRiT certified facilities cost more
than conventional facilities across the Federal Government.
2. Determine whether the Department of Defense has been more financially successful or
less financially successful than other Federal Agencies in building “green” facilities.
3. Provide recommendations to best make the business case for future sustainable design
projects in the Department of Defense.
1.8 Research Methodology
The following methodology was used to accomplish the research objectives:
1. Review all relevant literature relating to the costs and benefits of sustainable design.

9
2. Examine the various facility approval, design, and construction processes across the
Federal Government.
3. Review a broad spectrum of industry and governmental economic analysis and cost
estimating methodologies.
4. Collect and examine project information on LEED™ based sustainable design
buildings to determine parametric construction cost estimates, and final construction
costs.
5. Analyze the results to determine if there are any general recommendations that can be
gleaned to perform future economic analysis, cost estimating, or justification for
sustainable facilities.
1.9 Relevance
Initial construction costs tend to be greater for sustainable design facilities. Lack
of historical cost information makes it difficult to justify green facilities as the best
alternative in the Federal Government’s approval process which focuses on initial costs.
Without this justification, few sustainable design facilities are being built and therefore
not capitalizing on the life-cycle cost and environmental benefits of sustainable design.
1.10 Thesis Overview
Chapter 2 outlines the Federal Government’s adoption of sustainable design along
with individual Federal Agencies’ implementation of the LEED™ rating tool. The
LEED™ rating system is explained and compared to the Army’s SPiRiT rating system.
Finally, this chapter covers the Military Construction (MILCON) program and how

10
LEED™ is incorporated into facility conceptual planning, programming, design,
construction, and start-up. Chapter 3 focuses on the methodology used to gather and
analyze the construction costs of LEED™ and SPiRiT certified facilities. Chapter 4
catalogues and presents the results. Chapter 5 presents conclusions for making a business
case for sustainable design and make recommendations for future research.

11
II. Background
As highlighted in Chapter 1, the Federal Government has taken steps to commit to
the sustainability of the environment. This chapter details those steps by reviewing the
various sustainability laws, policies, and regulations mandated by the Federal
Government. The industry standard Leadership in Energy and Environmental Design
(LEED™) sustainable design assessment tools were used to convey the effort and
commitment required to incorporate sustainable design into construction. The Federal
Government construction processes, from requirements generation to final construction
and daily operation, were described to show how sustainable design should be
incorporated in each phase. Finally, this chapter addressed the hurdles confronted in
sustainable design implementation.
2.1 Presidential and Congressional Mandates for Sustainable Design
There is considerable history of Federal Government support for the ideals of
sustainable design. Following is a chronological listing and explanation of the various
Federal Laws, Executive Orders, and Executive Memoranda which show this support:
National Environmental Policy Act of 1969. The purposes of this Act are: “to declare a national policy which will encourage productive and enjoyable harmony between man and his environment; to promote efforts which will prevent or eliminate damage to the environment and biosphere and stimulate the health and welfare of man; to enrich the understanding of the ecological systems and natural resources important to the Nation; and to establish a Council on Environmental Quality” (United States Congress, 1969: Sec. 2, 42 USC 4321). Energy Policy and Conservation Act (EPCA) of 1975. EPCA was the first significant piece of legislation to address energy management in the Federal Government. The Act required the development of a 10-year comprehensive energy management plan (Wilson, 2001).

12
Resource Conservation and Recovery Act (RCRA) of 1976. RCRA mandated the Federal government to promote natural resource recycling and conservation (DoE, 1998). National Energy Conservation Policy Act (NECPA) of 1978. NECPA required the Federal Government to use life-cycle cost analysis as the basis for its energy procurement policy. The Act also established energy efficiency requirements when retrofitting Federal facilities (Daschle, 1996). Comprehensive Omnibus Budget Reconciliation Act (COBRA) of 1985. COBRA was a revolutionary one-year trial funding bill for Federal agencies to acquire private financing and implementation of energy savings projects through shared energy savings (SES) contracts. The Federal agency would get, often much needed, energy upgrades and the private financier would retain a portion of the energy savings (National Park Service, 1999). Federal Energy Management Improvement Act (FEMIA) of 1988. FEMIA was an amendment to the National Energy Conservation Policy Act of 1978. The Act mandated Federal facilities to reduce energy consumption by 10% on a per-square-foot basis by 1995, with FY 1985 as the base year (Steensma, 2002). Pollution Prevention Act of 1990. This Act declared “the national policy of the United States that pollution should be prevented or reduced at the source whenever feasible; pollution that cannot be prevented should be recycled in an environmentally safe manner, whenever feasible; pollution that cannot be prevented or recycled should be treated in an environmentally safe manner whenever feasible; and disposal or other release into the environment should be employed only as a last resort and should be conducted in an environmentally safe manner” (United States Congress, 1990:sec 13101b). Executive Order 12759, “Federal Energy Management” 17 Apr 91 (Superseded by Executive Order 12902). This Executive Order (EO) mandated all Federal Agencies to reduce facility energy consumption below the 1985 baseline level by 20% on a per-square-foot basis by the year 2000 (Clinton, 1991). Energy Policy Act (EPACT) of 1992. EPACT once again amended the National Energy Conservation Policy Act of 1978. Nearly the same as Executive Order 12759, this Act mandated federal facilities to reduce energy consumption by 20% on a per-square-foot basis by the year 2000, with 1985 as the base year. This mandate now had the additional backing and oversight of Congress. EPACT also promoted energy efficiency and use of renewable energy technologies. Additionally, the Act emphasized the use of Energy Savings Performance Contracts to replace aging energy infrastructure and improve energy consumption (Wilson, 2001).

13
Executive Order 12843, “Procurement Requirements and Policies for Federal Agencies for Ozone-Depleting Substances,” 21 Apr 93 (Superseded by Executive Order 13148). President Clinton mandated that Federal Agencies minimize and eventually eliminate procurement of ozone depleting materials and substances where economically practical. The Executive Order also emphasized reducing emissions and recycling existing supplies of ozone-depleting substances (Clinton, 1993a). Executive Order 12856, “Federal Compliance with Right-to-Know Laws and Pollution Prevention Requirements,” 4 Aug 93 (Superseded by Executive Order 13148). Executive Order 12856 required each Federal Agency to develop a pollution prevention policy detailing its plans to comply with the reduction and recycling goals of the Pollution Prevention Act of 1990. The Executive Order also called on Federal Agencies to reduce to the maximum extent practicable, any toxic chemicals and materials entering the environment or wastestream (Clinton, 1993c). Executive Order 12873, “Federal Acquisition, Recycling, and Waste Prevention,” 20 Oct 93 (Superseded by Executive Order 13101). Executive Order 12873 made reference to the Federal Government’s vast and influential purchasing power. It made mandatory that all future acquisitions incorporate environmental considerations into the decision making process. Elimination of virgin material requirements, waste prevention, product reuse, and recycling were strongly encouraged (Clinton, 1993d). Executive Order 12902, “Energy Efficiency and Water Conservation at Federal Facilities,” 8 Mar 94 (Superseded by Executive Order 13123). This order raised the energy conservation bar even higher than Executive Order 12759. Federal Agencies were required to reduce energy consumption of typical Federal facilities by 30% per square foot by 2005 using 1985 as the base-level. Industrial facilities were required to reduce energy consumption by 20% by 2005, but use 1990 as the base-level. This executive order continued to stress the need to minimize use of petroleum-based fuels and maximize the use of solar and other alternative energy technologies. All Federal facilities were supposed to undergo an energy efficiency and water conservation audit within 10 years. Each Federal Agency was to choose one facility as its showcase facility to highlight energy and water efficiency and the viability of alternative technologies. Innovative financing and contractual mechanisms were encouraged to meet the demands of this order (Clinton, 1994). Executive Memorandum, “Environmentally and Economically Beneficial Practices on Federal Landscaped Grounds,” 26 Apr 94. This Executive Memorandum required Federally landscaped grounds to use native plants and landscaping where cost-effective and practical. It also urged construction practices which minimize adverse effects on natural habitat. The President’s

14
memorandum also encouraged the minimal use of fertilizers and pesticides. Minimization of water runoff and other such water-efficient practices were also championed (Wilson, 2001). Executive Order 13101, “Greening the Government Through Waste Prevention, Recycling, and Federal Acquisition,” 14 Sep 98. This Executive Order begins with restating the goals of the Pollution Prevention Act of 1990. Pollution should be prevented if at all possible. If pollution can’t be prevented, recovery and recycling of materials should be a top priority. As a last resort, disposal should be done in an environmentally safe manner. A 35% recycling goal by 2005 was established for the Federal Government. To further address pollution reduction goals, the Federal Government was directed to make pollution prevention a factor in all procurement decisions (Clinton, 1998). Executive Order 13123, “Greening the Government Through Energy-Efficient Management,” 3 Jun 99. Executive Order 13123, further raised the energy consumption reduction goals set by Executive Orders 12759 and 12902. The same 30% per square foot by 2005 reduction goal was restated for typical Federal facilities, but added was a 35% per square foot energy reduction goal by 2010. In both cases, 1985 would remain the baseline. Energy reduction goals for laboratories and industrial facilities faced a similar increase. Added to the 20% reduction by 2005 was a 25% reduction by 2010. The 1990 baseline continued for both reductions. A 30% reduction of greenhouse gas emissions attributed to facility energy use by 2010 compared to 1990 levels was also added. Renewable energy continued to be stressed. Under this Executive Order, the Federal Government was directed to install 2,000 solar energy systems by the year 2000 and 20,000 solar energy systems by 2010. Federal Agencies were directed to purchase EPA and Department of Energy certified Energy Star products. Water conservation was also emphasized. This Executive Order was the first to specifically mention sustainable building design. It directed DoD and GSA, in consultation with DOE and EPA, to develop sustainable building design principles. All Federal Agencies were directed to apply these principles in the planning, siting, design, and construction of new facilities. Throughout the Executive Order, life-cycle cost analysis was stressed as the means of procurement decision making. Initial costs were not intended to be the determining factor. Sec. 505 of the order states “within 180 days of this order, the Administrator of GSA, in collaboration with the Secretary of Defense, the Secretary of Energy, and other agency heads, shall develop and issue guidance to assist agencies in ensuring that all project cost estimates, bids, and agency budget requests for design, construction, and renovation of facilities are based on life-cycle costs. Incentives for contractors involved in facility design and construction must be structured to encourage the contractors to design and build at the lowest life-cycle cost” (Clinton, 1999b). Executive Order 13148, “Greening the Government Through Leadership in Environmental Management,” 21 Apr 00. This Executive Order stressed

15
environmental management. All Federal facilities are required to implement environmental management systems by December 2005 to ensure that each organization’s operations, planning, and management decisions are integrated with environmental priorities. Executive Order 13148 also directed the phase out of Class I ozone-depleting substance by 2010. Emphasis in this order was also placed on pollution prevention and sound landscaping techniques (Clinton, 2000). National Defense Authorization Act for FY 2002, S. 1438, 28 Dec 01. This Act passed by Congress is a reiteration of Executive Order 13123. The 2005 and 2010 energy consumption goals for laboratory and other facilities remained untouched. The Secretary of Defense is required to report annually to Congress on the progress made toward achieving the energy reduction goals. President Bush’s signature on this Act not only meant the new administration supported the energy reduction goals, but it also showed that Congress fully intended to back Clinton’s Executive Order 13123 (Bush, 2001). Title 10 Code of Federal Regulations, Part 435, “Energy Conservation Voluntary Performance Standards for New Buildings; Mandatory for Federal Buildings”. CFR Part 435 specifies mandatory national energy code performance standards for new Federal facilities (Daschle, 1996). Title 10 Code of Federal Regulation, Part 436, “Energy Measures and Energy Audits”. CFR Part 436 specifies the analysis requirements, procedures and rules to be used for life-cycle costing by Federal Agencies (Federal Facilities Council, 2001). Federal Acquisition Regulation (FAR) subpart 23.2, Dec 2001. The FAR was revised to require acquisition of energy-efficient products when they are life-cycle cost effective and available (Howard, 2002). Office of Management and Budget (OMB) Circular A-11, Part 2, Section 55, 27 Jun 2002. This circular provided budget guidance to Federal Agencies. Section 55 encouraged Federal Agencies to incorporate Energy Star or LEED™ building standards into initial design concepts for new construction and/or building renovations (Daniels, 2002).
2.2 Federal Energy Reduction Progress
Some Federal Agencies have been successful conserving energy. The figures
below show how well the individual Federal Agencies are doing toward meeting energy
reduction goals.

16
Figure 1 is a summary of the entire Federal Government’s progress toward
meeting the various energy reduction mandates. The figure illustrates the Federal
Government has been able to meet or exceed all previous energy reduction goals.
However, the recent trend appears to be leveling off. At this current trend, the Federal
Government will not meet the energy reduction goals of 2005 and 2010.
Figure 1 Progress Toward Federal Facility Energy Reduction Goals
(Source: Howard, December 2002:18)
Figure 2 summarizes how each individual Federal Agency is progressing toward
energy reduction goals for standard buildings. Some agencies are progressing much
better than others. Figures 1 and 2 show, as of the end of 2001, the DoD (23.6%) is only
slightly ahead of the Federal average in energy reduction (23.0%).
%
a. 3
145,000
140,000
135,000
130,000
125,000
120,000
115,000
110,000
105,000
100,000
ys.ooo 90.000
^5.000
10%Ooal-1395'MECP^
"20%Ooal-2000(ePACTJ
230% ReducJioriH 2001 (Preliirinery Data)
30% Goal - 2005 (EO 12902)
3S«0ofll-?CM0
S5 S7 S3 91 3: 35 97 39 01
FISCAL YEAR
03 05 07 03

17
Figure 2 Individual Federal Agency Progress Toward Energy Reduction
Goals for Standard Buildings (Source: Howard, December 2002:20)
2.3 Federal Government Implementation of Sustainable Design
The Federal Laws, Executive Orders, and Executive Memoranda listed in Section
2.1, clearly convey the sustainable development agenda in place over the past few
decades. Executive Orders 13101, 13123, and 13148 are typically regarded as the most
current Federal Government mandates and justification for sustainable design. Each
Federal Agency has developed their own sustainable design policy using these three
Executive Orders as the foundation. Not surprisingly, each policy is slightly different in
its implementation. Despite their implementation differences, the USGBC’s LEED™
35% Goal – 2010 (EO 13123)
30% Goal – 2005 (EO 12902)
-n eit^
DOE J ■
DOJ 1 |»5H ■
i 1
i
DOC 1— i TV* ^7 9^
■
IP4 ' DOT ■ i_:. ■
DOD 1 ^^^<h«. ■
CSA
WSA
UVS
HHS
VH
TRSY
DOL
HUD
ST I iJii
] IJJS
13 (114
Jn.1%
^ 1 \ i 1 \ ^—
-15% -10% -5% 0% 5% 10^ 15% 20% ?5% ^0% ^5^
FV2001 Blu/SquareFoolReductmnriomFY 1985 (PreUmind[y Data)
*35%
40% 45%

18
criteria have been chosen by nearly all Federal Agencies as the measuring device to
ensure compliance with sustainable design mandates and as a green building design tool.
The Department of Defense, as one of the nation’s largest employers and biggest
polluters, has long understood its obligation to protect the environment. Sustainable
Design is one way it has acted to promote environmental stewardship. In 1994, the
Secretary of Defense made the following statement regarding sustainability:
The Department of Defense must improve its environmental performance by actively implementing policies that embrace pollution prevention in all phases of the acquisition process, the procurement of goods and services and in the life-cycle management of our installations (AFCEE, 1997:3).
In 1999, the Secretary of Defense sponsored a Service-wide study of sustainability and
sustainable planning. The purpose of the study was to give the services a common
understanding of the policies, goals, opportunities, and processes of implementing
sustainable development. The report was formally titled Sustainable Planning: A Multi
Service Assessment 1999 (Lovins, 1999).
After the release of the assessment report, each of the Armed Services
subsequently issued their own sustainable design policy statements. The United States
Air Force’s current policy was issued 19 Dec 2001 by Major General Earnest O. Robbins,
Air Force Civil Engineer (Robbins, 2001). The policy memorandum states:
It is Air Force policy to apply sustainable development concepts in the planning, design, construction, environmental management, operation, maintenance and disposal of facilities and infrastructure projects, consistent with budget and mission requirements (Robbins, 2001:1).
The memorandum went on to declare LEED™ as the Air Force’s preferred self-
assessment metric. General Robbins called on each of the Air Force’s major commands
(MAJCOMs) to select at least 20% of their FY04 construction projects to be LEED™

19
pilot projects. General Robbins’ goal was to incrementally have all construction projects
capable of receiving LEED™ certification by the FY09 construction program (Robbins,
2001, Department of the Air Force, 2003). General Robbins’ memorandum however, left
the decision to acquire actual LEED™ certification by USGBC up to the individual
MAJCOMs. While the merits of LEED™ were noted earlier in the United States Air
Force Environmentally Responsible Facilities Guide, General Robbins’ memorandum
was the first time it was mandated (AFCEE, 1997).
The United States Navy and Marine Corps came to accept sustainable design
similarly to the Air Force. Naval Facilities Engineering Command (NAVFAC) is the
lead organization responsible for all Navy and Marine Corps construction. In June of
1998, Rear Admiral David J. Nash, Commanding Officer of Naval Facilities Engineering
Command (NAVFAC), issued four policy letters emphasizing sustainable design
(NAVFAC, 1998a, b, c, and d). The policy letter can be summarized in the following
excerpt:
It is the policy of the Naval Facilities Engineering Command (NAVFAC) to incorporate sustainability principles and concepts in the design of all facilities and infrastructure projects to the fullest extent possible, consistent with budget constraints and customer requirements. It is further the policy of NAVFAC to seek to do this with no increase in first cost. In the case of larger projects, the application of integrated design concepts is the key to this accomplishment (NAVFAC, 1998a:1).
The Navy did not officially adopt the USGBC’s LEED™ rating system until
mandated by NAVFAC Commander, Rear Admiral Michael R. Johnson, in a
memorandum signed 5 Jul 2002 (Chapman, 2002). The memorandum declared that all
new construction and major renovation projects should be capable of achieving at least a
minimum LEED™ “Certified” rating (NAVFAC, 2002). Like the Air Force, actual
LEED™ certification by USGBC was not required, but suggested for showcase projects.

20
On 9 Jun 2003, Rear Admiral Johnson reiterated the main points of his 5 Jul 2002
LEED™ memorandum and rescinded previous sustainable design Planning and Design
Policy Statements, when he issued NAVFAC Instruction 9830.1 (NAVFAC, 2003a).
NAVFACINST 9830.1 is the current U.S. Navy directive on sustainable design and
maintains the minimum LEED™ “Certified” rating requirement. NAVFACTINST
11010.45, released May 2003, provides additional sustainable design planning assistance.
The United States Army expressed its desire to incorporate sustainability in its
construction practice by issuing the Sustainable Design and Development memorandum
on 26 April 2000 (Johnson, 2000). This memorandum, written by Paul W. Johnson,
Deputy Assistant Secretary of the Army, carried nearly the same message as the Air
Force’s and Navy’s earlier releases sustainable design policies. It stated, Army personnel
“will ensure Sustainable Design and Development is considered in Army installation
planning decisions and infrastructure projects to the fullest extent possible, balanced with
funding constraints and customer requirements” (Johnson, 2000:1). The memorandum
also directed the United States Army Corps of Engineers to provide technical guidance.
The United States Army Corps of Engineers (USACE) issued its design guidance
on 1 May 2001 (Beranek, 2001). This document differed from the design guidance
released by the other Armed Services in that it introduced and described the Sustainable
Project Rating Tool (SPiRiT). SPiRiT, a self-assessment tool, was developed jointly by
the United States Army and the United States Green Building Council (USGBC) and
closely resembles USGBC’s LEED™ version 2.0 rating system. The Army decided it
needed to supplement LEED™ 2.0 with criteria more adequately capturing the unique
issues faced by military facilities and construction (Goradia and Schneider, 2002).

21
SPiRiT is rated on a Bronze, Silver, Gold, and Platinum scale of increasing sustainability.
A more detailed comparison of the LEED™ and SPiRiT project rating systems will be
provided later in this chapter.
Immediately following the release of SPiRiT, Major General R.L. Van Antwerp,
Assistant Chief of Staff for Installation Management, issued a 4 May 2001 policy
mandating all future Army construction projects utilize SPiRiT and attain a minimum
Bronze rating (Van Antwerp, 2001). The memorandum went on to claim that most
projects could achieve the SPiRiT Bronze rating without an increase in first cost.
On 21 Dec 02, after recognizing the great strides made and experience gained in
sustainable design, the Army raised its SPiRiT requirements. In a memorandum signed
by Major General Larry J. Lust, Assistant Chief of Staff for Installation Management, all
MILCON projects beginning in FY06 would be required to meet the SPiRiT Silver rating
level (Lust, 2002). It only took three months for the standard to be raised again. On 11
Apr 03, Mario P. Fiori, the Assistant Secretary of the Army for Installations and
Environment directed all projects not already designed to meet SPiRiT Gold level rating
beginning in FY06 (Fiori, 2003).
In order to comply with Presidential and Congressional guidance, nearly every
Federal Government Agency has adopted USGBC’s LEED™ rating system as part of
their sustainability policy. At the end of 2003, nearly 90 Federal Government
construction projects were undergoing the LEED™ certification process (Howard,
2003a).
The Armed Forces are not the only Federal Agencies trying to implement
LEED™. The U.S. General Services Administration (GSA) is often called the civilian

22
Federal Government’s landlord. Its inventory includes over 330 million square feet of
office space for approximately a million Federal employees (PBS, 2003). GSA maintains
multiple contracts for architecture, engineering, and construction management services
and therefore is typically used to manage non-Department of Defense construction
projects. Beginning in FY 2003, all new GSA buildings must meet the LEED™
“Certified” level of sustainability. The U.S Department of the Interior National Park
Service uses LEED™ as a self-assessment tool (Howard, 2003a). The Environmental
Protection Agency (EPA) and National Aeronautics and Space Administration (NASA)
have both ambitiously declared that all of their new building construction will achieve the
LEED™ Silver rating by 2005 (Howard, 2003a, Winn, 2002). The U.S. Department of
Health and Human Services (HHS) registered three new construction projects with
USGBC in FY 2002 with the intent of receiving LEED™ certification (Howard, 2003a).
The U.S. Department of State has mandated a minimum LEED™ “Certified” rating for
all its new construction (Howard, 2003a). The U.S. Department of Energy already
utilized LEED™ in a few of its construction projects and continues to be a leader in
promoting sustainable design (Howard, 2003a). There is little doubt the acceptance of
the LEED™ rating tool is expanding.
2.4 Leadership in Energy and Environmental Design Rating System
There are many facility performance standards and rating tools in existence today.
A list of just a few being used around the world today includes Green Star®; National
Australian Built Environment Rating System (NABERS); Building Sustainability Index
(BASIX); The Energy and Resources Institute (TERI) Green Building Rating System

23
(TGBRS); Australian Building Greenhouse Rating Scheme (ABGR); Green Building
Assessment Scheme (GBRS™); Building Research Establishment Environmental
Assessment Method (BREEAM™); Canadian Green Leaf Eco-Rating Program; United
Kingdom Building Environmental Performance Assessment Criteria (BEPAC); Hong
Kong Building Environmental Assessment Method (HK-BEAM); Green Globes; and
Green Building Assessment Tool (GBTool™); and Energy Star®. The sheer number of
these international rating tools demonstrates the global interest and support sustainable
design is receiving. However, few rating systems are as comprehensive, and none have
the industry acceptance and momentum nationally as well as internationally, as the
LEED™ rating system. For example, the EPA’s well known Energy Star® program,
while being a commendable rating system, only covers energy-related issues. LEED™
has broader goals and scope. It focuses not only minimizing energy consumption, but
also maximizing the potential of the construction site; minimizing resource consumption;
protecting and conserving water; utilizing environmentally preferable products and
materials; enhancing the indoor environmental quality; and optimizing facility operations
and maintenance. There are some valid criticisms of LEED™, which will be discussed
later, but most are envisioned to be eliminated in future updates. No other rating system
incorporates as many of the sustainability goals as the LEED™ rating system.
As mentioned in Chapter 1, development of a performance-based rating system
began in 1995 by the U.S. Green Building Council in partnership with the building
industry, product manufacturers, building owners, architects, engineers, environmental
groups, utilities, federal and local governments, research institutes, professional societies,
and universities (USGBC, 2003a). The rating system they developed, Leadership in

24
Energy and Environmental Design (LEED™) version 1.0, was released as a pilot
program in December 1998. Over 60 projects entered the program, but only 18
eventually received LEED™ certification (USGBC, 1999). A total of 22 of the available
44 points were required for certification under LEED™ 1.0 (USGBC, 1999). Work on
the next version of LEED™ began in 1999.
LEED™ version 2.0 was released in March 2000 which incorporated much of the
feedback from the pilot study along with additional research into sustainability
implementation options and standards. There are 69 points possible in LEED™ 2.0 and
26 points are required for the minimum certification (USGBC, 2003a). This means less
than 40% of the available points are required for minimum certification. Four levels of
LEED™ certification are possible, which correlate to increasing levels of sustainability
achieved in the project (Table 1):
Table 1 LEED™ Certification Levels LEED™ Certified 26 - 32 points LEED™ Silver 33 - 38 points LEED™ Gold 39 – 51 points LEED™ Platinum 52 + points
*69 points possible
LEED™ 2.1 was released November 2002, but is only an administrative update.
The only changes were technical clarifications and streamlining of documentation
requirements for LEED™ certification (USGBC, 2002b). There are nearly 800 projects
currently registered for potential certification with over 50 projects already receiving

25
LEED™ 2.0/1 certification (USGBC, 2003a). LEED™ version 3.0 is not due to be
released until after 2005.
LEED™ 2.1 evaluates building performance in six categories: Sustainable Sites,
Water Efficiency, Energy and Atmosphere, Materials and Resources, Indoor
Environmental Quality, and Innovation and Design Processes. Points/credits are awarded
in each category and totaled to give the building’s final rating. It should be noted that not
all the points are applicable to every construction project. Four categories have
prerequisites for qualification in any certification level. A checklist of all the available
points/credits and prerequisites is included in Appendix A (USGBC, 2003b). The credits
are meant to strike a fair balance between established construction practices and
emerging technologies and concepts. Each credit is intended to be measurable,
documentable, and verifiable. There are many additional sources of detailed information
on the LEED™ categories including USGBC’s own website (www.usgbc.org).
2.5 Sustainable Project Rating Tool (SPiRiT)
The U.S. Army’s Sustainable Project Rating Tool (SPiRiT) was released and
mandated in May 2001. The Army developed SPiRiT with the support of the United
States Green Building Council (USGBC); therefore, not surprisingly, SPiRiT closely
resembles USGBC’s LEED™ 2.0. As previously mentioned, the Army decided it needed
criteria more adequately capturing the issues faced by military facilities and construction
(Goradia and Schneider, 2002).
The Army believed LEED™ did not take into account its unique military mission,
neglecting issues such as force protection (ATHENA, 2002). Additionally, the Army

26
was concerned LEED™ did not provide enough credit for functionality and personnel
convenience in the workplace. The Army’s desire to have facilities designed for easy
adaptability to future mission changes was also not awarded in LEED™ (Uyeno, 2002).
Although LEED™ was in its infancy stage when SPiRiT was developed, the Army did
not foresee LEED™’s market recognition and acceptance it enjoys today. Finally, the
Army wanted a rating system without the need or additional expense of outside
certification. They likely didn’t anticipate the many commercial construction projects
today which use LEED™ as a design tool only and don’t undergo the actual outside
certification process (ATHENA, 2002).
The current iteration of the Army’s sustainable design tool, SPiRiT version 1.4.1,
is organized into eight sections (USACE, 2002). It retains all of LEED™ 2.0’s six
sections except the Innovation and Design section which it substitutes with the following
three sections: Facility Delivery Process, Current Mission, and Future Mission. With the
exception of one credit, all three new sections are entirely subjective. The five SPiRiT
sections, which are common to both LEED™ and SPiRiT, have numerous terminology
changes and incorporate military standards and regulations. A U.S. Army Corps of
Engineers created checklist of the various SPiRiT sections and credits is provided in
Appendix B. The SPiRiT scoring system is based on 100 possible points, compared to
LEED™’s 69. A comparison is provided below (Table 2):

27
Table 2 LEED™ vs SPiRiT Point System Comparison LEED™ 2.0 SPiRiT 1.4.1 Sustainable Sites 14 pts Sustainable Sites 20 pts Water Efficiency 5 pts Water Efficiency 5 pts Energy and Atmosphere 17 pts Energy and Atmosphere 28 pts Materials and Resources 13 pts Materials and Resources 13 pts Indoor Environmental Quality 15 pts Indoor Environmental Quality 17 pts Innovation and Design 5 pts Facility Delivery Process 7 pts Total: 69 pts Current Mission 6 pts Future Missions 4 pts Total: 100 pts Similar again to LEED™, is SPiRiT’s four tier rating scale; Bronze, Silver, Gold,
and Platinum. There is a natural tendency to compare the two rating scales since the
rating systems are similar and the rating scales are identical. Because of the differences
in percentage points between similar ratings, some can argue they shouldn’t be compared
since it appears easier to attain comparable SPiRiT ratings (Table 3). Table 3 shows even
with the additional 31 points available for SPiRiT, it takes the same 25/26 points to
achieve the lowest ratings. This inequality is only a minor source of contention since the
Army requires a minimum of a SPiRiT Gold rating for all its new facilities by 2005,
while other Federal Agencies are only mandating up to the LEED™ Silver rating. The
final outcomes will be a comparable level of sustainability. This issue will dissipate in a
few years since the Army has already stated it will adopt the new LEED™ 3.0 standard
once it is released in late 2005 or 2006. The Army is working with USGBC to eliminate
what it feels are weaknesses in LEED™ 2.1 in the upcoming LEED™ 3.0.
28
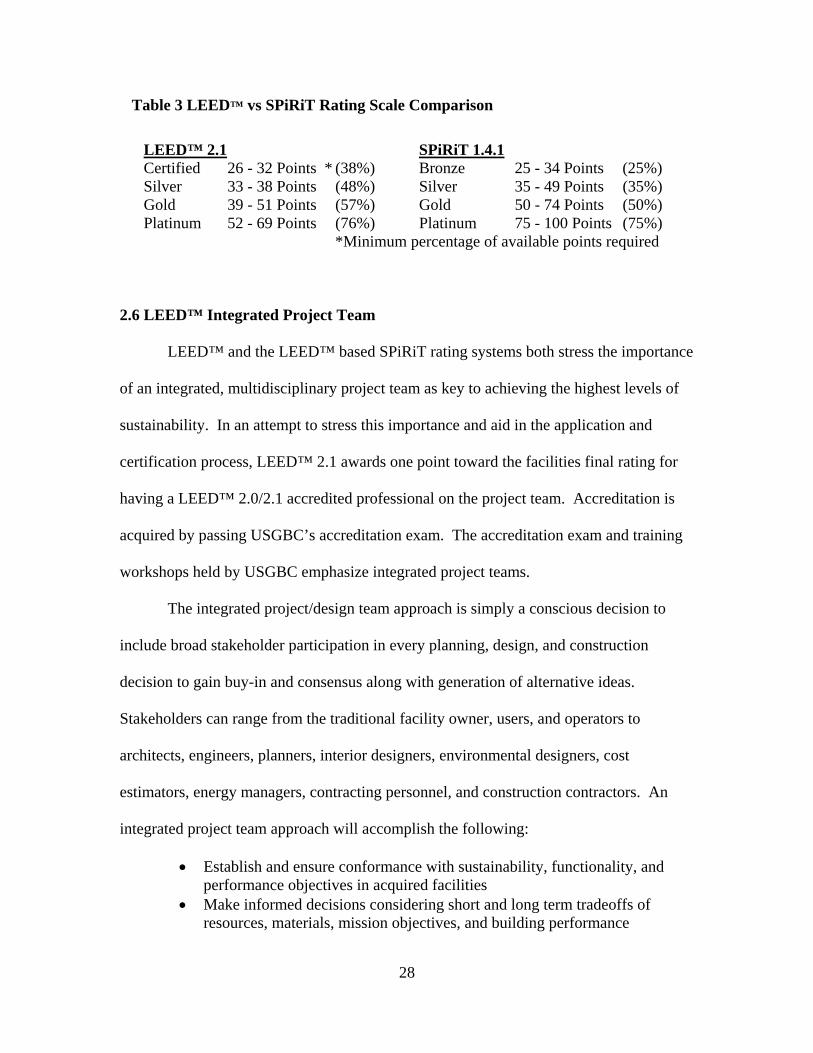
Table 3 LEED™ vs SPiRiT Rating Scale Comparison LEED™ 2.1 SPiRiT 1.4.1 Certified 26 - 32 Points * (38%) Bronze 25 - 34 Points (25%) Silver 33 - 38 Points (48%) Silver 35 - 49 Points (35%) Gold 39 - 51 Points (57%) Gold 50 - 74 Points (50%) Platinum 52 - 69 Points (76%) Platinum 75 - 100 Points (75%) *Minimum percentage of available points required
2.6 LEED™ Integrated Project Team
LEED™ and the LEED™ based SPiRiT rating systems both stress the importance
of an integrated, multidisciplinary project team as key to achieving the highest levels of
sustainability. In an attempt to stress this importance and aid in the application and
certification process, LEED™ 2.1 awards one point toward the facilities final rating for
having a LEED™ 2.0/2.1 accredited professional on the project team. Accreditation is
acquired by passing USGBC’s accreditation exam. The accreditation exam and training
workshops held by USGBC emphasize integrated project teams.
The integrated project/design team approach is simply a conscious decision to
include broad stakeholder participation in every planning, design, and construction
decision to gain buy-in and consensus along with generation of alternative ideas.
Stakeholders can range from the traditional facility owner, users, and operators to
architects, engineers, planners, interior designers, environmental designers, cost
estimators, energy managers, contracting personnel, and construction contractors. An
integrated project team approach will accomplish the following:
• Establish and ensure conformance with sustainability, functionality, and performance objectives in acquired facilities
• Make informed decisions considering short and long term tradeoffs of resources, materials, mission objectives, and building performance
29
• Ensure contract documents reflect design, construction, and performance objectives
• Create an understanding of how material and systems selections considered in the conceptual planning and design phases will affect first costs and life-cycle costs, operations and maintenance practices, and the ultimate performance of a facility over its lifetime (Federal Facilities Guide, 2001:25)
2.7 Sustainable Design Construction Costs
Historically, building “green” was 5-15% more expensive industry-wide than
conventional construction (Berman, 2001, Muto, 2003). However, the U.S. Department
of Energy and most other Federal Agencies believe the majority of “green” buildings
today can be constructed at nearly the same cost as conventional buildings (DoE, 2003).
A recent independent study of 33 LEED™ green buildings nationwide determined the
premium for “green” buildings was 0-2% (Katz, 2003). The primary reason for this shift
is the ever increasing number of developers, designers, and contractors gaining
experience and familiarity with green-building techniques and materials (Katz, 2003).
Integrated design is the technique credited with much of green-building’s success.
The project team no longer works in isolation, but instead capitalizes on the
synergy of the entire team to come up with the design of individual building components
and systems which take into consideration all the other components and systems. A
design example might be the simple addition of daylighting by the architect. Because of
the additional lighting, the electrical engineers should require less electrical lighting. The
reduction in electrical lighting will likely cause less heat load within the facility;
therefore, reducing the size of the mechanical cooling system. Each one of these
reductions saves money in materials and labor. The design example is a fairly simple
example, but without an integrated design team, would likely not be addressed. In the

30
past, each design discipline worked individually on their section of the design without
regard for decisions made by other disciplines. The historical result, when sustainable
features were attempted in isolation, was overdesigned buildings with systems that didn’t
work properly or required a significant number of costly construction changes.
Manufacturers are also working harder to create and promote more cost effective
environmentally friendly products. Not only are capital costs dropping for basic
environmentally friendly products, but manufacturers have become more successful
promoting and selling higher-performance products and alternative technologies with
promises of even greater life-cycle savings.
2.8 Life-Cycle Costs of Sustainable Design
It is generally agreed as the level of sustainability increases past basic levels, the
initial cost of facility projects will also increase. However, these same studies indicate
that life-cycle costs should also dramatically decrease (Katz, 2003). The life-cycle cost
of a facility is simply the total cost of owning a facility. This includes initial acquisition
costs, utilities costs, operations and maintenance costs, repair costs, disposal costs, and
salvage value. Employee costs are also occasionally included in the list of life-cycle
costs. The initial cost of a facility accounts for just 5 to 10 percent of the total cost of a
facility throughout its service lifetime; while the operations and maintenance costs are
typically 60 to 80 percent (DoE, 2003). “Minimal increases in upfront costs of 0-2% to
support green design will result in life-cycle savings of 20% of total construction costs --
more than ten times the initial investment” (Katz, 2003:ii). Since the Department of
Defense spends approximately $3-4 billion each year in new construction, there is a
31
definite potential to significantly reduce life-cycle costs for the future (DefenseLINK
2000, DefenseLINK, 2002, DefenseLINK, 2003).
There is little argument LEED™ certified facilities cut utilities consumption.
Savings in energy costs range from 20 to 50 percent over conventional construction
(DoE, 2003). Water-saving devices typically save enough in water consumption and
disposal costs to pay for themselves within a few years.
Another benefit of sustainable design, which is typically difficult to quantify, is
the effect the facility has on the employees. Employees typically cost 200 times the
construction costs and 40 times the facility’s operating costs over the life of a facility
(Yates, 2001). Several case studies indicate sustainable design can boost employee
productivity by 6 to 26 percent and lower employee turnover rates significantly (DoE,
2003, USGBC, 2003c). While the exact cause of the productivity boost isn’t known, it is
theorized to be primarily psychologically based on a perceived comfortable and inviting
working environment.
Meanwhile, the U.S. Environmental Protection Agency (EPA) has found indoor
air quality is generally two to five times more contaminated than outdoor air and in some
extreme cases up to 100 times more contaminated (Wilson, 1998). According to a 1990
study by the U.S. Army and the American Medical Association poor indoor air quality
costs the United States 150 million workdays a year (DoE, 2003). A recent study by
Lawrence Berkeley National Laboratory concluded that improved indoor air quality
could reduce health care costs and work losses from communicable respiratory diseases
by 9 to 20 percent (DoE, 2003). The same source indicated allergies and asthma could be
reduced by 18 to 25 percent and non-specific health and discomfort reduced by 20 to 50

32
percent. The benefits of fewer lost workhours, lower health care costs, and increased
productivity are apparent, but improved air quality can also protect against the growing
number of lawsuits being filed by employees for adverse indoor air quality (DoE, 2003).
2.9 Department of Defense Facility Procurement Decisions
The trade-offs between competing sustainable features are often the integrated
project team’s toughest decisions to make. Despite the many Federal directives,
regulations, and mandates listed earlier in this chapter directing Federal Agencies to use
life-cycle cost analysis as the basis for procurement decisions, most sustainable design
decisions are made based on the initial cost of the competing alternatives.
When sustainable design features conflict with a new construction project’s pre-
set initial budget, the design team typically reacts in one of two ways. They may either
choose to eliminate the sustainable design feature or they may decide to reduce the scope
of the project (i.e. interior finishes, total building square footage). Both options should be
avoided. If the sustainable design feature has a relatively short payback period, the
proper procedure should be followed to acquire the additional funding. A reduction in
scope shouldn’t be an option in Federal projects. Scope issues like total building square
footage and interior finishes should already be at the bare minimum for the intended
purpose. If square footage can be reduced, the extra space should never have been
included in the original plans. Participants discovered “gold plating” designs or
unjustifiably padding scope and cost estimates can be found in violation of Congressional
Law. Fortunately, the design standards and regulations developed and employed by most
Federal Agencies go a long way towards avoiding these problems.

33
As black and white as the issue appears, additional funds are rarely requested by
Federal Agencies. Many Federal construction projects have alternatively chosen to
undergo questionable scope changes. There are many possible explanations for this
questionable practice ranging from lack of training, lack of time, process breakdown,
negligence, or deceit. The most prevalent is simply lack of training in many areas of the
project identification and development processes (Howard, 2003a, Pearce and others,
2000).
In any case, there appears to be a conflict with the current Federal facilities
acquisition process. The National Academy of Sciences’ Federal Facilities Council
recognized the problem in the following quote, “a fundamental conflict exists between
federal acquisition policies and the Federal budget process that will limit the benefits of
sustainable development” (Federal Facilities Council, 2001:49).
2.10 Department of Defense Facility Acquisition Process
The Department of Defense, like other Federal Agencies, has a complex and
arduous construction approval and funding process. At this point, it is worthwhile to
examine the DoD’s construction process to see if there are any incompatibilities
w/LEED™ or any other conflicts which might prevent the highest levels of sustainability.
While DoD’s construction process is highlighted here, other Federal Agencies go through
a nearly identical process.
There is no standard process consistently used by each of the Armed Services to
get a facility constructed. There are however, major phases within a facility construction
project’s lifetime which are fairly consistent. All projects typically go through

34
requirements assessment, conceptual planning, programming, budgeting/appropriation,
design, construction, and start-up phases (Federal Facilities Council, 2001). Each phase
is independently critical to the success of a “green” building. Project teams should
evaluate decisions made in each phase based on the “best value” to the government
(Federal Facilities Council, 2001).
The requirements assessment phase is essentially the identification and
assessment of the need for a facility at the local level. The local agency looks at whether
the need for space is justifiable and whether there is space already available to adequately
fill the need. Justifiable means is the space authorized and worth expending capital
funds. Each DoD agency has space authorization standards for its different missions and
functions.
The conceptual planning phase follows the requirements assessment phase. This
second phase is a broad look at how the requirement can best be satisfied. Decisions to
renovate or alter an existing facility or construct new are made. Additionally, the facility
size, type, and location are determined. This is also the critical phase where an initial
cost estimate should be performed. Obviously considerable attention needs paid to this
phase of the project since most are funded based on this rudimentary estimate.
Parametric cost estimating techniques are generally the only options to acquiring this pre-
design cost estimate. Parametric cost estimating methodology, tools, strengths and
weaknesses are discussed in Appendix C. The common complaint about the current cost
estimating tools is they are based on historic, conventional construction costs and do not
reflect the costs of current “green” technologies (Howard, 2003a). While the additional
cost of building “green” is debatable, the discussion should still remain open as a valid
35
concern. If additional funds are believed necessary for the sustainability goals of the
project, they should be documented and included in initial project estimates. This thesis
was intended to resolve some of the cost uncertainties.
The next phase, programming, documents the previous requirements assessment
and conceptual planning phases and sets a proposed timeline and priority on the project.
The purpose of the documentation is for submittal and approval/funding by senior agency
leadership and Congress. The documentation to Congress is summarized in a
Department of Defense (DD) Form 1391, which typically has many supporting tabs.
Congressional approval is required due to the mandated funding limits and oversight
required on the majority of construction projects. The final project scope and estimates
are critical. It is very difficult to go back to Congress a second time and ask for
additional money. Most of the time, the Military Service will be forced by Congress to
take funds from lower priority projects. In either case, it does not reflect favorably on the
installation and Military Service. Unfortunately, this is where the questionable scope
changes can appear.
The budgeting/appropriation phase is simply the approval and funding given to
commence construction. Once again, Congress is the final approval and funding
authority for most projects. Congress and the Office of Management and Budget (OMB)
maintain considerable oversight of approved projects, tracking funding and progress even
after the project’s completion.
The Department of Defense uses two primary methods to accomplish the project;
design-bid-build or design-build. The design-bid-build method is the traditional method
where the design is accomplished and then the construction phase of the project goes out

36
for competitive bid and is awarded to the lowest responsive bidder. The relatively recent
design-build method awards both the design and construction under the same contract.
The award is based on the “best value” for the government, a combination of cost,
previous experience, previous performance, and initial design concept.
The design-build method is rapidly gaining favor because “best value” instead of
“lowest bid” is used as the determining factor. The government can rate contractors on
their level of sustainable design experience or simply on an agreed final level of
sustainability (LEED™ rating) for the project. The risk with a design-build project is the
government has less control over the final outcome of the project. The construction starts
often before the final design documents are even completed. The result is that
government changes are often not made until it’s too late to make simple inexpensive
changes. The design-bid-build method is still the most accepted delivery method within
the Federal Government for facility projects (AFCEE, 2000).
The design phase does not have to be approved by Congress in a traditional
design-bid-build project; however, there is little value in designing a project which will
not be funded for construction. For this reason, most projects are not designed until it can
be assured with a high level of confidence the project will be funded. The design can
either be accomplished with in-house staff, other Military staff, or contracted out to
private-sector architect-engineer (A-E) firms. The current statutory design regulations
found in Title 10 United States Code (USC), Federal Acquisition Regulations (FAR), and
Department of Defense FAR Supplement (DFARS) limit the A-E design fees to 6% of
the estimated construction cost (AFCEE, 2000). Many believe this limit is a major hurdle
when attempting to implement the more in-depth integrated design strategies necessary

37
for sustainable design success (Howard, 2003a). New Federal regulations are needed to
better encourage and support sustainable design efforts.
The construction phase is obviously a key step to the process. It is desirable, but
not always an option, to award the project to a private company with experience
constructing sustainable design facilities. Sustainably designed facilities do not
necessarily require more skill to construct, but there is additional planning, oversight, and
documentation required to accomplish and substantiate the sustainable features of the
project. The construction contractor is responsible for selecting, purchasing, and
installing all the materials for the project. Purchasing environmentally preferable
products can be costly and labor intensive; especially with lack of experience. LEED™
awards credit for such sustainable areas as the quantity of material diverted from
landfills, use of recycled materials, materials purchased locally, environmentally
preferable materials use, rapidly renewable materials use, and the protection of
construction site open space and vegetation. Each area must be properly documented to
receive LEED™ credit. The additional effort often comes at a premium cost. This phase
is accomplished once the owning agency takes acceptance of the facility.
Once the facility is accepted by the owning agency, the start-up phase begins.
This phase is where the owner takes occupancy of the facility and starts to develop and
implement operations and maintenance plans to ensure the facility and its occupants
continue to function sustainably throughout the facility’s expected life.

38
2.11 LEED™ Criticism
The LEED™ rating system does have its critics. Many feel LEED™ standards do
not work well as a nationwide policy and should be more sensitive and flexible to local
conditions and needs (Leibowitz, 2003). This is the primary reason the Army developed
their SPiRiT rating system. Others complain, despite a consensus process in place to
resolve members’ comments and concerns, there is not enough open participation in the
development of the rating system. Part of this concern comes from the fact that trade
associations are not allowed to become members of USGBC, or participate in LEED™’s
development. Yet another concern is with the scientific merit of LEED™ (Howard,
2003a). There are many prerequisites and credits within LEED™ based on national
standards, some of which are believed to be either too inadequate or not credible. A
similar complaint with LEED™ is the credits are inappropriately weighted and
distributed (Howard, 2003a). For example, installing a solar, wind, or geothermal system
to supply at least 5% of the facilities total energy use receives the same one point credit
as installing a bicycle rack and changing/showering facilities or preferred parking for
carpools. It is also possible to perform poorly or irresponsibly in certain rating areas and
still receive LEED™ certification. For instance, neglecting to install drought tolerant
landscaping or any other water saving devices in a desert community would appear to be
a mockery of the rating system, but would not prevent a building from scoring well
elsewhere and receiving LEED™ certification. Finally, many feel that the additional
costs of documenting and acquiring LEED™ certification to be too excessive and
prohibitive for projects on limited budgets.

39
In order for a project to become LEED™ certified it must first be registered
through USGBC. Once the project is near completion, the organization must then pay for
the USGBC certification process. The registration and certification costs vary based on
the projected size of the project and whether the owning organization submitting the
registration is a USGBC member. Total USGBC fees can range from $3,500 for small
projects to over $10,000 for larger projects. While these fees don’t appear overly
excessive, especially for multi-million dollar projects, the additional costs of
documenting, verifying, and specifying sustainable design can be significant (Leibowitz,
2003). According to USGBC, documentation fees can be as low as $10,000 and as much
as $60,000 depending on project size and contractor experience (USGBC, 2002a).
Despite the concerns of the LEED™ rating system, many private businesses and
governmental agencies are choosing it to accomplish their green building goals. Many
hope the relatively few shortcomings of the rating system will be addressed and corrected
in future versions of LEED™.

40
III. Methodology
One of the major criticisms and sources of resistance to the LEED™ rating
system and sustainable design is its perceived additional cost compared to conventional
construction. There is nearly no data collected to defend or refute this perception. The
lack of historic data complicates the Department of Defense justification and approval
process for future sustainable design projects due to the level of cost uncertainty
involved. The primary focus of this thesis is to determine whether a business case can be
made for sustainable design in the Department of Defense by comparing the initial
project costs of sustainable design facilities with conventional design facilities. This
chapter will cover the sources of data, data collection techniques, and data analysis
objectives.
3.1 Data Sources
There have been few comprehensive studies on the actual economic costs and
benefits of sustainable design (Katz, 2003, Pearce and others, 2000). In order to get a
clear picture of the costs and benefits of sustainable design, one must start by gathering
the initial and life-cycle costs of sustainable design construction. This study will
concentrate on the first piece of this puzzle, initial costs. Life-cycle cost data is equally
important, but very little non-theoretical data is available to perform such a study. Only a
handful of sustainable design facilities have been faithfully tracking their operational
costs. Only LEED™ or SPiRiT certified facilities were considered “green” buildings for
this evaluation. Without this limitation, it would have been impossible to validate which

41
facilities incorporate enough sustainable features to be declared sustainable design
facilities.
The programming, design, and construction rules and regulations the Federal
Government must abide by were well documented in the previous two chapters and
places the Federal Government in a uniquely different class than private or local
government construction. It is even possible that construction in the Department of
Defense is so sufficiently different from construction in other Federal Agencies due to its
unique mission, security issues, and bureaucratic requirements that it should be examined
separately. Statistical analysis can determine whether the initial project costs are
significantly different between the DoD and the rest of the Federal Government. This
research gathered initial project cost data from many completed LEED™ and SPiRiT
certified construction projects in the Federal Government.
3.2 Data Collection
Data collection started by gathering a list of Federal Government LEED™ and
SPiRiT certified projects from the U.S. Green Building Council and U.S. Army Corps of
Engineers. Correspondence was made with key personnel from each of these projects by
telephone, electronic mail, or U.S. Postal Service to acquire pertinent information on each
of the projects. Each Federal Government project should have a parametric or similar
type planning estimate it used to acquire Congressional funding. Since there have been
no definitive historical studies on the cost of LEED™ and SPiRiT certified facilities,
these initial parametric planning estimates should be based on conventional construction
practices. The second cost gathered from each project is the final project cost, including

42
initial award and any change-orders. Each project was checked to ensure they have
received or will likely receive LEED™ or SPiRiT certification. No distinction was made
between LEED™ and SPiRiT certifications or the level of rating each project received
because the available sample population is too small to provide statistically meaningful
results.
3.3 Data Analysis
Once the data collection was complete, the difference between the initial planning
estimate and final contract costs was calculated. The cost difference was then utilized to
calculate the percent difference in cost from the initial planning estimate as in the
following formula:
FinalContract Cost( ) InitialPlanningEstimate( )−InitialPlanningEstimate( )
100⋅
For example, if the difference in planning cost and final cost is $10,000 for an originally
$1,000,000 estimated project, the percent increase is 1% from the initial planning
estimate. The argument can be then be made that LEED™ or SPiRiT certification was
1% more expensive than conventional construction.
Once the percent increase calculations were complete, the projects were separated
into one of two categories; Department of Defense projects or Other Federal Agency
(non-DoD) projects. The statistical population mean, median, variance, and standard
deviation for both groups were calculated (McClave, Benson, and Sincich, 2001).
Hypothesis testing was first performed to see if there is a statistical difference
between the mean percentage cost difference of Department of Defense projects and
other Federal Government projects. For this type of test, a claim about the relationship
= Percent Difference in Cost

43
between the two sample means (DoD and other Federal Agencies) must first be made. In
this study, the claim or inference was made that the mean cost of Department of Defense
construction projects is different (likely greater) than the mean percentage cost difference
of other Federal Agencies construction projects. This claim is called the research
hypothesis or alternative hypothesis. There is the possibility that the opposite of the
research hypothesis is true. In other words, the mean percentage cost difference of
Department of Defense construction projects is equal to the mean percentage cost
difference of other Federal Agencies construction projects. This second statement is
termed the null hypothesis.
In hypothesis testing, the null hypothesis is actually tested, not the research
hypothesis. If the null hypothesis can be rejected, then the research hypothesis can claim
to be supported. If the null hypothesis can not be rejected, then the only statement
possible is there is insufficient evidence to support the research hypothesis. With
hypothesis testing, the analyst must choose a level of confidence they desire for the
results. This level of confidence is typically given as a percentage. Once the hypothesis
testing is complete, the researcher can claim their inference is accurate to within a certain
percentage, or in other words, they are a certain percent confident in their stated results.
In this study, 90% was used as the desired confidence level. The observed significance
level (p-value) was also calculated to allow the reader to determine the minimum
confidence level they would be willing to tolerate to reject the null hypothesis.
When making the final claim, there is always the possibility the data led the
analyst to the incorrect conclusion. There are two categories of incorrect conclusions,
Type I and Type II errors. A Type I error is concluding the research/alternate hypothesis

44
is true when in fact it is not. In this study, a 90% confidence level was chosen; therefore,
there is a 10% chance of a Type I error. A Type II error is concluding there is
insufficient evidence to claim the research/alternative hypothesis is true (accepting the
null hypothesis), when in fact the research hypothesis is true. It is possible to determine
the probability of a Type II error once the means from the two data sets are calculated,
but is typically difficult to determine precisely. One way to avoid a potential Type II
error is by not making the conclusion that the null hypothesis is true, instead only
maintain there is insufficient evidence to reject the null hypothesis.
Since there are few LEED™ or SPiRiT projects completed in the Federal
Government, the t-distribution was used as the test statistic. For typical hypothesis
testing, the analyst assumes the data is large enough in quantity to show a central
tendency which is normally distributed around the mean value. When only a smaller data
set is available (typically less than 30) the assumptions and hypothesis testing methods
following from the Central Limit Theorem can’t be used. The small sample must still
originate from a population with a relative frequency distribution assumed to be
approximately normal; however, the t-distribution test is the only test statistic appropriate
to make claims about the entire population. A more in-depth explanation of hypothesis
testing, Type I/II errors, and sample sizes can be read in most statistics textbooks.
After the first hypothesis test was complete, hypothesis testing was performed to
determine if the percent cost differences were statistically significant. This test indicated
whether it is possible to definitively state whether LEED™ or SPiRiT certified
construction projects cost more or less than conventional construction projects. The

45
conclusions from the first hypothesis test determined whether the Other Federal Agency
projects were included with the DoD projects.
In this test, the research hypothesis was the mean percent cost difference is greater
than or less than 0%. The null hypothesis was the mean percent cost difference is equal
to 0%. The same 90% confidence level was used for this test. Since the sample size was
still considered small (less than 30), the t-distribution was used as the test statistic. A p-
value was also calculated for this test to once again allow the reader to make their own
conclusion on the minimum confidence level (maximum alpha) they would allow to
reject the null hypothesis.
According to the Empirical Rule for data with a frequency distribution which is
approximately normal, roughly 68% of the measurements fall within one standard
deviation of the mean. Roughly 95% of the measurements fall within two standard
deviations of the mean and over 99% fall within three standard deviations (McClave,
Benson, and Sincich, 2001). These quick rules of thumb were calculated to give a
general idea of the precision of the sampling mean.
A more accurate calculation of this sampling error was calculated using the
approximately normal sampling distribution. The same assumptions of approximate
normality were used, but the areas below the sampling distribution were used to make the
probability statements about the sampling mean (Anderson, Sweeney, and Williams,
1999). This probability statement is termed the confidence interval and typically stated
for the desired confidence level in two parts: a point estimate (sampling mean) and a plus
and minus value called the margin of error (Anderson, Sweeney, and Williams, 1999).
The 90%, 95%, and 99% confidence levels were calculated and briefly related to the

46
results from the Empirical Rule calculations. The primary reason for these calculations
was to provide additional insight into the precision of the sampling mean and to let the
reader determine whether the sustainable design business case is justifiable (McClave,
Benson, and Sincich, 2001).

47
IV. Results and Analysis
This purpose of this thesis was to quantify the initial cost of utilizing LEED™ or
SPiRiT in Department of Defense’s and other Federal Government Agencies’
construction projects to make a business case for LEED™ or SPiRiT. This chapter
presents the results and analysis of this investigation using the methodology from Chapter
3.
4.1 Data Set Investigation
The first key step of this study was to gather historical data from applicable
Department of Defense (DoD) and other Federal Government Agencies construction
projects. A small sample set of 15 representative projects throughout the Federal
Government was first chosen to assess whether the data needed for this study was
available. Over 50% of the projects evaluated for this first representative sample had the
requisite data. The identification of these construction projects was from various DoD
personnel and websites and the U.S. Green Building’s Council’s (USGBC) LEED
website. Sufficient data for a rigorous statistical analysis seemed possible.
4.2 Expanded Data Collection
After the initial data set investigation, work commenced on gathering the
additional data needed to complete a thorough statistical investigation. Over 120 Federal
facility construction projects were evaluated for applicability. A majority of these
projects were listed on the USGBC’s LEED™ website. A few projects were immediately

48
rejected based on their location outside the United States. There are simply too many
extenuating factors involved in construction outside the United States to factor into this
study. Some other projects were rejected when discovered the decision had been made
not to use LEED™ or SPiRiT as their design and construction guideline. Another source
of immediate exclusion from this study was projects built for the U.S. Federal
Government, but owned by private organizations. The Federal Government simply rents
or leases the space from the private corporation and despite the LEED certification has
very little say regarding design and construction decisions. Additionally, for this type of
project, initial planning estimates were typically unavailable or proprietary. The list of
potential projects was eventually narrowed down to 105.
E-mails were sent out to each of these 105 projects requesting the applicable
estimated and actual project cost data. After background research, e-mails, and phone
calls only 22 projects were selected as appropriate for this study. Responses were
received from another 38 projects which were eventually rejected. Projects were
primarily rejected because they had not completed the construction contract award phase.
A number of these projects had not progressed past the construction award phase because
initial contractor bids were well in excess of estimated and programmed amounts. This
fact was illuminating in itself.
Projects were also rejected after correspondence with project managers revealed
unique construction which would have skewed results. For example, there was a major
renovation occurring at the Pentagon. All materials must enter the Pentagon’s transit
system and be screened for explosives and other weapons of mass destruction. All
construction personnel must also be searched daily and escorted around the project site.

49
Additionally, there have been many force protection features added to the initial design
and estimate of Pentagon project which likely is a more significant cost driver than
sustainable design.
The final reason some projects were eventually excluded from this analysis was
because significant changes in square footage or other scope changes were made after the
initial estimates were performed and the estimates were never revised. Once again, this is
revealing information in itself. The project scopes likely had to be reduced to stay under
Congressionally approved funding amounts. As mentioned in previous chapters, this is a
questionable solution to underfunded projects; however, investigation into the issue is
beyond the bounds and authority of this project.
Even after repeated contact attempts, 45 projects representatives did not respond.
This was disappointing since all applicable information should be a matter of public
record.
4.3 Data Presentation
As outlined in Chapter 3 and shown in Table 4 and Table 5, the primary data
collected was the estimated cost and the actual cost of each project. A few projects were
given on a square foot basis (i.e. Table 4, Project ID #4A), but should yield comparable
results. Information on whether the project execution method was design-bid-build or
design-build was collected, but not used to differentiate projects due to the already
limited availability of data. However, this should not be a major concern since the
method of execution is considered in the original estimate.

50
Table 4 DoD LEED™/SPiRiT Initial Project Cost Data
Department of DefenseProject ID Estimated Cost Actual Cost % Cost Difference
1A $6,959,000 $6,629,015 -4.74%2A $30,510,000 $27,198,716 -10.85%3A $8,513,332 $8,727,497 2.52%4A $157.94/ft2 $167.66/ft2 6.15%5A $188.32/ft2 $190.52/ft2 1.17%6A $11,700,000 $12,750,000 8.97%7A $140/ft2 $166/ft2 18.57%8A $10,785,000 $9,995,000 -7.32%9A $44,175,924 $37,599,126 -14.89%
10A $8,990,000 $8,320,000 -7.45%11A $60,800,000 $60,800,000 0.00%12A $9,956,000 $9,484,109 -4.74%13A $3,250,000 $3,725,516 14.63%
Mean Cost Percentage Difference: 0.15%
Table 5 Other Federal Government Agencies LEED™ Initial Project Cost Data
Other Federal Government AgenciesProject ID Estimated Cost Actual Cost % Cost Difference
1B $36,900,000 $38,000,000 2.98%2B $18,400,000 $18,500,000 0.54%3B $214,000,000 $207,000,000 -3.27%4B $22,000,000 $22,000,000 0.00%5B $17,951,600 $17,954,011 0.01%6B $51,000,000 $50,400,000 -1.18%7B $1,089,000 $1,187,000 9.00%8B $197/ft2 $216/ft2 9.64%9B $2,134,000 $2,609,000 22.26%
Mean Cost Percentage Difference: 4.44%

51
4.4 Data Validation
No judgments were made about the validity of the data supplied, although some
appeared suspect. For example, it is unusual if the reported estimated cost, which
shouldn’t be known by potential bidders, is the same as the final contract amount.
Examples of this can be seen in Tables 4 and 5.
Each Federal Agency has a slightly different vocabulary for the various costs and
phases of a construction project. Conducting personal face to face interviews with the
project manager to identify the individual initial estimates, final costs, and scope of work
more thoroughly to ensure a fair and more accurate comparison is recommended for
future studies. This was the process taken in other recent non-Federal Government
studies; however, personal interviews were not feasible for this study. Additional
explanation and guidance was provided to the contacts, when requested.
The accuracy of the cost data and an objective comparison of the scope of work
are even more important when examining the accuracy of initial planning estimates.
Appendix C explains the limitations of the parametric type estimates used for most
construction estimates. The PACES parametric cost estimating package, in wide use
throughout the Department of Defense, is independently proven to be accurate to within
7.5% (PACES brochure, undated). Other industry standard parametric cost estimating
systems, used extensively in other Federal Government construction projects, are
typically only accurate to within 15%. It seems nearly impossible to make an accurate
comparison of preliminary and final costs with estimate accuracies in the 7.5 – 15%
range. Despite this realization, recent national studies explicitly make these comparisons.

52
Nearly all of the projects in Table 4 and Table 5 fall within the 7.5 – 15% cost
range of their initial estimates. Statistically, when factoring in the error of the cost
estimates, it could be said that there is no cost difference. The only way to get a true
comparison is to perform a detailed line-item cost analysis on the same project; one
designed using LEED™ and the other using conventional design. Since this is would be
a considerable waste of costly Architecture and Engineering firms’ design time, this type
of comparison is never done.
4.5 Statistical Analysis of Results
Despite the initial difficulty in rationalizing the statistical usefulness of the results,
statistical analysis was performed on the collected data to search for any revealing
information. The hypothesis testing outlined in Chapter 3 concluded, at a 90%
confidence level, there was statistically insufficient evidence to reject the null
hypotheses. That was, the mean percentage cost differences between DoD and other
Federal Government construction projects were the same. More directly stated, no
distinction can be claimed between the mean percentage cost difference of DoD and other
Federal Government LEED™/SPiRiT construction projects. The p-value for this test
was 0.30 which indicates there is nearly no evidence to reject the null hypothesis. The
conclusion meant DoD and other Federal Government Agencies construction projects
would be combined for other analysis. Appendix D details the results using MathCAD
Version 2001i (MathCAD, 2001).
The second hypothesis testing, outlined in Chapter 3 and results shown in
Appendix E, examined the entire sampled population against the theory that the mean

53
percentage cost difference was greater (or less) than 0. As previously mentioned, the
entire sampled population was used based on the results from the first hypothesis test.
No distinction was made between DoD and other Federal Agencies. Mathcad Version
2001i was again used to calculate the results (MathCAD, 2001). The results revealed that
at a 90% confidence level, there was statistically insufficient evidence to reject the null
hypotheses that Federal Government LEED™/SPiRiT construction projects cost any
more than conventional construction projects. The observed significance level (p-value)
for this second test was calculated to be 0.31. A p-value of 0.31 indicates there is nearly
no evidence to reject the null hypothesis.
While hypothesis testing concluded no distinction could be made between
LEED™/SPiRiT and conventional construction projects, a calculation of the arithmetic
mean indicated LEED™/SPiRiT added approximately 1.9% to the initial cost of a
project. The standard deviation of the mean is 9.0%. The median cost percent increase
was calculated to be 0.54%. The most thorough analysis of the additional costs of
LEED™ construction was released by Mr Greg Katz in October 2003 (Katz, 2003). Mr
Katz’s analysis indicated LEED™ added 0 - 2% to the upfront cost of a facility
construction project. The mean and median results from this thesis study of Federal
Government facility construction projects draw a similar conclusion.
Recall from Chapter 3 that according to the Empirical Rule for data with a
frequency distribution which is approximately normal, roughly 68% of the measurements
fall within one standard deviation of the mean. Roughly 95% of the measurements fall
within two standard deviations of the mean and over 99% fall within three standard
deviations. It can therefore be relatively assured there is a 68% likelihood the next

54
LEED™/SPiRiT project will be anywhere from -7.1% to 10.9% of the cost of a
conventional construction project. There is a 95% likelihood the LEED™/SPiRiT cost
will be in the -16.1% to 19.9% range and a 99% likelihood it will be in the -25.1% to
28.9% range.
Similar in theory to the Empirical Rule, the confidence interval calculations
determined it is 95% probable that the mean of all future LEED™/SPiRiT projects will
cost somewhere in the interval from -1.8% to 5.6% the cost of a conventionally
construction projects. It is also 99% probable that the percentage cost difference interval
will be from -2.9% to 6.8%. Appendix E displays the MathCAD Version 2001i
calculations (MathCAD, 2001).
The confidence interval is somewhat promising in that the mean cost of future
LEED™ projects is below 7%. However, as the Empirical Rule highlights, there is an
unacceptable probability that the next constructed LEED™ project could cost as high as
29% over conventional projects. The variance of the reported data seems too significant
to make a strong business case supporting the initial costs of LEED™. The life-cycle
costs and benefits will have to continue to be the primary motivation for LEED™ until
data on additional new projects becomes available.
4.6 Potential Cost Drivers
Many respondents offered possible explanations for the cost differences of their
LEED™/SPiRiT project from a conventional construction project. All the explanations
were valid cost drivers, but most were already anticipated due to the research completed
in Chapter 2.

55
The most often stated reason for the additional cost of LEED™ construction was
lack of experience with LEED™. This comment was made by many of those with
interest in the project, from the Government project managers to the private contractors.
However, each firmly believed they had gained enough experience from their completed
project to more successfully identify and manage costs on future LEED™ projects.
One of the common explanations and disappointments felt by many personnel
involved in LEED™ projects was their inability to successfully incorporate sustainable
design into their project from the very inception of the project. They typically
understood the criticality of an integrated project/design team approach from the
beginning, but for various reasons were unable to successfully implement it. A few
respondents pointed out their projects were required to pursue LEED™ certification so
late in the design process that they were simply “bolting on” sustainable design features
to an otherwise conventional facility.
A similar issue expressed by some of those involved in LEED™ projects was that
during the design or even construction phases of their projects, the realization was made
the project would not achieve their LEED™ points goal. One of the pitfalls and common
complaints about LEED™ is it’s possible to simply “buy” LEED™ points by installing
an additional sustainable feature or system onto the facility. Unfortunately, this typically
expensive solution has a low probability of successfully integrating with the rest of the
facility. These “bought” points are for often unproven technology/systems which
eventually become the source of future maintenance problems. Not only does “buying”
points hurt the existing project, but failed attempts with unproven technology/systems can

56
impede the future advancement and utilization of more conservative sustainable design.
Future revisions of LEED™ will attempt to eliminate this possibility.
Participants in a few successful projects understood early on they did not have the
expertise needed for a LEED™ project. These Federal Government organizations sought
out the experience and expertise in the private sector. Typically, LEED™ consultants
were brought in to support the contractor or in-house design team. Some organizations
even went as far as to specifically contract out the design to an experienced LEED™
design firm; writing the design contract specifications to require a certain level of
LEED™ expertise and experience.
Comments gathered from a handful of projects appeared to support design-build
over the design-bid-build method of project execution. The apparent favor for design-
build projects is less likely a statement on the merits of the project execution method and
more likely tied to the experience of the design and construction teams. In the design-
build projects, the Federal Government organization had less input into the details of the
design and had to rely on private industry’s significantly greater experience and
acceptance of LEED™. Either method of project execution should be equally capable of
successfully implement and complete a LEED™ construction project. If needed,
LEED™ consultation and additional services, on top of the statutory limits placed on
architect-engineer design services, can be creatively authorized under Federal Acquisition
Regulations.

57
4.7 Evaluation of LEED™/SPiRiT in the Department of Defense
Through the literature review in Chapter 2 and correspondence with multiple
personnel involved with LEED™ or SPiRiT projects it is readily apparent some Federal
Government Agencies have been more successful at adopting sustainable facility design
than others. The Department of Defense has only been moderately successful. Even
though sustainable facility design principles have been stressed in the Department of
Defense since the middle to late 1990s, there have still been relatively few construction
projects which implement them. There has been no real incentive for the Department of
Defense to implement sustainable facility design. The primary emphasis for most DoD
construction projects continues to be the initial cost of construction. Time is rarely
devoted to evaluating the life-cycle costs and benefits of various construction methods
and features.
Also standing in the way of sustainable design is the fact that facility construction
in the DoD has been positively honed over the past few decades. The planning rules and
standards which were developed over the years have led to countless successful
construction projects. However, sustainable design questions many conventional design
and construction practices. It is difficult for many qualified and experienced personnel in
the Department of Defense to commit to the latest change toward sustainable design. The
fact that there is still only anecdotal and theoretical evidence that sustainable design
works and is cost effective only further clouds the issue. A successful business case for
sustainable design is only starting to be made and accepted.
Over the years, conventional construction design has also standardized and
simplified facility maintenance. Many in leadership and decision making roles refuse to

58
undertake sustainable design because of the risk of highly specialized and costly
maintenance. Once again, only time and education will disprove this concern.

59
V. Conclusions and Recommendations
This chapter provides a brief summary of the research completed, discusses the
results of the research, identifies any limitations, and makes recommendations for further
related research.
5.1 Research Summary
The purpose of the thesis was to provide statistical evidence that a business case
supporting LEED™/SPiRiT, based on the initial cost of construction, could be made in
the Department of Defense. The Department of Defense was one of the first Federal
Agencies to investigate and eventually support LEED™. The DoD was directly involved
in developing the LEED™ rating system from its beginnings. Each of the Military
Services has successfully constructed LEED™/SPiRiT projects. From a cost perspective,
some projects have clearly been more successful than others. Experience seems to be the
largest hurdle not only for the DoD, but also for many of the design and construction
contractors the DoD uses.
5.2 Research Results
This study was premature in its attempt to make a positive business case for
LEED™/SPiRiT and sustainable design using initial construction costs. This study,
however, did provide an accurate assessment of the state of LEED™/SPiRiT designed
facilities in the Department of Defense today. In order to advance sustainable design,
decision makers need some assurance their decisions won’t be costly. The general

60
conclusion was that the majority of LEED™ or SPiRiT designed facility construction
projects have a conservative probability to be anywhere from -1.8% less to 5.6% more
costly than conventionally designed projects. When focusing on this study’s calculated
simple mean and supported by its median, a facility construction project has a good
possibility of being only 1.9% over conventional construction costs. However, the
variance of the data highlighted that there is an unacceptable probability that any single
LEED™ construction project may cost as much as 29% more than a conventional project.
It would be difficult to use this fact to make an irrefutable business case for sustainable
design. As additional construction projects are completed, they will likely reduce the
variance of the mean cost calculated in this study. Once this is accomplished, a more
attractive business case for sustainable design can be made and more people will be
convinced to try LEED™.
5.3 Research Limitations
The lack of Federal Government projects in the construction phase or completed
was a significant limitation to this study. The data that was available provided
statistically acceptable results, but its variance is too large to be useful for the
construction industry. Additional project data would have made the outlier data
insignificant and provided a more accurate estimate of the cost LEED™ adds to a project.
Another possible limitation of this study was the accuracy of the data provided.
Each person who responded believed they were providing the correct data and there is no
reason to distrust their intentions. However, there appears to be a wide range of time and
emphasis placed on the accuracy and thoroughness of planning estimates. It would have

61
been useful to sit down with the Government project managers and perform new detailed
and parametric estimates based on the general characteristics and features of the built
facilities. This is the only way to ensure no significant changes were made from when
the facility was initially envisioned. This would not compromise the comparison since
most LEED™ features would not be a factor at the planning estimate level of detail.
Even if these projects were reestimated, the accuracy of the data would still be an
area of concern. Recall from Appendix C and previous sections that planning estimating
aids such as the PACES software are only accurate to within 7.5%. While PACES is one
of the best planning estimating tools available, 7.5% accuracy is still significant to the
accuracy of this study. Additional completed project data is the only way to minimize the
inaccuracy of the planning estimates.
5.4 Recommendations for Future Research
LEED™ has been adopted by nearly all Federal Government Agencies.
However, it still does not enjoy universal acceptance. There are numerous studies still
needed to successfully make the case for LEED™ and sustainable design.
A few recommendations for future research were addressed in the previous
section. First, this study was valuable at quantifying the current expected initial capital
expenditure required for LEED™ construction today. The construction industry moves
too slowly to expect the results and conclusion of this study to change in the next couple
of years. Therefore, it is not recommended to attempt to expand the database of project
data for at least a couple years.

62
Also mentioned in the previous section, it would be worthwhile for new detailed
and parametric estimates to be accomplished for completed projects and compared to the
actual final costs. Only a representative sample of the projects used in this study would
need to be reestimated in order to validate or refute this study’s methodology and results.
The other portion required in order to make a business case for sustainable design
is a thorough cost-benefit analysis of LEED™. This not only includes performing life-
cycle cost analyses of sustainable design features, but also developing a method to
quantifying the many additional, often intangible, environmental and health benefits of
sustainable design. In order to accomplish an accurate life-cycle cost analyses,
performance data from completed LEED™ facility projects is needed. The primary
hurdle with this type of life-cycle analysis is a majority of completed LEED™ projects
are not spending the additional time and money to capture facility performance data.
Cost-benefit analyses should avoid focusing too much on specific sustainable
design products since most are technology based and change too frequently. Instead,
cost-benefit studies should take a broad look at many sustainable design features and
more importantly focus on the costs and benefits of sustainable design features in sample
LEED™ construction projects. The intent is to highlight proven design guidelines for
programmers, designers, architects, engineers, project managers, and owners to use for
future LEED™ projects.
A final possible area for future research relating to LEED™ and sustainable
design is an evaluation of the resistance to sustainable design. To what degree is there
resistance and what is the source of that resistance? What can be attributed to lack of
experience, lack of training, lack of time, lack of leadership interest, barriers in the
63
Federal Government construction process, or simply the resistance to change? Another
question to answer, is there a more effective way to make the case for sustainable design?
5.5 Conclusions
Sustainable Design has many tangible and intangible benefits. LEED™ is an
effective tool to ensure a significant level of sustainable design is incorporated in a given
construction project. In reality, however, cost is often the driver for most business
decisions. As concluded in this study, sustainable facility design generally costs more
initially than conventional construction. This study determined that on average it costs
2% more. However, it is very difficult to capture all the costs and benefits of a
sustainable design facility and therefore problematic to make a good business case for
sustainable design.
Despite the less than convincing business case made in this study to support
sustainable design with initial cost data, it was continually stressed that there are many
well identified and documented life-cycle savings gained from sustainable design. Many
features of these sustainable design facilities require little capital investment and have
very short payback periods. This combination makes it easy to convince decision makers
to incorporate them into their design. However, only through continued use of LEED™
or other similar design and evaluation tools which stress integrated/holistic project teams
and design, will sustainable design prove successful. This success will be measured not
only in lower costs, but also in the long-term benefits to building occupants and the
environment.

64
Appendix A
LEED™ Project Checklist

65
Version 2.1 Registered Project Checklist
Project NameYes ? No City, State
Sustainable Sites 14 Points
Y Prereq 1 Erosion & Sedimentation Control Required
Credit 1 Site Selection 1
Credit 2 Urban Redevelopment 1
Credit 3 Brownfield Redevelopment 1
Credit 4.1 Alternative Transportation, Public Transportation Access 1
Credit 4.2 Alternative Transportation, Bicycle Storage & Changing Rooms 1
Credit 4.3 Alternative Transportation, Alternative Fuel Vehicles 1
Credit 4.4 Alternative Transportation, Parking Capacity and Carpooling 1
Credit 5.1 Reduced Site Disturbance, Protect or Restore Open Space 1
Credit 5.2 Reduced Site Disturbance, Development Footprint 1
Credit 6.1 Stormwater Management, Rate and Quantity 1
Credit 6.2 Stormwater Management, Treatment 1
Credit 7.1 Landscape & Exterior Design to Reduce Heat Islands, Non-Roof 1
Credit 7.2 Landscape & Exterior Design to Reduce Heat Islands, Roof 1
Credit 8 Light Pollution Reduction 1
Yes ? No
Water Efficiency 5 Points
Credit 1.1 Water Efficient Landscaping, Reduce by 50% 1
Credit 1.2 Water Efficient Landscaping, No Potable Use or No Irrigation 1
Credit 2 Innovative Wastewater Technologies 1
Credit 3.1 Water Use Reduction, 20% Reduction 1
Credit 3.2 Water Use Reduction, 30% Reduction 1
Yes ? No
Energy & Atmosphere 17 Points
Y Prereq 1 Fundamental Building Systems Commissioning Required
Y Prereq 2 Minimum Energy Performance Required
Y Prereq 3 CFC Reduction in HVAC&R Equipment Required
Credit 1 Optimize Energy Performance 1 to 10
Credit 2.1 Renewable Energy, 5% 1
Credit 2.2 Renewable Energy, 10% 1
Credit 2.3 Renewable Energy, 20% 1
Credit 3 Additional Commissioning 1
Credit 4 Ozone Depletion 1
Credit 5 Measurement & Verification 1
Credit 6 Green Power 1

66
Yes ? No
Materials & Resources 13 Points
Y Prereq 1 Storage & Collection of Recyclables Required
Credit 1.1 Building Reuse, Maintain 75% of Existing Shell 1
Credit 1.2 Building Reuse, Maintain 100% of Shell 1
Credit 1.3 Building Reuse, Maintain 100% Shell & 50% Non-Shell 1
Credit 2.1 Construction Waste Management, Divert 50% 1
Credit 2.2 Construction Waste Management, Divert 75% 1
Credit 3.1 Resource Reuse, Specify 5% 1
Credit 3.2 Resource Reuse, Specify 10% 1
Credit 4.1 Recycled Content, Specify 5% (post-consumer + ½ post-industrial) 1
Credit 4.2 Recycled Content, Specify 10% (post-consumer + ½ post-industrial) 1
Credit 5.1 Local/Regional Materials, 20% Manufactured Locally 1
Credit 5.2 Local/Regional Materials, of 20% Above, 50% Harvested Locally 1
Credit 6 Rapidly Renewable Materials 1
Credit 7 Certified Wood 1
Yes ? No
Indoor Environmental Quality 15 Points
Y Prereq 1 Minimum IAQ Performance RequiredY Prereq 2 Environmental Tobacco Smoke (ETS) Control Required
Credit 1 Carbon Dioxide (CO2 ) Monitoring 1Credit 2 Ventilation Effectiveness 1Credit 3.1 Construction IAQ Management Plan, During Construction 1Credit 3.2 Construction IAQ Management Plan, Before Occupancy 1Credit 4.1 Low-Emitting Materials, Adhesives & Sealants 1Credit 4.2 Low-Emitting Materials, Paints 1Credit 4.3 Low-Emitting Materials, Carpet 1Credit 4.4 Low-Emitting Materials, Composite Wood & Agrifiber 1Credit 5 Indoor Chemical & Pollutant Source Control 1Credit 6.1 Controllability of Systems, Perimeter 1Credit 6.2 Controllability of Systems, Non-Perimeter 1Credit 7.1 Thermal Comfort, Comply with ASHRAE 55-1992 1Credit 7.2 Thermal Comfort, Permanent Monitoring System 1Credit 8.1 Daylight & Views, Daylight 75% of Spaces 1Credit 8.2 Daylight & Views, Views for 90% of Spaces 1
Yes ? No
Innovation & Design Process 5 Points
Credit 1.1 Innovation in Design: Provide Specific Title 1
Credit 1.2 Innovation in Design: Provide Specific Title 1
Credit 1.3 Innovation in Design: Provide Specific Title 1
Credit 1.4 Innovation in Design: Provide Specific Title 1
Credit 2 LEED™ Accredited Professional 1
Yes ? No
Project Totals (pre-certification estimates) 69 Points
Certified 26-32 points Silver 33-38 points Gold 39-51 points Platinum 52-69 points

67
Appendix B
SPiRiT Project Checklist

68
Facility Points Summary Maximum
Points
1.0 Sustainable Sites (S) Score 0 Max 20
1.R1 Erosion, Sedimentation and Water Quality Control [Required]1.C1 Site Selection 2 1.C2 Installation/Base Redevelopment 2 1.C3 Brownfield Redevelopment 1 1.C4 Alternative Transportation 4 1.C5 Reduced Site Disturbance 2 1.C6 Stormwater Management 2 1.C7 Landscape and Exterior Design to Reduce Heat Islands 2 1.C8 Light Pollution Reduction 1 1.C9 Optimize Site Features 1 1.C10 Facility Impact 2 1.C11 Site Ecology 1
2.0 Water Efficiency (W) Score 0 Max 5
2.C1 Water Efficient Landscaping 2 2.C2 Innovative Wastewater Technologies 1 2.C3 Water Use Reduction 2
3.0 Energy and Atmosphere (E) Score 0 Max 28
3.R1 Fundamental Building Systems Commissioning [Required]3.R2 Minimum Energy Performance [Required]3.R3 CFC Reduction in HVAC&R Equipment [Required]3.C1 Optimize Energy Performance 20 3.C2 Renewable Energy 4 3.C3 Additional Commissioning 1 3.C4 <<Deleted>> 3.C5 Measurement and Verification 1 3.C6 Green Power 1 3.C7 Distributed Generation 1
4.0 Materials and Resources (M) Score 0 Max 13
4.R1 Storage & Collection of Recyclables [Required]4.C1 Building Reuse 3 4.C2 Construction Waste Management 2 4.C3 Resource Reuse 2 4.C4 Recycled Content 2 4.C5 Local/Regional Materials 2 4.C6 Rapidly Renewable Materials 1 4.C7 Certified Wood 1
5.0 Indoor Environmental Quality (IEQ) [Q] Score 0 Max 17
5.R1 Minimum IAQ Performance [Required]5.R2 Environmental Tobacco Smoke (ETS) Control [Required]5.C1 IAQ Monitoring 1 5.C2 Increase Ventilation Effectiveness 1 5.C3 Construction IAQ Management Plan 2 5.C4 Low-Emitting Materials 4 5.C5 Indoor Chemical and Pollutant Source Control 1 5.C6 Controllability of Systems 2 5.C7 Thermal Comfort 2 5.C8 Daylight and Views 2 5.C9 Acoustic Environment /Noise Control 1 5.C10 Facility In-Use IAQ Management Plan 1

69
Facility Points Summary (Continued) Maximum Points
6.0 Facility Delivery Process (P) Score 0 Max 7
6.C1 Holistic Delivery of Facility 7
7.0 Current Mission Score 0 Max 6
7.C1 Operation and Maintenance 3 7.C2 Soldier and Workforce Productivity and Retention 3
8.0 Future Missions Score 0 Max 4
8.C1 Functional Life of Facility and Supporting Systems 2 8.C2 Adaptation, Renewal and Future Uses 2
Total Score 0 Max 100

70
Appendix C
Parametric Cost Estimating

71
Appendix Overview
Cost estimates are required in the conceptual planning and programming phase of
a facility construction project. Typically very little beyond the facility type, size, and
location are known at this point. Considerable attention is needed for initial cost
estimates because most projects will eventually be funded based on these rudimentary
estimates. Parametric cost estimating is the generic term used to describe the methods
used to come up with the initial estimates. This appendix explains the parametric cost
estimating process; focusing on how cost models are developed, what types of attributes
or parameters are needed, how cost estimates are completed, and the different types of
parametric estimates in common use. Special emphasis was placed on the automated
Parametric Cost Estimating System (PACES) currently used by the Department of
Defense (DoD).
Cost Estimating Types
Cost estimating is basically attempting to computationally predict the final cost of
a future project, even when all the project’s details aren’t known. The American
Association of Cost Engineers (AACE) recognizes the following three types of cost
estimates: order-of-magnitude estimates, budget estimates, and definitive estimates
(Popham, 1996). The three types of estimates are practical for use in all public, private,
and governmental production and service industries. Order-of-magnitude estimates are
accomplished without any detailed engineering data. They are also known as conceptual,
ballpark, or shotgun estimates. The fact that very little detailed engineering data is
needed and order-of-magnitude estimates are relatively quick to accomplish makes it a

72
valuable tool. Budget estimates are made once the design effort has started and
preliminary engineering data is available. Typically all major equipment items and
unique architectural and engineering features are identified. The final type of cost
estimate is the definitive estimate. It is based on clear architectural and engineering data.
The design is anywhere from 50 to 100% complete, but there are very few items or
features still unknown at this point. Estimates may be as specific as capturing the labor
and materials requirements from the design drawings and the detailed work breakdown
structure. Clearly, the more detail known about a project, the more accurate any estimate
becomes.
In the Federal Government, order-of-magnitude estimates are the most critical
estimates for sustainable design projects since they are the basis for project approval and
funding. There are two types of order-of-magnitude estimates, factored estimates and
parametric estimates. Both are similar in nature. Most DoD projects utilize both of these
fairly quick methods and compare the results.
Factored estimates are fairly straightforward. The cost of a project is based on the
historical costs of similar projects and adjusted for such factors as the location of the
project and monetary inflation. The cost of a facility is calculated based on a single
distinctive unit of measurement or parameter. For example, estimates for hospitals may
be based on the number of beds, warehouses on square feet of storage, or bowling alleys
on the number of bowling lanes. The Office of the Secretary of Defense (OSD) Pricing
Guide is an example of a factored estimating system and will be explained later in this
appendix.

73
Parametric cost estimates are similar to factored estimates. Both relate major cost
driving parameters from similar historic projects, called a project model, to extrapolate
and estimate the new cost. The primary difference is parametric cost estimating
considers more than one model parameter in building the estimate. Typical model
parameters seen in construction projects are square feet of usable floor area, average floor
height, number of floors, percentage of office area, roof type, estimated occupancy,
number of building corners, scaled quality of interior and exterior finishes, and scaled
strength of substructure and superstructure. The larger the number of relevant parameters
which can be identified the more likely the estimate will be accurate. Parametric
estimates tend to be more accurate than factored estimates, but without a large sampling
of historical data, are typically only accurate to plus or minus 30% (De la Garza and
Rouhana, 1995). Many prominent cost analysts also caution that because each
organization is likely to have unique parameters, cost estimating models should be
organization specific. A model that works well for one organization may not work well
for the next (Phaobunjong and Popescu, 2003).
Cost Estimating Relationship Development Process
Parametric cost estimating uses statistical techniques to find historical
relationships between changes in cost and the independent parameter(s) upon which these
costs depend. The relationship between independent cost-driving parameter(s) and the
dependent cost variable is termed a cost estimating relationship (CER). The statistical
techniques used to determine CERs range from simple linear regression to multiple linear
regression or even curvilinear regression.

74
The process of developing a parametric cost estimating relationship (CER) is
fairly standardized. Figure 3 is a flow diagram of the CER development process taken
from the DoD’s Parametric Estimating Handbook, but the same process should be used
by any organization looking to develop and use parametric cost estimating.
Figure 3 CER Development Process (Source: PCEI WG, 1999:3-5)
Many subject matter experts on parametric cost estimating believe the eventual
cost model will only be as viable as the input data provided (PCEI WG, 1999 and Melin,
1994). In construction projects, this means the database of historic projects must be as
extensive, detailed, and accurate as possible. In Figure 3, the first two steps of the flow
diagram directly relate to the need for a sound and well-populated database of projects.

75
Step one relies on the developer of the cost model to determine if there is sufficient data
in quantity and quality to formulate a CER. For this reason, parametric estimating is
most applicable to relatively standard projects where sufficient data is more likely. Step
two is the collection of data to populate the database. The data is typically derived from
detailed cost estimates of historic projects. The data must be broken down and stored so
an estimator or automated software application can quickly and easily access specific
description, quantity, and cost data and determine if the data is applicable to the project
type. For example, the data derived from a gymnasium construction project must be
distinguishable from an office building construction project. There may even be unique
features of a project type, like costly gymnasium flooring which must be distinguished
from all other flooring. The database is responsible for maintaining these unique
relationships and ensuring the appropriate data is populating the database. The database
may also separate system components into its subcomponents to improve data storage
logic and improve access times. Occasionally, the estimator or analysts discovers
irregularities or inconsistencies with the data or database and justifiably makes
reasonable adjustments. The development and population of the database may seem like
a significant investment in time and effort; however, the eventual trade-offs in speed and
accuracy of parametric estimates make the effort worthwhile.
Once the data has been collected it needs to be normalized with like data.
Normalization of costs to a base year is required along with normalization of quantities
and units of measure. For example, ceramic tile costs might have been measured in cost
per square yard in 1998 dollars, but is required to be normalized to cost per square foot in
2005 dollars. The fourth step is to select independent variable(s) which are hypothesized

76
to affect the magnitude of the dependent variable. Of course, this theory should be tested
graphically or statistically to ensure a causal relationship is actually present. Variables or
parameters which don’t significantly affect the dependent variable should be omitted
from the list of relational parameters. After the significant independent parameters are
selected, cost estimating relationships are hypothesized. The form of the cost estimating
relationship is typically an arithmetic function sometimes called a mathematical model.
Statistical regression techniques are typically used to determine the parameters or
coefficients (statistical weighting) of the mathematical model. Simple linear regression,
multiple linear regression, step-wise regression, and curvilinear regression are just a
small sample of the possible statistical techniques used to formulate the mathematical
model.
CER Validation
Steps seven and eight on the Figure 3 flow diagram test the validity and predictive
capabilities of the mathematical model. Table 6 lists the more widely used validation and
prediction tests. A simple linear model has the common mathematical form Y= a + b(X)
+ e. The column heading Y , in Table 6, is the arithmetic mean of the dependent variable
Y. “CER Model” refers to the entire mathematical equation. In the case of this sample
table, results from each of the listed tests are meant to be annotated in the table to show a
comparison between the statistics of the mean of the dependent variable and the statistics
reported for the CER model. The upper portion of the table attempts to validate the cost
estimating model. The lower portion of the table portrays how well the model predicts

77
future estimates, not only theoretically in the future, but with actual data. Figure 4 is a
short interpretation of each of the tests.
Steps seven and eight on the Figure 3 flow diagram test the validity and predictive
capabilities of the mathematical model. Table 6 lists the more widely used validation and
prediction tests. A simple linear model has the common mathematical form Y= a + b(X)
+ e. The column heading Y , in Table 6, is the arithmetic mean of the dependent variable
Y. “CER Model” refers to the entire mathematical equation. In the case of this sample
table, results from each of the listed tests are meant to be annotated in the table to show a
comparison between the statistics of the mean of the dependent variable and the statistics
reported for the CER model. The upper portion of the table attempts to validate the cost
estimating model. The lower portion of the table portrays how well the model predicts
future estimates, not only theoretically in the future, but with actual data. Figure 4 is a
short interpretation of each of the tests.
Table 6 CER Quality Review Matrix
Evaluation Element CER Model
DataLogical Relationshipst-statF-statSECV
R2 (or Adjusted R2)Number of Observationsd.f.OutliersData Range
Val
idat
ion
Pred
ictio
n
Narrative DescriptionNarrative Description
Y
(Source: PCEI WG, 1999:3-18)

78
• F-stat: Tests whether the entire equation, as a whole, is valid.
• t-stat: Tests whether the individual X-variable(s) is/are valid.
• Standard Error (SE): Average estimating error when using the equation as the
estimating rule
• Coefficient of Variation (CV): SE divided by mean of the Y-data, relative measure
of estimating error
• Coefficient of Determination (R2): Percent of the variation in the Y-data explained
by the X-data.
• Adjusted R2: R2 adjusted for the number of X-variables used to explain the variation
in the Y-data
• Degrees of Freedom (d.f.): number of observations (N) less the number of estimated
parameters (# of X-variables + 1 for the constant term “a”). Concept of parsimony
applies in that a preferred model is one with high statistical significance using the
least number of variables.
• Outliers: Y-observations that the model predicts poorly. This is not always a valid
reason to discard the data.
• P-value: probability level at which the statistical test would fail, suggesting the
relationship is not valid. P-values less than 0.10 are generally preferred (i.e., only a
10% chance, or less, that the model is no good).
Figure 4 Interpretation of Statistical Indicators (Source: PCEI WG, 1999:3-21)
Despite the number of statistics available to check the validity and predictability
of a cost estimating model, there is no one statistic which can either validate or invalidate
the model. The model has to be examined from the view of the entire model. Step nine
stresses the importance of gaining not only internal trust in the model, but also external

79
trust. The best way to gain this trust is if the model continues to provide accurate
estimates within its intended scope. Steps ten and eleven in Figure 3 are the points were
the CER model(s) is incorporated into real world practice.
An important process in the flow diagram is periodic revalidation, where the
database is updated and the cost model can stand up to the rigors of the development
process again. If the model has been performing adequately only minor modifications
will likely be required. This is also an opportune time to incorporate any additional
insight which may have been gained since the original model was developed.
Parametric Cost Estimating in the Department of Defense
The Department of Defense has long understood the value of parametric cost
estimating. Every major acquisition program in the DoD uses parametric estimating.
Parametric estimates are used as the basis for budget estimations, production decisions,
contractor cost negotiations, and contractor work evaluations. Estimating facility
construction projects is just one of the applications of parametric cost estimating.
Accurate estimates are mandated for all Military Construction (MILCON)
projects going to Congress for approval and funding. This is not only used to aid
Congressional decision-making, but also at contract award time to determine if the
Federal Government is getting a fair and reasonable price for its contract. The Federal
Government validates the use of parametric estimating in the following Federal
Acquisition Regulation (FAR) excerpt: “the Government may use various cost analysis
techniques and procedures to ensure a fair and reasonable price, including verifying
reasonableness of estimates generated by appropriately calibrated and validated
80
parametric models or cost-estimating relationships” (FAR Secretariat, 2001:15.404-1 (c)
(2) (i) (C)).
The Department of Defense has used parametric cost estimating for construction
projects since the early 1980s. For many years, each DoD Agency inefficiently worked
individually on its own parametric cost estimating system. In recent years, however, all
the Services have been able to agree for the most part on one system. The adopted
system is the Parametric Cost Engineering System (PACES). PACES is part of the larger
umbrella of DoD cost estimating products called the Tri-Service Automated Cost
Engineering System (TRACES). The TRACES family of software includes a full line of
construction cost estimating and scheduling tools from a parametric tool like PACES to a
detailed quantity take-off estimating tool like Micro Computer-Aided Cost Engineering
System (MCACES). Tools to help determine life cycle costs, cost risks, and area cost
factors are also included in the TRACES suite of cost estimating software.
Initial development of PACES began in 1981 by Delta Research, Inc with
technical direction and funding from the U.S. Air Force (Earth Tech, 2003). PACES
version 1.0 was released in 1983. The proprietary PACES cost engineering software
system was eventually sold to Earth Tech, Inc. Since 1983 PACES has been used to
estimate over $20 billion in projects for public and private agencies (PACES brochure,
undated). Independent validation on over $4 billion worth of projects has proven PACES
to be accurate to within 7.5% (PACES brochure, undated). When considering most
parametric cost estimating systems are typically only accurate to within 15%, PACES has
an impressive track record. PACES is annually updated with new DoD and industry
wide project data and an expanded selection of models. Every few years itemized unit

81
price data are updated based on the U.S. Army Corps of Engineers’ Commercial Unit
Price Book and other industry standard price information (Earth Tech, 2003). The latest
version of PACES (version 5.0) was released in May 2003 and contains over 25,000 line
items for over 100 cost models and location-specific adjustments for 2,120 cities
worldwide (PACES brochure, undated).
The U.S. Air Forces’ commitment to PACES is shown below in section 3.3.4 of
AFI32-1021:
3.3.4. Project Cost Estimates. Accurate project cost estimates are essential to successful MILCON project development and execution. Cost estimates must be closely scrutinized to ensure they are in-line with the OSD Pricing Guide or fully justified with historical cost data. Installations and MAJCOMs should prepare cost estimates using parametric estimating tools (defined as being equivalent to 15% design completion) or based on 35% conventional design…Use the Tri-Service Parametric Cost Engineering System (PACES) as a tool to develop parametric cost estimates; however, PACES cost estimates for primary facilities shall be consistent with unit prices published in OSD Pricing guide or AFCESA Historical Construction Cost Handbook. Major differences between PACES and the OSD Pricing Guide (e.g., clay tile roof versus standing seam metal roof) shall be fully justified to HQ USAF/ILEC. Capture unique requirements of a project as separate line items under Primary or Supporting Facility cost (Department of the Air Force, 2003:22).
The other Armed Services have released similar direction. The Office of the Secretary of
Defense (OSD) Pricing Guide, referenced above in the AFI and earlier in this appendix,
is released yearly based on inputs from each of the Services (DoD, 2003 and AFCESA,
2003). The OSD Pricing Guide contains average project unit costs ($/Square Foot), area
(location) cost factors, size adjustment factors, and OSD inflation rates. The AFI’s
purpose for ensuring the PACES estimate does not exceed the OSD pricing guide is not a
validation of PACES, but a check to ensure projects are not “gold-plated”.
Also, special attention should be paid to the final sentence of the AFI excerpt
which requires “unique requirements” to be noted as separate line items in the estimate.

82
Currently this is the only way to truly add sustainable design to a project estimate. The
latest version of PACES does offer a new feature to add what it calls sustainable design
to an estimate; however, selection and orientation of high-efficiency windows are the
only options. Hardly a comprehensive list of sustainable design features. “Bolt-on”
sustainable features like high-efficiency windows are considerably less effective when
not part of a facility-wide integrated sustainable design. This new feature of PACES
therefore has questionable benefits.
PACES Modeling
PACES estimates are based upon standard design models and organized by a
modified American Society of Testing and Materials (ASTM) Uniformat™ Work
Breakdown Structure (WBS) (Earth Tech, 2003). Model quantities and costs are
predefined using similar historical projects and adjusted by experienced architectural and
engineering assumptions as needed. Users are able to add, modify, or delete various
default parameters like labor, equipment, and material assumptions to correspond with
actual project conditions.
PACES’ modified Uniformat™ WBS is a logical way to look at a facility as a
collection of physical parts called systems and assemblies. The systems and assemblies
are characterized by their function not by the specific materials that make them up.
Systems comprise the top level and can be further broken down into subsystems. Each
subsystem can be subdivided into assembly categories. The assembly categories can then
be further subdivided into assemblies and finally into specific line items. Figure 5
diagrams the steps that must be completed in order to accomplish an estimate. PACES

83
doesn’t require the user to enter data past the subsystem level (Step 3 in Figure 5). The
software will automatically fill in lower level information based on the model and
parameters chosen; however, the user is able to go back and modify the software’s
selections at their discretion. Figure 5, Step 1 requires the user to come up with a name
or some other way of identifying the project. Step 1 also requires the user to identify the

84
Step 1:Add a Project
Step 2:Add a Facility
Step 3:Required
Parameters
Add FSA Delete FSA Modify FSASize
Step 4:SecondaryParameters
Building ShellDescriptiveParameters
Building ShellQuantity
Parameters
FSA DensityParameters
Step 5:Calculate and Edit
Quantities
Step 6:SupportingFacilities
Step 7:Project Markups
Step 8:Cost Reports
ModifyAssemblies
AddAssemblies
DeleteAssemblies
ComparativeSupportingFacilities
Site Work Models
AreaStoriesAboveGrade
StoriesBelowGrade
Figure 5 PACES Estimating Process (Source: Earth Tech, 2003:67)

85
location of the project, the year of the project, and whether metric or English units are
preferred. Step 2 requires the user to choose a facility and model type. Step 3 asks for
the area of the facility, the number of stories above and below grade, and the
identification of functional space areas. The rest of the steps are not required, but any
additional information provided will help to improve the accuracy of the estimate.
PACES Reports
PACES can produce eleven different project reports and nine different facility
reports. The reports vary in level of detail and format. Some reports include direct and
indirect cost, others just direct costs. There is a Construction Specification Institute (CSI)
Construction Cost Report which provides a detailed breakdown of materials in CSI
Master Format™ structure (Earth Tech, 2003). This CSI Master Format™ report is a
detailed cost estimate formatted primarily by the construction materials used and type of
work needed like concrete, masonry, mechanical systems, and electrical systems. There
are also many reports which break down the estimate based on the ASTM modified
Uniformat™ structure (Earth Tech, 2003). Finally, since PACES was developed
primarily for the DoD, it can produce the project cost worksheets required for
Congressional approval.
Some argue the level of detail available in PACES reports gives the illusion of
accuracy to the estimates. Recall PACES can only be expected to be accurate to within
7.5%. Project personnel have to be cautious not to fall into the trap of proclaiming a
greater accuracy than is really present. The detail PACES can produce should only be
used to support the design and construction efforts. PACES can be a design check to
86
ensure key details aren’t left out of the project. For contracted projects, the detailed
PACES estimate can also provide a sanity check and be a red flag for bids which are
either too low or too high. If bids are either too low or too high, the contracting agency
can recheck the design and estimate for errors or oversights. Another use for PACES
detailed estimating and reporting capabilities is during construction; it can be used to
formulate ballpark estimates for scheduling, personnel, and equipment requirements.
PACES Compatibility with LEED™ Projects
There is little debate that initial costs for sustainable design are greater than
conventional construction. The many likely reasons for this difference were discussed in
Chapter 2. The debate still lies as to how much greater sustainable design should cost.
PACES is an impressively accurate tool for most conventional construction projects
considering the small amount of data needed by the user. However, PACES is deficient
at accurately estimating sustainable design facilities. Relatively few facilities have been
built using sustainable design; therefore, it is inadequately considered by PACES
historical cost models. Since the level of sustainability can very greatly even from
LEED™ building to LEED™ building (i.e. LEED™ Certified to LEED™ Platinum),
adding additional models isn’t likely the answer. Perhaps LEED™ certification levels
can be another parameter added to the various PACES cost models. Obviously, cost data
from more completed sustainable design facilities would be required first. Until
sustainable design is better incorporated into PACES, project programmers and
estimators will have to take the questionable and inexact approach of adding sustainable
design as a separate line item to construction cost estimates.

87
Parametric Cost Estimating Conclusion
Parametric cost estimating is an order-of-magnitude estimate, one of three broad
categories of cost estimating techniques. Parametric cost estimating is a powerful tool
capable of being utilized with few known architectural and engineering parameters.
Relating known architectural and engineering parameters to cost information is
accomplished by utilizing cost estimating relationship(s) (CER). CERs are established
using statistical analysis of historic project data to mathematically relate independent
parameters to dependent parameters like cost. The only definitive validation of a CER is
how accurately it predicts actual future costs. The Department of Defense uses the
Parametric Cost Estimating System (PACES) which has proven to be fairly accurate for
this type of early order-of-magnitude estimate. One limitation with PACES is its
inability to accurately incorporate sustainable design in its estimates. As more cost data
is acquired from sustainable design projects, it is likely that PACES will become more
capable of accurately estimating sustainable design projects.

88
Appendix D
Hypothesis Testing Comparison of Means

89
xbar2 4.442=xbar1 0.155=
xbar2 mean x2( ):=xbar1 mean x1( ):=
(Hypothesized difference between the means)
D0 0:=n2 9:=n1 13:=
x2
2.98
0.54
3.27−
0.00
0.01
1.18−
9.00
9.64
22.26
⎛⎜⎜⎜⎜⎜⎜⎜⎜⎜⎜⎜⎝
⎞⎟⎟⎟⎟⎟⎟⎟⎟⎟⎠
:=x1
4.74−
10.85−
2.52
6.15
1.17
8.97
18.57
7.32−
14.89−
7.45−
0.0
4.74−
14.63
⎛⎜⎜⎜⎜⎜⎜⎜⎜⎜⎜⎜⎜⎜⎜⎜⎜⎝
⎞
⎟⎟⎟⎟⎟⎟⎟⎟⎟⎟⎟⎟⎟⎟
⎠
:=
Other Fed Gov ProjectsDoD Projects
c. The samples are randomly and independently selected from the population
b. The population variances are approximately equal
a. Both sampled populations have relative frequency distributions that are approximately normal
Assumptions necessary to ensure the validity of this test:
µ1 µ2− 0≠Ha
µ1 µ2− 0Ho
= Other Fed Government Projectsµ2
= DoD Projectsµ1Origin 1:=
Comparison of DoD and Other Federal Government Means

90
s1 Var x1( ):= s2 Var x2( ):=
s1 9.908= s2 8.009=
Var x1( ) 98.169= Var x2( ) 64.137=
spooledn1 1−( ) s1
2⋅ n2 1−( ) s2
2⋅+
n1 n2+ 2−:=
spooled 84.55599=
α .10:= (Assumed Confidence Level - 90%)
tcritlt qt 1α
2− n1 n2+ 2−,⎛⎜
⎝⎞⎠
−:= tcritrt qt 1α
2− n1 n2+ 2−,⎛⎜
⎝⎞⎠
:=
tcritrt 1.725=tcritlt 1.725−=
tstarxbar1 xbar2−( ) D0−
spooled1n1
1n2
+⎛⎜⎝
⎞⎠
:=
tstar 1.075−=
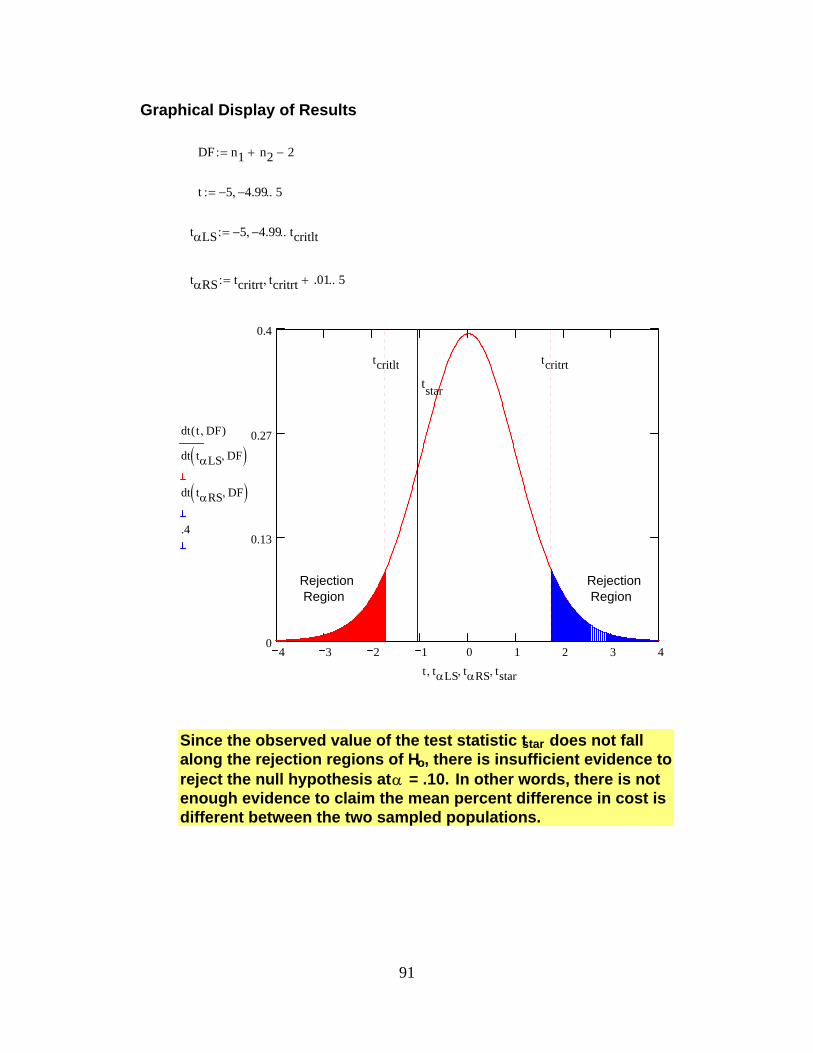
91
Graphical Display of Results
DF n1 n2+ 2−:=
t 5− 4.99−, 5..:=
tαLS 5− 4.99−, tcritlt..:=
tαRS tcritrt tcritrt .01+, 5..:=
4 3 2 1 0 1 2 3 40
0.13
0.27
0.4
dt t DF,( )
dt tαLS DF,( )
dt tαRS DF,( )
.4
tcritlt tcritrt
t tαLS, tαRS, tstar,
tstar
Rejection Region
Rejection Region
Since the observed value of the test statistic tstar does not fall along the rejection regions of Ho, there is insufficient evidence to reject the null hypothesis at α = .10. In other words, there is not enough evidence to claim the mean percent difference in cost is different between the two sampled populations.

92
Observed Significance Level (p-value) Calculation
pval pt tstar DF,( )( ) 2⋅:=
pval 0.2951=
There is sufficient evidence to reject the null hypothesis and to indicate the mean percent difference in cost are different for any value of α > .30. Since this p-value is so large, there is nearly no evidence to reject the null hypothesis for any reasonable value of α .

93
Appendix E
Hypothesis Testing Large Sample Test About a
Population Mean

94
s 9.229=
s Var x( ):=
median x( ) 0.275=xbar 1.9091=
xbar mean x( ):=
df n 1−:=n 22:=
x4.74−
7.32−
10.85−
14.89−
2.52
0.01
6.15
1.18−
2.98
9.00
1.17
7.45−
8.97
9.64
0.54
0.00
3.27−
4.74−
0.00
14.63
18.57
22.26⎛⎜⎝
⎞⎠
:=
All Federal Government Projects
c. The sample is randomly and independently selected from the population
b. The population variance is approximately equal
a. Sampled population has relative frequency distribution that is approximately normal
Assumptions necessary to ensure the validity of this test:
Therefore, Two-tailed Test
Alternative Hypothesisµ µo≠Ha
Null Hypothesisµ µoHo
% (Status-quo, no difference in cost)µo 0:=
Origin 1:== All Federal Government Projectsµ
Small Federal Government Sample Test About a Population Mean With Evaluated Mean = 0%

95
Verification of Mound-Shaped Data
H histogram 9 x,( ):= cols H( ) 2:=
16.67 0 300
5
10
H 1⟨ ⟩
H 0⟨ ⟩
H
12.889−
8.667−
4.444−
0.222−
4
8.222
12.444
16.667
20.889
2
2
3
6
2
4
0
2
1
⎛⎜⎜⎜⎜⎜⎜⎜⎜⎜⎜⎜⎝
⎞⎟⎟⎟⎟⎟⎟⎟⎟⎟⎠
=
Mound shape data verified
Hypothesis Testing:
α .10:= (Assumed Confidence Level - 90%)
tcLT qtα
2n 1−,⎛⎜
⎝⎞⎠
:= tcRT qt 1α
2− n 1−,⎛⎜
⎝⎞⎠
:=
tcLT 1.72074−= tcRT 1.72074=
tstarxbar µo−
s
n
:=
tstar 0.97=

96
Graph of t-statistic (with α shaded) shown below :
t 4− 3.95−, 4..:=
t-critical defines the start of the α - region (along the axis)
tshadeLT 5− 4.99−, tcLT..:=
tshadeRT tcRT tcRT .01+, 4..:=
3.8 1.6 0 2.8 50
0.13
0.27
0.4
dt t n 1−,( )
dt tshadeLT n 1−,( )
dt tshadeRT n 1−,( )
.4
.4
.4
zbar zc
t tshadeLT, tshadeRT, tcLT, tcRT, tstar,
tstar
tcLT tcRT
Rejection Region
Rejection Region
Since the observed value of the test statistic tstar does not fall along the rejection regions of Ho, there is insufficient evidence to reject the null hypothesis at α = .10. In other words, there is not enough evidence to claim the mean percent difference in cost is greater (or less) than 0.

97
to CIRT 5.295=CILT 1.477−=
CIRT xbar MarginofError+:=CILT xbar MarginofError−:=
Confidence Interval Estimate of the Population Mean:
MarginofError 3.386=
MarginofError qt 1α
2− df,⎛⎜
⎝⎞⎠
s
n⋅:=
Margin of Error:
(Assumed Confidence Level - 90%)α .10:=
Confidence Interval Results for α = .10
Confidence Interval Calculations
There is sufficient evidence to reject the null hypothesis and to indicate the mean percent difference in cost is not equal to 0% for any value of α > .34. Since this p-value is so large, there is nearly no evidence to reject the null hypothesis for any reasonable value of α .
pvalt 0.343=
pvalt 1 pt tstar df,( )−( ) 2⋅:=
Observed Significance Level (p-value) Calculation

98
to CIRT 7.48=CILT 3.662−=
CIRT xbar MarginofError+:=CILT xbar MarginofError−:=
Confidence Interval Estimate of the Population Mean:
MarginofError 5.571=
MarginofError qt 1α
2− df,⎛⎜
⎝⎞⎠
s
n⋅:=
Margin of Error:
(Assumed Confidence Level - 99%)α .01:=
Confidence Interval Results for α = .01
to CIRT 6.001=CILT 2.183−=
CIRT xbar MarginofError+:=CILT xbar MarginofError−:=
Confidence Interval Estimate of the Population Mean:
MarginofError 4.092=
MarginofError qt 1α
2− df,⎛⎜
⎝⎞⎠
s
n⋅:=
Margin of Error:
(Assumed Confidence Level - 95%)α .05:=
Confidence Interval Results for α = .05
99
References Air Force Center for Environmental Excellence (AFCEE). United States Air Force
Environmentally Responsible Facilities Guide. Brooks AFB: HQ AFCEE, Jun 1997. Air Force Civil Engineer Support Agency (AFCESA) Directorate of Technical Support.
Historical Air Force Construction Cost Handbook - 2003. Revision 1. Tyndal AFB, Florida: AFCESA, February 2003.
Air Force Center for Environmental Excellence (AFCEE). The United States Air Force
Project Manager’s Guide for Design and Construction. Brooks AFB: HQ AFCEE, Jun 2000.
Anderson, David R., Sweeney, Dennis J., and Williams, Thomas A. Statistics for
Business and Economics. Ohio: South-Western College Publishing, 1999. ATHENA Sustainable Materials Institute. US Federal and Military Applications of
LEED™: Lesson Learned. Ontario, Canada, March 2002. Beranek, Dwight A. Sustainable Design for Military Facilities. Engineering Technical
Letter (ETL) 1110-3-491. Directorate of Civil Works, Engineering and Construction Division Chief, Washington: United States Army Corps of Engineers (USACE), 1 May 2001.
Berman, Adam. Green Buildings: Sustainable Profits from Sustainable Development.
Tilden Consulting, 30 July 2001. Brundtland, Gro. Our Common Future: The World Commission on Environment and
Development, Oxford: Oxford University Press, 1987. “Buildings and the Environment: The Numbers”, Environmental Building News, 10:5
(May 2001) Retrieved from: http://www.usgbc.org/Resources/ industry_statistics.asp.
Bush, George. National Defense Authorization Act for FY 2002. S.1438, Sec 1438,
Washington D.C., 28 December 2001. Chapman, Michael G., Hurt, Alan C., and Graham, James D. “Green Building Design
and Sustainable Systems Management,” U.S. Green Building Council Green Building International Conference and Expo. Austin TX, 13-15 November 2002.
Clinton, William J. Federal Energy Management. Executive Order 12759, 56 Federal
Register 16257. Washington: GPO, April 1991.

100
Clinton, William J. Procurement Requirements and Policies for Federal Agencies for Ozone-Depleting Substances. Executive Order 12843, 58 Federal Register 21881. Washington: GPO, April 1993a.
Clinton, William J. President’s Council on Sustainable Development. Executive Order
12852, 58 Federal Register 35841. Washington: GPO, July 1993b. Clinton, William J. Federal Compliance with Right-to-Know Laws and Pollution
Prevention Requirements. Executive Order 12856, 58 Federal Register 41981. Washington: GPO, August 1993c.
Clinton, William J. Federal Acquisition, Recycling, and Waste Prevention. Executive
Order 12873, 58 Federal Register 54911. Washington: GPO, October 1993d. Clinton, William J. Energy Efficiency and Water Conservation at Federal Facilities.
Executive Order 12902, 59 Federal Register 11463. Washington: GPO, March 1994. Clinton, William J. Further Amendment to Executive Order No. 12852. Executive Order
12965, 60 Federal Register 34087. Washington: GPO, June 1995a. Clinton, William J. Further Amendment to Executive Order No. 12852, as Amended.
Executive Order 12980, 60 Federal Register 57819. Washington: GPO, November 1995b.
Clinton, William J. Adding Members to and Extending the President’s Council on
Sustainable Development. Executive Order 13053, 62 Federal Register 39945. Washington: GPO, July 1997.
Clinton, William J. Greening the Government Through Waste Prevention, Recycling, and
Federal Acquisition. Executive Order 12843, 63 Federal Register 49643. Washington: GPO, September 1998.
Clinton, William J. Further Amendment to Executive Order 12852, as Amended,
Extending the President’s Council on Sustainable Development. Executive Order 13114, 64 Federal Register 10099. Washington: GPO, February 1999a.
Clinton, William J. Greening the Government Through Efficient Energy Management.
Executive Order 13123, 64 Federal Register 30851. Washington: GPO, June 1999b. Clinton, William J. Continuance of Certain Federal Advisory Committees. Executive
Order 13138, 64 Federal Register 53879. Washington: GPO, October 1999c. Clinton, William J. Greening the Government Through Leadership in Environmental
Management. Executive Order 13148, 65 Federal Register 24595. Washington: GPO, April 2000.

101
Daniels, Mitchell, E. Jr. Energy and Transportation Efficiency Management. Office of Management and Budget (OMB) Circular No. A-11 Part B Section 55. Washington, 27 June 2002.
Daschle, Linda H. Energy Policy Order 1053.1a. Federal Aviation Administration Office
of Environment and Energy. Washington: Federal Aviation Administration, December, 1996. http://www.aee.faa.gov/AEE-200/ORDER1053/ APPENDIX1.HTM.
De la Garza, Jesus M. and Rouhana, Khalil, G. “Neural Networks Versus Parameter-
Based Applications in Cost Estimating.” Cost Engineering, Morgantown, 37: 14 (February 1995).
DefenseLINK. “FY 2001 Military Construction Budget Request”, United States
Department of Defense News Release, 7 February 2000. http://www.defenselink.mil/news/Feb2000/b02072000_bt047-00.html.
DefenseLINK. “Fiscal 2003 Military Construction and Family Housing Budget
Detailed”, United States Department of Defense News Release, 4 February 2002. http://www.defenselink.mil/news/Feb2002/b02042002_bt045-02.html.
DefenseLINK. “Military Construction and Family Housing Budget for Fiscal 2004”,
United States Department of Defense News Release, 3 February 2003. http://www.defenselink.mil/news/Feb2003/b02032003_bt047-03.html.
Department of the Air Force. Planning and Programming Military Construction
(MILCON) Projects. AFI32-1021. Washington: HQ USAF, 24 January 2003. Department of Defense (DoD). DoD Facilities Pricing Guide. Unified Facilities Criteria
(UFC 3-701-03). Version 5. Washington: OSD, March 2003. Department of Energy (DoE) Office of Environmental Policy and Guidance. EH-41
Environmental Law Summary: Resource Conservation and Recovery Act. U.S. Department of Energy, May 1998 http://tis.eh.doe.gov/oepa/law_sum/RCRA.HTM.
Department of Energy (DoE). The Business Case for Sustainable Design in Federal
Facilities. Federal Energy Management Program (FEMP), August 2003. Earth Tech. Introduction to PACES 2003 – A Quick Reference Guide. Englewood, CO:
Earth Tech, Inc, May 2003. Environmental Protection Agency (EPA) Office of Radiation and Air. Indoor Air Facts
No. 4: Sick Building Syndrome, U.S. Environmental Protection Agency, Washington DC, April 1991.

102
FAR Secretariat, General Services Administration Federal Acquisition Policy Division. Federal Acquisition Regulation, Volume 1 Parts 1 to 51, General Services Administration, Department of Defense, National Aeronautics and Space Administration, September 2001.
Federal Facilities Council. Sustainable Federal Facilities – A Guide to Integrating Value
Engineering, Life-Cycle Costing, and Sustainable Development. Federal Facilities Council Technical Report No. 142. Washington: National Academy Press, 2001.
Fiori, Mario P. Sustainable Design and Development Requirements. Deputy Assistant
Secretary of the Army, Installations and Environment, Washington: HQ USA, 18 March 2003.
Goradia, Harry and Schneider, Richard. “Using Army's Sustainable Project Rating Tool
(SPiRiT),” U.S. Green Building Council Green Building International Conference and Expo. Austin TX, 13-15 November 2002.
Hart, Maureen. Sustainable Community Indicators Trainer’s Workshop. Sustainable
Measures, North Andover, MA, 1998 http://www.sustainablemeasures.com/Training/Indicators/Introduction.html.
Haskins, Annie. Federal Energy Management Program Overview. EL-710-30191, U.S.
Department of Energy, February 2002 http://www.eere.energy.gov/femp/aboutfemp/fempoverview.html.
Howard, John L. Leading by Example: A Report to the President on Federal Energy and
Environmental Management (2000-2001). Washington DC: White House Task Force on Waste Prevention and Recycling, December 2002.
Howard, John L. Jr. The Federal Commitment to Green Building: Experiences and
Expectations. Federal Executive, Office of the Federal Environmental Executive, Washington, October 2003a http://www.ofee.gov/sb/fgb_report.html.
Howard, John L. The Federal Commitment to Green Building: Experiences and
Expectations. Washington DC: White House Task Force on Waste Prevention and Recycling, 15 December 2003b.
Johnson, Paul W. Sustainable Design and Development. Deputy Assistant Secretary of
the Army, Installations and Environment, Washington: HQ USA, 26 April 2000. Katz, Greg. The Costs and Financial Benefits of Green Buildings. A Report to
California’s Sustainable Building Task Force, Capital E LLC, Washington D.C., October 2003.
Lear, Linda. Rachel Carson: Witness for Nature. New York: Henry Holt and Co., 1997.

103
Leibowitz, Julie. “It’s Not Easy Going Green,” Facilities Design and Management, 22:28-31 (February 2003).
Lewis, Jack. “The Birth of EPA,” EPA Journal, November 1985.
http://www.epa.gov/history/topics/epa/15c.htm. Lovins, Amory B. Sustainable Planning: A Multi-Service Assessment. Naval Facilities
Engineering Command Contract: 96-D-0103, EDAW Inc. Washington: Navy Yard, August 1999.
Lust, Larry J. Sustainable Project Rating Tool. Assistant Chief of Staff for Installation
Management, Washington: HQ USA, 21 December 2002. Mathcad. Version 2001i Professional. Computer Software. MathSoft Engineering and
Education, Inc. Cambridge, Mass. 2001. McClave, James T., Benson, P. George, and Sincich, Terry. Statistics for Business and
Economics. Upper Saddle River: Prentice-Hall, Inc, 2001. Melin, John B Jr. “Parametric Estimation.” Cost Engineering, Morgantown, 36: 19-24
(January 1994). Muto, Sheila. “The Public Sector Spurs ‘Green’ Building,” The Wall Street Journal –
Real Estate Journal, 16 July 2003. National Park Services. Greening the National Park Service Energy Regulations.
Washington: U.S. Department of the Interior, April 1999. http://www.nps.gov/renew/regulations.htm.
Naval Facilities Engineering Command (NAVFAC). Design of Sustainable Facilities and
Infrastructure. Planning and Design Policy 98-01, Washington: Navy Yard, 18 June 1998a.
Naval Facilities Engineering Command (NAVFAC). Criteria Supporting the Design of
Sustainable Facilities and Infrastructure. Planning and Design Policy 98-02, Washington: Navy Yard, 18 June 1998b.
Naval Facilities Engineering Command (NAVFAC). Procurement of Sustainable
Facilities and Infrastructure Through Architect-Engineer (A-E) and Related Contracts. Planning and Design Policy 98-03, Washington: Navy Yard, 18 June 1998c.
Naval Facilities Engineering Command (NAVFAC). Sustainable Development
Implementation. Planning and Design Policy 98-04, Washington: Navy Yard, 18 June 1998d.

104
Naval Facilities Engineering Command (NAVFAC). Adopting the U.S. Green Building Council’s (USGBC) Leadership in Energy and Environmental Design (LEED™) Rating System. 4000 EICO/dot, Washington: Navy Yard, 5 July 2002.
Naval Facilities Engineering Command (NAVFAC). Sustainable Development Policy.
NAVFACINST 9830.1, Washington: Navy Yard, 9 June 2003a. Naval Facilities Engineering Command (NAVFAC). Comprehensive Regional Planning
Instruction: Sustainable Planning. NAVFACINST 11010.45, Washington: Navy Yard, May 2003b.
O'Dell, Bill. A Sustainable Design Process, EnvironDesign3 Conference, HOK
Architects, Baltimore, MD, May 1999. PACES Parametric Cost Engineering System. Company product brochure. Englewood,
CO: Earth Tech, Inc., no date [2003]. Parametric Cost Estimating Initiative Working Group (PCEI WG) Joint
Industry/Government Parametric Estimating Handbook, Department of Defense, 2ed, Spring 1999.
Pearce, Annie R., Vanegas, Jorge A., Fischer, Corey L.A., and Jones, Sheila L.
“Sustainable Facilities and Infrastructure.” Executive summary from training held at Warner Robins Air Force Base, Georgia, 10-11 April 2000.
Phaobunjong, Kan and Popescu, Calin M. “Parametric Cost Estimating Model for
Buildings.” AACE International Transactions, Morgantown, 2003: 131. Popham, Kymberli. “Cost Estimating Using Historical Costs.” Transactions of AACE
International, Morgantown, 1996: 141-146. Public Buildings Services (PBS). Buildings – Public Buildings. U.S. General Services
Administration (GSA). Washington, 3 October 2003 http://www.gsa.gov/Portal/gsa/ep/contentView.do?contentId=8062&contentType=GSA_OVERVIEW.
Rees, William E. “Sustainable Development: Economic Myths and Ecological Realities.
In Louis P. Pojman”, Environmental Ethics: Readings in Theory and Application. (3rd Ed., pp. 455-460). Boston: Jones and Bartlett Publishers, 1988.
Reicher, Dan W. Annual Report to Congress on Federal Government Energy
Management and Conservation Programs Fiscal Year 2000. U.S. Department of Energy, Federal Energy Management Program, Washington DC, December 2002 http://www.eere.energy.gov/femp/aboutfemp/annual_reports/ann00_report.html

105
Robbins, Earnest O. Sustainable Development Policy. Washington: HQ USAF/ILE, 19 December 2001.
Roodman, D. M. and Lenssen, N. “A Building Revolution: How Ecology and Health
Concerns are Transforming Construction,” Worldwatch Paper 124, Worldwatch Institute, Washington DC, 1995.
Schmidt, Marty J. The Business Case Guide (2nd edition). Boston: Solution Matrix Ltd,
2002. Steensma, David K. Environmental Programs: Audit Coverage of DoD Energy
Management. Report No. D-2002-085. Virginia: DoD Inspector General, May 2002. U.S. Army Corps of Engineers (USACE) and U.S. Army Assistant Chief of Staff for
Installation Management. Sustainable Project Rating Tool (SPiRiT) version 1.4.1. Washington, June 2002.
U.S. Green Building Council (USGBC). Leadership in Energy and Environmental
Design Green Building Rating System Version 1.0. Washington, January 1999. U.S. Green Building Council (USGBC). Leadership in Energy and Environmental
Design Green Building Rating System Version 2.1 Frequently Asked Questions. Washington, 24 July 2002 a.
U.S. Green Building Council (USGBC). Leadership in Energy and Environmental
Design Green Building Rating System Version 2.1. Washington, November 2002b. U.S. Green Building Council (USGBC). Leadership in Energy and Environmental
Design Green Building Rating System. LEED™ Training Workshop, Washington, August 2003a.
U.S. Green Building Council (USGBC). Leadership in Energy and Environmental
Design Green Building Rating System Version 2.1 Checklist. Washington, Downloaded from USGBC website, 30 October 2003b. http://www.usgbc.org/LEED/publications.asp.
U.S. Green Building Council (USGBC). Making the Business Case for High
Performance Green Buildings. Washington, Downloaded from USGBC website, 30 October 2003c. https://www.usgbc.org/Docs/Member_Resource_Docs/makingthebusinesscase.pdf
United Nations. Agenda 21, United Nations Conference on Environment and
Development, Rio de Janeiro, June 1992 http://www.un.org/esa/sustdev/documents/agenda21/english/agenda21toc.htm.

106
United States Congress. National Environmental Policy Act of 1969. 42 U.S.C. 4321-4347. Washington: GPO, 1969. http://ceq.eh.doe.gov/nepa/regs/nepa/nepaeqia.htm.
United States Congress. Pollution Prevention Act of 1990. 42 U.S.C. 13101-13109.
Washington: GPO, 1990. http://www.epa.gov/p2/p2policy/act1990.htm. Uyeno, Russell A., Architect, Honolulu District U.S. Army Corps of Engineers,
Technical Support Branch “Army’s Sustainable Project Rating Tool SPiRiT.” Briefed at unknown location, Honolulu, 2002.
Van Antwerp, R.L. Sustainable Project Rating Tool (SPiRiT). Assistant Chief of Staff for
Installation Management, Washington: HQ USA, 4 May 2001. Wilson, Alex, Seal, Jenifer L, McManigal, Lisa A, Lovins, L. Hunter, Cureton, Maureen,
and Browning, William D. Green Development: Integrating Ecology and Real Estate. New Jersey: John Wiley & Sons, 1998.
Wilson, Alex. Greening Federal Facilities: An Energy, Environmental, and Economic
Resource Guide for Federal Facility Managers and Designers (2nd Edition), DOE/GO-102001-1165. Department of Energy Contract DE-AC36-99GO10337, Brattleboro VT: BuildingGreen, Inc., May 2001.
Winn, Morris X. EPA’s E.O. 13101 Goals. Assistant Administrator, Office of
Administration and Resources Management, Environmental Protection Agency, Washington, October, 2002 http://www.epa.gov/greeningepa/p2/eppgoals.htm.
Yates, Alan. Quantifying the Business Benefits of Sustainable Buildings – Summary of
Existing Research Findings. Gartson. United Kingdom: Center for Sustainable Construction, Building Research Establishment, February 2001.

REPORT DOCUMENTATION PAGE Form Approved OMB No. 074-0188
The public reporting burden for this collection of information is estimated to average 1 hour per response, including the time for reviewing instructions, searching existing data sources, gathering and maintaining the data needed, and completing and reviewing the collection of information. Send comments regarding this burden estimate or any other aspect of the collection of information, including suggestions for reducing this burden to Department of Defense, Washington Headquarters Services, Directorate for Information Operations and Reports (0704-0188), 1215 Jefferson Davis Highway, Suite 1204, Arlington, VA 22202-4302. Respondents should be aware that notwithstanding any other provision of law, no person shall be subject to an penalty for failing to comply with a collection of information if it does not display a currently valid OMB control number. PLEASE DO NOT RETURN YOUR FORM TO THE ABOVE ADDRESS. 1. REPORT DATE (DD-MM-YYYY)
23-03-2004 2. REPORT TYPE
Master’s Thesis
3. DATES COVERED (From – To) Jun 2003 – Mar 2004
5a. CONTRACT NUMBER
5b. GRANT NUMBER
4. TITLE AND SUBTITLE MAKING THE BUSINESS CASE FOR SUSTAINABLE DESIGN IN THE DEPARTMENT OF DEFENSE 5c. PROGRAM ELEMENT NUMBER
5d. PROJECT NUMBER 5e. TASK NUMBER
6. AUTHOR(S) Warnke, David M., Captain, USAF 5f. WORK UNIT NUMBER
7. PERFORMING ORGANIZATION NAMES(S) AND ADDRESS(S) Air Force Institute of Technology Graduate School of Engineering and Management (AFIT/EN) 2950 Hobson Way, Building 641 WPAFB OH 45433-7765
8. PERFORMING ORGANIZATION REPORT NUMBER AFIT/GEM/ENV/04M-20
10. SPONSOR/MONITOR’S ACRONYM(S)
9. SPONSORING/MONITORING AGENCY NAME(S) AND ADDRESS(ES) Karen L. Kivela Headquarters Air Force Center for Environmental Excellence (HQ-AFCEE) 3300 Sidney Brooks Brooks City-Base TX 78235-5112 (210) 536-4191
11. SPONSOR/MONITOR’S REPORT NUMBER(S)
12. DISTRIBUTION/AVAILABILITY STATEMENT APPROVED FOR PUBLIC RELEASE; DISTRIBUTION UNLIMITED.
13. SUPPLEMENTARY NOTES 14. ABSTRACT Sustainable design is the common term associated with buildings which, during their construction, use, and eventual disposal, seek to minimize their negative impact on the environment and human health. The U.S. Green Building Council’s Leadership in Energy and Environmental Design (LEED™) rating system helps to assess a building’s sustainability level. Each Department of Defense Service has set ambitious LEED™ certification goals. Despite their stated goals and the clear environmental and health benefits of LEED™, a common concern is that LEED™ designed and constructed buildings are simply too costly. However, many proponents profess that LEED™ buildings shouldn’t cost significantly more than conventionally designed and constructed buildings and that the operational life-cycle cost savings rapidly compensate for any additional initial costs. Unfortunately, no comprehensive costs studies have been performed in the DoD; therefore, it continues to be the primary source of debate. This research gathered historical Federal construction cost data and used statistical analysis to explore whether a business case could be made to support LEED™ using initial construction costs. Results were mixed. While on average LEED™ buildings were only 1.9% more expensive to construct than conventional facilities, the 9.2% standard deviation made it difficult to make a favorable business case. 15. SUBJECT TERMS Sustainable Design, Sustainable Construction, Green Building, LEED, Leadership in Energy and Environmental Design, U.S. Green Building Council.
16. SECURITY CLASSIFICATION OF: 19a. NAME OF RESPONSIBLE PERSON Dr. Charles A. Bleckmann, PhD, AFIT (ENV)
a. REPORT
U
b. ABSTRACT
U
c. THIS PAGE
U
17. LIMITATION OF ABSTRACT
UU
18. NUMBER OF PAGES
119 19b. TELEPHONE NUMBER (Include area code) (937) 255-3636, ext 4721; e-mail: [email protected]
Standard Form 298 (Rev. 8-98) Prescribed by ANSI Std. Z39-18