making social work count lecture 10 an esrc curriculum innovation and researcher development...
TRANSCRIPT

Making Social Work Count Lecture 10
An ESRC Curriculum Innovation and Researcher Development Initiative

How can relationships between multiple variables be understood?

Learning outcomes
understand how multiple variables may
interact with one another
appreciate the role of intervening variables
be aware of how interpretation of statistics may be
affected by outliers and misinterpretations

How might we describe the students in this class?
• By gender• By age• By ethnicity• By religion• By nationality
What might be the limitation of only using one or two of these variables to describe the class?
What is multivariate analysis?
By using some statistical procedures we can begin to better understand the multiple relationships between a group of obviously related units (eg people, families, households) of which the degree and nature of the relationship is imperfectly known. It also assists to understand that the relationships may not be distributed evenly across the group being studied.

Sexual violence – a significant social, health and legal issue
• Consequences for victims:– physical injury, long-term mental
health issues, self-harm and suicide, disruption in intimate relationships, constrained socio-economic opportunities, routes into offending behaviour and wider social exclusion
• Most national and international government strategies advocate public awareness raising to – deter potential perpetrators – reach out to victims
It is estimated that 1 in 4 individuals have been subject to inappropriate sexual behaviour as children or adults

Public awareness campaigns
• Changes in the law relating to criminal offences [Sexual Offences (Northern Ireland) Order 2008]
• Public awareness campaign from November 2009 – March 2010
• Potential for victims to come forward seeking support
• Adverts on both television and radio, posters on advertising hoardings and in telephone kiosks, bus shelters and washrooms, insertions in the press (including titles catering specifically for Chinese and Polish ethnic minorities), and some targeting of internet websites

Objectives of study
An analysis of administrative data to:• Determine the number and type of calls about sexual violence
to a regional helpline support service during the six months of the public awareness campaign (November 2009 – April 2010)
• Compare the number and type of calls about sexual violence to a regional helpline support service in the six month period prior to the public awareness campaign (May 2009 – October 2009)
• Compare the number and type of calls about sexual violence to a regional helpline support service in the three months following the public awareness campaign (May 2010 - July 2010)

Key questions
• Who called?• When did they call?• What prompted them to call?• How was this related to the public awareness
campaign?• What did they call about?• What patterns emerged that might inform our
understanding of sexual violence?
0
2
4
6
8
10
12
14
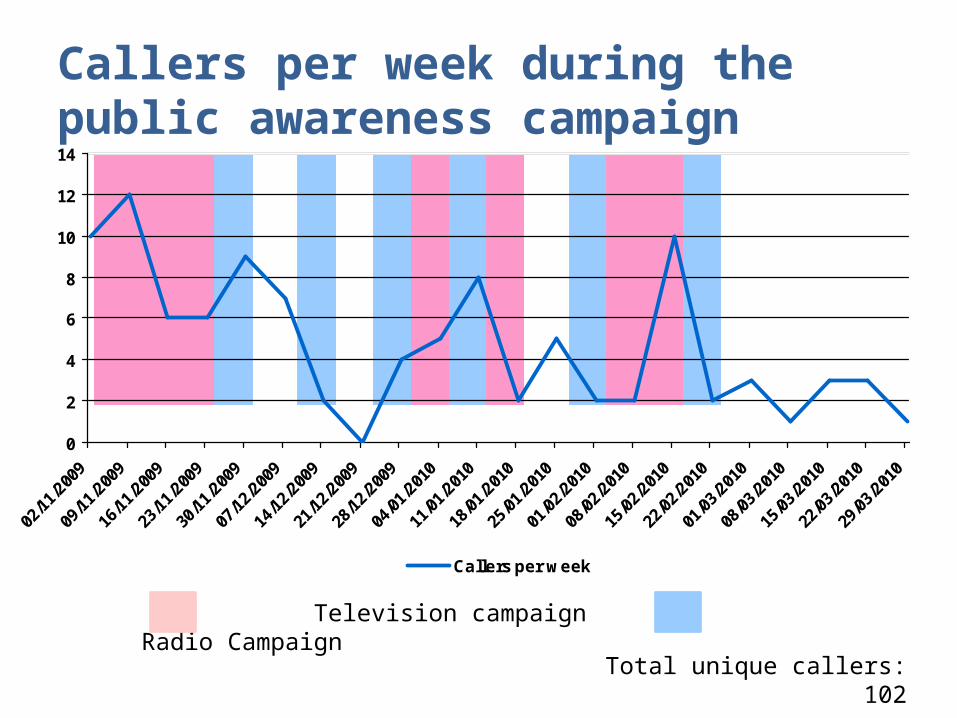
Callers per week
Television campaign Radio Campaign
Total unique callers: 102
Callers per week during the public awareness campaign

Source of awareness of helpline service
Television
RadioPoster/Card
Health Professional
Community/Voluntary Worker
Relative/Friend
OtherNot Specified
0
5
10
15
20
25
30
3529
68
14 1316
8 8
N=102

Age and gender profile of callers
Male Female0
5
10
15
20
25
30
20
2
8
2
18
6
17
7
25
1
8
1 2
0-10 yrs 11-20yrs 21-30yrs 31-40yrs 41-50yrs 51-60yrs61yrs plus
Mean: 37yrs SD: 13.5 N=98
Mean: 36yrs SD: 14.6

Age when sexual abuse started
Pre-school aged
Primary school aged
Post primary school aged
ChildYoung adult (18-25yrs)
AdultBoth child and adult
Not recorded
Perpetrator
0
5
10
15
20
25
30
2
19
13
23
8
24
1
5 4
N=99 all categories exclusive

Relationship of perpetrator to victim
FatherMother
PartnerSibling
Other relative
Neighbour
Family friend
Person with a duty to care
Stranger
Other
0
5
10
15
20
25
11
1 1 1
18
3 36
2 20 1
20
02
03
1 0 1
Child Adult
N=76

Currency of sexual violence
21%
76%
3%
Current Historial Perpetrator

Currency of sexual victimisation
Current Sexual Victimisation
0-10 yrs
11-20yrs
21-30yrs
31-40yrs
41-50yrs
51-60yrs
61yrs plus
01234567
Male Female
Historic Sexual Victimisation
0-10 yrs
11-20yrs
21-30yrs
31-40yrs
41-50yrs
51-60yrs
61yrs plus
02468
101214161820
Male Female

Sexual abuse by partner
Age Current Historical Total
Male Female Male Female
0-10yrs old 0 0 0 0 0
11-20yrs old 0 0 0 0 0
21-30yrs old 0 3 0 2 5
31-40yrs old 1 1 0 1 3
41-50yrs old 1 3 2 3 9
51-60yrs old 0 0 0 4 4
61yrs plus 0 0 0 1 1
Total 2 7 2 11 22

Frequency of abuse
Abuse as a Child Abuse as an Adult
Single Incident
9 8
Multiple Incidents
24 15

Primary location of abuse
Freq of
abuse
Family Home Community Facility
Perpetrators Home if Not Family Home
Public Area Not Recorded
ChildSingleMultipleNR
065
012
100
010
81618
AdultSingle Multiple NR
3147
100
000
000
439
Total 35 4 1 1 58

Support services accessed
GP Mental Health Professional
PoliceSocial Services
NexusWomen's Aid
Substance Misuse Services
LawyerA&E
Other
0102030405060
4843
17 1611 8 4 2 1
6
N=49
Categories not mutually exclusive

Impact of sexual victimisation
Mental health
Suicidality
Deliberate self harm
Physical health
Substance misuse
Sexual relationships
Sexual health
Other
0102030405060708090
100
75
37
90
14 13 9 6
32
N=102
Categories not mutually exclusive

Comparison of calls about sexual violence over time
May 2009 - Oct 2009 Nov 2009 - April 2010 May - July 20100
200400600800
1000120014001600
304
1487
601
Number of Calls to Helpline

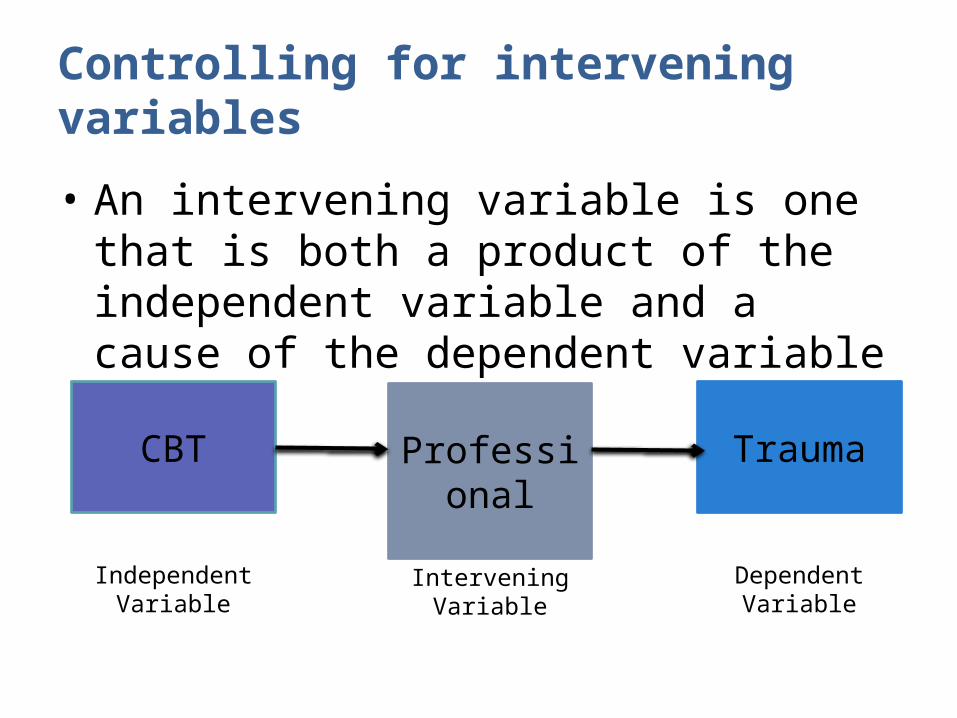
Controlling for intervening variables
• An intervening variable is one that is both a product of the independent variable and a cause of the dependent variable

PTSD and CBT
• Little research evidence to inform interventions related to terrorist-related events
• CBT is widely recognised as an effective method of intervention for PTSD
• Using an RCT design the study sought to test whether CBT might be effective in this situation
• 58 consecutive patients with chronic PTSD (median 5.2 years, range 3 months to 32 years) mostly resulting from multiple traumas linked to terrorism and other civil conflict
• Immediate cognitive therapy compared with a waiting list control condition for 12 weeks followed by treatment.

Post Traumatic Stress Disorder in the Context of Terrorism and Other Civil Conflict in Northern Ireland: A randomised control trial
Duffy, M., Gillespie, K., Clark, D.M. (2007) Post-traumatic stress disorder in the context of terrorism and other civil conflict in Northern Ireland: randomised controlled trial. British Medical Journal 334: 1147-50.

Outcomes
• At 12 weeks after randomisation, immediate cognitive therapy was associated with significantly greater improvement than the waiting list control group on a range of measures relating to PTSD, depression and self rated occupational and social functioning
• However, there were differences in the progress made by patients that could not be explained by their age, pre-existing symptoms or the number of sessions they completed
• It appeared that the therapists themselves had a differential impact on the outcomes, even though they all applied the same model of CBT
Controlling for intervening variables
• An intervening variable is one that is both a product of the independent variable and a cause of the dependent variable
CBT Professional Trauma
Independent Variable
Intervening Variable
Dependent Variable

Individual Net Worth SourceBill Gates $46 billion MicrosoftJeff Bezos $5.1 billion AmazonCraig McCaw $2 billion Telecommunications
The impact of outliers
Number of households, Medina, Seattle, USA n=1206Average net worth 1206 households $44,253,482Average net worth (remove Bill Gates) $6,115,934Average net worth (remove top three) $224,189

The prosecutor’s fallacy
One morning a woman walking in an expensive part of London had her bag snatched – unfortunately it contained a large amount of cash. She and an eyewitness both described the thief as a very tall man (over 2 metres), between 20 and 30 years old, with red hair and a pronounced limp.

Later...
ArrestLater that day an eagle-eyed policeman spotted a man fitting this description with a large plasma-screen TV. He was arrested, but denied being the bag-snatcher. He was unable to provide an alibi. Further investigation revealed that the TV was paid for in cash.
ProsecutionIn court the prosecutor said "This case is quite unusual. Because of the nature of the crime, there is no forensic evidence. The thief was wearing gloves, there were no footprints, etc. We can show his guilt using other methods. To illustrate this we call an expert witness."

The criminologist
The prosecutor produced a criminologist who quoted some statistics from demographic tables: "In London, the probability of having the said characteristics is: Characteristic Probability
Bring male 0.51
Being 2m tall 0.025
Being between 20 - 30yrs old 0.25
Being red headed 0.037
Having a pronounced limp 0.017

“And because these are all independent of each other, we can multiply them together to obtain the probability of one person having all these characteristics: “
0.51 x 0.025 x 0.25 x 0.037 x 0.017 = 0.000002
He announced with a flourish:
"The chance of any random individual sharing all these characteristics is vanishingly small - only 0.000002. The prisoner has them all."
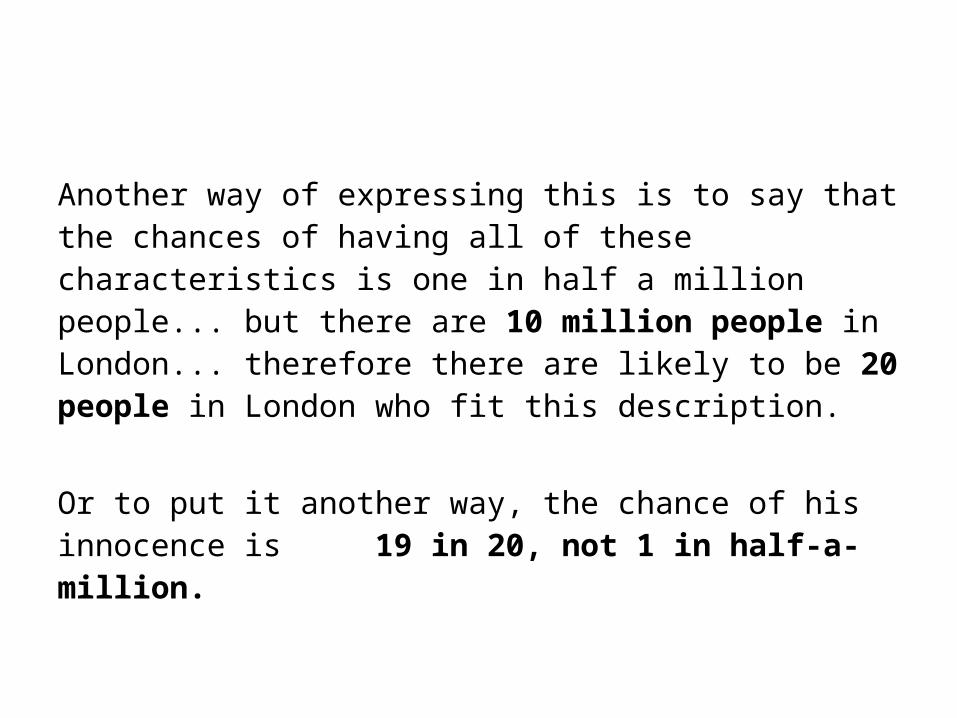
Another way of expressing this is to say that the chances of having all of these characteristics is one in half a million people... but there are 10 million people in London... therefore there are likely to be 20 people in London who fit this description.
Or to put it another way, the chance of his innocence is 19 in 20, not 1 in half-a-million.

What happened here?
The expert witness confused two things: • the probability of an individual matching
the description , and • the probability of an individual who does
match the description being guilty They are not the same!

Numbers and real people
• It is easier to see the fallacy as soon as the probability of 0.000002 is turned into numbers of real people.
• When you bear in mind that the population of possible suspects is 10 million, 1 in half a million easily translates into 20 possible suspects - the accused is only one of this group.
• If we are to be convinced of his guilt with no other evidence, we would want to know that the other 19 had been excluded.
• And that is without even considering people who might have come up to London for the day!

Learning outcomes
Completing this session has enabled you to:
• understand how multiple variables may interact with one another
• appreciate the role of intervening variables
• become aware of how the interpretation of statistics may be affected by outliers and misinterpretations