making relevant comparisons defensible adjustments argue
TRANSCRIPT

Presenting a live 110‐minute teleconference with interactive Q&A
Mastering the Sales Comparison Approach in Property Valuations Approach in Property Valuations Making Relevant Comparisons and Defensible Adjustments to Argue an Effective Case to Assessors
1pm Eastern | 12pm Central | 11am Mountain | 10am Pacific
WEDNESDAY, SEPTEMBER 14, 2011
Today’s faculty features:
1pm Eastern | 12pm Central | 11am Mountain | 10am Pacific
John Cocklereece Jr Director/Attorney Bell Davis & Pitt Winston-Salem N CJohn Cocklereece, Jr., Director/Attorney, Bell Davis & Pitt, Winston Salem, N.C.
Larry Mott, Consultant, Stancil & Co., Irving, Texas.
Robert Slavin, Owner, Assessment Counseling Services, Westlake Village, Calif.
For this program, attendees must listen to the audio over the telephone.
Please refer to the instructions emailed to the registrant for the dial-in information.Attendees can still view the presentation slides online. If you have any questions, pleasecontact Customer Service at1-800-926-7926 ext. 10.

Conference Materials
If you have not printed the conference materials for this program, please complete the following steps:
• Click on the + sign next to “Conference Materials” in the middle of the left-hand column on your screen hand column on your screen.
• Click on the tab labeled “Handouts” that appears, and there you will see a PDF of the slides for today's program.
• Double click on the PDF and a separate page will open. Double click on the PDF and a separate page will open.
• Print the slides by clicking on the printer icon.

Continuing Education Credits FOR LIVE EVENT ONLY
Attendees must listen to the audio over the telephone. Attendees can still view the presentation slides online but there is no online audio for this program.
Please refer to the instructions emailed to the registrant for additional information. If you have any questions, please contact Customer Service at 1-800-926-7926 ext. 10.at 1 800 926 7926 ext. 10.

Tips for Optimal Quality
S d Q litSound Quality
For this program, you must listen via the telephone by dialing 1-866-873-1442 and entering your PIN when prompted. There will be no sound over the web connection.co ect o .
If you dialed in and have any difficulties during the call, press *0 for assistance. You may also send us a chat or e-mail [email protected] immediately so we can address the problem.
Viewing QualityTo maximize your screen, press the F11 key on your keyboard. To exit full screen, press the F11 key againpress the F11 key again.

Mastering the Sales Comparison A h i P t V l ti Approach in Property Valuations Seminar
Sept. 14, 2011
John Cocklereece Jr., Bell Davis & [email protected]
Robert Slavin, Assessment Consulting [email protected]
Larry Mott, Stancil & Co. [email protected]

Today’s Program
Fundamentals Of The Sales Comparison Approach[Robert Slavin]
Slide 7 – Slide 22
Use Of Sales Comparison In Business Personal, Real Property[John Cocklereece]
Slide 23 – Slide 30
Data Collection And Verification Techniques[Larry Mott]
Slide 31 – Slide 51
Case Studies[John Cocklereece and Larry Mott]
Slide 52 – Slide 76

FUNDAMENTALS OF THE Robert Slavin, Assessment Consulting Services
FUNDAMENTALS OF THE SALES COMPARISON APPROACH

Your House As Seen By:Yourself …
8

Your Lender …
9

Your Buyer …
10

Your Appraiser …
11

Your Tax Assessor …
12

What Type Of Appraisal?
• Fee simple, leased fee, liquidation value, etc.
• The jurisdiction dictates the type of appraisal required and its admissibility.
• An appraiser may need to be present.
13

Comparable Sales Analysis
• California Revenue and Taxation Code, Rule 2:
( ) i dditi t th i ib d t th i th R d• (a) in addition to the meaning ascribed to them in the Revenue and Taxation Code, the words “full value,” “full cash value,” “cash value,” “actual value” and “fair market value” mean the price at which a property if exposed for sale in the open market with a reasonable timeproperty, if exposed for sale in the open market with a reasonable time for the seller to find a purchaser, would transfer for cash or its equivalent under prevailing market conditions between parties who have knowledge of the uses to which the property may be put, bothhave knowledge of the uses to which the property may be put, both seeking to maximize their gains and neither being in a position to take advantage of the exigencies of the other.
14

Arm’s Length Transaction
15

Mass Appraisal
16

Mass Appraisal (Cont.)
17

Sales Comparison Approach
Thi h d t i di id l ill f• This approach assumes a prudent individual will pay no more for a property than it would cost to purchase a comparable substitute property.
18
Elements Of A Comparable Sale
19

Elements Of A Comparable Sale (Cont.)
20

Comparison To IncomeAnd Cost Approaches
• The income capitalization approach (often referred to simply as the “income approach”) is used to value commercial and investmentincome approach ) is used to value commercial and investment properties.
I i l i d i t thi h it li• In a commercial income-producing property. this approach capitalizes an income stream into a value indication.
• This can be done using revenue multipliers or capitalization rates applied to a net operating income (NOI).
21

Comparison To Income AndCost Approaches (Cont.)
• The theory is that the value of a property can be estimated by summing the land value and the depreciated value of anysumming the land value and the depreciated value of any improvements.
Th l f th i t i f d t b th bb i ti• The value of the improvements is referred to by the abbreviation RCNLD (reproduction cost new less depreciation or replacement cost new less depreciation).
• In most instances, when the cost approach is involved, the overall methodology is a hybrid of the cost and sales comparison approaches.
22

USE OF SALES COMPARISON John Cocklereece Jr., Bell Davis & Pitt
USE OF SALES COMPARISON APPROACH IN BUSINESS PERSONAL, REAL PROPERTY

Generalizations About Taxation OfB i R l A d P l P tBusiness Real And Personal Property
• Real property consists of land and all improvements thereon.
• Business personal property generally consists of tangible personal property, although in some jurisdictions, some types of intangible property may be taxable.
P t i t d t th t t l l d t t l diff f t t t• Property is taxed at the state level, and property tax law differs from state to state. It is important to know the differences or have knowledgeable counsel to advise one of the differences.
• Although each state’s law contains nuances, there are broad similarities in the way most states tax business real and personal property, as confirmed by an informal survey of the National Association of Property Tax Attorneys
24
(www.napta.com).

How Tax Assessors GenerallyV l B i R l P tValue Business Real Property
• North Carolina’s system of assessment is representative of how most states tax business real property.
• Except for exempt and certain limited categories of real property, business real property is taxed at 100% of its fair market value.
E h t h dl t f l t ithi it b d i• Each county handles assessment of real property within its boundaries. Each county is required to revalue real property at least once every 8 years, although it can do so more frequently. Many jurisdictions revalue on a 4-year cycle.y y
• In many other states, revaluations are done on an annual basis or some other revaluation cycle.
25

How Tax Assessors GenerallyV l B i R l P t (C t )Value Business Real Property (Cont.)
The county’s assessor is required to prepare a “schedule of values” (SOV)• The county’s assessor is required to prepare a “schedule of values” (SOV), which serves as a mass appraisal guide to be used to revalue all real property within his jurisdiction.
• SOVs typically give lip service to the use of all three appraisal methods (i.e., cost, income and sales comparisons), but assessors in North Carolina typically rely on the cost approach in arriving at their assessments. Thus, the sales comparison approach may be little-used in arriving at the original assessed value of business real property.
Th l i h h ld b th i i l d b i• The sales comparison approach should be the principal or secondary basis for the taxpayer’s opinion of value, if he elects to appeal the assessed value of business real property.
26

North Carolina Case Law Re:B i R l P tBusiness Real Property
North Carolina case law follows general appraisal theory in holding that all• North Carolina case law follows general appraisal theory in holding that all approaches to value can be used to determining fair market value, but the most reliable method varies depending on the type of real property being appraised. pp
• For income-producing property, the income approach is the most reliable method, and the sales comparison approach should be used as a secondary substantiating method.
• For owner-occupied properties or those that are otherwise not income-producing, the sales comparison approach is the most reliable method of determining fair market value.
• The cost approach should be relied upon only for newly constructed real• The cost approach should be relied upon only for newly constructed real property or for special-purpose real property where the other approaches are difficult to apply.
27

How Tax Assessors GenerallyV l B i P l P tValue Business Personal Property
There is probably more variation among the various states as to the• There is probably more variation among the various states as to the taxation of business personal property. In fact, certain states elect not to tax such property at all (e.g., Iowa, New Hampshire, and New York)
• In North Carolina, the manner in which business personal property is assessed and taxed might be best described as a “modified cost approach.” Many other states use the same methodology.
• First, the taxpayer lists its business personal property at its original cost. Then, the assessor utilizes trending/depreciation schedules to depreciate th i i l t t d t i th d l I N th C li ththe original cost to determine the assessed value. In North Carolina, those trending/depreciation schedules are developed and published by the Department of Revenue.
28
Challenging A Tax AssessmentOf B i P l P tOf Business Personal Property
• If the assessed value of business personal property is challenged, North Carolina assessors frequently argue that they followed the Department of Revenue’s suggested guidelines and therefore met their burden. Case law is clear, however, that following the Department of Revenue procedure does not necessarily produce fair market value.
• The taxpayer is entitled to prove true value by any means possible. In my experience, the best way to show that the modified cost approach does not produce fair market value is by the use of a sales comparison approach, which obviously requires that a resale market exists for the type of businesswhich obviously requires that a resale market exists for the type of business personal property under appeal.
29

Summary
• Assessors do not typically utilize the sales comparison approach to develop their assessments of either real property or business personal property. H th l i h i it l t l i h ll iHowever, the sales comparison approach is a vital tool in challenging an assessment.
• Where real property is income producing the sales comparison approach• Where real property is income-producing, the sales comparison approach should be used as a secondary method of appraisal used to substantiate the results of the income capitalization approach.
• Where real property is not income-producing, the sales comparison approach should be used as the primary method of appraisal, unless the property is new or highly specialized.
• With respect to business personal property, the sales comparison approach should be used where an adequate resale market exists for such property.
30

R b Sl i A C l i S i
DATA COLLECTION AND
Robert Slavin, Assessment Consulting ServicesLarry Mott, Stancil & Co.
DATA COLLECTION AND VERIFICATION TECHNIQUES

Comparable Sales Approach – Methods
• Guideline publicly traded company method
— Appropriate for a marketable, minority ownership interest, using the premise of value in continued use1
• Guideline merged and acquired company method (transaction method)
Indication of transaction prices of major ownership interest — Indication of transaction prices of major ownership interest, usually controlling ownership interests2
Refinery, chemical plant, pipeline, manufacturing plant
— Provides better comparable market data for real property valuations
1 Pratt Shannon P Robert F Reilly Robert P Schweihs Valuing a Business: The Analysis and Appraisal of Closely 1 Pratt, Shannon P., Robert F. Reilly, Robert P. Schweihs, Valuing a Business: The Analysis and Appraisal of Closely Held Companies, 4th ed., McGraw-Hill, 2000, p. 223.2 Ibid. 259.
32

A il bili Of DAvailability Of Data
D t il bilit b d t f i d t• Data availability based on type of industry
— Transaction activity – minimal or substantial
— Public and private companies
33

Researching Comparable Transactions:Public Companies
P bli i ti i th i d tPublic companies operating in the industry
Emphasis of integrated companies may be in a different business segment of the industry.
34

S Of D P bli C iSources Of Data: Public Companies
W b it f i d t l t d iWeb sites for industry related companies
35

Sources Of Data: Public Companies (Cont.)
Investor relations
• Events and presentationspresentations
• SEC filings
• Industry Industry fundamentals
36
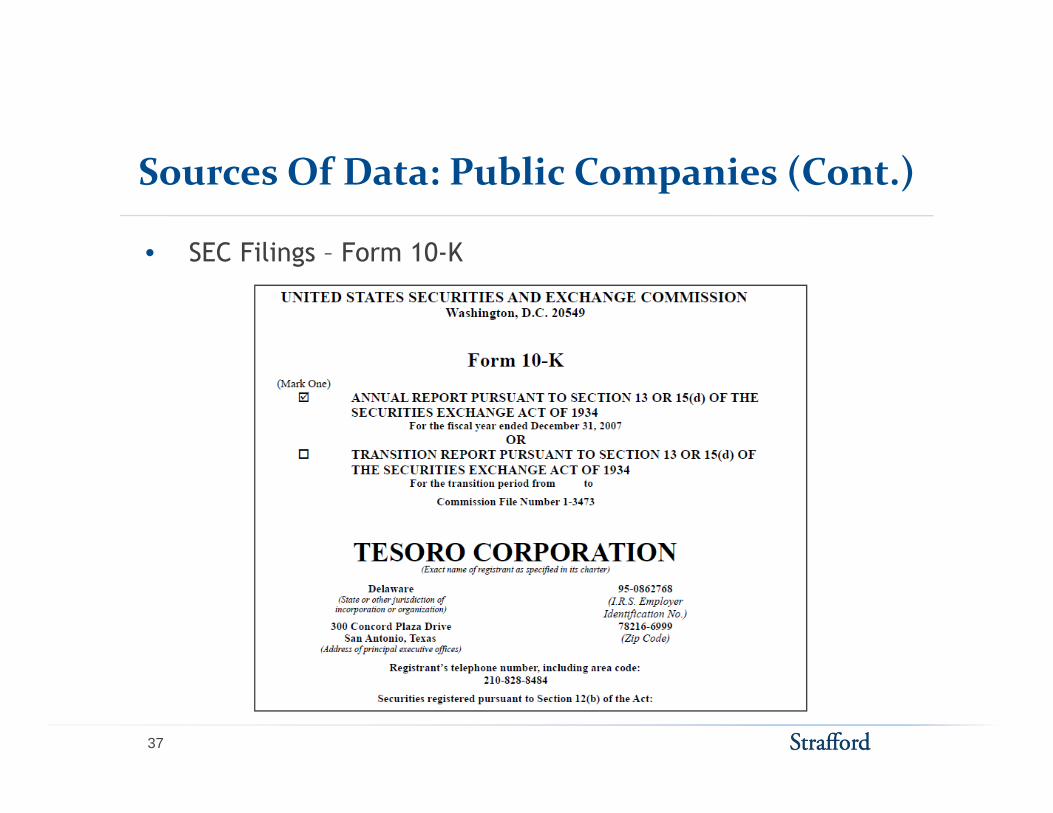
Sources Of Data: Public Companies (Cont.)
• SEC Filings Form 10-K• SEC Filings – Form 10-K
37

Sources Of Data: Public Companies (Cont.)
• Form 10-K acquisition and divestiture section in the notes • Form 10-K acquisition and divestiture section in the notes to the financial statements
38

Sources Of Data: Public Companies (Cont.)
SEC fili F 8 K • SEC filings – Form 8-K
Reports major transactions
o Transaction detailso Transaction details
o Company presentations
39

Sources Of Data: Public Companies (Cont.)
C f ll t i tConference call transcripts
40

Sources Of Data: Public Companies (Cont.)
I t t b ki Investment banking reports
41
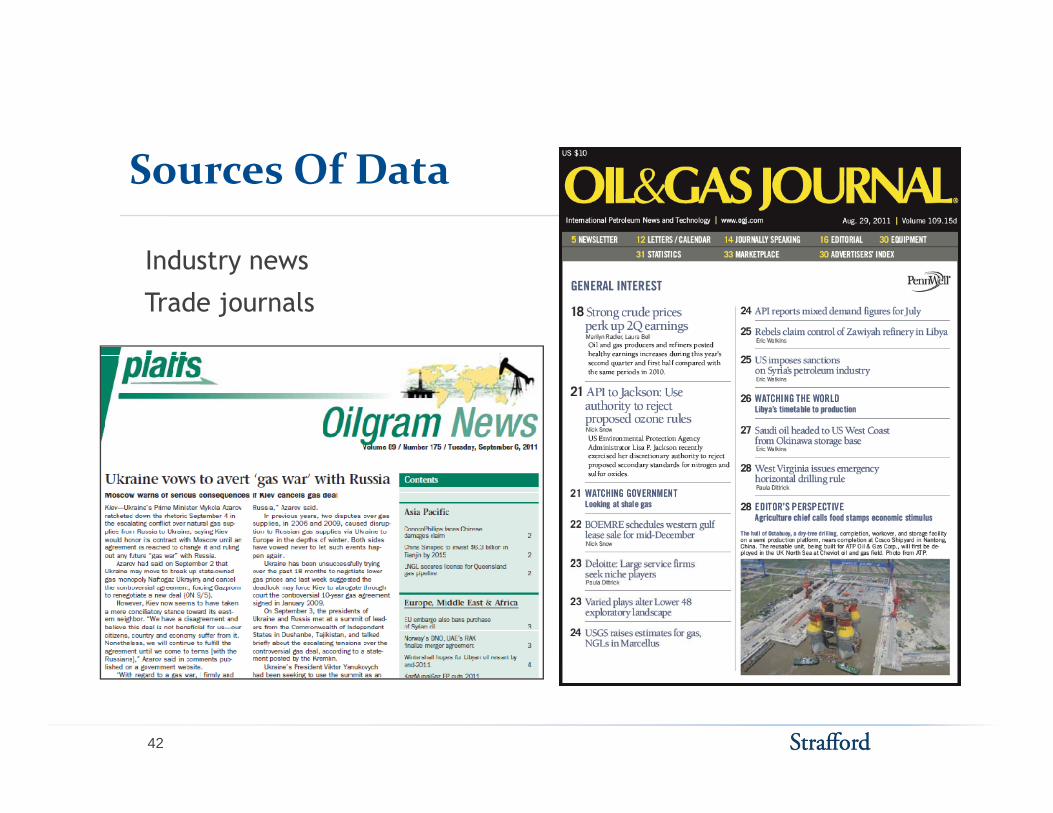
Sources Of Data
I d t Industry news
Trade journals
42

Sources Of Data
Major news sources
43
S Of D (C )Sources Of Data (Cont.)
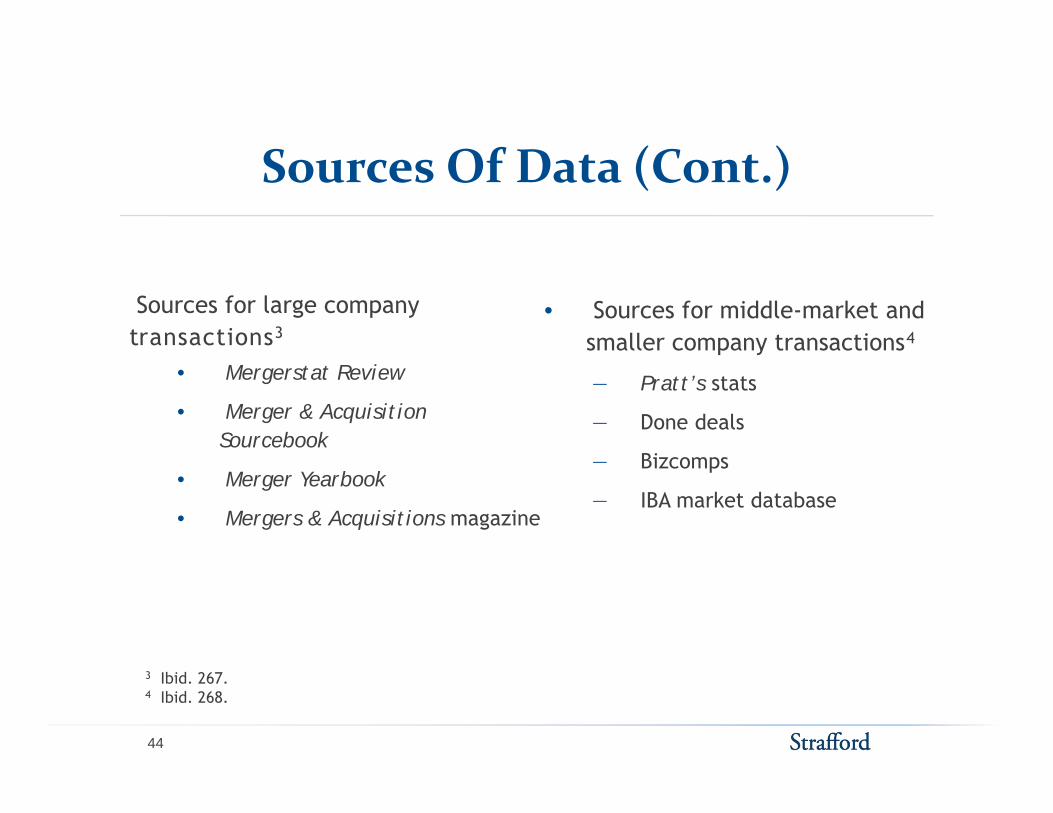
Sources for large company transactions3
• Sources for middle-market and smaller company transactions4
• Mergerstat Review
• Merger & Acquisition Sourcebook
― Pratt’s stats
― Done deals
Bizcomps• Merger Yearbook
• Mergers & Acquisitions magazine
― Bizcomps
― IBA market database
3 Ibid. 267.4 Ibid. 268.
44

I d S d d A d M iIndustry Standards And Metrics
I d t d t di t d t i bilit f tIndustry understanding to determine comparability factors
Percent of replacement cost newDollars-per-complexity barrel
( fi )(refinery)
Transaction EBITDA multiple
Other transaction multiples
U.S. Refining Centers
• Revenues, tangible book value
• Dollars-per-square foot
Geographic considerations Geographic considerations (see map insert)
45

D V ifi iData Verification
Review transaction data to determine applicable price for the comparable asset
46

D V ifi i (C )Data Verification (Cont.)
Purchase priceAssets included
47
D V ifi i (C )Data Verification (Cont.)
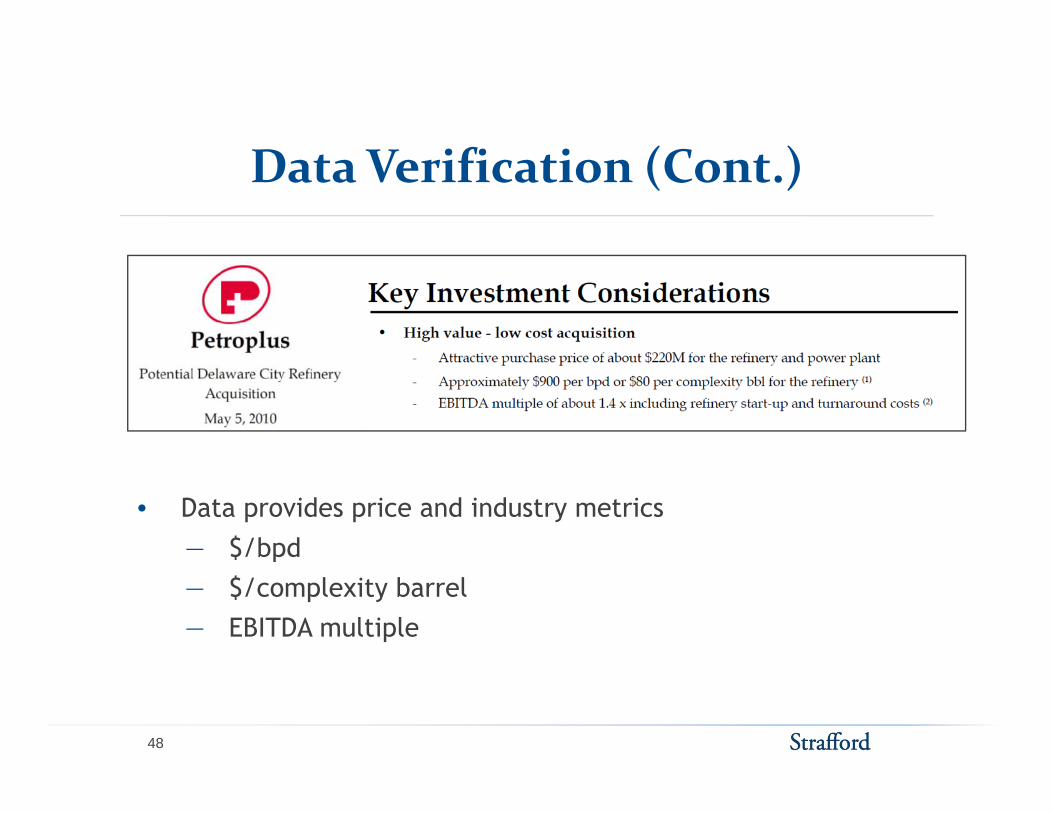
• Data provides price and industry metrics
― $/bpdp― $/complexity barrel― EBITDA multiple
48
Data Verification: Adjustments For OtherjAssets Included In Transaction
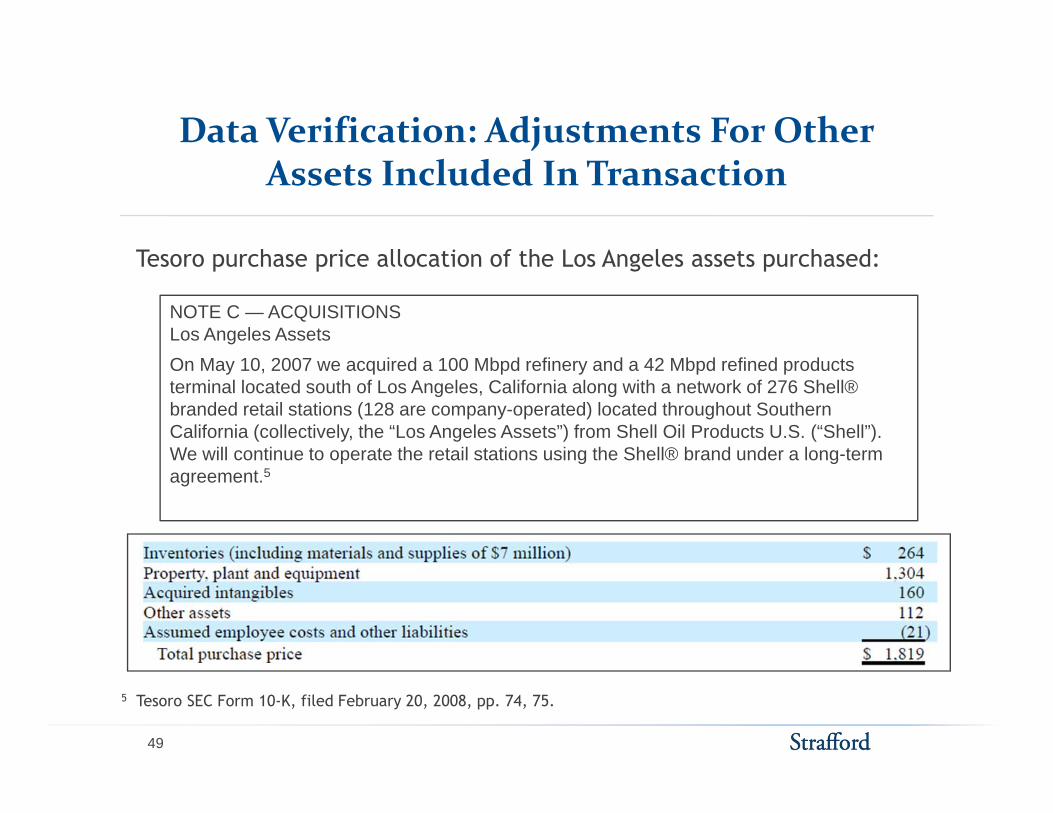
T h i ll ti f th L A l t h dTesoro purchase price allocation of the Los Angeles assets purchased:
NOTE C — ACQUISITIONSLos Angeles AssetsOn May 10, 2007 we acquired a 100 Mbpd refinery and a 42 Mbpd refined products terminal located south of Los Angeles, California along with a network of 276 Shell® branded retail stations (128 are company-operated) located throughout Southern California (collectively, the “Los Angeles Assets”) from Shell Oil Products U.S. (“Shell”). We will continue to operate the retail stations using the Shell® brand under a long-termWe will continue to operate the retail stations using the Shell® brand under a long term agreement.5
5 Tesoro SEC Form 10-K, filed February 20, 2008, pp. 74, 75.
49

Data Verification: Adjustments For OtherjAssets Included In Transaction (Cont.)
Determination of the refinery value (comparable asset value)
50

bl bComparable Transactions Database
Refinery Transactions Database
C l it C t f R l t E iReplacement as a Percent Transaction
C it P i P i C l itRefining Purchase Purchase Per-
Total RefineryTransaction Allocated Dollars- Refinery Price
Buyer
Year 1Transaction 1 100 100 100 10.0 100 1,500 7 2.0Transaction 2 70 150 150 8.0 268 1,000 15 2.5Transaction 3 200 225 175 12.0 73 3,400 5 2.3
(MM$) Cost Multiple(MB/D) (MM$) (MM$) Factor BarrelComplexity Cost of Replacement EarningsCapacity Price Price Complexity
Transaction 3 200 225 175 12.0 73 3,400 5 2.3Transaction 4 75 50 50 10.0 67 1,500 3 2.4Year 2Transaction 5 200 3,000 2,000 15.0 667 6,000 33 2.5Transaction 6 75 600 500 8.0 833 1,000 50 3.0Transaction 7 150 1,000 1,000 8.0 833 2,000 50 2.8Transaction 8 50 150 150 9.0 333 750 20 3.1Transaction 9 75 350 350 5.0 933 750 47 3.5Year 3Transaction 10 150 900 600 10.0 400 2,500 24 2.1Transaction 11 100 275 275 12.0 229 2,000 14 2.3Transaction 12 100 250 250 7.0 357 1,250 20 2.2
NOTE: Transactions are for example only and are not representative of actual transactions.
51

Robert Slavin, Assessment Consulting ServicesJ h C kl J B ll D i & Pi
CASE STUDIES
John Cocklereece Jr., Bell Davis & PittLarry Mott, Stancil & Co.
CASE STUDIES

Business Real Property Case Study 1:Hi k Ch iHickory Chair
• In the Matter of Appeal of the Lane Company – Hickory Chair DivisionIn the Matter of Appeal of the Lane Company Hickory Chair Division
• Furniture manufacturing facility containing approximately 575,000 square feet was situated on approximately 10.5 acres. The original portion of the eet as s tuated o app o ate y 0 5 ac es e o g a po t o o t efacility was built in the 1920s, with multiple additions over the years. The facility was still in use.
• The tax assessor used the income capitalization approach to value the facility at approximately $3.8 million.
• The taxpayer’s appraiser relied solely on the sales comparison approach and valued the facility at approximately $2 million.
Th P t T C i i d t i d th t th f ilit th $2
53
• The Property Tax Commission determined that the facility was worth $2 million, and the North Carolina Court of Appeals agreed.

Business Real Property Case Study 1:Hi k Ch i (C t )Hickory Chair (Cont.)
• The taxing jurisdiction argued that its assessor had correctly applied itsThe taxing jurisdiction argued that its assessor had correctly applied its SOV in arriving at the assessed value. The Court of Appeals held that, although use of the SOV showed an objective process in the valuation procedures as a whole, it did not prove that the valuation of a particular property is correct.
• The taxpayer’s appraiser determined, and the court so held, that use of the income approach to value a property such as this was improper because it did not reflect the motivations of buyers and sellers Further the costdid not reflect the motivations of buyers and sellers. Further, the cost approach was not appropriate because of the difficulty in accurately determine depreciation and obsolescence in a facility of this age.
• Thus, the sales comparison approach was the only appropriate appraisal p pp y pp p ppmethod to value buildings of this character.
54

Business Real Property Case Study 2:P kd lParkdale
• In the Matter of Appeal of Parkdale America
• Two textile manufacturing facilities, one containing approximately 465,197 square feet and situated on approximately 15 acres, and the other
t i i i t l 356 737 f t it t d i t l 9containing approximately 356,737 square feet situated on approximately 9 acres. Both were originally constructed in the early 20th Century with subsequent additions over the years. Both were still in use.
• The tax assessor used the cost approach to value the facilities at $6,776,160 and $3,620,080, respectively.
• The taxpayer’s appraiser relied solely on the sales comparison approach and valued the facilities at $906,000 and $625,000, respectively. None of the taxpayer’s comparable sales were still in use at the time of their sales.
55

Business Real Property Case Study 2:P kd l (C t )Parkdale (Cont.)
• The Property Tax Commission upheld the assessed value. Although not part of the commission’s order, it was clear from the hearing of the matter that the commission did not consider the taxpayer’s comparable sales as relevant because they were not of facilities that were still in use. This decision came despite un-contradicted testimony that facilities like thesedecision came despite un contradicted testimony that facilities like these were at the end of their useful lives and would never be sold as operating facilities. The commission’s decision has been appealed, and the matter was remanded on technical missteps. The substantive issues raised on
l h t t b id dappeal have yet to be considered.
56

Business Real Property Case Study:Ob tiObservations
• Considering Hickory Chair and Parkdale, the sales comparison approach should be used to determine the fair market value of older owner-occupied manufacturing facilities. However, care should be taken to select comparables which are in the same operating state (either operating or not)comparables which are in the same operating state (either operating or not) as the subject property.
57

Business Personal Property Case Study:IBMIBM
• In the Matter of Appeal of IBM Credit Corporation• IBM challenged the taxing jurisdiction’s valuation of 40,779 items of leased
computer equipment.co pute equ p e t• Using the North Carolina Department of Revenue’s guidelines, the tax
assessor assessed the equipment at approximately $144 million. IBM contended that North Carolina statutes mandated that the equipment be valued at fair market value, and that the Department of Revenue schedules as applied to the equipment did not produce such value.
• Before the North Carolina Property Tax Commission, IBM’s evidence included a written appraisal report and the testimony of Robert Zises ofincluded a written appraisal report and the testimony of Robert Zises of NACOMEX U.S.A., who was admitted as an expert in the appraisal of computer equipment.
58

Business Personal Property Case Study:IBM (C t )IBM (Cont.)
• Zises maintained a database of “transactional sales observations” covering a period in excess of 10 years and reflecting “secondary sales (brokerage
l ) f t d t l t d i t ” Utili i thi lsales) of computers and computer related equipment.” Utilizing this sales information, Zises developed depreciation tables that he in turn applied to the original purchase price of the subject equipment to determine that its fair market value was approximately $96 million.pp y $
• The taxing jurisdiction’s expert testified that the Department of Revenue’s depreciation guidelines were not based on actual market sales and purchases.
59
Business Personal Property Case Study:IBM (C t )IBM (Cont.)
• The North Carolina Property Tax Commission initially upheld the assessed value of the equipment. On appeal, the North Carolina Court of Appeals reversed and remanded the matter back to the commission on procedural groundsgrounds.
• On remand, the commission once again upheld the assessed value and IBM appealed again The Court of Appeals reversed and remanded aIBM appealed again. The Court of Appeals reversed and remanded a second time, explaining that the commission failed to explain and justify its upholding of a value determined by the Department of Revenue guidelines despite contradictory evidence based in actual sales.
• On remand for a second time, the commission again upheld the assessed value, and IBM is once again appealing.
60

Business Personal Property Case Study:IBM Ob tiIBM - Observations
• Challenging the typical use of a depreciated original cost methodology requires considerable work and cost. IBM likely spent considerable monies for the NACOMEX report and the testimony of its expert. Litigating the dispute will require at least three trips to the North Carolina Court ofdispute will require at least three trips to the North Carolina Court of Appeals.
• Despite the strength of your comparable sales evidence it may beDespite the strength of your comparable sales evidence, it may be impossible to overcome the taxing jurisdiction’s reliance on the North Carolina Department of Revenue schedules. At the very least, it will require substantial (perhaps overwhelming) evidence that the standard depreciation
h d l d t lt i f i k t lschedules do not result in fair market value.
• On appeal to any state hearing body, there will be substantial resistance to overturning the value indicated by the standard depreciation schedules
61
overturning the value indicated by the standard depreciation schedules.

C S d R fiCase Study: Refinery
Industry understanding to determine comparable sales
Review the universe of transactions and select relevant salesRefinery Transactions Databasey
Buyer
Year 1
Refinery PriceTotal Refinery
Transaction Allocated Dollars-Refining Purchase PurchaseCapacity Price Price Complexity Complexity Cost of Replacement Earnings
Replacement as a Percent TransactionPer-
(MM$) Cost Multiple(MB/D) (MM$) (MM$) Factor Barrel
Transaction 1 100 100 100 10.0 100 1,500 7 2.0Transaction 2 70 150 150 8.0 268 1,000 15 2.5Transaction 3 200 225 175 12.0 73 3,400 5 2.3Transaction 4 75 50 50 10.0 67 1,500 3 2.4Transaction 5 10 15 15 4.0 375 200 8 -- Year 2Transaction 6 200 3,000 2,000 15.0 667 6,000 33 2.5Transaction 7 75 600 500 8.0 833 1,000 50 3.0Transaction 8 150 1 000 1 000 8 0 833 2 000 50 2 8Transaction 8 150 1,000 1,000 8.0 833 2,000 50 2.8Transaction 9 50 150 150 9.0 333 750 20 3.1Transaction 10 75 350 350 5.0 933 750 47 3.5Transaction 11 15 75 75 5.0 1,000 200 38 3.5Year 3Transaction 12 150 900 600 10.0 400 2,500 24 2.1Transaction 13 100 275 275 12.0 229 2,000 14 2.3Transaction 14 100 250 250 7.0 357 1,250 20 2.2
NOTE: Case study assumes no previous sales of the subject property.
62

C S d R fi (C )Case Study: Refinery (Cont.)
Understand adjustments made to total transaction price
Refining industry – adjust for inventory, pipelines, terminals and retail included in transactioneta l cluded t a sact oRefinery Transactions Database
Per- Replacement as a Percent Transaction
Total RefineryTransaction Allocated Dollars- Refinery Price
Refining Purchase Purchase
Buyer
Year 1Transaction 1 100 100 100 10.0 100 1,500 7 2.0Transaction 2 70 150 150 8.0 268 1,000 15 2.5Transaction 3 200 225 175 12.0 73 3,400 5 2.3Transaction 4 75 50 50 10 0 67 1 500 3 2 4
Complexity Cost of Replacement Earnings(MB/D) (MM$) (MM$) Factor Barrel (MM$) Cost Multiple
Capacity Price Price Complexity
Transaction 4 75 50 50 10.0 67 1,500 3 2.4Year 2Transaction 6 200 3,000 2,000 15.0 667 6,000 33 2.5Transaction 7 75 600 500 8.0 833 1,000 50 3.0Transaction 8 150 1,000 1,000 8.0 833 2,000 50 2.8Transaction 9 50 150 150 9.0 333 750 20 3.1Transaction 10 75 350 350 5.0 933 750 47 3.5Year 3Transaction 12 150 900 600 10.0 400 2,500 24 2.1Transaction 13 100 275 275 12.0 229 2,000 14 2.3Transaction 14 100 250 250 7.0 357 1,250 20 2.2
63

C S d R fi (C )Case Study: Refinery (Cont.)
Basis of comparison – indices used in the industry• Sales price as a percent of replacement cost new (RCN)Sales p ce as a pe ce t o eplace e t cost ew ( CN)
• Sales price-per-complexity barrel
• EBITDA multiple
Regression analysis
64

Case Study: RefineryBenchmark Analysis
Compare subject property to most similar transactionsCompare subject property to most similar transactions
• Similar operating capacity, configuration, crude capability and product yield (crude supply and product markets)
Refinery Transactions Database - Benchmark Analysis
Type ofCrude Fuel Oil
Buyer Processed Gasoline Diesel and Other
Products
(MB/D) Factor (MM$)
ReplacementCapacity Complexity CostRefining
Year 1Transaction 1 100 10.0 1,500 Medium 55% 35% 10%Transaction 2 70 8.0 1,000 Light 60% 30% 10%Transaction 3 200 12.0 3,400 Heavy 60% 35% 5%Transaction 4 75 10.0 1,500 Medium 50% 35% 15%Year 2Transaction 6 200 15 0 6 000 Heavy 60% 35% 5%Transaction 6 200 15.0 6,000 Heavy 60% 35% 5%Transaction 7 75 8.0 1,000 Light 60% 30% 10%Transaction 8 150 9.0 2,000 Med/Light 60% 30% 10%Transaction 9 50 7.0 750 Light 60% 30% 10%Transaction 10 75 5.0 750 Light 50% 25% 25%Year 3Transaction 12 150 10.0 2,500 Medium 55% 35% 10%Transaction 13 100 12 0 2 000 Heavy 60% 35% 5%Transaction 13 100 12.0 2,000 Heavy 60% 35% 5%Transaction 14 100 7.0 1,250 Light 45% 35% 20%
Subject Refinery 125 9.0 1,600 Medium 52% 33% 15%
65

Case Study: RefineryBenchmark Analysis (Cont.)
U i il t ti d i d t i di t d l l Use similar transactions and industry indices to develop values for the subject property, based on simplified methods of measuring a refinery’s relative size, capability and income potential
Refinery Transactions Database - Benchmark Analysis
ImpliedVal e of
Complexity Barrel Analysis Replacement Cost AnalysisImpliedVal e of
Refinery Priceas a Percent
RefineryAllocatedP rchase
Dollars-PerRefining Replacement
Buyer
Year 1Transaction 1 15% 100 100 10.0 100 113 1,500 7 107Transaction 4 15% 50 75 10.0 67 75 1,500 3 53Year 2
Value ofSubject
(MM$TransactionWeighting
Value ofSubject
(MM$
as a Percentof Replacement
Cost
PurchasePrice(MM$) (MB/D) Factor (MM$)
Per-Complexity
Barrel
Refining ReplacementCapacity Complexity Cost
Year 2Transaction 8 20% 1,000 150 9.0 741 833 2,000 50 800Year 3Transaction 12 50% 600 150 10.0 400 450 2,500 24 384
Subject Refinery 125 9.0 373 420 1,600 24 376
66
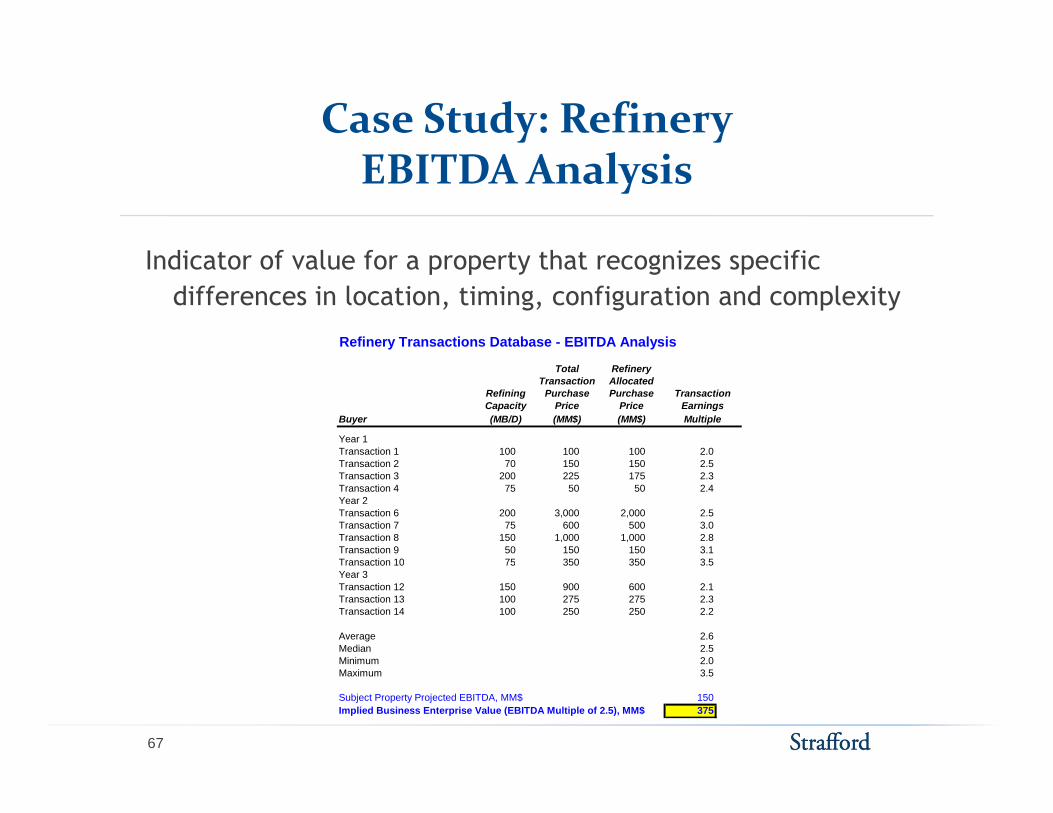
Case Study: RefineryEBITDA Analysis
I di t f l f t th t i ifi Indicator of value for a property that recognizes specific differences in location, timing, configuration and complexity
Refinery Transactions Database - EBITDA Analysis
Buyer
Year 1Transaction 1 100 100 100 2.0
MultipleEarnings
(MB/D) (MM$) (MM$)
TransactionCapacity Price PriceRefining Purchase Purchase
Total RefineryTransaction Allocated
Transaction 2 70 150 150 2.5Transaction 3 200 225 175 2.3Transaction 4 75 50 50 2.4Year 2Transaction 6 200 3,000 2,000 2.5Transaction 7 75 600 500 3.0Transaction 8 150 1,000 1,000 2.8Transaction 9 50 150 150 3.1Transaction 10 75 350 350 3 5Transaction 10 75 350 350 3.5Year 3Transaction 12 150 900 600 2.1Transaction 13 100 275 275 2.3Transaction 14 100 250 250 2.2
Average 2.6Median 2.5Minimum 2.0Minimum 2.0Maximum 3.5
Subject Property Projected EBITDA, MM$ 150Implied Business Enterprise Value (EBITDA Multiple of 2.5), MM$ 375
67

Case Study: RefineryRegression Analysis
Considers refinery sales trendsConsiders refinery sales trends
• Correlation between refinery complexity and sales price
• Correlation between refinery replacement cost and sales price
Hi h R d i di t d bilit t di t l f
Y=2.5693 * Subject Property Complexity Barrels^0.6891
Y=0.805 * Subject Property RCN^0.7942
Higher R-squared indicates a good ability to predict a value for the subject property.
68

Case Study: RefineryConclusion
W i hti f lWeighting of analyses
Remove intangibles from implied value
Comparable Sales Approach Results
Benchmark Analysis Percent of Replacement Cost 25% 376
R fi S l P i P C l it B l 25% 420
Comparable Sales Approach Results
Value(MM$)Weighting
Refinery Sales Price-Per-Complexity Barrel 25% 420
EBITDA Multiple Analysis 50% 375
Regression Analysis Percent of Replacement Cost 0% N/A
Refinery Sales Price-Per-Complexity Barrel 0% N/A Refinery Sales Price Per Complexity Barrel 0% N/A
Subject Property Implied Business Enterprise Value 386
Less: Intangible Assets (33%) 128
Subject Property Tangible Asset Value 259
NOTE: Intangible assets are estimated to be 33% of the implied business enterprise value for this case study only, and are not meant to be representative of actual intangible assets.
69

Case Study: RefineryLessons Learned
For income-producing properties, market participants do look at comparable sales as a check to the income approach value.
Actual transactions keep you in the “real world.”A t i t bl l hArguments against comparable sales approach
• Number of transactions too low• No one single refinery is a comparable, for various
reasons.Need to understand the industry
• How do industry participants look at the industry?H d i fi l k h i d ?• How do investment firms look at the industry?
• What metrics are used by industry participants?
70

C S d C d Oil Pi liCase Study: Crude Oil Pipeline
Industry understanding to determine comparable sales
Review the universe of transactions and select relevant sales
NOTE: Case study assumes no previous sales of the subject property.
71

( )Case Study: Crude Oil Pipeline (Cont.)
C bj t t t t i il t tiCompare subject property to most similar transactions• Crude oil pipelines and crude oil terminals
Consider industry indices for comparable sales analysis• Dollars per mile of pipelineDollars per mile of pipeline• Dollars per diameter inch mile• EBITDA multiple
72

( )Case Study: Crude Oil Pipeline (Cont.)
Pipeline industry indices do not represent benchmarks used in comparing pipeline sales prices.co pa g p pel e sales p ces.
Alternate method - direct comparisons to other pipelines
• Only an indicator of value
Industry standard is EBITDA multipleIndustry standard is EBITDA multiple
73

( )Case Study: Crude Oil Pipeline (Cont.)
EBITDA multiples are relevant in the pipeline industry.
SOURCE: Lehman Brothers MLP Quarterly Monitor, July 24, 2008 (highlighting added)
74

Case Study: Crude Oil PipelineConclusion
EBITDA multiple
Direct comparison for reality check
Conclusion of value - $402 million
NOTE: Intangible assets are estimated to be 33% of the implied business enterprise value for this case study only, and are not meant to be representative of actual intangible assets for a pipeline.
75

Case Study: Crude Oil PipelineLessons Learned
F i li ti k t ti i t d l k t For pipeline properties, market participants do look at comparable sales as a check to the income approach value.
Compare to actual transactions to keep you in the “real world”EBITDA multiple is most usefulEBITDA multiple is most useful.Arguments have been:
• Number of transactions too low• No one pipeline is a comparable for various reasons – size • No one pipeline is a comparable for various reasons – size
of pipe, length, locationNeed to understand the industry
• How do industry participants look at the industry?How do industry participants look at the industry?• How do investment firms look at the industry?• What metrics are used by industry participants?
76